Monitoring, Assessment, Prediction and Meteorological ... · Monitoring, Assessment, Prediction and...
40
Monitoring, Assessment, Prediction and Meteorological service of Agricultural Drought in China Wang Shili China Meteorological Administration January, 2005, Kobe
Transcript of Monitoring, Assessment, Prediction and Meteorological ... · Monitoring, Assessment, Prediction and...

Monitoring, Assessment,Prediction and Meteorological
service of Agricultural Drought in China
Wang Shili China Meteorological Administration
January, 2005, Kobe
ContentCharacteristics of agrometerologicalDroughtMonitoring of DroughtRisk Assessment of Agricultural DroughtPrediction of Agricultural DroughtMeteorological Service for Mitigating Agricultural DroughtConclusions

Drought is one of the most severe meteorological disasters
With characteristic of slow development, long duration, wide strickenarea and severity.
Significant impact on hydrology, agriculture, eco-environment, economy and society

0
10000
20000
30000
40000
50000
60000
70000
1950 1955 1960 1965 1970 1975 1980 1985 1990 1995 2000
Year
Area(Khm2)
Total damaged area Drought area Flooded area
Compared with average in 1950-1990, drought damaged areas increased 33%, flood damaged areas increased 89% in 1990-2000
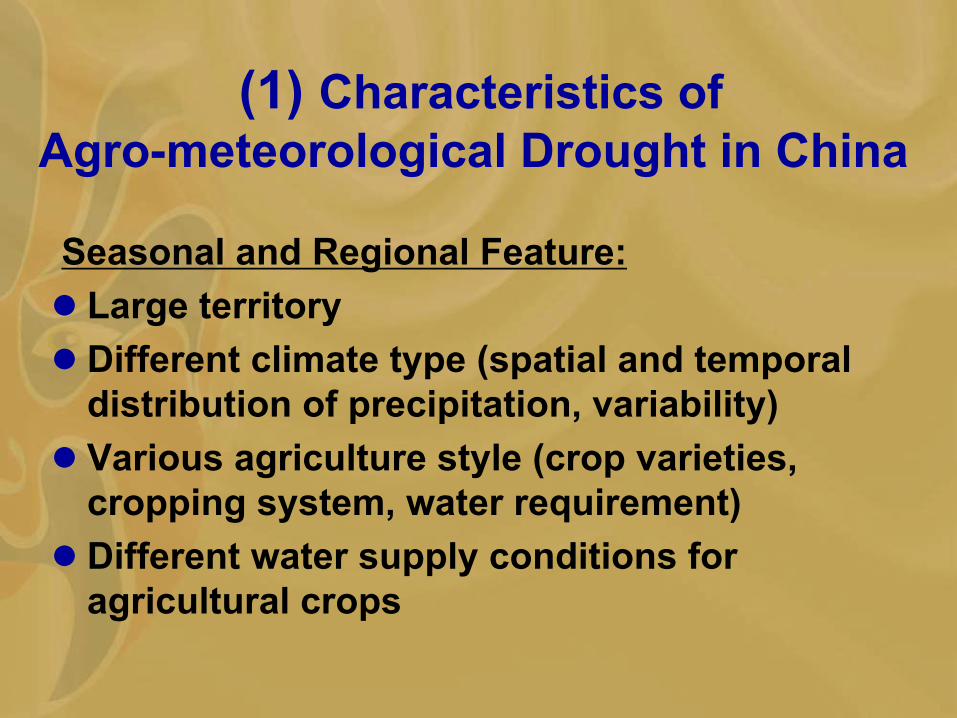
(1) Characteristics of Agro-meteorological Drought in China
Seasonal and Regional Feature:Large territoryDifferent climate type (spatial and temporal distribution of precipitation, variability)Various agriculture style (crop varieties, cropping system, water requirement) Different water supply conditions for agricultural crops

Type of agricultural drought
Spring drought of winter wheat in North China Summer drought of rice in southern ChinaSummer drought of autumn-matured cropsAutumn drought of rice in southern China and drought in sowing period of winter wheat in North China Winter drought of over-winter crops in South China

Drought Distribution in China

Wheat, MAY. 2004 Henan Rice, 17,Oct. 2004 Guangxi
Fruit trees, Oct. 2004 Guangxi Sugar cane, 25,Oct. 2004 Guangxi

(2) Monitoring of Drought
Drought Monitoring based on Station NetworkDrought Monitoring Using Remote Sensing TechniqueExperimental site aiming at agricultural drought

Drought Monitoring based on Station Network
Weather Stations in China
Agro-meteorological Stations
Soil Moisture Observation Stations

Precipitation, abnormality, drought indexfrom Sep. to Oct. 2004
Rainfall Amount in period from Sep. to Oct.
Anomaly Percent (%)
anomaly-50%
Rainfall <100mmSevere drought
Extreme drought

Drought Evolution in October, 2004

Drought Monitoring according to Soil Moisture Observation on 1, October, 2004
Relative soil moisture >90%, 60%-90%, <60%

Drought Monitoring Using Remote Sensing Technique
Drought Monitoring in nationwide using polar orbit satellite data has been put into routine operation in CMA since 2002.
Data source: NOAA-16 polar orbit meteorological satellite
Coverage: nationwide,18 areasPeriod: every 10 days

轻旱
轻旱
First decade in March, 2004
Second decade in July, 2004
Drought grade
Drought grade
Water supply vegetation index
method
Thermal inertia
method

Dynamic monitoring of drought in October, 2004
First 10-days in Oct. 2004
Second10-days in Oct. 2004
Third10-days in Oct. 2004
The drought in southern China developed and expanded quickly since October.

Drought Monitoring and Assessment using GIS
Drought index on 15, September, 2004
Drought grade
Drought acrage(km2) in whole province:
34771 (19%)Climate and agro-meteorologicalCentre, Guangdong

Comprehensive experimental site ofsoil-plant-atmosphere continuum
Rainproof Shed plants root profile system

Risk identification of drought in North ChinaRisk assessment of drought in North ChinaComprehensive risk zoning of drought in North China
(3) Risk Assessment of Agricultural Drought

Risk identification:to determine index of risk and damage losses, fit the probabilities distribution functions of disaster indexes and losses
Quantitative index of wheat drought risk
>30/20~30/20~30
10~20/10~20
<10/<10
Yield reduction (leading/second
ary,%)
>55/35~55/65~100
15~35/30~65
<15/<30
Index②(leading/second
ary,%)
>4021~4015~219~15<9Yield reduction (A,%)
>2114~2112~149~12<9Yield reduction (A,%)
>7040~7030~4020~30<20Index①
Extreme droughtSevere drought
DroughtModerate drought
Light drought
Grade
①water stress percent during growing season of wheat(%);②negative abnormality of precipitation during growing season of wheat(%,leading index) and abnormality during jointing stage (%,secondary index)
Disaster-Inducing factors

Risk index of water stress
Risk assessmentintensity
Index of drought-resisting of winter wheat in North China
∑=mi
i
YY
nk 1
capacity
i
n
ii PDI ∑
=
=1
Water stress and their probability Actual yield and potential productivity

F, P: water stress and their probability; R,D: yield reduction percent and probability; a: time trend coefficients of drought-resisting capacity
)(11
∑=
×+×=n
iiiii DRPf
aM
Comprehensive drought risk zoning of wheat in North China
∑=
×××=n
iii PRCY
kM
1
1
Risk zoning of drought loss of wheat in North China
R:yield reduction percent; P: average yield reduction percent; C: variance coefficient of yield reduction; k: index of disaster-resisting
Comprehensive risk zoning
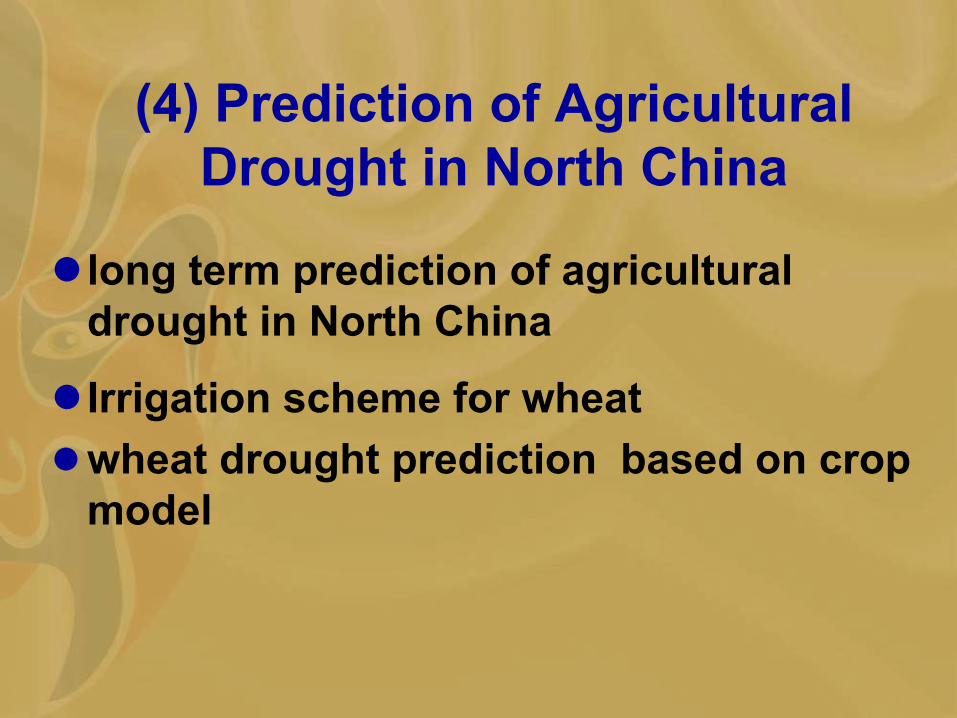
long term prediction of agricultural drought in North China
Irrigation scheme for wheat wheat drought prediction based on crop model
(4) Prediction of Agricultural Drought in North China

Long term prediction of drought in North ChinaDrought intensity index of
North China(P-E)Predictor
Trend change
To calculate component of trend change
To develop model
Inter-annual change
To calculate component of inter-annual change
Previous signal of atmosphere and ocean
To develop model with strong signal
Prediction of drought intensity and duration
To divide
To integrate
-1.5
-1
-0.5
0
0.5
1
1.5
1951 1956 1961 1966 1971 1976 1981 1986 1991 1996 2001
年
小波
系数
0.00E+00
5.00E-01
1.00E+00
1.50E+00
2.00E+00
2.50E+00
3.00E+00
3.50E+00
50.00 10.00 5.56 3.85 2.94 2.38 2.00
周期(年)
谱密
度
Strong signalYES/NO

Previous signal of severe drought in North China
Abnormality in height of the Urals and Lake Baikal
Height SST
Abnormality in Kuroshio, warming Pool and Nino 4

-5-4-3-2-10123
1996 1997 1998 1999 2000 2001 2002year
drought
severity index
Validation in 1996-2002 ( 3 months in advance)
averaged accuracy 71%
Advance by3 months 82 75 87 90 83.5
Advance by3 months 82 75 90 94 85.2
winter spring summer autumn average
Fitted accuracies (%)

Soil water moisture forecastfor stations
Irrigation scheme forecastfor stations
Real-time meteorological data( from daily objective analysis data in
17 levels of T106)
pre-processingto form initial field
Running climate model(To forecast the element field)
Nonlinear cubic interpolation(Interpolating grid forecasts to agrometeo.
stations)
lateral boundary conditions(climate trend or synchronous T106 forecast field)
Input initial parameters related to agrometeo. stations( kc,wp,wk,w0,crop
crop development stage)
Forecast services(Providing soil water moisture forecast and irrigation advice for stations)
Running water balance model
Regional
climate
model
Soil water
forecast model
Irrigation m
anagement
model
Predicted irrigation scheme for wheat in North China

Predicted soil moisture
Observed soil moisture
Normalneededurgently
Irrigation scheme service shown on TVchannel

wheat drought prediction based on crop model
Drought prediction
Crop data Meteo. data Soil data Previous studies
Winter wheat model on site
Soil parameters in areas
Regional wheat model
Prediction output ofRegional climate model
Crop parameter in areas
Meteo. Data in grid
Early warning indexTa/Tm

Predicted 10-days early warning of wheat drought

Comparison
Drought prediction according to real data on DOY 150
Drought prediction according to forecasted weather
elements started on DOY 70,91,121,respectively
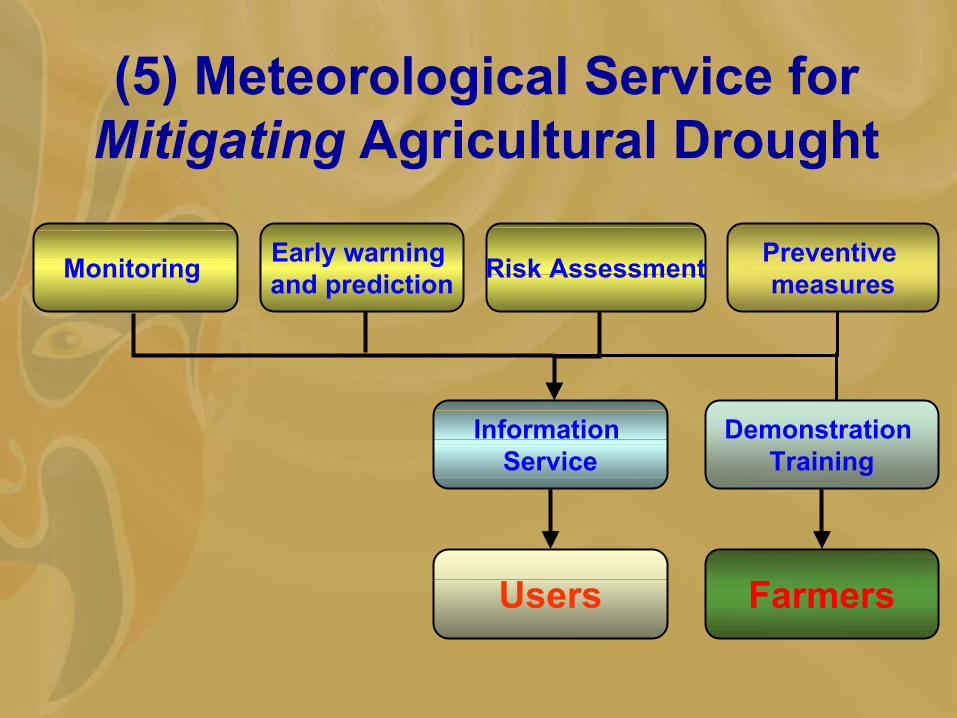
(5) Meteorological Service for Mitigating Agricultural Drought
Early warning and prediction Risk Assessment Preventive
measures
Information Service
Demonstration Training
Users Farmers
Monitoring

Providing agrometeorologicalinformation services

Propose and popularize practical measures in drought-combating
and reducing drought damage lossrationally use of stored soil moisture before sowingdeep ploughstraw mulching optimum irrigationPrepare multi-functional drought preventing reagents

Fig. 3. Diurnal change of latent heat flux in wheat field
0
50
100
150
200
250
300
350
8:00 10:00 12:00 14:00 16:00 18:00Time
Late
nt h
eat f
lux(
W/m
2 )
Non-mulching
Straw mulching
Fig.5. Soil water content in 0-100cm layerunder mulching and non-mulching
treatment in 1998
140150160170180190200210220230240
10.2
11.2
12.1 1.1
1.21
2.11 3.
1
3.21
4.11 5.
1
5.22 Date
Soil
wat
er c
onte
nt(m
m)
未覆盖
覆盖平均
Non-mulching
Mulching
Latent heat flux is reducedWheat yield increased by 18.5%, water use efficiency was improved by 22.1%.
straw mulching

Preparing and spraying multi-functional drought preventing reagents
To restrain evaporation and promote crop growth
To spray on plant leaves during ear sprouting and grain filling with 1:1000

Handbook are published and issued to farmers. The training courses are hold.The drought mitigation techniques are shown on TV station. The comprehensive techniques of drought mitigation of winter wheat has been popularized about 50000 hectare.
Training
Demonstration field
popularize agricultural drought mitigation techniques through demonstration,
education and training

(6) Conclusions1. Important role of drought reduction
It is very important to monitor, assess, predict agricultural drought and provide meteorological service on drought information and techniques for mitigating drought in sustainable development.

2. Further improvement is necessaryStandardization of monitoringData collection and transmissionInformation and products deliver Research on drought index, cause and formation of drought, drought prediction, new technique applicationMore cooperation