Air Quality Prediction in Beijing - Home - Molina Center...
38
Air Quality Prediction in Beijing Liu Weidong Beijing Meteorological Bureau Phone:86-10-88512940 E-mail: [email protected]
Transcript of Air Quality Prediction in Beijing - Home - Molina Center...

Air Quality Prediction in Beijing
Liu WeidongBeijing Meteorological Bureau
Phone:86-10-88512940E-mail: [email protected]

Content
• 1. Introduction• 2. The Prediction Model of Air quality• 3. Application of the Model in Beijing• 4. Conclusion

1. Introduction
• 1.1 Main Pollutant in Beijing• 1.2 Air Quality Measurement Network
in Beijing

1.1 Main Pollutant
• PM10, the most serious pollutant • SO2, (Winter)• No2 (Winter)• O3 (Summer)• CO(Winter)

1.2 Air Quality Measurement Network• There are ten Measurement Sites in Beijing

2. Study and Prediction Model of Air quality
• Atmospheric boundary layer and air quality evaluation;
• Relationship between atmospheric pollution , meteorological condition and urban layout and development.
• Air pollution forecast model and system
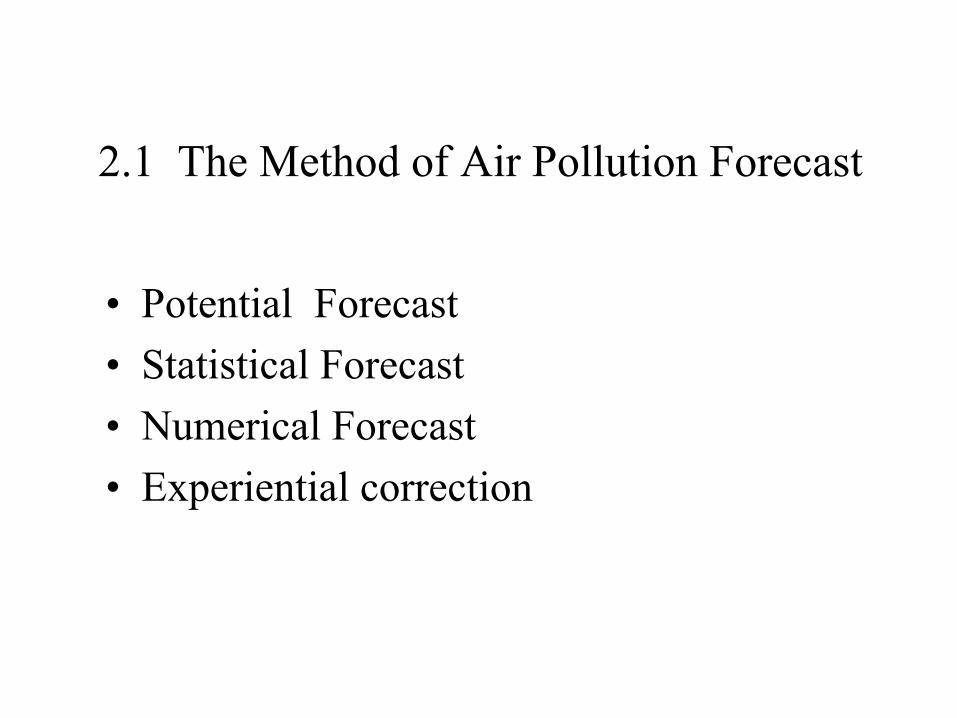
2.1 The Method of Air Pollution Forecast
• Potential Forecast• Statistical Forecast• Numerical Forecast• Experiential correction

Air Pollution Potential Forecast
• Relation between pollution concentration and the surface’s field of pressure
• Analysis of correlation between pollutant and each weather condition.(surface meteorological element,weather phenomenon, upper meteorological element)

The statistical Method • Select the factor for the forecast. (850hPa
Temperature, relative humidity, surface weather situation,surface wind,upper wind,inversion,mixture height etc.)
• Get a statistical equations (stepwise regression analysis) in different seasons.
• Forecast main Pollutant’s Concentration. (SO2、CO、NOX、PM10、O3)

• City Air Pollution Prediction System (CAPPS)• Based on the result of MM5 numerical weather
forecast products.• Rely on the previous real pollutant data.• Output the air pollution index of SO2、NOX、
CO、PM10 for the next day.
Numerical Forecast for Air Pollution
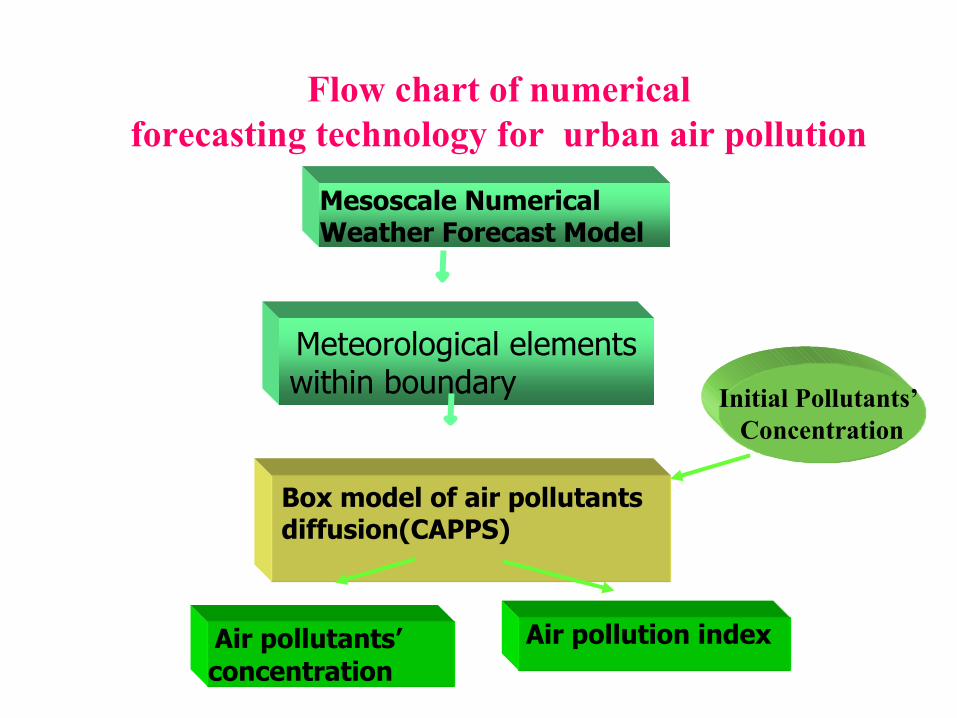
Flow chart of numerical forecasting technology for urban air pollution
Mesoscale Numerical Weather Forecast Model
Meteorological elements within boundary
Box model of air pollutants diffusion(CAPPS)
Initial Pollutants’Concentration
Air pollutants’concentration
Air pollution index

Single city CAPPS system scheme
Pollutant concentation at start time
Numerical Forecast physical field
PPI index API index
Meso-Scale Meteorological Mode System MM5
Air Pollutant Advection
diffusion box mode
Visulization

Multi-cities CAPPS Scheme
City air pollution prediction numerical Model
CAPPS
National meteorological Center meso-scale numerical
prediction product
Pollutant concentration of
47 cities
Prediction Pollution index of
47 cities
Whole country air pollutant potential
Index forecast
Results verified system
Plot and output
Transmitted pollution index prediction in situ at different place
City area coefficient

Introduction of CAPPS• Pollution Index and Potential Prediction (by
CAPPS model)Establishment of Advective Diffusion Equation and Grid-cell Prediction Model
• The advective diffusion equation of airborne pollutants without considering chemical reactions can be written as:
ckvcvcrqcVtc
wdii ∇⋅⋅∇+⋅∇−⋅∇−∑=∇⋅+∂∂ rrrrrr
)()()(δ

After averaging over each cell, ∂∂ τ
τ
τδ τ
ττ
ττ
τ
τ τ τ
( ) ( + )
ct
V c d
q r d cv cv d k c di i d w
+ ⋅ ∇
= − ∇ ⋅ + ∇ ⋅ ⋅ ∇
∫∫∫
∑∫∫∫ ∫∫∫ ∫∫∫
1
1 1 1
v
v v v vv
and using the virtual turbulent transport speed (theconcept from model “PIC”) vt = ( u u c c v v c c w w c ct t t= ′ ′ = ′ ′ = ′ ′/ , / , / ) the prediction equation of mean concentration can beobtained as
τ∂∂
( ) ct
Q c V V v v d stS d w= − + + + ⋅∫∫v v v
where
V c c V V v v d sC tS d w= + + + ⋅∫∫1 ( )
v v v
and
TT
c
eceVQc
δτ
δτ
V
0
V CC
)1(−−
+−=

b
c
g
f
a
dh
ekj+i
i+1 j ki j k
k+1i+1
i+1 k
ji k+1 i+1 j k+1
i j+1 k+1 j+1
j+11
b
c
h
f
1a
d
k+1
d
j+1
kj
i
δx
δy
δz e
g
i+1
The grid-cell in CAPPS model

Source strength Q
v v v vcV vd vw Vt
Initial measurments0
Metorological prediction model
Vv vd
v vwv v
Vt
t = (n
+1)
δT
c-di
stri
buti
on
At
C
By Inversion
c
Fig.4 The flowchart of the grid-cell model
At t he t i me t =nδT
At t he t i me t =( n+1) δT
TT
c
eceVQc
δτ
δτ
V
0
V CC
)1(−−
+−=

Air Pollution Potential Index and Trial Prediction of the Pollution Index
In order to assess the performance of the above calculation, theday to day predictions of daily mean SO2, TPS and NOx concentrations were made at Shanghai on August-December 1998. The number of days with both predicted and measuredconcentrations is 118 and the comparison and correlation analysis were madebetween PSI predictions and the corresponding measurements. PSI index is defined as:
PSI=( ionconcentrat standard national ionconcentratpollutant measuredor predicted
)× 100

0 50 100 150 2000
50
100
150
200
Fig5. The comparis sion o f predition and measr ements of so2 pollution indexPrediction
Mea
surm
ents

0 20 40 60 80 100 12010
20
30
40
50
60
70
80
Mea
surm
ents
Prediction
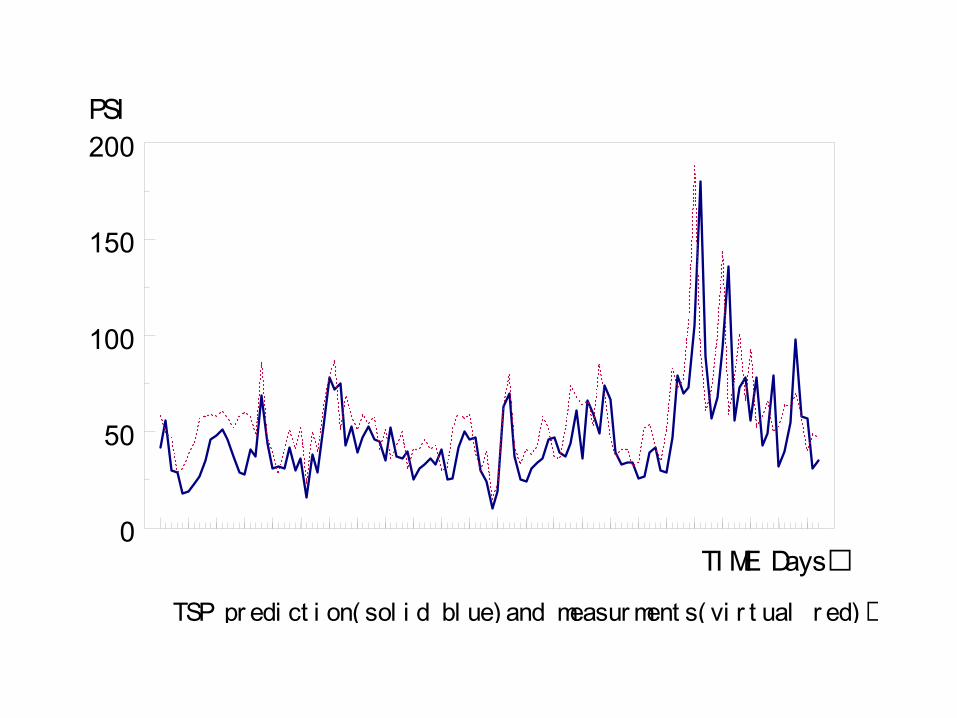
Fig6. The comparission of pred ition and measrements of TSP pol lution index

FI G. 8 SO2 pr edi ct i on( sol i d bl ue) and measur ment s( vi r t ual r ed)
0
20
40
60
80
100
120
t i me days
PSI
0
50
100
150
200
TI ME Days
PSI
FI G. 9 TSP pr edi ct i on( sol i d bl ue) and measur ment s( vi r t ual r ed)

0
100
200
300
400PSI
FIG.8 NOx prediction(solid blue)and measurments(virtual green)
time days
Application of the Model in Beijing
Beijing Institute of meteorology sciences

SO2相关系数:0.89 准确率:94%
0
20
40
60
80
100
120
140
160
180
12-13 12-18 12-23 12-28 1-03 1-08 1-13
实况
预报 SO2相关 y = 1.2672x - 30.17
R2 = 0.7985
0
50
100
150
200
0 50 100 150 200
Fig 9 The correlation coefficient between measurements and prediction of SO2(1999/12/13-2000/1/13)
Winter

NO2相关系数:0.82 准确率:68%
0
20
4060
80
100
120
140160
180
200
12-13 12-18 12-23 12-28 1-03 1-08 1-13
实况
预报
NO2相关 y = 1.2295x - 27.056
R2 = 0.6786
0
50
100
150
200
0 50 100 150
Fig 10 The correlation coefficient between measurements and prediction of NO2(1999/12/13-2000/1/13)
Winter

RSP相关系数:0.90 准确率:65%
0
50
100
150
200
250
12-13 12-18 12-23 12-28 1-03 1-08 1-13
实况
预报
rsp相关 y = 0.8392x - 10.979
R2 = 0.8047
0
50
100
150
200
250
0 50 100 150 200 250
Fig 11 The correlation coefficient between measurements and prediction of PM10 (1999/12/13-2000/1/13)
Winter
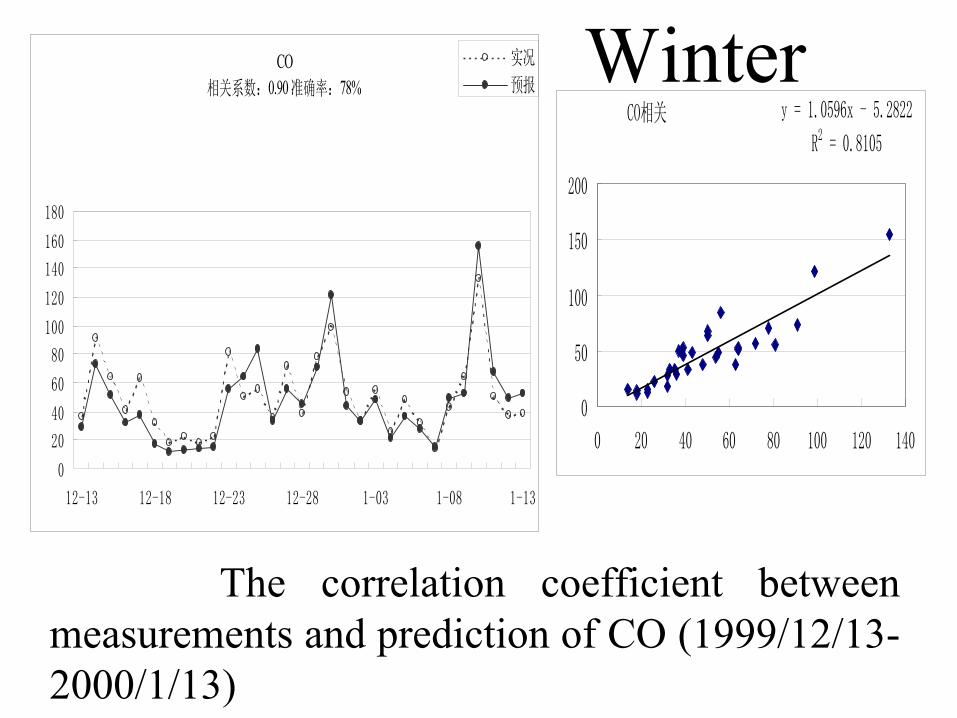
CO相关系数:0.90 准确率:78%
0
20
40
60
80
100
120
140
160
180
12-13 12-18 12-23 12-28 1-03 1-08 1-13
实况
预报
CO相关 y = 1.0596x - 5.2822
R2 = 0.8105
0
50
100
150
200
0 20 40 60 80 100 120 140
Fig 12 The correlation coefficient between measurements and prediction of CO (1999/12/13-2000/1/13)
Winter
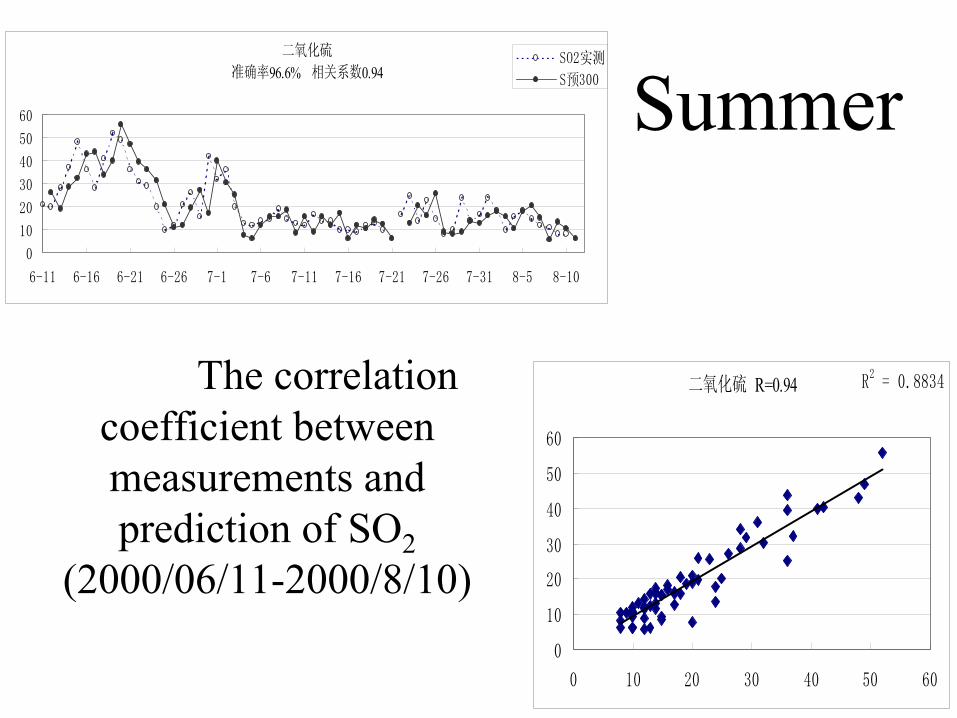
二氧化硫
准确率96.6% 相关系数0.94
0
10
20
30
40
50
60
6-11 6-16 6-21 6-26 7-1 7-6 7-11 7-16 7-21 7-26 7-31 8-5 8-10
SO2实测
S预300
二氧化硫 R=0.94 R2 = 0.8834
0
10
20
30
40
50
60
0 10 20 30 40 50 60
Fig13 The correlation coefficient between measurements and prediction of SO2
(2000/06/11-2000/8/10)
Summer

二氧化氮 准确率75.9% 相关系数0.88
0
20
40
60
80
100
6-11
6-13
6-15
6-17
6-19
6-21
6-23
6-25
6-27
6-29
7-1
7-3
7-5
7-7
7-9
7-11
7-13
7-15
7-17
7-19
7-21
7-23
7-25
7-27
7-29
7-31
8-2
8-4
8-6
8-8
8-10
8-12
NO2实测
N预300
二氧化氮 R=0.88 R2 = 0.7719
0
20
40
60
80
100
0 20 40 60 80 100
Fig14 The correlation coefficient between
measurements and prediction of NO2 (2000/06/11-
2000/8/10)
Summer

可吸入颗粒物
准确率46.6% 相关系数0.96
050
100150200250300350
6-11
6-13
6-15
6-17
6-19
6-21
6-23
6-25
6-27
6-29
7-1
7-3
7-5
7-7
7-9
7-11
7-13
7-15
7-17
7-19
7-21
7-23
7-25
7-27
7-29
7-31
8-2
8-4
8-6
8-8
8-10
8-12
RSP实测
R预300
可吸入颗粒物 R=0.96 R2 = 0.9123
0
50
100
150
200
250
300
0 100 200 300 400
Fig15 The correlation coefficient between
measurements and prediction of PM10 (2000/06/11-
2000/8/10)
Summer

一氧化碳
准确率100% 相关系数0.87
0
10
20
30
40
50
6-11
6-13
6-15
6-17
6-19
6-21
6-23
6-25
6-27
6-29
7-1
7-3
7-5
7-7
7-9
7-11
7-13
7-15
7-17
7-19
7-21
7-23
7-25
7-27
7-29
7-31
8-2
8-4
8-6
8-8
8-10
8-12
O3实测
C预300
一氧化碳 R=0.87 R2 = 0.7636
0
10
20
30
40
50
0 10 20 30 40 50
Fig16 The correlation coefficient between
measurements and prediction of CO (2000/06/11-
2000/8/10)
Summer
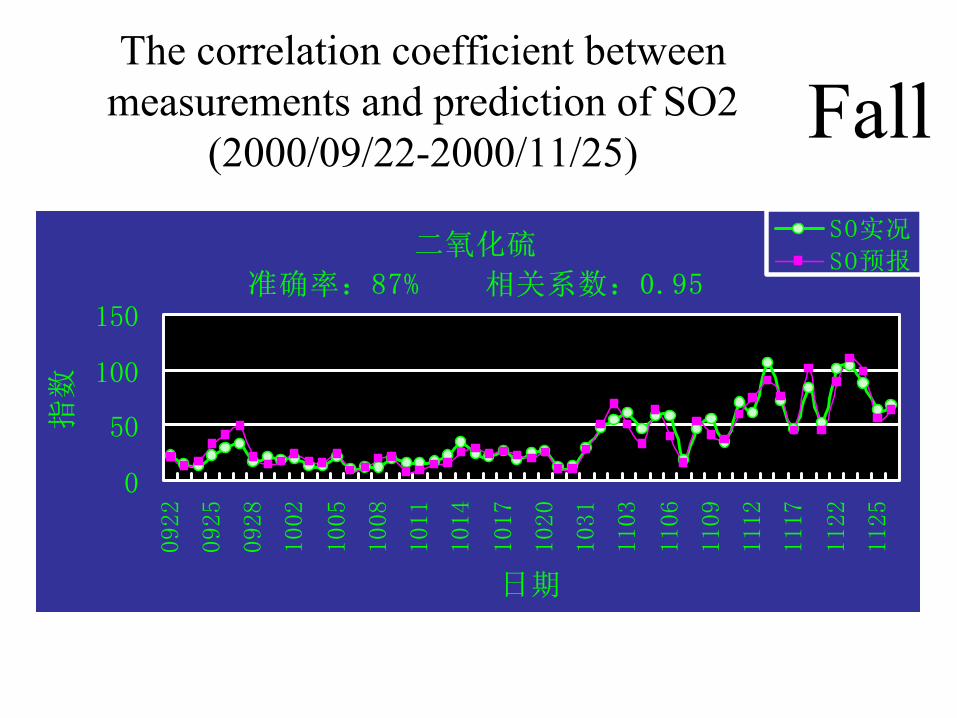
二氧化硫
准确率:87% 相关系数:0.95
0
50
100
150
0922
0925
0928
1002
1005
1008
1011
1014
1017
1020
1031
1103
1106
1109
1112
1117
1122
1125
日期
指数
SO实况
SO预报
本图为北京市气象科学研究所(污染预报业务单位)提供
The correlation coefficient between measurements and prediction of SO2
(2000/09/22-2000/11/25)Fall

The correlation coefficient between measurements and prediction of NO2
(2000/09/22-2000/11/25)
二氧化氮准确率:79% 相关系数:0.76
0
50
100
150
200
0922
0925
0928
1002
1005
1008
1011
1014
1017
1020
1031
1103
1106
1109
1112
1117
1122
1125
日期
指数
NO实况
NO预报
123
本图为北京市气象科学研究所(污染预报业务单位)提供
Fall

The correlation coefficient between measurements and prediction of PM10
(2000/09/22-2000/11/25)
可吸入颗粒物
准确率:72% 相关系数:0.93
0
50
100
150
200
250
300
092209
2509
2810
0210
0510
0810
1110
1410
1710
2010
3111
0311
0611
0911
1211
1711
2211
25
日期
指数
PM10实况
PM10预报
本图为北京市气象科学研究所(污染预报业务单位)提供
Fall

2001/Oct/ The comparison between the prediction by statistic approach and Capps

4. Conclusion remark
For prediction of urban air quality, thesimple grid-cell Prediction Modelwithout the requirement of emissioninventories is helpful.

Study in the future• The mechanism and regulating principle
about air,water and soil pollution in Beijing city and it’s neighbor
• The operational system study of air pollution forecast (especially the heavy air pollution pre-warning system)
• Photochemical model• Need high resolution atmospheric -
chemistry model ---emission inventory