
Moneyball for Higher Education Federal Leaders Can Use Data and Evidence to Improve Student Outcomes...
32
How Federal Leaders Can Use Data and Evidence to Improve Student Outcomes January 2018 By James Kvaal and John Bridgeland Moneyball for Higher Education
-
Upload
phungduong -
Category
Documents
-
view
215 -
download
2
Transcript of Moneyball for Higher Education Federal Leaders Can Use Data and Evidence to Improve Student Outcomes...

How Federal Leaders Can Use Data and Evidence to Improve Student Outcomes
January 2018
By James Kvaal and John Bridgeland
Moneyball for Higher Education

Results for America is helping decision makers at all levels of government harness the power of evidence and data to solve our world’s great challenges. Our mission is to make investing in what works the new normal, so that when government policy makers make decisions, they start by seeking the best evidence and data available, then use what they find to get better results. We accomplish this goal by developing standards of excellence which highlight the government infrastructure necessary to be able to invest in what works, supporting policy makers committed to investing in what works, and enlisting champions committed to investing in what works.

3 MONEYBALL FOR HIGHER EDUCATION
Executive Summary
A uniquely American asset—our colleges and universities—has great untapped potential to increase opportunity and improve the lives of Americans. No country has a system like ours, which includes an unparalleled share of the world’s best research universities, distinguished liberal arts colleges, and community colleges that offer practical and affordable education, training, and second chances to millions.
Colleges and universities can be pillars supporting our efforts both to fuel economic growth and to strengthen our civic ties. Wages barely budged for a typical family between 2000 and 2016, after inflation.1 Only half of American workers born in the 1980s earn more than their parents did a generation ago.2 The changing nature of work and the rapid pace of automation add substantial uncertainty to the job market.3 Finally, America’s current civic picture is also disturbing, with historically low levels of trust in one another and in government institutions, a continued decline in volunteering, voting, and participation in community projects and organizations, and increased tensions in American communities.4
Fortunately, higher education institutions have identified a growing number of potential tools to help students thrive in college and graduate prepared for more demanding careers and civic participation. These range from new approaches to student coaching to innovative ways to teach math through software. Among policy makers, there is growing support for applying evidence of what works to make better use of taxpayer dollars and solve persistent policy problems. For example, the bipartisan Every Student Succeeds Act of 2015 requires states and school districts to better identify and apply what works to improve K-12 schools.
As a Democrat and a Republican, the authors of this report may not agree on everything, but we both believe that the strategic use of data and evidence can help many more college students succeed. Achieving this goal also helps to promote upward mobility, strengthen the middle class, foster shared economic growth, and enable Americans of all backgrounds to understand and cooperate with one another to solve our toughest public challenges.
1. U.S. Census Bureau, Current Population Survey: Annual Social and Economic Supplement, Historical Income Tables: Households (2017), Table H-8: Median Household Income by State. https://www.census.gov/data/tables /time-series/demo/income-poverty/historical-income-households.html.
2. Raj Chetty et al., “The Fading American Dream: Trends in Absolute Income Mobility since 1940,” Science 356, no. 6336 (2017): 398–406. http://science.sciencemag.org/content/sci/356/6336/398.full.pdf.
3. Carl Frey and Michael Osborne, The Future of Employment: How Susceptible Are Jobs to Computerisation? (Oxford University, 2013). http://www.oxfordmartin.ox.ac.uk/downloads/academic/The_Future_of_Employment.pdf.
4. Matthew Atwell, John Bridgeland, and Peter Levine, Civic Deserts: America’s Civic Health Challenge (Washington, DC: National Conference on Citizenship, 2017). https://www.ncoc.org/wp-content/uploads/2017 /10/2017CHIUpdate-FINAL-small.pdf.

4 MONEYBALL FOR HIGHER EDUCATION
In this report, we recommend thirteen specific steps the federal government can take to develop new methods to define and measure such outcomes, use federal resources to build and apply evidence of what works, and help colleges and universities invest in student outcomes.
How to Use Data and Evidence to Help College Students Learn More and Graduate: Thirteen Key Recommendations
1. Improve Measures of Student Success
1.1 Create accurate, nationwide estimates of graduation rates.
1.2 Calculate reliable estimates of employment outcomes.
1.3 Invest in new measures of learning and civic outcomes.
1.4 Research methodologies to identify colleges that successfully serve disadvantaged students.
2. Build and Use Evidence of What Works
2.1 Invest a penny of every federal dollar in evaluation.
2.2 Designate a chief evaluation officer.
2.3 Identify and test innovative approaches.
2.4 Build the capacity of colleges to use data.
2.5 Build and apply evidence to improve TRIO and GEAR UP.
3. Fund Colleges for Student Success
3.1 Fund short-term training programs based on placement in good jobs.
3.2 Fund competency-based education programs based on student learning.
3.3 Reform campus-based student aid to promote better outcomes.
3.4 Prioritize outcomes in future major investments.

5 MONEYBALL FOR HIGHER EDUCATION
How We Got Here and Where We Need to Go
The American story of higher education is full of promise and challenge. Our nation has made great strides since World War II to build a system of higher education that is broadly available and affordable. Our research universities are considered the finest in the world.5 The economic returns from bachelor and professional degrees are at all-time highs, and community college degrees and certificates can also generate substantial economic returns.6 Many institutions serve as economic and cultural anchors of their communities. Colleges are ably serving their higher calling of helping students learn what it means to be human, become contributing members of our communities, and lead more complete lives.
Unfortunately, higher education institutions fail to graduate millions of students: only 55 percent of students enrolling in college for the first time in fall 2010 completed their program within six years.7 College tuition, net of scholarships, has grown faster than inflation for decades.8 And while the economic returns to college are high on average, there is great variation, and many students struggle to repay their loans. American colleges and universities need to build a more reliable path to graduation and their students’ postcollege goals, whether these include a secure job, graduate school, or simply an enriched life.
Progress So Far: Widespread Access to Higher Education
Since our founding, the United States has believed in the power of education as a way for Amer-icans to build better lives for themselves and their families. America’s creed is equality of oppor-tunity, and education is a primary pathway to that opportunity. Since World War II, our nation has accomplished the admirable feat of building a large, accessible, and surprisingly affordable system of higher education that serves more than 20 million students a year.
5. See, e.g., Shanghai Ranking Consultancy, Academic Ranking of World Universities (2017). http://www .shanghairanking.com/ARWU2017.html.
6. Sarah Flood et al., Integrated Public Use Microdata Series, Current Population Survey: Version 5.0 (Minneap-olis: University of Minnesota, 2017), https://doi.org/10.18128/D030.V5.0; Clive Belfield and Thomas Bailey, The Labor Market Returns to Sub-Baccalaureate College: A Review (Center for Analysis of Postsecondary Education and Employment, 2017), https://capseecenter.org/labor-market-returns-sub-baccalaureate-college-review.
7. Doug Shapiro et al., Completing College: A National View of Student Attainment Rates—Fall 2010 Cohort (Herndon, VA: National Student Clearinghouse Research Center, 2016). https://nscresearchcenter.org/wp-content /uploads/SignatureReport12.pdf.
8. College Board, Trends in College Pricing 2017 (Washington, DC, 2017). https://trends.collegeboard.org/sites /default/files/2017-trends-in-college-pricing_1.pdf.

6 MONEYBALL FOR HIGHER EDUCATION
A century and a half ago, higher education was only for the elite, with a total national enrollment of only 52,000 students during the 1869–70 school year—the equivalent of only 1 percent of eighteen- to twenty-four-year-olds (figure 1). Public higher education slowly expanded through legislation such as the Morrill land-grant acts of 1862 and 1890, which provided federal funding to states to set up agricultural and mechanical colleges. Still, access to higher education remained limited, amounting to only 3.4 percent of eighteen- to twenty-four-year-olds by the end of World War I.
The era of mass higher education began after World War II, when the Servicemen’s Readjustment Act of 1944 (also known as the GI Bill) helped large numbers of veterans enroll in college following the war. By 1950, 2.3 million Americans were enrolled in higher education, of whom more than two-thirds were male.
Motivated by the Soviet Union’s early lead in the space race, Congress passed the National Defense Education Act in 1958, followed by the Higher Education Act of 1965. These laws funded education at all levels and created the federal financial aid programs.
Meanwhile, states invested in new systems of public universities and community colleges. The number of degree-granting institutions more than doubled between 1949 and 1999 to over four thousand. In the same period, enrollment in private colleges rose by 250 percent while enrollment in public institutions rose an astonishing 840 percent, pushing the total number of college students to over 15 million by the year 2000.
Figure 1. U.S. Higher Education Enrollment, 1870–2014
Data through 1945–46 include resident degree-credit students enrolled at any time during the academic year; data beginning 1945–46 include all resident and extension students enrolled at the beginning of the fall term; data beginning in 1957 include nondegree students; data beginning in 1960 include Alaska and Hawaii; data beginning in 1995 include only degree-granting institutions.Source: National Center for Education Statistics, 1993, 2016.

7 MONEYBALL FOR HIGHER EDUCATION
Since the turn of the century, enrollment in public higher education institutions has continued to rise, and the emergence of large for-profit universities has driven a parallel surge in enrollment in private institutions. After peaking at 21 million in 2011, college enrollment fell slightly to 20 million students in 2015, including 8.4 million at public four-year universities, 6.2 million at community colleges, 4.1 million at private nonprofit universities, and 1.3 million at private for-profit universities.9
Substantial public investment helps pay for this: the federal government currently spends more than $50 billion a year in higher education scholarships and tax credits for students and makes an addi-tional $100 billion a year in student loans. Overall, federal programs account for over a quarter of the total cost of the higher education system and ensures more equal access to higher education.10
Progress toward greater access is experienced across income levels and racial and ethnic groups, although disparities remain. The share of recent high school completers enrolled in college by race and ethnicity between 2013 and 2015 was 63 percent among blacks, 67 percent among Hispanics, and 70 percent among whites. Asians are an outlier with a college enrollment rate of 87 percent (figure 2).11 Still, students of color remain underrepresented at Ivy League and other top schools.12
Similarly, despite substantial progress, more work remains to close gaps across income levels. The share of recent high school completers enrolled in college grew 38 percentage points between 1975 and 2015 among those from low-income backgrounds, more than twice the growth among those from middle- and high-income backgrounds. As of 2015, 83 percent of recent high school completers from high-income families were enrolled in college, compared to 62 percent and 69 percent for those from middle- and low-income families respectively (figure 3).13
9. U.S. Department of Education, National Center for Education Statistics, Digest of Education Statistics: 2015 (Washington, DC, 2016), Table 105.30: Enrollment in Elementary, Secondary, and Degree-Granting Postsecondary Institutions, by Level and Control of Institution: Selected Years, 1869–70 through Fall 2026, https://nces.ed.gov /programs/digest/d16/tables/dt16_105.30.asp?current=yes; Table 105.50: Number of Educational Institutions, by Level and Control of Institution: Selected Years, 1980–81 through 2014–15, https://nces.ed.gov/programs /digest/d16/tables/dt16_105.50.asp; Table 303.25: Total Fall Enrollment in Degree-Granting Postsecondary Institutions, by Control and Level of Institution: 1970 through 2015, https://nces.ed.gov/programs/digest/d16 /tables/dt16_303.25.asp; U.S. Department of Education, National Center for Education Statistics, 120 Years of American Education: A Statistical Portrait (Washington, DC, 1993), https://nces.ed.gov/pubs93/93442.pdf.
10. Nate Johnson, Understanding Higher Education Finance: Sources of Postsecondary Funding and Implications for Low-Income Students (Tallahassee, FL: Postsecondary Analytics, 2017). http://www.postsecondaryanalytics .com/wp-content/uploads/2017/09/PSA_Higher_Ed_Finance.pdf.
11. U.S. Department of Education, National Center for Education Statistics, Digest of Education Statistics: 2015 (Washington, DC, 2016), Table 302.20: Percentage of Recent High School Completers Enrolled in 2- and 4-Year Colleges, by Race/Ethnicity: 1960 through 2015. https://nces.ed.gov/programs/digest/d16/tables /dt16_302.20.asp.
12. Jeremy Ashkenas, Haeyoun Park, and Adam Pearce, “Even with Affirmative Action, Blacks and Hispanics Are More Underrepresented at Top Colleges than 35 Years Ago,” New York Times, August 24, 2017. https://www .nytimes.com/interactive/2017/08/24/us/affirmative-action.html.
13. U.S. Department of Education, National Center for Education Statistics, Digest of Education Statistics: 2015 (Washington, DC, 2016), Table 302.20: Percentage of Recent High School Completers Enrolled in 2- and 4-Year Colleges, by Income Level: 1975 through 2015. https://nces.ed.gov/programs/digest/d16/tables/dt16_302.30.asp.

8 MONEYBALL FOR HIGHER EDUCATION
Moreover, low-income students often attend very different schools than their high-income peers. For instance, recent research finds that Ivy League colleges enroll more students from the top 1 percent of the income distribution than from the bottom 50 percent and that such income disparities contribute to low mobility rates nationwide.14
Overall, although there is still progress to be made in improving college access and particularly toward closing disparities among groups, the United States has made incredible strides since World War II. Since the time of our great-grandparents, we have built hundreds of colleges and universities and thrown open the doors of higher education, paving the way for millions of Americans to begin building better futures. To keep pace with other countries and a globally competitive economy, the United States needs to accelerate its gains.
The Next Challenge: College Completion and Student Outcomes
Despite increasing enrollment and strong evidence of the value of college, polls show that Americans are increasingly skeptical of the value of college. Only 49 percent of Americans believe that earning a four-year degree will lead to a good job and higher lifetime earnings.15 Skepticism is particularly strong in white working-class voters, among whom a majority— 57 percent—believe that a college degree “would result in more debt and little likelihood of landing a good paying job.”16 While this skepticism has a number of sources, including cultural divides, we have to acknowledge that higher education is not the reliable route to economic mobility it is meant to be.
14. Chetty et al., “The Fading American Dream.” 15. Josh Mitchell and Douglas Belkin, “Americans Losing Faith in College Degree, Polls Find,” Wall Street
Journal, September 7, 2017. https://www.wsj.com/articles/americans-losing-faith-in-college-degrees-poll -finds-1504776601.
16. Pete Brodnitz and Jill Normington, House Majority PAC White Working Class Voter Project (Continued) (Expedition Strategies and Normington Petts, 2017). http://static.politico.com/f2/08 /7cab64cb4a0a91a46b57a9a7784a/house-majority-pac-poll.27.pdf.
Source: National Center for Education Statistics, 2016. Source: National Center for Education Statistics, 2016.
Figure 2. Share of Recent High School Completors Enrolled in College by Race and Ethnicity, 1972–2015
Figure 3. Share of Recent High School Completors Enrolled in College by Income, 1975–2015

9 MONEYBALL FOR HIGHER EDUCATION
First, far too many students start college but fail to graduate. Only 55 percent of students begin-ning in the fall of 2010 earned a degree or certificate within six years at either their original college or after transferring. Even among exclusively full-time students, only 81 percent of those beginning at four-year colleges and 55 percent of those at two-year colleges graduated within six years.17
A variety of obstacles may prevent students from graduating. A study funded by the Bill and Melinda Gates Foundation found that when asked why they left school, the majority of young adults (76 percent) cited the “need to work and make money.” Meanwhile, 54 percent reported needing a break from school, 52 percent claimed they could not afford the tuition and fees, 45 percent said they found classes boring, 41 percent cited not having enough time for their family, 35 percent claimed it was not worth the cost, and 34 percent said some classes were too difficult, among other reasons.18 This is consistent with research that finds graduation rates are correlated with factors that include socioeconomic background, financial aid, institutional selectivity, and high school rigor and grades.19
Second, even some college graduates experience economic hardship. For instance, among work-ers age thirty-five to forty-four, 10 percent of those with a bachelor’s degree earn $20,000 or less (figure 4).20 Meanwhile, the typical worker with a science, technology, engineering, or math (STEM) degree earns $71,000 a year, over 1.5 times the typical worker with an arts, liberal arts, or humanities degree (figure 5).21 Such patterns extend to postcollege outcomes more broad-ly—for instance, a 2017 Gallup and Strada Education Network survey found that, overall, STEM graduates are less likely than other graduates to report regretting their college decisions.22
17. Shapiro et al., Completing College.18. Public Agenda, With Their Whole Lives Ahead of Them: Myths and Realities about Why So Many Students
Fail to Finish College (2011). https://www.publicagenda.org/pages/with-their-whole-lives-ahead-of-them-reality-1. 19. William Bowen, Matthew Chingos, and Michael McPherson, Crossing the Finish Line: Completing College at
America’s Public Universities (Princeton, NJ: Princeton University Press, 2009).20. Flood et al., Integrated Public Use Microdata Series.21. Steven Ruggles et al., Integrated Public Use Microdata Series: Version 7.0 (Minneapolis: University of Min-
nesota, 2017). https://doi.org/10.18128/D010.V7.0. 22. Gallup-Strada Education Network, On Second Thought: U.S. Adults Reflect on Their Education Decisions
(2017). http://stradaeducation.gallup.com/reports/208535/gallup-strada-education-ecp-inaugural-report-2017 .aspx#aspnetForm.
Source: Current Population Survey, Annual Social and Economic Supplement, 2017. Source: U.S. Census Bureau, American Community Survey, 2015.
Figure 4. Variation in Earnings of Workers Age 35–44 by Educational Attainment, 2017
Figure 5. Earnings by College Major Subgroup among Workers, 2015

10 MONEYBALL FOR HIGHER EDUCATION
Finally, the growth in student debt has combined with low graduation rates and uncertain career outcomes to disastrous effect for students. To be clear, college remains an excellent investment for most students, student debt will not lead to an economy-wide collapse similar to the housing bubble, and relatively few students borrow six figures of debt. Four-year college graduates who borrowed owe an average of $30,100 but will typically earn $500,000 more over the course of their career in net present value.23
Nonetheless, there is a student loan crisis: 1.1 million Americans defaulted on student loans in 2016.24 The typical student who began college during the 2003–2004 school year still owed 78 percent of the amount borrowed twelve years later, and the typical student who received a Pell Grant owed more than 90 percent.25 Nearly half of African American borrowers from this cohort defaulted.26
Economists Adam Looney and Constantine Yannelis conclude that the increased defaults are concentrated among students who borrowed to attend colleges with low completion rates or poor employment outcomes.27 As a result, students with smaller loans are more likely to default.28 Students attending public and nonprofit four-year colleges and universities often borrow more but also tend to be more likely to graduate, find higher-earning jobs, and repay their loans.29
Young people today are told that college is the smartest choice for them—but hundreds of thousands attempt college only to end up without a degree or a job and burdened with student debt. As a result, the goal of college affordability is increasingly intertwined with student out-comes. Students’ ability to repay their loans depends not only on the amount they borrow to cover the expenses of college but also largely on whether they graduate and find jobs. The next challenge facing higher education is to help students both enroll in college and graduate to help reach their goals.
23. Institute for College Access and Success, Student Debt and the Class of 2016 (2017), https://ticas.org /sites/default/files/pub_files/classof2015.pdf; Council of Economic Advisers, Investing in Higher Education: Bene-fits, Challenges, and the State of Student Debt (2016), https://obamawhitehouse.archives.gov/sites/default/files /page/files/20160718_cea_student_debt.pdf.
24. Consumer Federation of America, New Data: More Than 1.1 Million Federal Student Loan Defaults in 2016 (2017). http://consumerfed.org/press_release/new-data-1-1-million-federal-student-loan-defaults-2016/.
25. U.S. Department of Education, National Center for Education Statistics (2017). https://nces.ed.gov /pubs2018/2018410.pdf
26. Ben Miller, New Federal Data Show a Student Loan Crisis for African American Borrowers (Center for American Progress, 2017). https://www.americanprogress.org/issues/education-postsecondary/news/2017/10 /16/440711/new-federal-data-show-student-loan-crisis-african-american-borrowers/.
27. Adam Looney and Constantine Yannelis, A Crisis in Student Loans? How Changes in the Characteristics of Borrowers and in the Institutions They Attended Contributed to Rising Loan Defaults (Brookings Institution, 2015. https://www.brookings.edu/wp-content/uploads/2015/09/LooneyTextFall15BPEA.pdf.
28. Council of Economic Advisers, Investing in Higher Education.29. Looney and Yannelis, A Crisis in Student Loans?

11 MONEYBALL FOR HIGHER EDUCATION
Better Results Are Possible
The picture is not grim—far from it. Evidence exists that shows colleges can achieve higher student retention and graduation rates, sometimes at little cost. In some cases, there are evidence-based practices that both improve student outcomes and either reduce college costs or increase revenues.
For instance, adaptive learning software developed by Carnegie Mellon University has been shown to help statistics students learn the same materials in one-quarter less time, at lower ongoing costs.30 The City University of New York launched a pilot project, Accelerated Study in Associate Programs (ASAP), that nearly doubled community college graduations through a comprehensive set of reforms which included developmental education, financial aid, academic pathways, and student advising.31 While ASAP is more expensive per student, it is actually less expensive per graduate. Other examples of evidence-supported, cost-effective approaches to improving student outcomes are listed in table 1.
If we are committed to identifying what works and utilizing those tools, we can help many more students graduate, even within constrained budgets. Ultimately, efforts to help students reach their goals will succeed or fail on college campuses. The federal government, however, can do more—much more—to help colleges identify and sustain these needed reforms.
The following thirteen federal policy recommendations leverage the power of data and evidence to help improve student outcomes. Each represents an area of opportunity where the federal government can help colleges apply tools like those described in table 1. Together, these steps can improve the effectiveness of the more than $100 billion the federal government spends on student aid, tuition assistance, and research at colleges and universities and the additional $100 billion in new student loans each year. We group the recommendations into three broader goals: improving measures of success, building and applying evidence of success, and funding colleges for success.
STEP 1. IMPROVE MEASURES OF STUDENT SUCCESS
In elementary and secondary education, schools are required to test their students in reading, math, and science to ensure that every child is educated in these essential subjects. In post - secondary education, however, there can be no similar, universally applicable set of mea sures for success. The American higher education system encompasses a tremendously diverse range of colleges and educational programs, including comprehensive universities, liberal arts colleges, community colleges, trade schools, historically black colleges and universities, Hispanic-serving institutions, tribal colleges and universities, religious colleges, arts schools, and many more.
30. William Bowen et al., Interactive Learning Online at Public Universities: Evidence from Randomized Trials (Ithaka S+R, 2012). http://www.sr.ithaka.org/wp-content/uploads/2015/08/sr-ithaka-interactive-learning -online-at-public-universities.pdf.
31. Susan Scrivener et al., Doubling Graduation Rates: Three-Year Effects of CUNY’s Accelerated Study in Associate Programs (ASAP) for Developmental Education Students (MDRC, 2015). http://www.mdrc.org/project /evaluation-accelerated-study-associate-programs-asap-developmental-education-students#overview.

12 MONEYBALL FOR HIGHER EDUCATION
TABLE 1: Evidence-Based Approaches to Improve Student OutcomesIntervention Impact on Student Outcomes Impact on Costs
ASAP: Combines advising, tutoring, block schedules, and tuition waivers, as well as other financial assistance, for students needing developmental education.a
Nearly doubled degree attainment from 22 to 40 percent.
Requires substantial increased investment per student, but reduces cost per graduate by 11 percent.
InsideTrack: Provides individualized coaching to college students.b
Increased graduation rates by 4 percentage points.
At $500 per student per semester, relatively cost-effective.
Text messages: Texts FAFSA information, refiling reminders, and resources to first-year college students.c
Increased retention through sophomore year by almost 14 percentage points among community college students.
Costs only $5 per student.
California Acceleration Project: Trains and supports faculty to implement accelerated remedial English and math pathways.d
Increased passage of transfer-level English by 1.5 to 2.3 times and transfer-level math by 4.5 times.
No ongoing costs after initial faculty training.
Carnegie Mellon University Open Learning Initiative: Adaptive learning software in statistics that assesses and responds to learners’ needs.e
Same learning outcomes in one-quarter less time.
Potential for significant savings over time.
Carnegie Foundation Math Pathways: Redesigned courses in developmental statistics and math.f
Respectively tripled and doubled the share of students passing statistics and developmental math, in less time.
Increases institutional revenue by increasing retention rates, while reducing cost per graduate.g
Social Belonging: Diverse older students share their stories with new students.h
Cut racial disparities in GPA in half. Very low costs.
a Scrivener et al., Doubling Graduation Rates.b Eric Bettinger and Rachel Baker, The Effects of Student Coaching: An Evaluation of a Randomized Experiment in Student Advising (Stanford Center for Education Policy Analysis, 2014). http://cepa.stanford.edu/content/effects-student-coaching -evaluation-randomized-experiment-student-advising. c Benjamin Castleman and Lindsay Page, “Freshman Year Financial Aid Nudges: An Experiment to Increase FAFSA Renewal and College Persistence,” Journal of Human Resources 51, no. 2 (2016): 389–415. http://jhr.uwpress.org/content/51/2/389 .abstract. d Craig Hayward and Terrence Willett, Acceleration Effects of Curricular Redesign in the California Acceleration Project (Berkeley, CA: Research and Planning Group for California Community Colleges, 2014). http://cap.3csn.org/files/2014/04/RP -Evaluation-CAP.pdf. e Bowen et al., Interactive Learning Online at Public Universities.f Hai Hoang et al., Carnegie Math Pathways 2015–2016 Impact Report: A Five-Year Review (Stanford, CA: Carnegie Foundation for the Advancement of Teaching, 2017). https://www.carnegiefoundation.org/wp-content/uploads/2017/02/Carnegie_Pathways _IMP_Mar2017.pdf. g Rob Johnstone, Fiscal Considerations of Statway and Quantway: We Should Be Doing This Anyway, But Here’s How It May Help the Bottom Line (Stanford, CA: Carnegie Foundation for the Advancement of Teaching, National Center for Inquiry and Improve-ment, 2013). http://ncii-improve.com/wp-content/uploads/2017/06/NCII-Carnegie_SW-QW_Fiscal_Considerations _110713-Rob-NCII.pdf. h Gregory Walton and Geoffrey Cohen, “A Brief Social-Belonging Intervention Improves Academic and Health Outcomes of Minori-ty Students,” Science 331, no. 6023 (2011): 1447–51. http://www.sciencemag.org/content/331/6023/1447.full.

13 MONEYBALL FOR HIGHER EDUCATION
Students’ goals for postsecondary education are, if anything, even more diverse. A 2016 survey of incoming freshmen at four-year colleges conducted by UCLA found that the ability to get a better job was a very important reason to attend college for 84 percent of students, but 83 percent cited learning more about things that interested them, 76 percent wanted to gain a general education and appreciation of ideas, 61 percent were preparing for graduate school, and 51 percent sought to become a more cultured person, among other reasons.32
Despite this great diversity, there is general agreement on many goals for students. The vast majority of students hope to earn a degree or certificate. Occupational programs should help their graduates find jobs. Some disciplines may be able to agree on the core essential concepts their students should learn. In other areas, defining and measuring student outcomes may be more difficult. Greater work is needed to define and measure academic learning, students’ growth into empathetic and civically engaged citizens, and colleges’ contributions to stronger, more widely shared economic growth.
In order to achieve better outcomes, we need to undertake an effort to define and measure those outcomes. What matters generally gets measured and what gets measured generally gets more fo-cus. Without goals, colleges have no clear vision for what they are expected to accomplish, no way to measure progress, and no way to distinguish between steps that promote efficiency and those that merely cut costs. Students are less able to find programs in line with their personal goals. In the absence of information, policy makers have no way to assess the effectiveness of government programs. Without common measurements, colleges struggle to learn from each other. By begin-ning to develop data and make it available—even if imperfect—the federal government can invest in improving measurements to help colleges improve.
Recommendation 1.1. Create Accurate, Nationwide Estimates of Graduation Rates
Congress should authorize the U.S. Department of Education (ED) to collect the data it needs to calculate better graduation rates, at lower administrative costs to colleges and subject to strict privacy protections. ED should establish on-time two- and four-year graduation rates for associate and bachelor’s degrees, respectively, as the primary measurement of college graduation, while continuing to calculate the currently used rate of three and six years, respectively.
Currently, there are several different sources for graduation rate data, each with significant shortcomings. Colleges participating in student aid programs are required to report their own graduation rates to ED using the Integrated Postsecondary Education Data System (IPEDS).33
In fall 2017, ED published graduation rates for part-time and transfer students for the first time.34 ED should add this information to the College Scorecard. But because colleges have no
32. Kevin Eagan et al., The American Freshman: National Norms Fall 2016 (Los Angeles: Higher Education Research Institute, UCLA, 2017). https://www.heri.ucla.edu/monographs/TheAmericanFreshman2016.pdf.
33. See U.S. Department of Education, National Center for Education Statistics, https://nces.ed.gov/ipeds /Home/AboutIPEDS.
34. Gigi Jones, “Expanding Student Success Rates to Reflect Today’s College Students,” NCES Blog, October 10, 2017. https://ies.ed.gov/blogs/nces/post/expanding-student-success-rates-to-reflect-today-s-college-students. For the College Scorecard, see https://collegescorecard.ed.gov/.
14 MONEYBALL FOR HIGHER EDUCATION
way to determine whether departing students enroll elsewhere, this approach cannot distinguish between students who transfer and students who drop out. It does not produce individualized data that can be matched with other sources, such as wage records. Most importantly, it is slow to change: it took years to obtain graduation rates for part-time and transfer students, and graduation rates by program are likely infeasible due to the reporting burdens on colleges.
Colleges must also report information on financial aid recipients to the National Student Loan Data System (NSLDS), including student-anticipated completion dates.35 In fall 2014, ED began to collect program-level information in the NSLDS, data that will be increasingly useful over time as more students move toward graduation.36 As an operational database, however, the NSLDS has a limited ability to support analytic work. Because many students do not receive financial aid every year, ED’s records are incomplete. And the NSLDS does not collect critical metrics such as race and academic preparation.
Eighty-four percent of colleges participating in the student aid programs—representing 97 percent of students—report detailed enrollment information to a private nonprofit, the National Student Clearinghouse (NSC). A number of institutions use the NSC to disclose additional information about graduation rates, such as through the Voluntary System of Accountability and the Voluntary Framework of Accountability. The NSC, however, only releases information aggregated across many colleges or with the colleges’ consent, making it very difficult to examine individual colleges and impossible to incorporate additional information, such as earnings outcomes, that would require student-level data.37
As a result, our current system for tracking student graduation is unnecessarily complicated, redundant, confusing, and a burden on institutions. It also fails to provide insight into which groups of students are unlikely to graduate and how we might address their challenges.
Congress should improve the accuracy and completeness of graduation rate data by authorizing ED to collect data on students who do not receive student aid. A student-level data system would allow ED to calculate graduation rates for all students, reducing the burden on colleges while greatly improving the usefulness of the data.
For these reasons, the bipartisan Commission on Evidence-Based Policymaking—the brainchild of U.S. Representative Paul Ryan and U.S. Senator Patty Murray—recently recommended that Congress reconsider bans on the collection and use of data to inform what works, subject to a
35. Council of Economic Advisers, Using Federal Data to Measure and Improve the Performance of U.S. Institutions of Higher Education (College Scorecard, 2017), https://collegescorecard.ed.gov/assets /UsingFederalDataToMeasureAndImprovePerformance.pdf; U.S. Department of Education, Federal Student Aid, National Student Loan Data System, Enrollment Reporting Guide (2016), https://ifap.ed.gov/nsldsmaterials /attachments/NewNSLDSEnrollmentReportingGuide.pdf.
36. Jeff Baker and Pamela Eliadis, “Reminder of Program-Level Enrollment Reporting Requirement” [memo], September 26, 2014, U.S. Department of Education, Federal Student Aid. https://ifap.ed.gov/eannouncements /092614ReminderPrgmLevelEnrollmentReportingRequirement.html.
37. Afet Dundar and Doug Shapiro, The National Student Clearinghouse as an Integral Part of the National Postsecondary Data Infrastructure (National Student Clearinghouse Research Center, 2016). https:// nscresearchcenter.org/wp-content/uploads/NSC-as-an-Integral-Part-of-the-National-Postsecondary-Data -Infrastructure.pdf.

15 MONEYBALL FOR HIGHER EDUCATION
robust set of student privacy protections. U.S. Senators Orrin Hatch (R-UT), Elizabeth Warren (D-MA), Bill Cassidy (R-LA), and Sheldon Whitehouse (D-RI), and U.S. Representative Paul Mitchell (R-MI)—along with six other House cosponsors—introduced the College Transparency Act, one proposal to accomplish this goal.38
In addition, ED should establish on-time graduation rates as the primary measure of college graduation on the College Scorecard and elsewhere, while also continuing to calculate rates for students who take longer to finish. The most widely used graduation rate today is 150 percent of normal time: six years for a four-year degree and three years for a two-year program. This remains an important measure of whether students ultimately reach their goal.
Finishing on time, however, makes college more affordable for both students and taxpayers and should be the goal. While part-time students will naturally take longer, we should also seek to help them graduate as quickly as possible and without excess credits. Efforts to establish uniform, comprehensive graduation rates for high school students helped drive a focus on raising graduation rates in recent years and could be a model. As partially done by IPEDS today, such data should be disaggregated by race, ethnicity, income, disability status, English Language Learner status, and homelessness.
Recommendation 1.2. Calculate Reliable Estimates of Employment Outcomes
ED should work with other federal agencies—such as the Internal Revenue Service, the Social Security Administration, or the Census Bureau—to calculate and publish reliable employment and earnings information for college students, including disaggregation by program, degree attainment, and student demographics. Subject to strict protections for the privacy of individual students, it should make aggregated and anonymized data available to college leaders, researchers, and policy makers.
As noted above, employment outcomes vary widely between colleges and among programs within colleges. Yet neither students nor educators have access to reliable, regularly updated data on em-ployment outcomes. One measure that may be particularly useful is the expected earnings distri-bution over time. Research has suggested that because students are risk-averse, providing multi-ple parameters—such as expected earnings quintiles—may be more useful to students than just providing median estimates.39 A second potentially useful metric is the share of former students earning above a threshold, such as $25,000 or $30,000, that indicates economic self-sufficiency.
In recent years, an increasing amount of employment data has become available, but each of these sources has limitations. ED publishes median earnings and the share of students earning more than a high school graduate on the College Scorecard, but these data do not distinguish among majors or completion status and do not include other more-detailed descriptions of the
38. College Transparency Act, H.R. 2434, 115th Cong. (2017), https://www.congress.gov/bill/115th-congress /house-bill/2434; College Transparency Act, S. 1121, 115th Cong. (2017), https://www.congress.gov/bill/115th -congress/senate-bill/1121.
39. Alex Ruder and Michelle Van Noy, The Influence of Labor Market Outcomes Data on Major Choice: Evidence from a Survey Experiment (New Brunswick, NJ: John J. Heldrich Center for Workforce Development, Rutgers Uni-versity, 2014). https://eric.ed.gov/?id=ED565471.

16 MONEYBALL FOR HIGHER EDUCATION
earnings distribution. ED published median earnings by program for occupational programs through its gainful employment regulation, but it recently suspended efforts to calculate these rates and their future is in doubt.40 The College Scorecard and gainful employment earnings measures are also limited to federal aid recipients, which in some cases is a narrow subset of an institution’s overall student body.
A small number of states are now publishing employment outcomes—many through the American Institutes for Research College Measures effort—but these data are based on state unemployment records, which generally do not include graduates who move out of state or who are not eligible for unemployment insurance, such as independent contractors, service members, some government officials, ministers and members of the clergy, and a few other groups. Unemployment insurance data are also more difficult to adjust for geographic differences in the cost of living because they are reported based upon the location of the employer’s headquarters, not the employee’s job or home.
Finally, private sector economic firms have data that can illuminate the value of college based on government surveys and an analysis of job postings and social media sites like LinkedIn. These firms do not provide reliable and widely accessible data on employment outcomes for students in different fields of study year after year.
As a result, students are denied the ability to make informed decisions about their futures, in-cluding what to study and how much they can afford to borrow in student loans. Research sug-gests that these information gaps may be particularly large for low-income and first-generation students and may affect students’ decisions, including whether to attend college and choice of major.41 Similarly, educators are unable to work on improving not only their graduation rates but also the employment success of their students.
In past years, Senators Ron Wyden (D-OR), Marco Rubio (R-FL), and Mark Warner (D-VA) have introduced the Student Right to Know Before You Go Act to create more reliable data on employ-ment outcomes.42 Legislation is not needed, however, to generate and publish reliable, actionable, and privacy-protected data by matching U.S. Department of Education records with earnings data from another federal agency.
Recommendation 1.3. Invest in New Measures of Learning and Civic Outcomes
ED should dedicate $5 million a year to seed the higher education community’s own efforts to define the goals of higher education. These resources could be drawn from ED’s evaluation funds (see Recommendation 2.1) and support the efforts of colleges to work together on new measurements of student learning and civic engagement.
40. U.S. Department of Education, “Education Department Releases New Graduate Earnings Data for Career College Programs” [press release], November 17, 2016, https://www.ed.gov/news/press-releases/education -department-releases-new-graduate-earnings-data-career-college-programs; U.S. Department of Education, “DeVos Presses Pause on Burdensome Gainful Employment Regulations” [press release], June 30, 2017, https://www .ed.gov/news/press-releases/devos-presses-pause-burdensome-gainful-employment-regulations.
41. Council of Economic Advisers, Using Federal Data.42. Student Right to Know Before You Go Act of 2015, S. 1195, 114th Cong. (2015). https://www.congress
.gov/bill/114th-congress/senate-bill/1195/cosponsors.

17 MONEYBALL FOR HIGHER EDUCATION
Measuring graduation and employment is insufficient to capture the goals of our higher education system. An essential purpose of higher education is to make us better human beings, learn what it means to be contributing members of society, foster a lifelong interest in learning and develop-ment, equip young people to become informed participants in our democracy, and otherwise help students lead more complete lives. Indeed, students value these outcomes, as evidenced by the UCLA survey mentioned above. Colleges are also important engines of economic development, bringing benefits to their communities that include economic growth, tax revenue, and a reduced burden on public benefit programs.
And yet, colleges suffer from a shortage of instruments to use to measure whether students are reaching those goals. A federal investment in developing better definitions of the goals and mea-sures of these broader purposes of higher education will help colleges seriously pursue them as part of their academic programs, while preventing reductionist efforts to measure colleges and universities solely by the economic return enjoyed by their students.
At the core of the academic enterprise is measuring student learning. This is likely best done by letting each discipline define for itself the essential concepts, as in the efforts described in figure 6. Federal resources could be used to expand these efforts and seed new ones.
Colleges and universities also cultivate and promote the values and skills that are fundamental to American citizenship and participation in the institutions of civil society and representative government. Colleges and universities often place civic education at the core of their missions, and almost every state addresses civic education in state statute.43 Given the worrisome decline in most of the measures of civic health, the time could not be more urgent for colleges and universi-ties to take further steps to meet their missions.
For example, the College of William and Mary, James Madison University, and Averett University made common cause to secure the commitment of every college in the state of Virginia to create service year fellowships, connect national service opportunities to courses of study, and partici-pate in a Virginia Campus Compact to help sustain the effort over time. Those Americans who are more civically active also have higher employment rates, better health, better educational out-comes, and lower social service costs.44
One implication of this civic focus is that service years should be valued alongside employment as a positive outcome. For example, ED could look at former students’ service in the military, in civilian national service, and in other public and nonprofit roles, or by publishing the percentage of each college’s graduates engaged in employment eligible for public sector loan forgiveness. Another example is Tufts University’s National Study of Learning, Voting, and Engagement. By combining student enrollment records with publicly available voting records, Tufts has created an objective measure of student civic engagement.45
43. Education Commission of the States, 50-State Comparison: Civic Education Policies (2016). https://www .ecs.org/citizenship-education-policies/.
44. Atwell, Bridgeland, and Levine, Civic Deserts.45. See Tufts University, Tisch College, Institute for Democracy & Higher Education, https://idhe.tufts.edu.

18 MONEYBALL FOR HIGHER EDUCATION
Figure 6. College-Led Efforts to Define Student Learning
• In 2011, the Lumina Foundation released the first draft of the Degree Qualifications Profile (DQP), which it calls “a baseline set of reference points for what students should know and be able to do for the award of associate, bachelor’s and master’s degrees, regardless of their field of study.” The DQP is intended to help faculty clearly define the specific learning outcomes that degrees represent and has been used by more than six hundred colleges and universities to clarify students’ goals and strengthen classes and programs.a
• The Association of American Colleges and Universities’ Valid Assessment of Learning in Undergraduate Education (VALUE) includes rubrics to evaluate the sixteen intellec-tual, practical, personal, and social LEAP essential learning outcomes, including civic engagement. As of 2015, the rubrics have been downloaded more than 42,000 times by 4,200 unique institutions, including 2,800 colleges and universities.b Other projects have built off of the VALUE rubrics, including the Multi-State Collaborative to Advance Quality Student Learning.c
• Measuring College Learning is a project that engaged faculty in six disciplines— biology, business, communication, economics, history, and sociology—to define what their students should learn and, ultimately, how that learning should be measured. It has sought to be driven by faculty, and any assessments will be voluntary, rigorous, and based on multiple measures.d
• Transforming Post-Secondary Education in Mathematics (TPSE Math) seeks to strengthen math education for all students, regardless of their field of study, at universities, four-year colleges, and community colleges. It brings together faculty, administrators, disciplinary societies, and membership associations. Their goals include developing multiple lower-division pathways aligned to students’ needs and redesigning upper-division curriculum to better meet the needs of employers and other disciplines.e
a See Lumina Foundation, Degree Qualifications Profile, http://degreeprofile.org. b Association of American Colleges and Universities, On Solid Ground: Value Report 2017. https://
www.aacu.org/sites/default/files/files/FINALFORPUBLICATIONRELEASEONSOLIDGROUND.pdf. c See State Higher Education Executive Officers Association, Multi-State Collaborative to Advance
Quality Student Learning—The “MSC,” http://www.sheeo.org/projects/multi-state-collaborative -advance-quality-student-learning%E2%80%94-msc.
d See Social Science Research Council, Measuring College Learning Project + Resource Center, http://highered.ssrc.org/projects/measuring-college-learning-project.
e See TPSE Math, http://www.tpsemath.org.

19 MONEYBALL FOR HIGHER EDUCATION
Recommendation 1.4. Research Methodologies to Identify Colleges that Successfully Serve Disadvantaged Students
ED should support new research into the academic and financial challenges students face to bet-ter identify the colleges that are succeeding with the most challenging students.
Closing disparities and helping many more students succeed at college will require strong out-comes for all students, not only the most financially and academically well-prepared students. To be sure, all students should be held to the same high expectations: the mere fact that a student is disadvantaged should not provide a pass for lackluster outcomes. But any effort to assess colleges must account for the reality that students with academic gaps or financial obstacles are, on average, more challenging to serve.
Measuring completion rates otherwise could backfire by leading colleges to refuse to enroll aca-demically challenged students. New methodologies are needed to distinguish between colleges achieving strong outcomes while enrolling primarily students who are strong academically and financially secure from those colleges achieving strong outcomes while enrolling students from all backgrounds.46 These questions become even more important in the design of performance funding systems.47
STEP 2. BUILD AND USE EVIDENCE OF WHAT WORKS
Measuring student outcomes is necessary to improving them but is not sufficient alone. The federal government should also use its resources to identify successful strategies that colleges can use to achieve better results. Many of the recommendations below were included in the final report of the Commission on Evidence-Based Policymaking mentioned above, as well as bipartisan legislation to implement those recommendations, the Foundations for Evidence-Based Policy-making Act of 2017, sponsored by Speaker Paul Ryan and Senator Patty Murray.48
Recommendation 2.1. Invest a Penny of Every Federal Dollar in Evaluation
Congress should invest 1 percent of discretionary higher education funding, excluding Pell and other student loans, in program evaluations to determine what works so that the other 99 percent
46. For initial efforts to address these questions, see Chetty et al., The Fading American Dream; and Caroline M. Hoxby, Computing the Value-Added of American Postsecondary Institutions (2015). https://www.irs.gov/pub /irs-soi/15rpcompvalueaddpostsecondary.pdf.
47. Tiffany Jones, Can Equity Be Bought? Five Components of a Smart Outcomes-Based Funding Policy (Washington, DC: Education Trust, 2017). https://edtrust.org/the-equity-line/five-components-smart-outcomes -based-funding-policy/.
48. Commission on Evidence-Based Policymaking, The Promise of Evidence-Based Policymaking (2017), https://www.cep.gov/content/dam/cep/report/cep-final-report.pdf; Foundations for Evidence-Based Policymaking Act of 2017, H.R. 4174, 115th Cong. (2017), https://www.congress.gov/bill/115th-congress/house-bill/4174; Foundations for Evidence-Based Policymaking Act of 2017, S. 2046, 115th Cong. (2017), https://www.congress .gov/bill/115th-congress/senate-bill/2046.

20 MONEYBALL FOR HIGHER EDUCATION
is spent more effectively and efficiently. Congress should require ED to develop an annual learn-ing agenda that describes how these resources will be spent.
High-growth industries invest 10 to 20 percent of sales revenues in research and development, according to one estimate, while many mature industries invest 2 to 3 percent.49 But according to a U.S. Government Accountability Office report, only 37 percent of federal program managers reported that an evaluation of their programs had been completed in the last five years.50
Setting aside 1 percent of discretionary higher education funding, excluding Pell grants and stu-dent loans, would allow $47 million a year for evaluation.51 Congress enacted a similar provision for K-12 education in the 2015 Every Student Succeeds Act (ESSA), setting aside 0.5 percent of funds for evaluation. Other federal agencies, such as the U.S. Agency for International Develop-ment and the Millennium Challenge Corporation, invest more than 1 percent per year, as high-lighted in Results for America’s Federal Invest in What Works Index.52
Each year, ED should develop a learning agenda to describe how it will use funds set aside to answer major research, evaluation, and policy questions in order to improve the effectiveness of all its programs, including ED’s higher education and student aid programs. The annual budget request should also describe the evidence base for new programs and for programs receiving in-creased funding, as well as how ED plans to use evidence to improve the effectiveness of existing activities. In important areas where a strong research base does not yet exist, ED should propose strategies to generate new information about what works.
Supported research should include randomized trials, which remain the gold standard of pro-gram evaluation. It should also include new forms of evaluation—drawing on administrative data, machine learning, and rapid testing of alternative communications (such as websites, email, and texting)—that can address problems that are not conceptually neat, as well as offer faster and more actionable guidance that can enable constantly improving outcomes.
Congress should also provide explicit authority for ED to combine a portion of these funds with regulatory waivers provided through its Experimental Sites authority to support evaluation of those experiments. The Experimental Sites Initiative allows ED to waive regulatory requirements with the goal of informing future legislation and regulatory change. And yet, there are no resources to evaluate whether these pilot programs succeed. These waivers should be integrated into a higher education learning agenda and backed by resources for evaluation, including randomized trials where appropriate.
49. Raising the Bar: How Education Innovation Can Improve Student Achievement: Testimony of Assistant Dep-uty Secretary for Innovation and Improvement Jim Shelton, Before the U.S. House of Representatives, Committee on Education and Workforce, Subcommittee on Early Childhood, Elementary, and Secondary Education, February 14, 2013. https://edworkforce.house.gov/uploadedfiles/shelton.pdf.
50. Program Evaluation: Strategies to Facilitate Agencies’ Use of Evaluation in Program Management and Policy Making, GAO-13-570 Report to Congressional Committees (Washington, DC: Government Accountability Office, 2013). http://www.gao.gov/assets/660/655518.pdf.
51. U.S. Department of Education, Department of Education Fiscal Year 2017 Congressional Action (2017). https://www2.ed.gov/about/overview/budget/budget17/17action.pdf.
52. Results for America, Federal Invest in What Works Index (2017). https://2017.results4america.org.

21 MONEYBALL FOR HIGHER EDUCATION
Recommendation 2.2. Designate a Chief Evaluation Officer
ED should designate a chief evaluation officer to create and carry out a research and learning agenda, inform major policy and budgetary decisions, and help the agency improve the effective-ness of its programs, as recommended by the Commission on Evidence-Based Policymaking and required under the proposed Foundations for Evidence-Based Policymaking Act.
For example, since 2010 the U.S. Department of Labor (DOL) has had a Chief Evaluation Office led by a chief evaluation officer, a career position that coordinates evaluations agency-wide.53 This small evaluation staff—supplemented by temporary employees and relationships across the agency—have helped cement a commitment to independent, evidence-based culture in DOL policy making. The office ensures that policy decisions are informed by the best available evidence, helps senior leaders identify and close gaps in the most important knowledge, and supports efforts to strengthen the management of the agency by helping define and measure performance goals.
ED’s evaluation office could play another important role: helping ED program staff support col-leges, universities, and others to understand and apply evidence in their use of federal funds. With support, staff could move beyond simply ensuring compliance with federal grant rules and support efforts to evaluate practices, make data collections more useful, and use evidence to drive improvement. For example, the U.S. Department of Health and Human Services supports Head Start centers by compiling research literature, implementation advice, training manuals, and other materials that improve the quality of Head Start.54
Recommendation 2.3. Identify and Test Innovative Approaches
Congress should invest $100 million in a new evidence-based innovation program to establish and grow promising and proven approaches to helping students learn, graduate, and find jobs.
With the Every Student Succeeds Act, Congress established a new program, the Education Inno-vation and Research program, to provide small grants to test promising approaches to improving K-12 schools, moderate grants to validate programs that have been successfully implemented at least once, and larger grants to replicate programs with sizable benefits. This tiered-evidence ap-proach places many smaller bets to build evidence on what works, while directing more resources to programs with demonstrated success.
Congress should invest $100 million in a similar new evidence-based program for higher education. This program—a next generation Fund for the Improvement of Postsecondary Education (FIPSE)—could establish and grow promising and proven approaches to helping students learn, graduate, find
53. See U.S. Department of Labor, About CEO, https://www.dol.gov/asp/evaluation/about.htm. 54. See U.S. Department of Health and Human Services, Administration for Children and Families, Office of
Planning, Research, and Evaluation, Research to Practice: Assessing Evidence-Based Head Start Program Activi-ties, 2005–2008. https://www.acf.hhs.gov/opre/research/project/research-to-practice-assessing-evidence-based -head-start-program.

22 MONEYBALL FOR HIGHER EDUCATION
jobs, and otherwise improve student outcomes without raising costs. It should provide smaller grants to evaluate promising ideas and larger grants to validate ideas with promising results. ED should set competitive priorities and be able to waive matching fund requirements to encourage equitable participation from all communities.
The largest grants should be reserved for implementation at scale. Winners of these grants should be able to demonstrate that they will not only apply evidence but also use data to monitor the program’s effectiveness and continue to improve.
Because a small federal program cannot possibly support the nationwide application of proven practices, these implementation resources should be used where there is potential for significant-ly outsized impact. Recipients should have persuasive plans to sustain these interventions after the end of federal funding and to scale effective practices beyond directly funded work. For example, innovation awards can work hand-in-hand with outcomes-based funding by providing seed funding for new approaches that can be sustained by funding attached to stronger outcomes.
Finally, as discussed in Recommendation 1.3, these resources should also be used to facilitate college-led efforts to define learning outcomes.
Recommendation 2.4. Build the Capacity of Colleges to Use Data
ED should establish new technical assistance centers to improve colleges’ capacity to use data and evidence responsibly to improve student outcomes. Congress should provide dedicated funding to allow ED to expand technical assistance capabilities beyond what is possible within its program administration budget.
Ultimately, the success of efforts to improve student outcomes will be determined at the campus level. One cost-effective and increasingly popular strategy is data-driven performance manage-ment, including the use of predictive analytics. Colleges use data to diagnose where students face obstacles and work together to develop interventions to overcome them. Although difficult to rigorously evaluate, the use of data has been linked to positive outcomes.
Most notably, Georgia State University’s Graduation and Progression Success advising program features an early warning system which uses data on student performance to alert advisers to stu-dents who may be at high risk for not graduating. Since its rollout in 2013, Georgia State’s four-year graduation rates have increased 6 percent and graduation gaps have closed for low-income, first-generation, and minority students. Georgia State also provides microgrants to at-risk students through its Panther Retention Grants program.55 Similarly, the introduction of the eAdvisor pro-gram at Arizona State University has helped the on-time graduation rate climb 20 percentage points since 2002.56
55. See Georgia State University, Student Success Programs, http://success.gsu.edu/approach. 56. “ASU 4-year Graduation Rate up 20 Points since 2002,” ASU Now, January 26, 2015. https://asunow.asu
.edu/content/asu-4-year-graduation-rate-20-points-2002.

23 MONEYBALL FOR HIGHER EDUCATION
Many colleges and universities, however, lack the technical and staff capacity to use data to diag-nose problems, identify potential evidence-based solutions, and act on those improvements. Ac-ademics studying performance funding for higher education have identified the lack of colleges’ capacity to use data as a key obstacle.57 Former college presidents William Bowen and Michael McPherson suggested that ED provide technical assistance to colleges.58
ED’s Office of Postsecondary Education should also house new technical assistance labs to help colleges use evaluation data for continuous improvement. The technical assistance could also include developing guidelines to ensure that data is used to promote equity, rather than increase discrimination. The effort could be modeled on the Regional Educational Laboratory program, which works with school districts, state departments of education, and others to use data and research to improve academic outcomes for students.
Recommendation 2.5. Build and Apply Evidence to Improve TRIO and GEAR UP
Congress and ED should reform the TRIO and GEAR UP programs in order to build and apply evidence on what works in helping more students enroll in and succeed at college.
The TRIO and GEAR UP programs invest $1.3 billion per year in a variety of approaches for helping disadvantaged students move through middle school, high school, and college.59 They are large competitive programs and constitute a substantial share of the federal investment in higher education, outside of student aid. Right now, however, these recipients are allowed to present little, if any, evidence before receiving federal funding.
Congress should authorize ED to differentiate the amount of funding it provides TRIO and GEAR UP programs. Grantees that are willing to test their approaches and document what works should receive larger awards. Grantees that incorporate evidence in designing their programs should receive even larger awards to bring effective practice to the largest group of students. This tiered structure would, over time, turn more research into effective practices and direct federal funds toward what works.
These evaluation efforts should identify the practices that help programs succeed to support continuous improvement over time. Funded programs should no longer be paid to use approaches that have been tested and proven not to work. Evaluation studies should not seek a misleading, overly broad up-or-down verdict on the overall program.
Even without congressional action, ED has begun considering whether applicants plan to use evi-dence in making grant decisions, including for the TRIO programs Upward Bound and Upward
57. Kevin Dougherty et al., Performance Funding for Higher Education (Baltimore: Johns Hopkins University Press, 2016).
58. William Bowen and Michael McPherson, Lesson Plan: An Agenda for Change in American Higher Education (Princeton, NJ: Princeton University Press, 2016).
59. U.S. Department of Education, Department of Education Fiscal Year 2017 Congressional Action (2017). https://www2.ed.gov/about/overview/budget/budget17/17action.pdf.
24 MONEYBALL FOR HIGHER EDUCATION
Bound Math and Science as well as for GEAR UP.60 By regulation, ED should revise the prior experience points that provide substantial competitive advantage to existing grantees to provide ongoing support to those TRIO programs committed to evidence-based continuous improvement. Finally, as discussed in Recommendation 2.2, a new chief evaluation officer could support this transition by compiling evidence-based practices to support TRIO and GEAR UP programs’ efforts to improve.
As proposed by the Trump administration, Congress should repeal its ban on studies that use ran-dom assignment of students to determine the most effective practices in TRIO.61 Rigorous studies are an important tool to make sure that federal resources have the greatest possible impact on students’ lives. Congress should consider making TRIO and GEAR UP funds available to nonprofit organizations, including those serving multiple school districts and college campuses, that use evidence to develop their proposed activities.
STEP 3. FUND COLLEGES FOR STUDENT SUCCESS
A college education is a joint enterprise among students and families and colleges with the finan-cial support of federal and state governments. All of these investors have a stake in students’ success. Federal policy should reflect this shared responsibility.
Why Fund Colleges Based on Success
Colleges and universities are traditionally funded based upon the number of students they enroll at the start of the semester. There is some logic to this approach, as colleges incur costs for each student they enroll and the principal goal of federal education policy for decades has been to in-crease access. Funding influences colleges’ priorities, however, and enrollment-based funding may have contributed to a system that enrolls many students but graduates too few of them. Indeed, efforts to help students improve outcomes, such as on-time graduation, often do not bring addi-tional funding and may even create a gap in the budget by reducing the time each student spends enrolled. Although college faculty members and administrators are generally deeply invested in the success of their students, they must also maintain the sustainability of their institution’s budget.
Led by Ohio and Tennessee, most states are moving toward funding their public colleges, at least in part, based on student outcomes. While the evidence on this approach is mixed, there are some early indications that these experiments can impact colleges’ focus on improving student outcomes and may have played a role in the rising graduation rates in those states.62
60. See U.S. Department of Education, Office of Postsecondary Education, Federal TRIO Programs—Home Page, https://www2.ed.gov/about/offices/list/ope/trio/index.html; and U.S. Department of Education, Gaining Early Awareness and Readiness for Undergraduate Programs (GEAR UP), https://www2.ed.gov/programs/gearup /index.html.
61. See U.S. Department of Education, Higher Education: Fiscal Year 2018 Budget Request, R-109. https://www2.ed.gov/about/overview/budget/budget18/justifications/index.html.
62. See our forthcoming paper on state policy for further discussion of state performance funding policies.

25 MONEYBALL FOR HIGHER EDUCATION
Even the best-designed state policies are currently limited to public institutions, however, and do not reach the private nonprofit and for-profit colleges that enroll more than a quarter of the nation’s students.63 The impact of state performance funding may also be limited by the decades- long trend toward state budget cuts, particularly during recessions. In many states, early experi-ments in performance funding were abandoned in the recession and political turnover of the early 2000s. Moreover, many states’ design formulas are opaque, further reducing their effectiveness in changing colleges’ incentives.
Only the federal government can provide incentives that reach all colleges. As state funding has been cut in recent years and federal funding has grown, the federal and state governments now contribute comparable amounts of resources to higher education.64 Over time, federal spending must move in the direction of rewarding student success.
The primary federal investment in higher education—the Pell program—is based largely on stu-dent enrollment, not on measures of success such as course completion. Although Pell funds flow to colleges in the name of individual students, in practice they are primarily used to pay tuition and therefore constitute a major funding stream for the institutions themselves.
Some for-profit colleges receive as much as 90 percent of their funding from federal financial aid, making them a useful illustration of the incentives for colleges created by those programs.65 Some for-profit colleges have been pioneers in efforts to serve working adults by offering pre-dictable schedules, well-defined programs, online courses, and connections to employers.66 But others have used high-pressure, sometimes deceptive, tactics to enroll students without reliably graduating them or helping them find jobs.67 These colleges can earn large profits without serving students well because the federal student aid programs pay them to enroll students, not necessar-ily to help students succeed. Public and nonprofit institutions have different missions, governance structures, and more diverse funding sources, but existing federal programs still fail to reward all types of colleges for investing in stronger student outcomes.
63. U.S. Department of Education, National Center for Education Statistics (2016): Table 303.25. https://nces .ed.gov/programs/digest/d16/tables/dt16_303.25.asp?current=yes.
64. Pew Charitable Trusts, Federal and State Funding of Higher Education: A Changing Landscape (2015). http://www.pewtrusts.org/en/research-and-analysis/issue-briefs/2015/06/federal-and-state-funding-of-higher -education.
65. Robert Kelchen, “How Much Do For-Profit Colleges Rely on Federal Funds?” Brown Center Chalkboard, January 11, 2017. https://www.brookings.edu/blog/brown-center-chalkboard/2017/01/11/how-much-do-for-profit -colleges-rely-on-federal-funds/.
66. James E. Rosenbaum, Regina Deil-Amen, and Ann E. Person, After Admission: From College Access to College Success (New York: Russell Sage Foundation, 2009). https://www.russellsage.org/publications/after -admission-0.
67. U.S. Senate Committee on Health, Education, Labor, and Pensions, For Profit Higher Education: The Fail-ure to Safeguard the Federal Investment and Ensure Student Success (2012), https://www.help.senate.gov/imo /media/for_profit_report/Contents.pdf; Stephanie Riegg Cellini et al., “Gainful Employment Regulations Will Protect Students and Taxpayers. Don’t Change Them,” Brown Center Chalkboard, August 4, 2017, https://www .brookings.edu/blog/brown-center-chalkboard/2017/08/04/gainful-employment-regulations-will-protect-students -and-taxpayers-dont-change-them/.

26 MONEYBALL FOR HIGHER EDUCATION
For similar reasons, there has been a recent shift to performance-based funding in another human services industry that relies heavily on highly educated professionals: health care. Doctors and hospitals have traditionally been paid on a fee-for-service basis, rather than for the results they achieved. However, the fee-for-service model has encouraged wasteful or unnecessary care, contributing to our nation’s exceptionally expensive health-care system.68 Policy makers are now working to reward health-care providers for delivering better health outcomes at lower cost. Such incentives also move our system toward more effective coordinated and preventive care, which makes people healthier and makes the health-care system more fiscally sustainable.
How to Invest in Better Outcomes
As advocates for evidence-based policy, we need to be frank where the evidence base is not yet developed. Policy makers do not yet know enough about how to measure student outcomes effec-tively, particularly in light of different student characteristics. The higher education community also needs to work with high schools and employers to build shared ownership over a school-to-work pipeline and to encourage innovation around strategies to build this pipeline.
Advocates of funding colleges based on outcomes have one more consideration: outcomes typi-cally arrive years after the colleges provide the education. For this reason alone, our colleges can never be funded entirely based on outcomes.
A properly designed financing system would allow colleges to sustain and grow investments in quality. As we reward successful colleges with additional resources, we will encourage them to invest in student outcomes as a key strategy to assure long-term strength—just as colleges build endowment and enrollment pipelines today. We should be ambitious but realistic about how to utilize new performance-driven approaches, and we should strengthen efforts to build that knowledge.
As a result, Congress and the administration should commit to moving in the direction of reward-ing colleges for investing in student outcomes, starting with flexible, incremental steps that allow for learning and course corrections along the way. In some cases, these new incentives could encourage student completion. Where appropriate, they could encourage colleges to focus on employment outcomes. The goal should be to develop practical experience so that if and when the federal government makes new investments in higher education, they can be designed with the goal of promoting student success.
Recommendations 3.1 to 3.4 present specific steps Congress could take to experiment with outcome-based funding. In implementing these recommendations, Congress could consider testing one or more existing models, including those listed in figure 7.
68. Rushika Fernandopulle, “Breaking the Fee-for-Service Addiction: Let’s Move to a Comprehensive Primary Care Payment Model,” Health Affairs Blog, August 17, 2015. http://www.healthaffairs.org/do/10.1377 /hblog20150817.049985/full/.
27 MONEYBALL FOR HIGHER EDUCATION
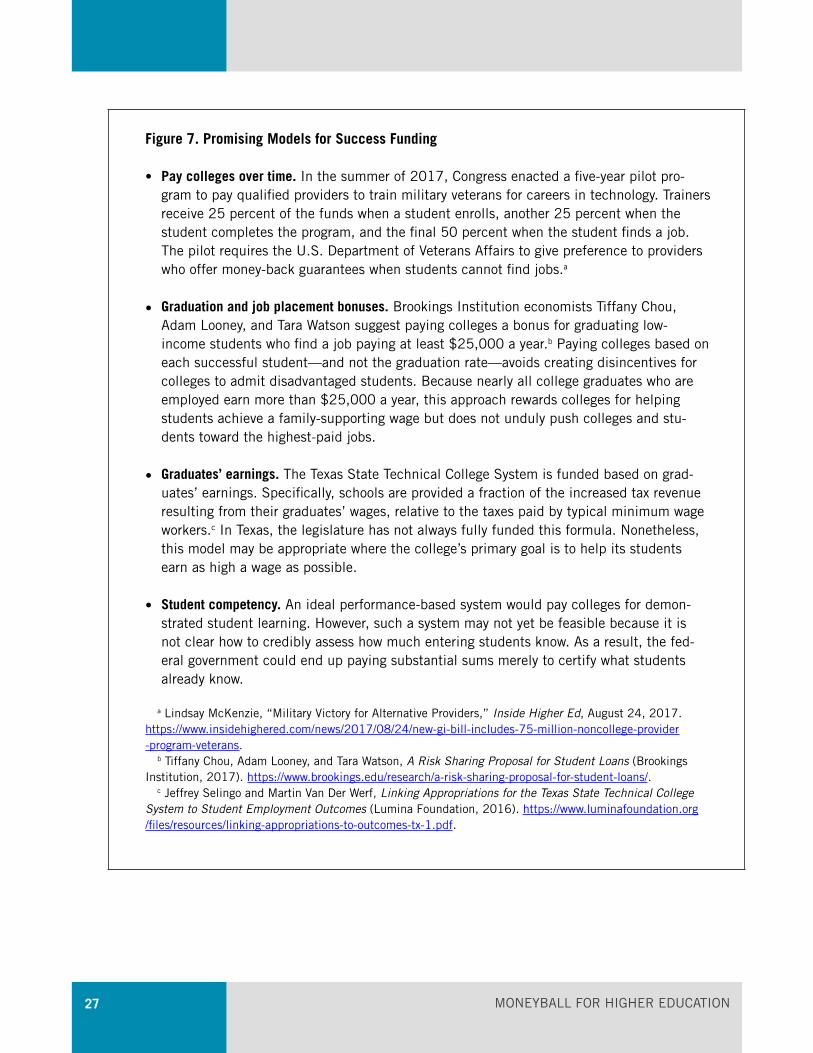
Figure 7. Promising Models for Success Funding
Pay colleges over time. In the summer of 2017, Congress enacted a five-year pilot pro-gram to pay qualified providers to train military veterans for careers in technology. Trainers receive 25 percent of the funds when a student enrolls, another 25 percent when the student completes the program, and the final 50 percent when the student finds a job. The pilot requires the U.S. Department of Veterans Affairs to give preference to providers who offer money-back guarantees when students cannot find jobs.a
Graduation and job placement bonuses. Brookings Institution economists Tiffany Chou, Adam Looney, and Tara Watson suggest paying colleges a bonus for graduating low- income students who find a job paying at least $25,000 a year.b Paying colleges based on each successful student—and not the graduation rate—avoids creating disincentives for colleges to admit disadvantaged students. Because nearly all college graduates who are employed earn more than $25,000 a year, this approach rewards colleges for helping students achieve a family-supporting wage but does not unduly push colleges and stu-dents toward the highest-paid jobs.
Graduates’ earnings. The Texas State Technical College System is funded based on grad-uates’ earnings. Specifically, schools are provided a fraction of the increased tax revenue resulting from their graduates’ wages, relative to the taxes paid by typical minimum wage workers.c In Texas, the legislature has not always fully funded this formula. Nonetheless, this model may be appropriate where the college’s primary goal is to help its students earn as high a wage as possible.
Student competency. An ideal performance-based system would pay colleges for demon-strated student learning. However, such a system may not yet be feasible because it is not clear how to credibly assess how much entering students know. As a result, the fed-eral government could end up paying substantial sums merely to certify what students already know.
a Lindsay McKenzie, “Military Victory for Alternative Providers,” Inside Higher Ed, August 24, 2017. https://www.insidehighered.com/news/2017/08/24/new-gi-bill-includes-75-million-noncollege-provider -program-veterans.
b Tiffany Chou, Adam Looney, and Tara Watson, A Risk Sharing Proposal for Student Loans (Brookings Institution, 2017). https://www.brookings.edu/research/a-risk-sharing-proposal-for-student-loans/.
c Jeffrey Selingo and Martin Van Der Werf, Linking Appropriations for the Texas State Technical College System to Student Employment Outcomes (Lumina Foundation, 2016). https://www.luminafoundation.org /files/resources/linking-appropriations-to-outcomes-tx-1.pdf.
•
•
•
•

28 MONEYBALL FOR HIGHER EDUCATION
Recommendation 3.1. Fund Short-Term Training Programs Based on Placement in Good Jobs
Congress should fund short-term training programs based on their success in helping students find jobs.
U.S. Senators Rob Portman (R-OH) and Tim Kaine (D-VA) have developed the Jumpstart Our Businesses by Supporting Students (JOBS) Act of 2017, which would expand Pell scholarships to high-quality short-term training programs. Under current law, colleges can offer Pell grants to their students only if they are enrolled in programs that are at least 600 hours or fifteen weeks long, the length of a traditional semester. The Portman-Kaine proposal would lower these thresh-olds to 150 hours or eight weeks.69 A similar Democratic bill, the Pell Grant Preservation and Ex-pansion Act, requires these programs to report outcomes and meet state licensure requirements.70
Some short-term job training programs have outsized impacts on earnings and could merit finan-cial support. However, not all do. There is bipartisan concern that in harnessing well-intentioned innovation such a proposal could unintentionally provide federal subsidies to low-quality pro-grams.71
One step to ensure that taxpayer dollars support only effective short-term programs is to fund programs based on the numbers of students who find jobs. For example, a policy could provide only partial payment until students have graduated and found well-paid jobs. Because they are intended to lead to employment—which can be quantified—training programs may be particularly well suited to this approach.
Recommendation 3.2. Fund Competency-Based Education Programs Based on Student Learning
Congress should fund competency-based education programs based on their success in helping students learn.
U.S. Representative Jared Polis (D-CO) and cosponsors have proposed a demonstration project for competency-based education programs in the Advancing Competency-Based Education Act of 2017.72 Under current law, student aid rules allow colleges to award academic credit based on demonstrated knowledge and skills rather than time spent in class. But the rules were designed for traditional academic programs, and their adaptation is clumsy.73
69. JOBS Act of 2017, S. 206, 115th Cong (2017). https://www.congress.gov/bill/115th-congress/senate -bill/206.
70. Pell Grant Preservation and Expansion Act, S. 1136, 115th Cong. (2017), https://www.congress.gov /bill/115th-congress/senate-bill/1136; Clare McCann, “Democratic Bill Pitches New Package of Pell Proposals,” New America, May 17, 2017, https://www.newamerica.org/education-policy/edcentral/democratic-bill-pitches -new-package-pell-proposals.
71. Paul Fain, “Support Grows for Major Shift in Pell,” Inside Higher Ed, July 10, 2017. https://www .insidehighered.com/news/2017/07/10/support-builds-expanding-pell-eligibility-short-term-certificates.
72. Advancing Competency-Based Education Act of 2017, H.R. 2859, 115th Cong. (2017). https://www .congress.gov/bill/115th-congress/house-bill/2859.
73. Stephen R. Porter, Competency-Based Education and Federal Student Aid (2014). http://www.cbenetwork .org/sites/457/uploaded/files/Competency_Based_Education_and_Federal_Student_Aid.pdf.

29 MONEYBALL FOR HIGHER EDUCATION
The Polis bill has the potential to expand programs that may be lower cost and effective at helping students reach their goal. Granting academic credit based upon demonstrated knowl-edge, rather than time in the classroom, is a potentially transformational approach. Implemented effectively, it could make college cheaper and faster, while also ensuring the students master the necessary skills and knowledge.
However, as with funding short-term training programs, unless there is careful attention to qual-ity assurance, competency-based education could unintentionally provide federal subsidies to low-quality programs.74 Conditioning payment on whether students achieve their goals—including not only completion but also employment or further education—could provide additional assur-ance of quality.
Before expanding eligibility, Congress should require that new programs establish a system for demonstrating their students’ learning gains, including independent assessments of what stu-dents know before and after enrolling in the program. It should allow ED to pay colleges in part based on the number of students who master the material, not solely on the number of students they serve.
Recommendation 3.3. Reform Campus-Based Student Aid to Promote Better Outcomes
Congress should distribute funding for the Federal Supplemental Educational Opportunity Grant (FSEOG) scholarships and Perkins student loans based on success in helping disadvantaged students graduate from college and reform the federal work-study program to support better employment outcomes.
In 2017, the federal government spent almost $2 billion on two “campus-based” student aid programs, so called because they allow colleges to allocate financial aid among students: FSEOG scholarships and the federal work-study program.75 The Trump administration’s budget proposal would eliminate FSEOG scholarships and cut the work-study program in half. Meanwhile, Con-gress recently allowed another campus-based student aid program, the Perkins student loan program, to lapse. Instead of ending these programs, they could be reformed to better promote student outcomes while continuing to improve access to higher education.
Congress should give the FSEOG scholarships and Perkins student loans new purpose by reducing the cost of college at the colleges that are serving students well. They should provide FSEOG and Perkins funds to colleges that enroll and graduate large numbers of low-income students. This approach will recognize colleges that are serving students well at an affordable price and give stu-dents an added incentive to go to colleges where they get the biggest bang for the buck. To enable learning and improvement over time, Congress should define the objectives for the funding formu-la and allow ED the flexibility to amend it over time, while also directing ED to carry out oversight to ensure outcomes measures are not gamed and student outcomes do not suffer as a result.
74. Fain, “Support Grows for Major Shift in Pell.”75. U.S. Department of Education, Department of Education Fiscal Year 2017 Congressional Action (2017).
https://www2.ed.gov/about/overview/budget/budget17/17action.pdf.
30 MONEYBALL FOR HIGHER EDUCATION
Work-study jobs—too often in the cafeteria or library—are a missed opportunity to offer students meaningful learning experiences that connect their education with their future employment. Con-gress should reform the work-study program to give students an opportunity to explore academic or career internships. Rather than subsidizing menial work, students should be offered research opportunities, service summer experiences, or jobs in companies, nonprofits, or community organizations. Whatever the type of job, it should be connected to students’ academic and career interests. To encourage colleges to strengthen ties with employers, Congress should allocate work-study funds to colleges that successfully help work-study students graduate, perform national service, and find jobs.
Recommendation 3.4. Prioritize Outcomes in Future Major Investments
When considering major new investments in higher education, Congress should ensure that it re-wards colleges for improving student outcomes, such as higher achievement while in school, high-er college completion rates, earning degrees related to labor market needs, finding jobs, and other post-completion outcomes such as encouraging students to perform a year of national service.
In the current Congress, a leading strategy is a student loan risk-sharing proposal. A number of thoughtful papers have been written on how to structure such a program.76 Similarly, a number of leading Democrats have proposed plans to eliminate college tuition, and there have been many de bates about what it means to make college free and what types of students and colleges should be eligible.
Neither of these proposals appear likely to be enacted right away. Should a time come when Con-gress is considering a major infusion of resources into higher education, however, it should take care to design the program to yield better student results.
These major new investments could be an opportunity to reward colleges for improving student outcomes. For example, a risk-sharing proposal could discourage colleges from serving disad-vantaged students because disadvantaged students cost more per year. Providing colleges with a bonus for each student who graduates and finds a job would complement a risk-sharing proposal, allowing colleges who successfully serve disadvantaged students to come out ahead. Similarly, new programs to pay for college tuition must also address the quality of education by funding colleges based on their success in helping students from all backgrounds graduate, find jobs, and reach their other goals.
76. Ben Miller and Beth Akers, Designing Higher Education Risk-Sharing Proposals: Evaluating Choices and Tradeoffs (Center for American Progress, 2017), https://www.americanprogress.org/issues/education-postsecondary /reports/2017/05/22/432654/designing-higher-education-risk-sharing-proposals/; Chou, Looney, and Watson, A Risk Sharing Proposal for Student Loans.

31 MONEYBALL FOR HIGHER EDUCATION
CONCLUSION
Our nation’s colleges and universities are a uniquely valuable asset that make indispensable con-tributions to our American economy, society, and democracy. College graduates are more econom-ically secure, make larger contributions to economic growth, are more civically engaged, and are more likely to continue to learn over the course of their lives.
These contributions are critical today. Workers’ wages have been largely stagnant for over a decade. Too few students graduate, and too many default on their student loans. Greater citizen engagement in the workings of our democracy is particularly important in these divided times.
To take full advantage of our investments in higher learning, federal policy makers need to help colleges and universities better serve students. They can do this by sharing more data on student outcomes, such as graduation rates, learning, and employment; building and applying evidence on how colleges can help students succeed; and ensuring that investments in student quality are sustainable. We don’t have a moment to lose.

32 MONEYBALL FOR HIGHER EDUCATION
ACKNOWLEDGMENTS
The authors would like to thank Jeremy Ayers, David Medina, and their colleagues at Results for America for helping us shape the vision of this paper and patiently reviewing multiple drafts to improve it. Neha Dalal provided tireless and insightful research assistance, saving us from errors and strengthening the paper’s argument. Nancy Zimpher, Paul Lingenfelter, Amy McIntosh, Beth-any Little, Michael Dannenberg, Clare McCann, Ben Miller, and Michael Itzkowtiz provided valu-able written comments on earlier drafts. Last, we are grateful to the participants in the July 2017 meeting, Moneyball for Higher Education, convened by Results for America, the members of the community college advisory panel convened by College Board in October 2017, and the partici-pants in the 2017 CLIMB conference at University of Texas–Austin for their insightful comments which informed these ideas.
Results for America would like to thank James Kvaal and John Bridgeland for their thoughtful leadership, diligent work, and collaborative partnership in developing this report.
This report has been produced with the generous support of the Strada Education Network. The report is an independent work product of Results for America, and the views expressed are those of the authors and do not necessarily represent those of the funders.
This policy brief is part of Results for America’s Invest in What Works Policy Series, which provides ideas and supporting research to policy makers to drive public funds toward evidence-based, results-driven solutions.
Copyright © 2017 Results for America.
This publication may be reproduced in whole or in part and in any form for educational or nonprofit services without special permission from the copyright holder, provided acknowledg - ment of the source is made. No use of this publication may be made for resale or any other commercial purpose whatsoever without prior permission in writing from Results for America, 1875 Connecticut Avenue, NW, Washington, DC 20009.