Monetary Policy and Global Banking - Bank of Canada
25
Monetary Policy and Global Banking Falk Bräuning (FRB Boston) and Victoria Ivashina (Harvard) The views expressed in this paper are those of the authors and do not necessarily represent the views of the Federal Reserve Bank of Boston or the Federal Reserve System.
Transcript of Monetary Policy and Global Banking - Bank of Canada
Monetary Policy and Global Banking Falk Bräuning (FRB Boston) and Victoria Ivashina (Harvard)
The views expressed in this paper are those of the authors and do not necessarily represent the views of the Federal Reserve Bank of Boston or the Federal Reserve System.

Research Question:
• Foreign banks are central to economic activity:
• BIS, Jun 2015: European banks’ claims on US non-bank firms = $1.62 trillion
• BIS, Jun 2015: Japanese banks’ claims on US non-bank firms = $0.72 trillion
• DealScan, 1990-2015, European and Japanese banks originate ~25% of large corporate loans
• International credit channel of monetary policy/What are the cross-border effects of monetary policy (through the balance sheets of global banks)?

International Credit Channel of Monetary Policy: Existing View
• Cetorelli and Goldberg (2012) study large U.S. banks: • Builds on Stein and Kashyap (2000)
• Global internal capital markets insulate global banks from changes in a given country’s monetary policy

In this Paper:
• While funds can be moved between markets, it is unlikely that they are in the same currency, and currency risk exposure is typically hedged by banks Foreign banks rely heavily on FX swaps
o E.g., in June 2016, synthetic dollar funding from Eurozone and Japanese banks was > $1.5 trillion
• Increased demand for FX swaps is amplified by banks’ global management of liquidity (demand for high-yield reserve assets)
• Overall, there is an increased cost of synthetic dollar funding
Hedging costs drive wedge between marginal return of lending in dollars vs. foreign currency and, for capital-constraint banks, leads to contraction of dollar credit

Domestic lending
g(Ld)
Foreign lending
h(Lf)
Lf + Ld ≤ K
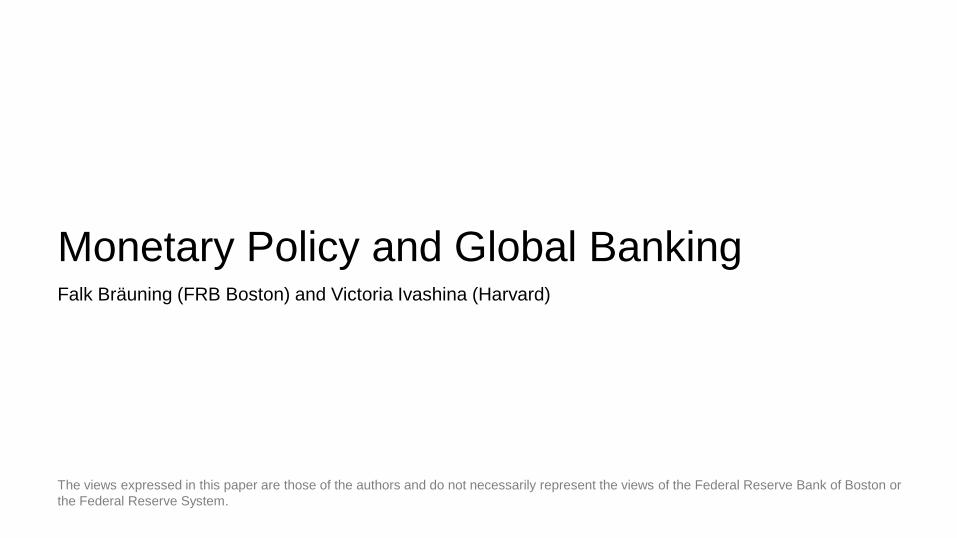
Elements of the Model: Global bank:

Domestic lending
g(Ld)
Foreign lending
h(Lf)
Lf + Ld ≤ K
Elements of the Model: Global bank:
Domestic excess
reserves rdRd
Foreign excess
reserves rfRf
Reserve holdings are pinned down separately, and don’t matter for lending: in each currency you accumulate reserves as long as your marginal cost of raising funding is below the IOER
Domestic lending
g(Ld)
Foreign lending
h(Lf)
Lf + Ld ≤ K
Elements of the Model:
Capital
Domestic deposits d(D)
Assumption: Convex cost of raising deposits; e.g., to expand deposits, a bank has to invest in advertising, promotions, and branches, and the more it expands in the short run the greater the marginal cost of adding deposits
Global bank:
Domestic excess
reserves rdRd
Foreign excess
reserves rfRf
Domestic lending
g(Ld)
Foreign lending
h(Lf)
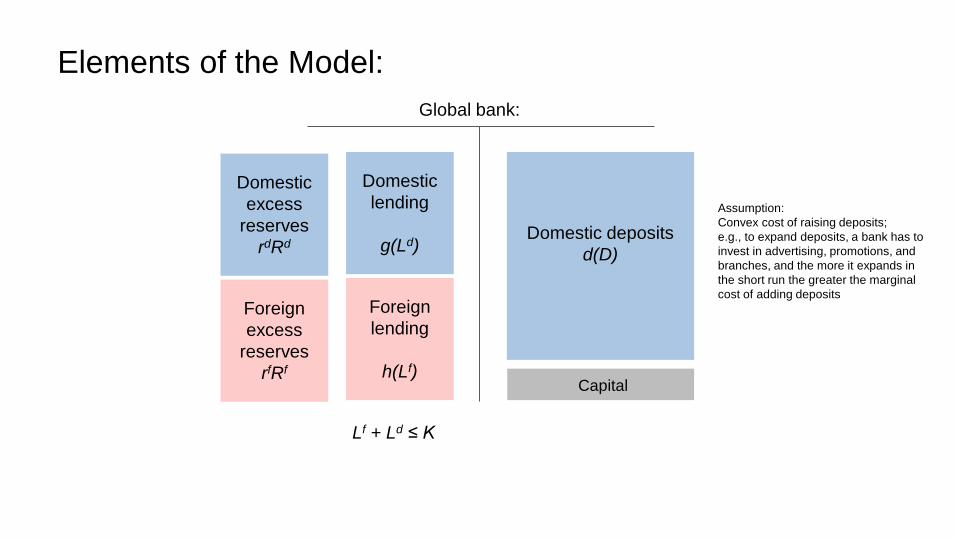
Lf + Rf = S
Elements of the Model: Global bank:
Domestic excess
reserves rdRd
Foreign excess
reserves rfRf
Capital
Foreign currency
Domestic funding
FX swap market
c(S) (c’(S)>0)
Capital-constrained banks can lend in dollars and euros but they must hedge FX risk or borrow in the currency in which they lend
Lf + Ld ≤ K

Elements of the Model:
𝑑𝑑′ 𝐷𝐷𝑑𝑑 = 𝑟𝑟𝑑𝑑
𝑐𝑐′ 𝑆𝑆 = 𝑟𝑟𝑓𝑓 − 𝑟𝑟𝑑𝑑 =:𝛥𝛥𝑟𝑟
ℎ′ 𝐿𝐿𝑓𝑓 = 𝑔𝑔′ 𝐿𝐿𝑑𝑑 + 𝛥𝛥𝑟𝑟

Elements of the Model:

Empirical Findings: Roadmap
I. Macro & bank-level analysis: Changes in reserves, cross-border fund movement, swapping
activity and lending
• Call reports
• BIS data
II. Micro loan-level analysis: Effects on lending
• DealScan
Sample period from 2000:Q1 to 2015:Q2 and focus on USD, EUR, GBP, JPY, CHF, CAD (and banks
from the related currency areas)
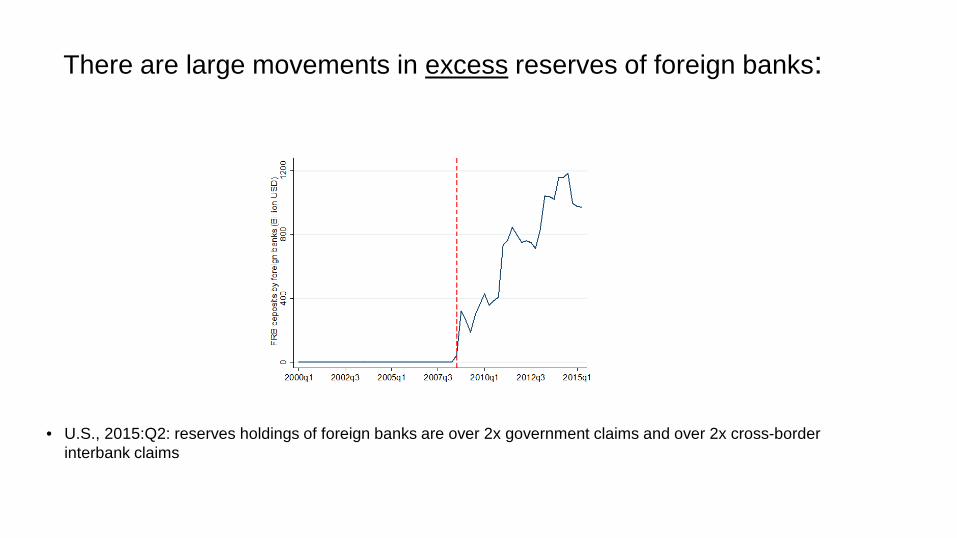
There are large movements in excess reserves of foreign banks:
• U.S., 2015:Q2: reserves holdings of foreign banks are over 2x government claims and over 2x cross-border interbank claims

FRB deposits of foreign banks and ΔIOER:
-15
-10
-50
5Lo
g(FR
B D
epos
its)
-8 -6 -4 -2 0 2Deposit rate difference (in pp)
R-squared=0.635
- 16 currency areas - 2000:Q1 to 2015:Q2 - each observation corresponds to a foreign banking sector-quarter (e.g., total Japanese banks’ deposits at FRB in a given quarter)

Reserve Assets Lending in U.S. Dependent Variable: Log(Reserves) Log(Treasuries) Log(C&I Loans) Log(Loans and Leases) (1) (2) (3) (4) IOER Difference (pp) 0.634*** 0.396*** -0.410** -0.464*** (4.18) (3.17) (-2.31) (-3.24) Fixed Effects: Bank Yes Yes Yes Yes Quarter Yes Yes Yes Yes R-sq. 0.80 0.84 0.93 0.93 Observations 1,763 767 1,683 1,736
Results: Table II (updated): Assets of Foreign Banks in the U.S. (Call Report Data)
1 pp increase in IOER difference 63% increase in reserves by foreign banks

Reserve Assets Lending in U.S. Dependent Variable: Log(Reserves) Log(Treasuries) Log(C&I Loans) Log(Loans and Leases) (1) (2) (3) (4) IOER Difference (pp) 0.634*** 0.396*** -0.410** -0.464*** (4.18) (3.17) (-2.31) (-3.24) Fixed Effects: Bank Yes Yes Yes Yes Quarter Yes Yes Yes Yes R-sq. 0.80 0.84 0.93 0.93 Observations 1,763 767 1,683 1,736
Results: Table II (updated): Assets of Foreign Banks in the U.S. (Call Report Data)
1 pp increase in IOER difference 41% decrease in C&I loans by foreign banks
Internal Capital Reallocation U.S. Dollar Swapping Activity
Dependent Variable: Log(Internal Lending) Log(Internal Borrowing) Log(FX Swap) Cost of FX Swap
(1) (2) (3) (4) IOER Difference (pp) -1.426*** 0.514*** 0.141*** 0.609*** (-4.83) (3.40) (5.15) (6.99) Fixed Effects: Bank Yes Yes Yes Yes Quarter Yes Yes Yes Yes R-sq. 0.674 0.79 0.914 0.865 Observations 770 1,247 70 70
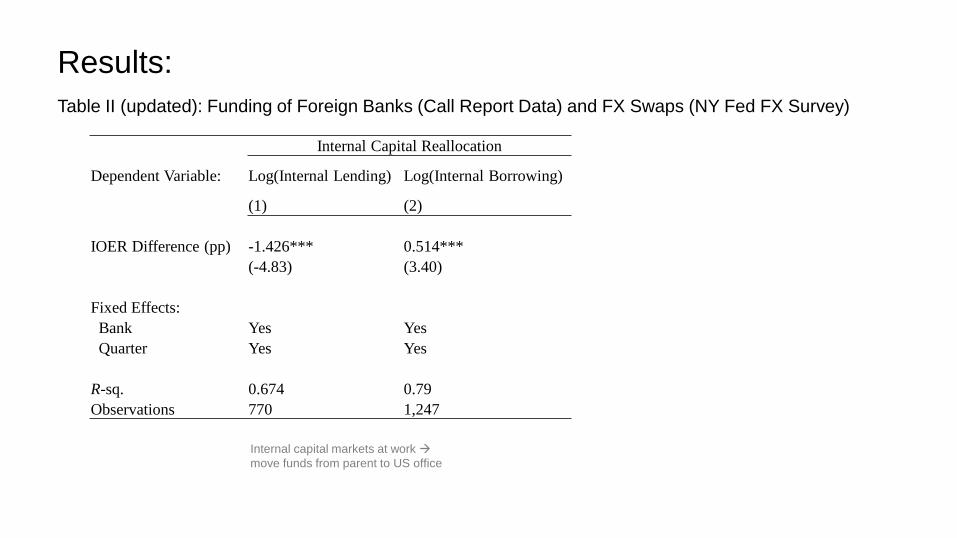
Results: Table II (updated): Funding of Foreign Banks (Call Report Data) and FX Swaps (NY Fed FX Survey)
Internal capital markets at work move funds from parent to US office
Internal Capital Reallocation U.S. Dollar Swapping Activity
Dependent Variable: Log(Internal Lending) Log(Internal Borrowing) Log(FX Swap) Cost of FX Swap
(1) (2) (3) (4) IOER Difference (pp) -1.426*** 0.514*** 0.141*** 0.609*** (-4.83) (3.40) (5.15) (6.99) Fixed Effects: Bank / Currency Yes Yes Yes Yes Quarter / Month Yes Yes Yes Yes R-sq. 0.674 0.79 0.914 0.865 Observations 770 1,247 70 70
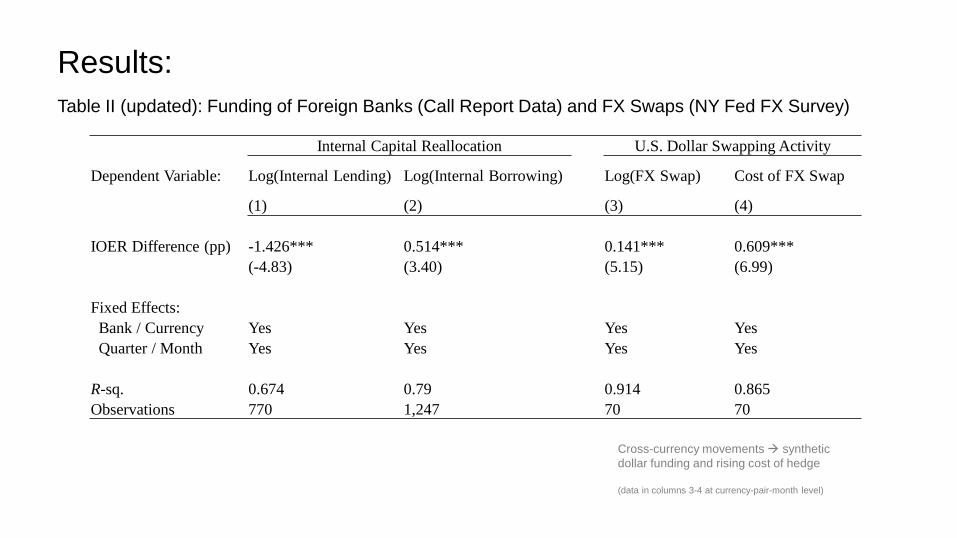
Results: Table II (updated): Funding of Foreign Banks (Call Report Data) and FX Swaps (NY Fed FX Survey)
Cross-currency movements synthetic dollar funding and rising cost of hedge (data in columns 3-4 at currency-pair-month level)

Results: Table III: Similar Pattern in Global Context using BIS data (US, GB, EA, JP, CH, CA)
Dependent Variable: Log(Claims on Firms) Log(Claims on Official Sector) FX Swap Volume (USD bn) (1) (2) (3) (4) (5) (6)
IOER Difference (pp) -0.101*** -0.131*** 0.067*** 0.159*** 16.059*** 11.832***
(-9.74) (-13.65) (3.25) (5.52) (7.31) (4.30) Spot FX Rate (USD) 0.675*** -- 0.640*** -- 42.073*** --
(10.98) (2.91) (3.15)
Fixed Effects: Quarter (t) Yes --
Yes --
Yes --
Country (j) Yes --
Yes --
Yes -- Banking Sector (i) Yes Yes
Yes Yes
Yes Yes
Country*Quarter (jt) -- Yes
-- Yes
-- Yes
Observations 1,023 1,023 1,019 1,019 848 848 R-squared 0.868 0.878 0.776 0.810 0.538 0.577
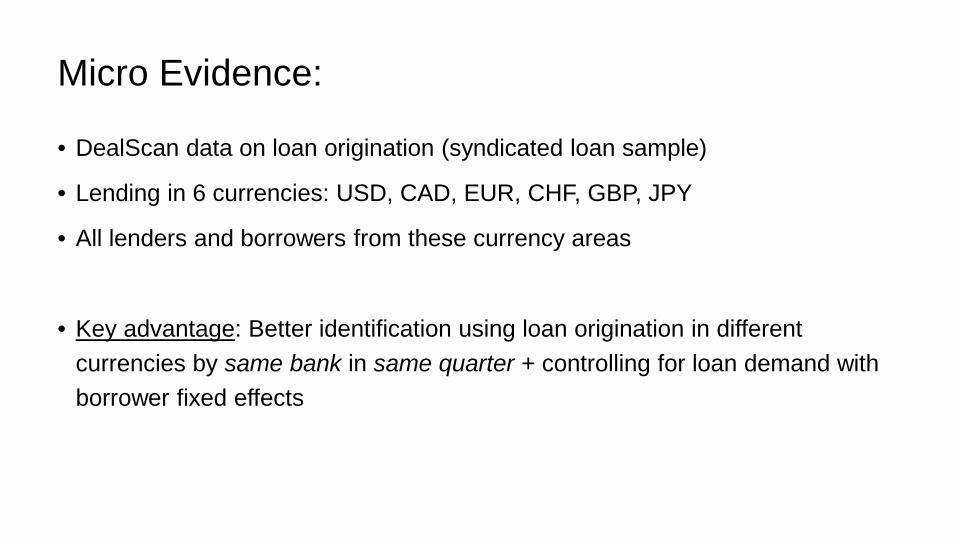
Micro Evidence:
• DealScan data on loan origination (syndicated loan sample)
• Lending in 6 currencies: USD, CAD, EUR, CHF, GBP, JPY
• All lenders and borrowers from these currency areas
• Key advantage: Better identification using loan origination in different currencies by same bank in same quarter + controlling for loan demand with borrower fixed effects
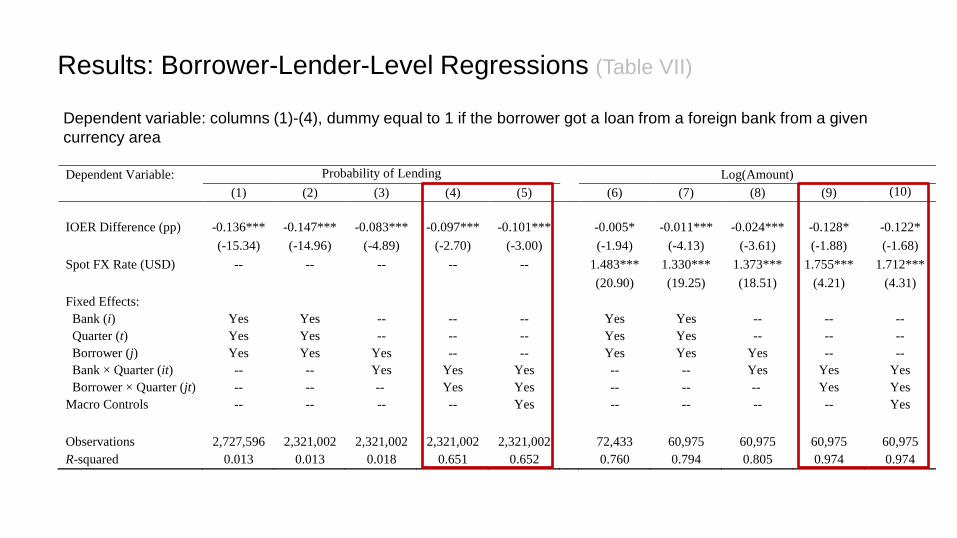
Results: Borrower-Lender-Level Regressions (Table VII)
Dependent variable: columns (1)-(4), dummy equal to 1 if the borrower got a loan from a foreign bank from a given currency area
Dependent Variable: Probability of Lending
Log(Amount) (1) (2) (3) (4) (5) (6) (7) (8) (9) (10)
IOER Difference (pp) -0.136*** -0.147*** -0.083*** -0.097*** -0.101***
-0.005* -0.011*** -0.024*** -0.128* -0.122*
(-15.34) (-14.96) (-4.89) (-2.70) (-3.00)
(-1.94) (-4.13) (-3.61) (-1.88) (-1.68)
Spot FX Rate (USD) -- -- -- -- --
1.483*** 1.330*** 1.373*** 1.755*** 1.712***
(20.90) (19.25) (18.51) (4.21) (4.31)
Fixed Effects:
Bank (i) Yes Yes -- -- --
Yes Yes -- -- --
Quarter (t) Yes Yes -- -- --
Yes Yes -- -- -- Borrower (j) Yes Yes Yes -- --
Yes Yes Yes -- --
Bank × Quarter (it) -- -- Yes Yes Yes
-- -- Yes Yes Yes Borrower × Quarter (jt) -- -- -- Yes Yes
-- -- -- Yes Yes
Macro Controls -- -- -- -- Yes -- -- -- -- Yes
Observations 2,727,596 2,321,002 2,321,002 2,321,002 2,321,002
72,433 60,975 60,975 60,975 60,975 R-squared 0.013 0.013 0.018 0.651 0.652 0.760 0.794 0.805 0.974 0.974

Results: Firm-Level Regressions (quarter following a positive IOER differential shock) (Table VIII)
US Firm
EA bank
US bank Example of RHS variable before foreign shock:
• If ECB cuts rate: Foreign Bank Reliance: 2/3 • If BOE cuts rate: Foreign Bank Reliance : 0
EA bank
• Question: Can a firm substitute a reduction in lending by accessing other banks?
• Foreign Bank Reliance: We look at composition of firm’s last syndicate before foreign rate cut (positive IOER differential shock)

Results: Table VIII: Firm-Level Regressions (quarter following a positive shock)
2-std larger share of foreign banks from country that changes rates probability of getting a loan drops by 13 percent and volume of loan drops by 8 percent
Further Results:
• The effects are stronger for banks with low capital (in line with theory)
• The effects are weaker for banks with better access to direct foreign funding (through subsidiaries or introduction of central bank swap lines)
• The effects are stronger for USD, but are not limited to USD
• Results are robust to alternative interest rate differentials (e.g., based on interbank overnight rate and government bond yields)

Dependent Variable: 3M Basis (pp) 1Y Basis (pp) 5Y Basis (pp)
(1) (2) (3) (4) (5) (6)
∆IOER Difference (pp) 0.098* 0.069* 0.151*** 0.130*** 0.125** 0.103***
(1.91) (1.69) (4.11) (5.52) (2.57) (3.17)
Fixed Effects
Currency Pair (𝐷𝐷𝑓𝑓𝑑𝑑) -- Yes -- Yes -- Yes
Observations 312 312 312 312 312 312 R-squared 0.012 0.589 0.052 0.745 0.021 0.714
IOER Differential and Violations of Covered Interest Parity
• Not formalized in model, but consistent with idea that monetary policy changes trigger large cross-currency movements that put pressure on FX swap markets
Final remarks:
• We provide a new insight into the operation of the international credit channel
• Earlier view: Global banks’ lending is defined solely by diversification
• Our view: There are currency effects (due to liquidity management and due to use of internal capital markets) impact the relative attractiveness of lending abroad
• With increasing cost of FX swaps and capital constraints, cross-border implications of monetary policy go in the opposite direction


![Lesson 13---banking-fed-monetary[1]](https://static.fdocuments.in/doc/165x107/55490856b4c9055d458b74e5/lesson-13-banking-fed-monetary1.jpg)