Monday, 27 June 2011 Asian Daily (Asia Edition)img.jrjimg.cn/2011/06/20110627151837223.pdf · Engro...
22
DISCLOSURE APPENDIX CONTAINS ANALYST CERTIFICATIONS AND THE STATUS OF NON-US ANALYSTS. FOR OTHER IMPORTANT DISCLOSURES, visit www.credit-suisse.com/ researchdisclosures or call +1 (877) 291-2683. U.S. Disclosure: Credit Suisse does and seeks to do business with companies covered in its research reports. As a result, investors should be aware that the Firm may have a conflict of interest that could affect the objectivity of this report. Investors should consider this report as only a single factor in making their investment decision. Monday, 27 June 2011 Asian Daily (Asia Edition) EPS, TP and Rating changes EPS TP (% change) T+1 T+2 Chg Up/Dn Rating Pacific Textiles 1 (2) 10 11 O (O) Tech Mahindra — R (R) DiGi (20) (22) 12 15 O (O) Thai Tap Water (6) (6) 1 31 O (N) C 3 : Connecting clients to corporates Hong Kong Sparkle Roll Group (0970.HK) Post results Date 29 June, Hong Kong Coverage Analyst Eva Wang Pacific Textiles (1382.HK) post result Date 30 June, Hong Kong Coverage Analyst Eva Wang Skyworth Digital (0751.HK) Post results Date 30-June - 04-July, Hong Kong Coverage Analyst Kenny Lau TCL Multimedia Technology Holdings Ltd Date 05 July, Hong Kong Coverage Analyst Kenny Lau Luk Fook Holdings International (0590.HK) Date 08 July, Hong Kong Coverage Analyst Gabriel Chan Singapore Sparkle Roll Group (0970.HK) Post results Date 04 July, Singapore Coverage Analyst Eva Wang Sound Global Ltd Date 04 July, Singapore Coverage Analyst Gerald Wong Skyworth Digital (0751.HK) Post results Date 05-07 July, Singapore Coverage Analyst Kenny Lau TCL Multimedia Technology Holdings Ltd Date 07 July, Singapore Coverage Analyst Kenny Lau Europe China Resources Gas Group Limited (1193.HK) Date 20-June - 01-July, Europe Coverage Analyst Edwin Pang Delta Electronics (2308.TW) Date 27-June - 01-July, London Coverage Analyst Pauline Chen San Miguel Corporation (SMC.PS) Date 30-June - 01-July, London Coverage Analyst Dante Tinga Indorama Ventures PCL(IVL.BK) Date 01 July, London Coverage Analyst Poom Suvarnatemee Sembcorp Marine Ltd. (SCMN.SI) Date 01-06 July, Europe Coverage Analyst Gerald Wong CLP Holdings Limited (0002.HK) Date 04-05 July, London Coverage Analyst Edwin Pang Others China/ HK Emerging Corporate Day Date 05 July, Hong Kong Coverage Analyst Kenny Lau Contact [email protected] or Your usual sales representative. Top of the pack ... China Market Strategy Jahanzeb Naseer (3) New report: Debt threats—The story so far China Market Strategy – Maintain OW Vincent Chan (4) Constraints on relaxation Asian Refining Sector Sanjay Mookim (5) New report: Two good years, at least United Tractors (UNTR IJ) – Maintain O Teddy Oetomo (6) Beneficiary of higher investments ... and the whole pack Regional Asian Refining Sector Sanjay Mookim (5) New report: Two good years, at least China China Market Strategy – Maintain OW Vincent Chan (4) Constraints on relaxation China Market Strategy Jahanzeb Naseer (3) New report: Debt threats—The story so far Hong Kong Pacific Textiles (1382 HK) – Maintain O Eva Wang (7) FY3/12 results in line; progress of expansion initiatives on track India India Market Strategy Neelkanth Mishra (8) Fuel price hikes: Deficits untouched India Oil and Gas Sector Sanjay Mookim (9) Fuel price increases – upstream, standalone refiners should see obvious benefits Tech Mahindra (TECHM IN) – R Manish Nigam (10) Analyst meet takeaways Indonesia United Tractors (UNTR IJ) – Maintain O Teddy Oetomo (6) Beneficiary of higher investments Malaysia DiGi (DIGI MK) – Maintain O Foong Wai Loke (11) A good hiding place? Pakistan Pakistan Fertiliser Sector – Maintain OW Farhan Rizvi, CFA (12) Engro analyst briefing: Enven achieves COD; FFC to benefit from upcoming urea price hike Singapore Singapore Market Strategy – Maintain UW Sean Quek, CFA (13) Tourist arrival growth remains robust South Korea Korea Oil Refining Sector – Maintain OW A-Hyung Cho (14) Benefit from tight refining dynamics ahead Thailand Thailand Market Strategy – Maintain MW Dan Fineman (15) Election scenario analysis
Transcript of Monday, 27 June 2011 Asian Daily (Asia Edition)img.jrjimg.cn/2011/06/20110627151837223.pdf · Engro...

DISCLOSURE APPENDIX CONTAINS ANALYST CERTIFICATIONS AND THE STATUS OF NON-US ANALYSTS. FOR OTHER IMPORTANT DISCLOSURES, visit www.credit-suisse.com/ researchdisclosures or call +1 (877) 291-2683. U.S. Disclosure: Credit Suisse does and seeks to do business with companies covered in its research reports. As a result, investors should be aware that the Firm may have a conflict of interest that could affect the objectivity of this report. Investors should consider this report as only a single factor in making their investment decision.
Monday, 27 June 2011
Asian Daily (Asia Edition)EPS, TP and Rating changes EPS TP (% change) T+1 T+2 Chg Up/Dn Rating Pacific Textiles 1 (2) 10 11 O (O) Tech Mahindra — R (R) DiGi (20) (22) 12 15 O (O) Thai Tap Water (6) (6) 1 31 O (N)
C3: Connecting clients to corporates
Hong Kong Sparkle Roll Group (0970.HK) Post results
Date 29 June, Hong Kong Coverage Analyst Eva Wang
Pacific Textiles (1382.HK) post result Date 30 June, Hong Kong Coverage Analyst Eva Wang
Skyworth Digital (0751.HK) Post results Date 30-June - 04-July, Hong Kong Coverage Analyst Kenny Lau
TCL Multimedia Technology Holdings Ltd Date 05 July, Hong Kong Coverage Analyst Kenny Lau
Luk Fook Holdings International (0590.HK) Date 08 July, Hong Kong Coverage Analyst Gabriel Chan
Singapore Sparkle Roll Group (0970.HK) Post results
Date 04 July, Singapore Coverage Analyst Eva Wang
Sound Global Ltd Date 04 July, Singapore Coverage Analyst Gerald Wong
Skyworth Digital (0751.HK) Post results Date 05-07 July, Singapore Coverage Analyst Kenny Lau
TCL Multimedia Technology Holdings Ltd Date 07 July, Singapore Coverage Analyst Kenny Lau
Europe China Resources Gas Group Limited (1193.HK)
Date 20-June - 01-July, Europe Coverage Analyst Edwin Pang
Delta Electronics (2308.TW) Date 27-June - 01-July, London Coverage Analyst Pauline Chen
San Miguel Corporation (SMC.PS) Date 30-June - 01-July, London Coverage Analyst Dante Tinga
Indorama Ventures PCL(IVL.BK) Date 01 July, London Coverage Analyst Poom Suvarnatemee
Sembcorp Marine Ltd. (SCMN.SI) Date 01-06 July, Europe Coverage Analyst Gerald Wong
CLP Holdings Limited (0002.HK) Date 04-05 July, London Coverage Analyst Edwin Pang
Others China/ HK Emerging Corporate Day
Date 05 July, Hong Kong Coverage Analyst Kenny Lau
Contact [email protected] or Your usual sales representative.
Top of the pack ...
China Market Strategy Jahanzeb Naseer (3) New report: Debt threats—The story so far
China Market Strategy – Maintain OW Vincent Chan (4) Constraints on relaxation
Asian Refining Sector Sanjay Mookim (5) New report: Two good years, at least
United Tractors (UNTR IJ) – Maintain O Teddy Oetomo (6) Beneficiary of higher investments
... and the whole pack Regional Asian Refining Sector Sanjay Mookim (5) New report: Two good years, at least
China China Market Strategy – Maintain OW Vincent Chan (4) Constraints on relaxation China Market Strategy Jahanzeb Naseer (3) New report: Debt threats—The story so far
Hong Kong Pacific Textiles (1382 HK) – Maintain O Eva Wang (7) FY3/12 results in line; progress of expansion initiatives on track
India India Market Strategy Neelkanth Mishra (8) Fuel price hikes: Deficits untouched India Oil and Gas Sector Sanjay Mookim (9) Fuel price increases – upstream, standalone refiners should see obvious benefits Tech Mahindra (TECHM IN) – R Manish Nigam (10) Analyst meet takeaways
Indonesia United Tractors (UNTR IJ) – Maintain O Teddy Oetomo (6) Beneficiary of higher investments
Malaysia DiGi (DIGI MK) – Maintain O Foong Wai Loke (11) A good hiding place?
Pakistan Pakistan Fertiliser Sector – Maintain OW Farhan Rizvi, CFA (12) Engro analyst briefing: Enven achieves COD; FFC to benefit from upcoming urea price hike
Singapore Singapore Market Strategy – Maintain UW Sean Quek, CFA (13) Tourist arrival growth remains robust
South Korea Korea Oil Refining Sector – Maintain OW A-Hyung Cho (14) Benefit from tight refining dynamics ahead
Thailand Thailand Market Strategy – Maintain MW Dan Fineman (15) Election scenario analysis
Monday, 27 June 2011
Asian Daily
- 2 of 22 -
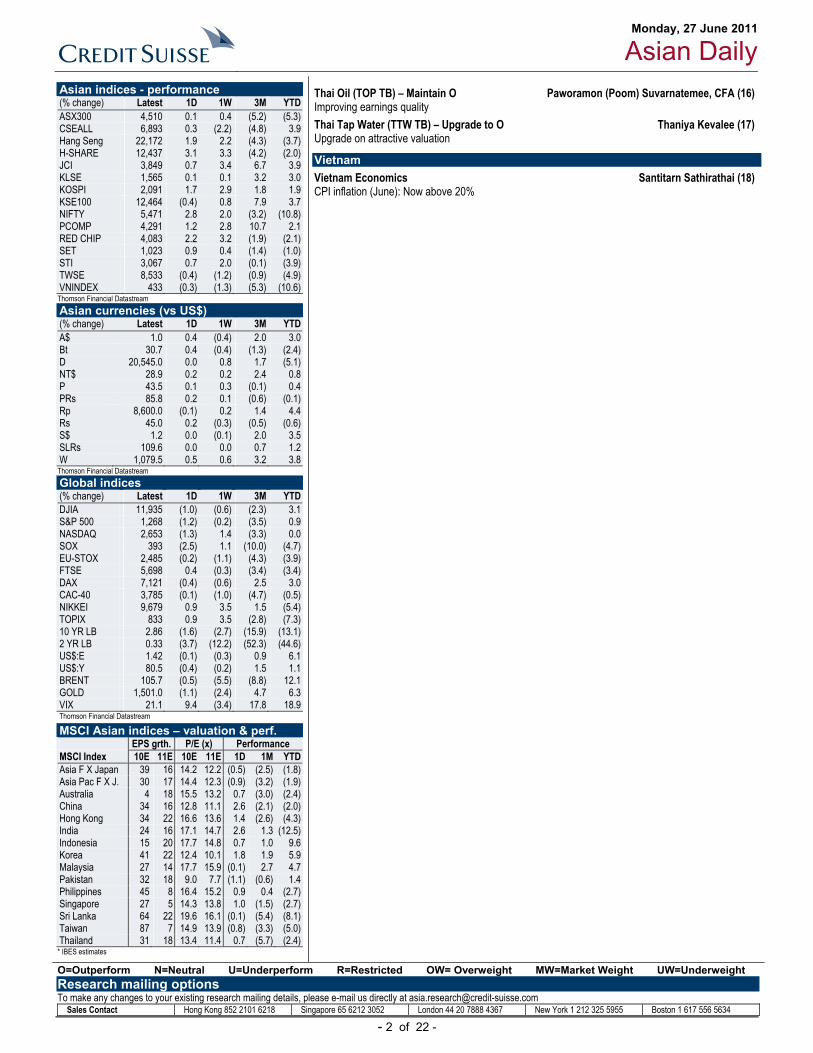
Asian indices - performance (% change) Latest 1D 1W 3M YTD ASX300 4,510 0.1 0.4 (5.2) (5.3) CSEALL 6,893 0.3 (2.2) (4.8) 3.9 Hang Seng 22,172 1.9 2.2 (4.3) (3.7) H-SHARE 12,437 3.1 3.3 (4.2) (2.0) JCI 3,849 0.7 3.4 6.7 3.9 KLSE 1,565 0.1 0.1 3.2 3.0 KOSPI 2,091 1.7 2.9 1.8 1.9 KSE100 12,464 (0.4) 0.8 7.9 3.7 NIFTY 5,471 2.8 2.0 (3.2) (10.8) PCOMP 4,291 1.2 2.8 10.7 2.1 RED CHIP 4,083 2.2 3.2 (1.9) (2.1) SET 1,023 0.9 0.4 (1.4) (1.0) STI 3,067 0.7 2.0 (0.1) (3.9) TWSE 8,533 (0.4) (1.2) (0.9) (4.9) VNINDEX 433 (0.3) (1.3) (5.3) (10.6)
Thomson Financial Datastream Asian currencies (vs US$) (% change) Latest 1D 1W 3M YTD A$ 1.0 0.4 (0.4) 2.0 3.0 Bt 30.7 0.4 (0.4) (1.3) (2.4) D 20,545.0 0.0 0.8 1.7 (5.1) NT$ 28.9 0.2 0.2 2.4 0.8 P 43.5 0.1 0.3 (0.1) 0.4 PRs 85.8 0.2 0.1 (0.6) (0.1) Rp 8,600.0 (0.1) 0.2 1.4 4.4 Rs 45.0 0.2 (0.3) (0.5) (0.6) S$ 1.2 0.0 (0.1) 2.0 3.5 SLRs 109.6 0.0 0.0 0.7 1.2 W 1,079.5 0.5 0.6 3.2 3.8
Thomson Financial Datastream Global indices (% change) Latest 1D 1W 3M YTD DJIA 11,935 (1.0) (0.6) (2.3) 3.1 S&P 500 1,268 (1.2) (0.2) (3.5) 0.9 NASDAQ 2,653 (1.3) 1.4 (3.3) 0.0 SOX 393 (2.5) 1.1 (10.0) (4.7) EU-STOX 2,485 (0.2) (1.1) (4.3) (3.9) FTSE 5,698 0.4 (0.3) (3.4) (3.4) DAX 7,121 (0.4) (0.6) 2.5 3.0 CAC-40 3,785 (0.1) (1.0) (4.7) (0.5) NIKKEI 9,679 0.9 3.5 1.5 (5.4) TOPIX 833 0.9 3.5 (2.8) (7.3) 10 YR LB 2.86 (1.6) (2.7) (15.9) (13.1) 2 YR LB 0.33 (3.7) (12.2) (52.3) (44.6) US$:E 1.42 (0.1) (0.3) 0.9 6.1 US$:Y 80.5 (0.4) (0.2) 1.5 1.1 BRENT 105.7 (0.5) (5.5) (8.8) 12.1 GOLD 1,501.0 (1.1) (2.4) 4.7 6.3 VIX 21.1 9.4 (3.4) 17.8 18.9
Thomson Financial Datastream
MSCI Asian indices – valuation & perf. EPS grth. P/E (x) Performance MSCI Index 10E 11E 10E 11E 1D 1M YTD Asia F X Japan 39 16 14.2 12.2 (0.5) (2.5) (1.8) Asia Pac F X J. 30 17 14.4 12.3 (0.9) (3.2) (1.9) Australia 4 18 15.5 13.2 0.7 (3.0) (2.4) China 34 16 12.8 11.1 2.6 (2.1) (2.0) Hong Kong 34 22 16.6 13.6 1.4 (2.6) (4.3) India 24 16 17.1 14.7 2.6 1.3 (12.5) Indonesia 15 20 17.7 14.8 0.7 1.0 9.6 Korea 41 22 12.4 10.1 1.8 1.9 5.9 Malaysia 27 14 17.7 15.9 (0.1) 2.7 4.7 Pakistan 32 18 9.0 7.7 (1.1) (0.6) 1.4 Philippines 45 8 16.4 15.2 0.9 0.4 (2.7) Singapore 27 5 14.3 13.8 1.0 (1.5) (2.7) Sri Lanka 64 22 19.6 16.1 (0.1) (5.4) (8.1) Taiwan 87 7 14.9 13.9 (0.8) (3.3) (5.0) Thailand 31 18 13.4 11.4 0.7 (5.7) (2.4)
* IBES estimates
Thai Oil (TOP TB) – Maintain O Paworamon (Poom) Suvarnatemee, CFA (16) Improving earnings quality Thai Tap Water (TTW TB) – Upgrade to O Thaniya Kevalee (17) Upgrade on attractive valuation
Vietnam Vietnam Economics Santitarn Sathirathai (18) CPI inflation (June): Now above 20%
O=Outperform N=Neutral U=Underperform R=Restricted OW= Overweight MW=Market Weight UW=Underweight Research mailing options To make any changes to your existing research mailing details, please e-mail us directly at [email protected]
Sales Contact Hong Kong 852 2101 6218 Singapore 65 6212 3052 London 44 20 7888 4367 New York 1 212 325 5955 Boston 1 617 556 5634

Monday, 27 June 2011
Asian Daily
- 3 of 22 -
Top of the pack ... China Market Strategy----------------------------------------------------------------------------------------- New report: Debt threats—The story so far Jahanzeb Naseer / Research Analyst / 852 2101 6554 / [email protected] Vincent Chan / Research Analyst / 852 2101 6568 / [email protected] Sanjay Jain / Research Analyst / 65 6212 3017 / [email protected] Daisy Wu / Research Analyst / 852 2101 7167 / [email protected]
● Following our downgrade of China growth and China banks, we have published 12 reports in the past week. Here, we bring the views together. For the full note, please click here.
● What has lead to the change of view? When we include off-balance sheet financing, the overall leverage in the economy appears unsustainable.
● Why is that a concern? This limits the government’s ability to ease policy even if inflation were to moderate, raising concerns about growth assumptions. Further, the credit-to-GDP ratio rising 10% above the long-term trend is a reliable danger signal.
● Banks have corrected already – isn’t it in the price? With growth at risk, excessive credit and SME cash flows under pressure, asset quality is bound to suffer. Credit cost of around 150 bp can wipe out all earnings growth for a few years. Consensus earnings are still looking at 15-20% growth.
● What should investors do here? There is still more downside risk to banks, property, infrastructure and steel stocks. Defensives such as telecoms, consumer and select insurance names should benefit.
What has led to our change of view on China? Figure 1: China – Credit and bank loan (x government bond)
6080
100120140160180
Mar 93 Mar 96 Mar 99 Mar 02 Mar 05 Mar 08 Mar 11
(% of GDP)
Credit-to-GDP Loan-to-GDP
Widened gap
* Credit includes bank loan, corporate bond and other off-balance sheet financing Source: PBOC, CEIC, BIS, Credit Suisse estimates
Why is excess leverage a problem? Figure 2:Credit-to-GDP gap from long-term trend
-30 -20 -10
0102030
Mar 00 Sep 01 Mar 03 Sep 04 Mar 06 Sep 07 Mar 09 Sep 10
(% points)
US China Japan Spain
Critical level - 10% points
Source: PBOC, IMF, CEIC, BIS, Credit Suisse estimates Local government debt is not generally included in credit to GDP; why are we including it? NPLs are at the risk of rising. Credit cost rise to even 150 bp or so can wipe out all earnings growth of a few years. Consensus earnings are
still looking at 15-20% growth. So, in Sanjay Jain’s view not all is reflected. Also, LGFV is not the only source for potential problems either. Our analysis of close to 1,000 SMEs suggests that cash flows are under pressure.
Figure 3: Proxy NPL ratio vs actual system NPL ratio
0%
5%
10%
15%
20%
25%
30%
1999
2000
2001
2002
2003
2004
2005
2006
2007
1H08
2008
1H09
2009
1H10
2010
1Q11
NPL ratio proxy
0%
5%
10%
15%
20%
25%
30%
1999
2000
2001
2002
2003
2004
2005
2006
2007
1H08
2008
1H09
2009
1H10
2010
1Q11
NPL ratio proxy
0%
5%
10%
15%
20%
25%
30%
1999
2000
2001
2002
2003
2004
2005
2006
2007
1H08
2008
1H09
2009
1H10
2010
1Q11
NPL ratio proxy Source: Credit Suisse estimates
Selling the rallies rather than buying the dips We believe that longer term there is still more downside to Chinese banks. The stocks have had a reasonable correction, but as in any downtrend we would be selling the rallies rather than buying the dips. Other sectors where follow-through pressure should be felt are China property, infrastructure stocks, electrical equipment makers and steel. For a full list of stock-level impact and analysis, please read our report, Debt Threats – Sector and stock level impact.
Links to other research published on this subject in the past one week: China Strategy – Debt Threats - Rising Banks - Downgrading banks on asset quality concerns Debt Threats – Sector and stock level impact Economics - China - Slowing for longer China Banks - SHIBOR spiked, funding probably gets tougher in 2H11 Strategy - Debt threats - Credit overhang Strategy - Changes to China model portfolio Strategy - Debt threats- possible scenarios Strategy - Investor survey at the CIC luncheon — Results Strategy - Why Credit-to-GDP ratio matters Chinese Whispers – Monthly Survey Series on China

Monday, 27 June 2011
Asian Daily
- 4 of 22 -
China Market Strategy------------------------------------------------------- Maintain OVERWEIGHT Constraints on relaxation Vincent Chan / Research Analyst / 852 2101 6568 / [email protected] Peggy Chan, CFA / Research Analyst / 852 2101 6305 / [email protected]
● Premier Wen Jiabao’s comment on inflation being ‘under control’ has boosted expectation that another round of monetary/fiscal policy relaxation is approaching. We doubt it.
● Most importantly, the condition of the Chinese economy has significantly changed now, compared to end-2004 and 2008 when the last two rounds of relaxation took place. Factors such as inflation, credit, lower government indebtedness, investment ratio and property prices are now much less favourable.
● We still believe that the most rational government policy ahead is to keep an overall tight monetary/fiscal policy with pockets of relaxation for select sectors, such that the economic growth can be kept at a socially acceptable level while allowing continuous structural economic reforms.
China’s stock market was boosted by Premier Wen Jiabao’s comment that inflation in China is ‘under control’ and will come down in the next couple of months. Technically, we don’t really disagree with this comment; the question though is how fast (or slow) CPI inflation is coming down. The stock market reacted very positively to this comment, expecting that this would open the door for monetary and fiscal policy relaxation, and a repeat of the bull market seen in August 2004 and October 2008. However, we think a lot has changed in the Chinese economy, compared to those two periods, and constraints of policy relaxation is much stronger now than before. (1) Inflation being structural. A distinct characteristic of this round of inflation is that it is much more widespread to many other segments, instead of just a food inflation problem like the last two cycles. Indeed, the key reason for inflation now is the excess liquidity created in the economy during 2008/2009, while the government’s tightening measures in last one-and-a-half year have not been very successful in taking them away from the system. In this case, inflation will be very sticky and will be with us (probably at around 4-5% level), not just in next few quarters, but in next few years. (2) Too much credit is already in the system. As we argued in our report, China Market Strategy: Debt threats—rising,’ published on 20 June 2011, the pace of increase in credit in China’s financial system has reached quite a dangerous level, and leaves little room for further rise in the credit-to-GDP ratio. This was not the case in late 2004 and 2008.
(3) Local government debt. In a related development, the local government debt was a much smaller problem during end-2004 and 2008 compared to now. This means that the key ‘trick’ of the last stimulus programme in late 2008 – i.e., central government gives an approval to a certain project and the local government is using this approval to borrow money from the banks to complete it – will find it difficult to be repeated. One should expect huge reluctance from the banks to finance such projects again. (4) Fixed-investment ratio. During end-2004 and 2008, while China’s fixed-investment ratio (represented by GFCF as a percentage of GDP) was high at around 39%, it jumped to over 46% in 2010. Indeed, if the land value of the projects is included, represented by FAI as a percentage of GDP, it surged from 41% in 2003 to 71% in 2010. It is very difficult to see how to boost investment on this basis, without causing massive long-term problems. (5) Residential property prices. The Residential property prices in major cities are now 3x the level in late 2004 and 50% above the level in late 2008. The efforts of the Chinese residential property market from 2004 onwards have basically been completely failed, and most residential properties in all major cities have now become investment vehicles for top 10-15% of population – the mid-to-low income group simply cannot afford them. Another round of monetary stimulus is going to get the situation much worse. So, what is the most likely course left behind? As we argued in our 20 June report mentioned above, a generally tight monetary/fiscal policy with pockets of relaxation will help select sectors (such as social housing and SME financing) to keep economic growth at the low end of an acceptable growth level of around 8-8.5%, allowing the economy to digest the excesses created in previous years while undergoing the necessarily economic restructuring; this appears to be the only sensible solution ahead. This is also our base-case scenario, but we don’t think this is the market’s expectation. Alternatively, if the government decides to launch another full-scale relaxation, boosting loan growth to another 15-20% level, investment ratio and property prices even higher, while in near-term the economy and the stock market would look strong, the risk of a future hard landing would rise substantially.
Figure 1: Stronger constraints on relaxation now Aug-04 Oct-08 May-11CPI inflation (%) 5.5 4.0 5.5 Food 11.7 8.5 11.7 Non-food 2.2 1.6 2.9 Credit-to-GDP (%, previous quarter) 125.3 116.0 166.1 Bank loan-to-GDP (%, previous quarter) 122.6 106.2 132.5 Local govt & central ministry ‘corporate’ debt (% of GDP, estimated) 5-10 10-15 25-30Investment as % of GDP (previous year) Fixed asset investment (FAI, inc. land value) 40.7 51.7 70.5 Gross fixed capital formation (GFCF, ex. land value) 39.1 39.1 46.2 Residential property price of key cities (May-04 = 100)* 103.4 197.6 311.9 * Simple average of secondary market property prices of Beijing, Shanghai, Guangzhou & Shenzhen. Source: CEIC, Centaline, BIS, IMF, Credit Suisse estimates
Monday, 27 June 2011
Asian Daily
- 5 of 22 -
Asian Refining Sector ----------------------------------------------------------------------------------------- New report: Two good years, at least Sanjay Mookim / Research Analyst / 9122 6777 3806 / [email protected] Saurabh Mishra / Research Analyst / 91 22 6777 3894 / [email protected] A-Hyung Cho / Research Analyst / 822 3707 3735 / [email protected] Paworamon (Poom) Suvarnatemee, CFA / Research Analyst / 662 614 6210 / [email protected] Sidney Yeh / Research Analyst / 886 2 2715 6368 / [email protected]
● Refining capacity additions in 2011 and 2012 are expected to be at low rates (at 0.7% CAGR, 1.2% CAGR in 2004-10.) Supply momentum should bottom around 4Q12. On headline, capacity growth may pick up in 2013/14 (1.6% CAGR). However, these are 1) several quarters away and 2) as typical, susceptible to delay.
● Oil demand growth has been very strong (up 3.75% YoY) in 2H10. Macro risks to demand (OECD, China growth concerns) seem to be increasing, but the ‘capacity’ hurdle rate (0.7%, compared to 1.8% CAGR 2000-07) is not high.
● Continued power shortages in China, strong ‘Other Asia’ and growing Indian oil demand can provide base for demand growth to exceed supply growth near term. On base case, we continue to see refining utilisations improving for at least the next two years.
● Seasonal strength in margins should kick in around 4Q11/1Q12. Most Asian refining stocks had a good run late last year, with large EPS upgrades; some already above mid-cycle valuations. We prefer stocks with low implied expectations – Thai Oil, RIL, SK Innovation. (Though these may be inexpensive for individual reasons). Korea’s S-OIL displayed the largest sensitivity to margins. A fall in crude can lead to stock losses, proving a near term risk. For full report, click here.
Valuation metrics Company Ticker CS Price Year P/E (x) P/B Rating Local Target T T+1 T+2 (x)S-Oil 010950 KS O 138,500 190,000 12/09 20.2 8.0 3.4RIL RIL IN O 870.7 1,142 03/11 12.5 10.5 1.7TOP TOP TB O 72.50 99.00 12/10 8.7 10.3 1.8SK Innovation 096770 KS O 206,500 300,000 12/09 15.0 7.4 2.2Note: O = OUTPERFORM, N = NEUTRAL, U = UNDERPERFORM Source: Company data, Credit Suisse estimates Slowing capacity momentum On paper, there is material refining capacity growth in 2013/14 – a potential 3 mbopd of addition, for 1.6% CAGR. We count another 3 mbopd of proposed capacity adds during the same period (or a little later); but believe these are unlikely to be built, or built on time. Large capacity additions have historically been delayed, and their impact has been more spread out. Without immediately worrying about 2013/14, we are encouraged by the lack of capacity growth near term. After growing 1.2% CAGR over 2004-10, net global refining capacity growth is expected to slow to 0.7% for 2011/12 (with refining closures of c.0.6-0.7 mbopd still due). We see refining capacity growth momentum bottoming around 4Q12, providing a clear run for refiners to benefit from the ongoing economic recovery, and any improvement in global oil demand. Demand strong (but at risk?) Arguably, the outlook for demand is a little shaky. Coming off extremely strong growth (3.75% YoY) in 2H10, preliminary data suggests 1Q11 growth has slowed to 2.3% YoY. Anecdotal evidence indicates weak gasoline demand in the US; and economic growth concerns in OECD and China cloud oil demand outlook. Yet, we note hurdle rates are not high – demand needs to grow only 0.7% CAGR to outpace net refining capacity creation in 2011/12 (compared to 1.8%
growth between 2000 and 2007). While current high oil prices are a concern, CS base case oil demand forecasts incorporate a slow down, and have demand growing 1.5% CAGR 2013-15 from 3% in 2010. Near term, we see upside risks from the much anticipated 2H economic recovery, continuation of Chinese power shortages and 2H seasonality.
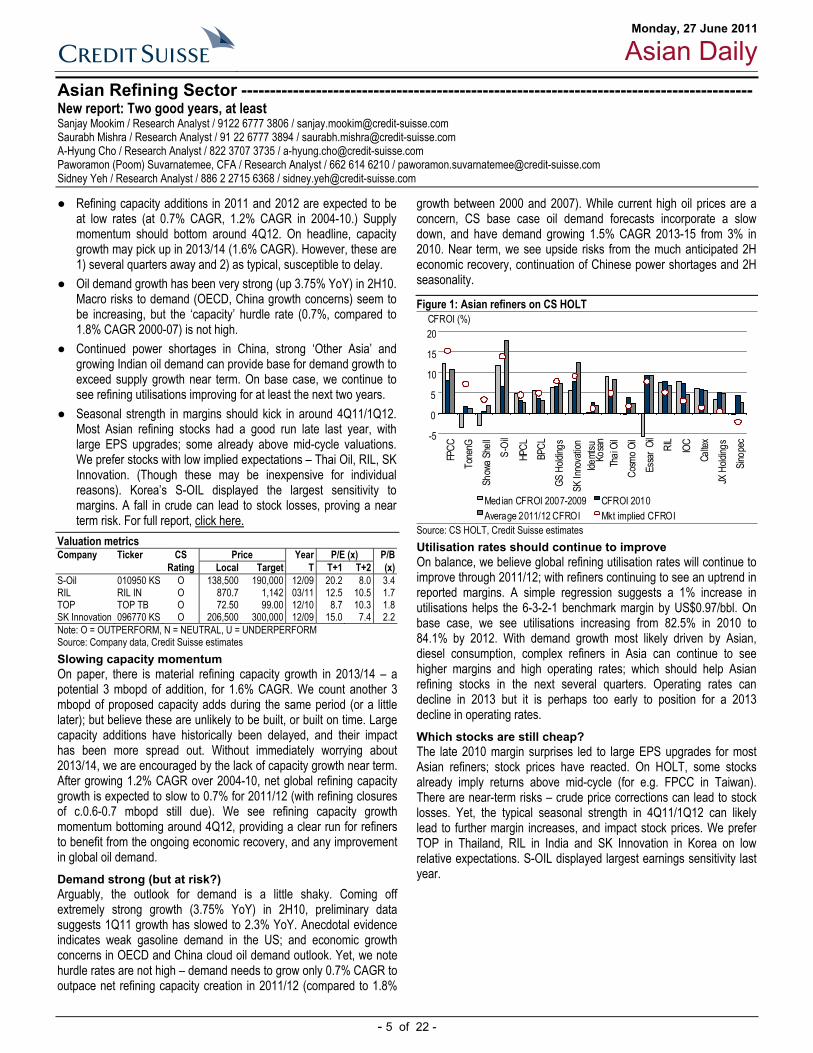
Figure 1: Asian refiners on CS HOLT
-5
0
5
10
15
20
FPCC
Tone
nGSh
owa S
hell
S-Oi
l
HPCL
BPCL
GS H
olding
sSK
Inno
vatio
nIde
mtsu
Kosa
nTh
ai Oi
lCo
smo O
ilEs
sarO
ilRI
L
IOC
Calte
xJX
Hold
ings
Sinop
ec
Median CFROI 2007-2009 CFROI 2010Average 2011/12 CFROI Mkt implied CFROI
CFROI (%)
Source: CS HOLT, Credit Suisse estimates Utilisation rates should continue to improve On balance, we believe global refining utilisation rates will continue to improve through 2011/12; with refiners continuing to see an uptrend in reported margins. A simple regression suggests a 1% increase in utilisations helps the 6-3-2-1 benchmark margin by US$0.97/bbl. On base case, we see utilisations increasing from 82.5% in 2010 to 84.1% by 2012. With demand growth most likely driven by Asian, diesel consumption, complex refiners in Asia can continue to see higher margins and high operating rates; which should help Asian refining stocks in the next several quarters. Operating rates can decline in 2013 but it is perhaps too early to position for a 2013 decline in operating rates. Which stocks are still cheap? The late 2010 margin surprises led to large EPS upgrades for most Asian refiners; stock prices have reacted. On HOLT, some stocks already imply returns above mid-cycle (for e.g. FPCC in Taiwan). There are near-term risks – crude price corrections can lead to stock losses. Yet, the typical seasonal strength in 4Q11/1Q12 can likely lead to further margin increases, and impact stock prices. We prefer TOP in Thailand, RIL in India and SK Innovation in Korea on low relative expectations. S-OIL displayed largest earnings sensitivity last year.
Monday, 27 June 2011
Asian Daily
- 6 of 22 -
United Tractors --------------------------------------------------------------- Maintain OUTPERFORM Beneficiary of higher investments EPS: ◄► TP: ◄► Teddy Oetomo / Research Analyst / 6221 2553 7911 / [email protected] Dian Haryokusumo / Research Analyst / 62 21 255 37974 / [email protected]
● We expect significant potential upside to UNTR's construction machinery sales volume if Indonesia enters a higher investment phase, above its current robust outlook in mining operations.
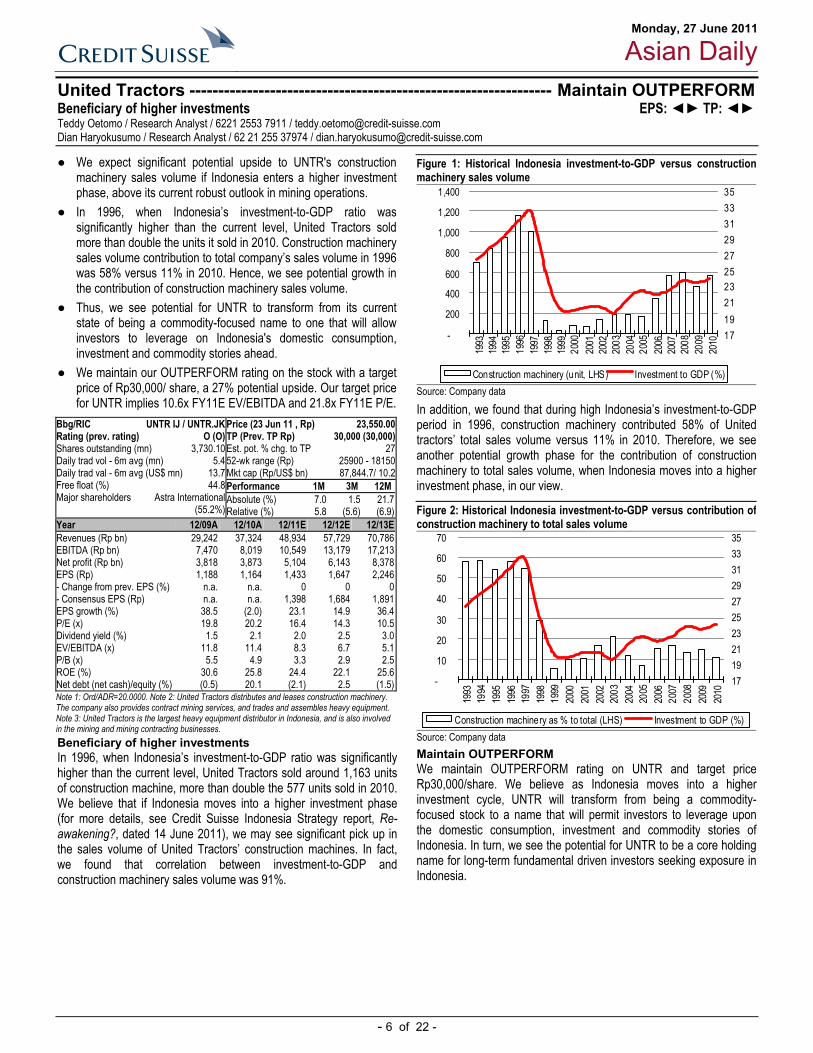
● In 1996, when Indonesia’s investment-to-GDP ratio was significantly higher than the current level, United Tractors sold more than double the units it sold in 2010. Construction machinery sales volume contribution to total company’s sales volume in 1996 was 58% versus 11% in 2010. Hence, we see potential growth in the contribution of construction machinery sales volume.
● Thus, we see potential for UNTR to transform from its current state of being a commodity-focused name to one that will allow investors to leverage on Indonesia's domestic consumption, investment and commodity stories ahead.
● We maintain our OUTPERFORM rating on the stock with a target price of Rp30,000/ share, a 27% potential upside. Our target price for UNTR implies 10.6x FY11E EV/EBITDA and 21.8x FY11E P/E.
Beneficiary of higher investments In 1996, when Indonesia’s investment-to-GDP ratio was significantly higher than the current level, United Tractors sold around 1,163 units of construction machine, more than double the 577 units sold in 2010. We believe that if Indonesia moves into a higher investment phase (for more details, see Credit Suisse Indonesia Strategy report, Re-awakening?, dated 14 June 2011), we may see significant pick up in the sales volume of United Tractors’ construction machines. In fact, we found that correlation between investment-to-GDP and construction machinery sales volume was 91%.
Figure 1: Historical Indonesia investment-to-GDP versus construction machinery sales volume
-
200
400
600
800
1,000
1,200
1,400
1993
1994
1995
1996
1997
1998
1999
2000
2001
2002
2003
2004
2005
2006
2007
2008
2009
2010 17
192123252729313335
Construction machinery (unit, LHS) Investment to GDP (%) Source: Company data
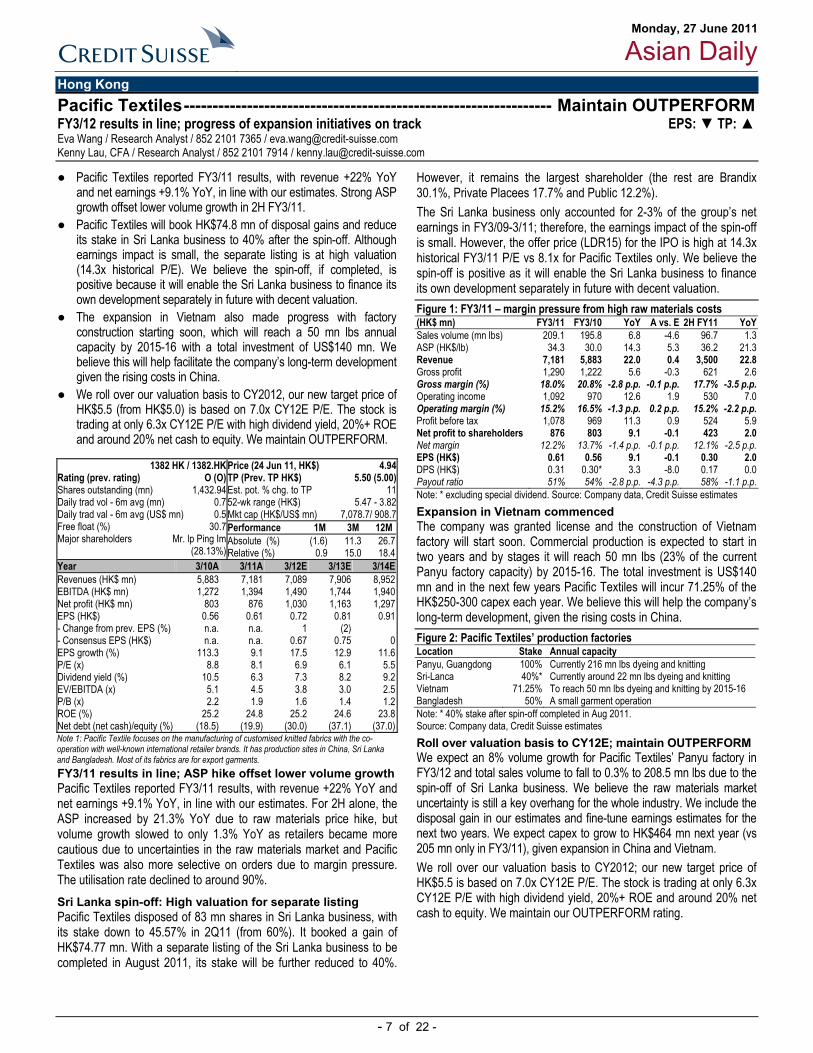
In addition, we found that during high Indonesia’s investment-to-GDP period in 1996, construction machinery contributed 58% of United tractors’ total sales volume versus 11% in 2010. Therefore, we see another potential growth phase for the contribution of construction machinery to total sales volume, when Indonesia moves into a higher investment phase, in our view.
Figure 2: Historical Indonesia investment-to-GDP versus contribution of construction machinery to total sales volume
-
10
20
30
40
50
60
70
1993
1994
1995
1996
1997
1998
1999
2000
2001
2002
2003
2004
2005
2006
2007
2008
2009
2010
17192123252729313335
Construction machinery as % to total (LHS) Investment to GDP (%)Source: Company data Maintain OUTPERFORM We maintain OUTPERFORM rating on UNTR and target price Rp30,000/share. We believe as Indonesia moves into a higher investment cycle, UNTR will transform from being a commodity-focused stock to a name that will permit investors to leverage upon the domestic consumption, investment and commodity stories of Indonesia. In turn, we see the potential for UNTR to be a core holding name for long-term fundamental driven investors seeking exposure in Indonesia.
Price (23 Jun 11 , Rp) 23,550.00TP (Prev. TP Rp) 30,000 (30,000) Est. pot. % chg. to TP 2752-wk range (Rp) 25900 - 18150Mkt cap (Rp/US$ bn) 87,844.7/ 10.2
Bbg/RIC UNTR IJ / UNTR.JK Rating (prev. rating) O (O) Shares outstanding (mn) 3,730.10 Daily trad vol - 6m avg (mn) 5.4 Daily trad val - 6m avg (US$ mn) 13.7 Free float (%) 44.8 Major shareholders Astra International
(55.2%)
Performance 1M 3M 12MAbsolute (%) 7.0 1.5 21.7Relative (%) 5.8 (5.6) (6.9)
Year 12/09A 12/10A 12/11E 12/12E 12/13ERevenues (Rp bn) 29,242 37,324 48,934 57,729 70,786EBITDA (Rp bn) 7,470 8,019 10,549 13,179 17,213Net profit (Rp bn) 3,818 3,873 5,104 6,143 8,378EPS (Rp) 1,188 1,164 1,433 1,647 2,246- Change from prev. EPS (%) n.a. n.a. 0 0 0- Consensus EPS (Rp) n.a. n.a. 1,398 1,684 1,891EPS growth (%) 38.5 (2.0) 23.1 14.9 36.4P/E (x) 19.8 20.2 16.4 14.3 10.5Dividend yield (%) 1.5 2.1 2.0 2.5 3.0EV/EBITDA (x) 11.8 11.4 8.3 6.7 5.1P/B (x) 5.5 4.9 3.3 2.9 2.5ROE (%) 30.6 25.8 24.4 22.1 25.6Net debt (net cash)/equity (%) (0.5) 20.1 (2.1) 2.5 (1.5) Note 1: Ord/ADR=20.0000. Note 2: United Tractors distributes and leases construction machinery. The company also provides contract mining services, and trades and assembles heavy equipment. Note 3: United Tractors is the largest heavy equipment distributor in Indonesia, and is also involved in the mining and mining contracting businesses.
Monday, 27 June 2011
Asian Daily
- 7 of 22 -
Hong Kong Pacific Textiles---------------------------------------------------------------- Maintain OUTPERFORM FY3/12 results in line; progress of expansion initiatives on track EPS: ▼ TP: ▲ Eva Wang / Research Analyst / 852 2101 7365 / [email protected] Kenny Lau, CFA / Research Analyst / 852 2101 7914 / [email protected]
● Pacific Textiles reported FY3/11 results, with revenue +22% YoY and net earnings +9.1% YoY, in line with our estimates. Strong ASP growth offset lower volume growth in 2H FY3/11.
● Pacific Textiles will book HK$74.8 mn of disposal gains and reduce its stake in Sri Lanka business to 40% after the spin-off. Although earnings impact is small, the separate listing is at high valuation (14.3x historical P/E). We believe the spin-off, if completed, is positive because it will enable the Sri Lanka business to finance its own development separately in future with decent valuation.
● The expansion in Vietnam also made progress with factory construction starting soon, which will reach a 50 mn lbs annual capacity by 2015-16 with a total investment of US$140 mn. We believe this will help facilitate the company’s long-term development given the rising costs in China.
● We roll over our valuation basis to CY2012, our new target price of HK$5.5 (from HK$5.0) is based on 7.0x CY12E P/E. The stock is trading at only 6.3x CY12E P/E with high dividend yield, 20%+ ROE and around 20% net cash to equity. We maintain OUTPERFORM.
FY3/11 results in line; ASP hike offset lower volume growth
Pacific Textiles reported FY3/11 results, with revenue +22% YoY and net earnings +9.1% YoY, in line with our estimates. For 2H alone, the ASP increased by 21.3% YoY due to raw materials price hike, but volume growth slowed to only 1.3% YoY as retailers became more cautious due to uncertainties in the raw materials market and Pacific Textiles was also more selective on orders due to margin pressure. The utilisation rate declined to around 90%. Sri Lanka spin-off: High valuation for separate listing Pacific Textiles disposed of 83 mn shares in Sri Lanka business, with its stake down to 45.57% in 2Q11 (from 60%). It booked a gain of HK$74.77 mn. With a separate listing of the Sri Lanka business to be completed in August 2011, its stake will be further reduced to 40%.
However, it remains the largest shareholder (the rest are Brandix 30.1%, Private Placees 17.7% and Public 12.2%). The Sri Lanka business only accounted for 2-3% of the group’s net earnings in FY3/09-3/11; therefore, the earnings impact of the spin-off is small. However, the offer price (LDR15) for the IPO is high at 14.3x historical FY3/11 P/E vs 8.1x for Pacific Textiles only. We believe the spin-off is positive as it will enable the Sri Lanka business to finance its own development separately in future with decent valuation. Figure 1: FY3/11 – margin pressure from high raw materials costs (HK$ mn) FY3/11 FY3/10 YoY A vs. E 2H FY11 YoYSales volume (mn lbs) 209.1 195.8 6.8 -4.6 96.7 1.3ASP (HK$/lb) 34.3 30.0 14.3 5.3 36.2 21.3Revenue 7,181 5,883 22.0 0.4 3,500 22.8Gross profit 1,290 1,222 5.6 -0.3 621 2.6Gross margin (%) 18.0% 20.8% -2.8 p.p. -0.1 p.p. 17.7% -3.5 p.p.Operating income 1,092 970 12.6 1.9 530 7.0Operating margin (%) 15.2% 16.5% -1.3 p.p. 0.2 p.p. 15.2% -2.2 p.p.Profit before tax 1,078 969 11.3 0.9 524 5.9Net profit to shareholders 876 803 9.1 -0.1 423 2.0Net margin 12.2% 13.7% -1.4 p.p. -0.1 p.p. 12.1% -2.5 p.p.EPS (HK$) 0.61 0.56 9.1 -0.1 0.30 2.0DPS (HK$) 0.31 0.30* 3.3 -8.0 0.17 0.0Payout ratio 51% 54% -2.8 p.p. -4.3 p.p. 58% -1.1 p.p.Note: * excluding special dividend. Source: Company data, Credit Suisse estimates Expansion in Vietnam commenced The company was granted license and the construction of Vietnam factory will start soon. Commercial production is expected to start in two years and by stages it will reach 50 mn lbs (23% of the current Panyu factory capacity) by 2015-16. The total investment is US$140 mn and in the next few years Pacific Textiles will incur 71.25% of the HK$250-300 capex each year. We believe this will help the company’s long-term development, given the rising costs in China. Figure 2: Pacific Textiles’ production factories Location Stake Annual capacity Panyu, Guangdong 100% Currently 216 mn lbs dyeing and knitting Sri-Lanca 40%* Currently around 22 mn lbs dyeing and knitting Vietnam 71.25% To reach 50 mn lbs dyeing and knitting by 2015-16 Bangladesh 50% A small garment operation Note: * 40% stake after spin-off completed in Aug 2011. Source: Company data, Credit Suisse estimates Roll over valuation basis to CY12E; maintain OUTPERFORM We expect an 8% volume growth for Pacific Textiles’ Panyu factory in FY3/12 and total sales volume to fall to 0.3% to 208.5 mn lbs due to the spin-off of Sri Lanka business. We believe the raw materials market uncertainty is still a key overhang for the whole industry. We include the disposal gain in our estimates and fine-tune earnings estimates for the next two years. We expect capex to grow to HK$464 mn next year (vs 205 mn only in FY3/11), given expansion in China and Vietnam. We roll over our valuation basis to CY2012; our new target price of HK$5.5 is based on 7.0x CY12E P/E. The stock is trading at only 6.3x CY12E P/E with high dividend yield, 20%+ ROE and around 20% net cash to equity. We maintain our OUTPERFORM rating.
Price (24 Jun 11, HK$) 4.94TP (Prev. TP HK$) 5.50 (5.00) Est. pot. % chg. to TP 1152-wk range (HK$) 5.47 - 3.82Mkt cap (HK$/US$ mn) 7,078.7/ 908.7
1382 HK / 1382.HK Rating (prev. rating) O (O) Shares outstanding (mn) 1,432.94 Daily trad vol - 6m avg (mn) 0.7 Daily trad val - 6m avg (US$ mn) 0.5 Free float (%) 30.7 Major shareholders Mr. lp Ping Im
(28.13%)
Performance 1M 3M 12MAbsolute (%) (1.6) 11.3 26.7Relative (%) 0.9 15.0 18.4
Year 3/10A 3/11A 3/12E 3/13E 3/14ERevenues (HK$ mn) 5,883 7,181 7,089 7,906 8,952EBITDA (HK$ mn) 1,272 1,394 1,490 1,744 1,940Net profit (HK$ mn) 803 876 1,030 1,163 1,297EPS (HK$) 0.56 0.61 0.72 0.81 0.91- Change from prev. EPS (%) n.a. n.a. 1 (2) - Consensus EPS (HK$) n.a. n.a. 0.67 0.75 0EPS growth (%) 113.3 9.1 17.5 12.9 11.6P/E (x) 8.8 8.1 6.9 6.1 5.5Dividend yield (%) 10.5 6.3 7.3 8.2 9.2EV/EBITDA (x) 5.1 4.5 3.8 3.0 2.5P/B (x) 2.2 1.9 1.6 1.4 1.2ROE (%) 25.2 24.8 25.2 24.6 23.8Net debt (net cash)/equity (%) (18.5) (19.9) (30.0) (37.1) (37.0) Note 1: Pacific Textile focuses on the manufacturing of customised knitted fabrics with the co-operation with well-known international retailer brands. It has production sites in China, Sri Lanka and Bangladesh. Most of its fabrics are for export garments.

Monday, 27 June 2011
Asian Daily
- 8 of 22 -
India India Market Strategy ------------------------------------------------------------------------------------------ Fuel price hikes: Deficits untouched Neelkanth Mishra / Research Analyst / 9122 6777 3716 / [email protected] Karthik Visvanathan / Research Analyst / 91 22 6777 3869 / [email protected] Akshay Saxena / Research Analyst / 91 22 6777 3825 / [email protected]
● On 24 June, the government approved steps to reduce losses for PSU refiners: a combination of price hikes and duty cuts. It raised diesel prices by 8% and LPG and kerosene prices by 16%. Also, the government cut customs duty on petroleum products and crude, and excise duty on diesel.
● The increases were a bit lower than the 10% expected in diesel, but are welcome. Credit Suisse India Oil & Gas analyst Sanjay Mookim estimates total under-recoveries fall by US$5.3 bn for the rest of 9M FY12. Cut in duties should benefit oil PSUs.
● The cut in duties effectively means government pays 100% of the under-recoveries. Worse, the cut in crude duty is very broad. Net result – fiscal deficit expectations are unchanged (5.5% of GDP vs 4.6% target: all else unchanged, and if crude stays at US$110).
● First round WPI impact 64 bp: Diesel is likely to drive a second round of impact via freight. Diesel prices in India have lagged international crude prices by far (Figure 3), and we may be done for another year. Diesel car makers may take a breather, but the trend should continue.
● The step would be negative for telecoms companies (Idea, RCom, Bharti: 2-4% EPS impact – diesel gensets for towers) and banks (100 bp increase in bond yields impacts earnings by 5-15%: SBI, BoI would be the most impacted).
Impact on fiscal deficit more than the impact on subsidy Figure 1: Impact on fiscal deficit calculation (Rs bn) 4Q11 1Q12 2Q12 3Q12 FY12 budgetUnder-recoveries 450 250 250 Government contribution 50% 50% 50% Subsidy 200 225 125 125 675% of GDP 0.2% 0.3% 0.1% 0.1% 0.8%Impact of duty cuts (9M) 368% of GDP 0.4%Total Increase (excl. 0.2% already budgeted) 0.9%Source: Company data, Credit Suisse estimates Fuel prices raised; duties re-jigged to help PSU refiners On 24 June, the government approved steps to reduce losses for PSU refiners. These were a combination of price hikes and duty cuts: ● Diesel prices were hiked by 8% (Rs3/litre impact at the pump ex.
taxes), LPG by 16% (Rs50/cylinder) and kerosene by 16% (Rs2/litre).
● Customs duty on petroleum products were cut by 5% (from 7.5% to 2.5% and from 10% to 5%) The 5% duty on crude has been done away with. Excise duty on diesel has been cut from Rs4.6/litre to Rs2/litre.
The price increases were somewhat lower than the 10% expected in diesel, but should be welcome. CS India Oil & Gas analyst Sanjay Mookim estimates total under-recoveries fall by US$5.3 bn for the rest of FY12, a minor blip on the earlier estimated FY12 under-recoveries of US$36-40 bn. The FY12 estimate would now be US$17 bn vs US$23 bn earlier: with 1Q over, US$10 bn has already crystallised.
Sanjay estimates that the duty cuts add up to US$11 bn annualised. On the US$5.5 bn that impact under-recoveries for PSU refiners, the government is effectively taking a 100% hit in its budget (vs the 33% rule on under-recoveries and 50% if it crosses a bound). Moreover,
with the crude customs duty reduction affecting other products as well, the total revenue reduction is higher. The subsidy number would thus be Rs675 bn (4Q11+ 9M FY12), vs the Rs200 bn budgeted. Thus, all else remaining same, if oil price stays at US$110 for the rest of the year, fiscal deficit would be 5.5% vs the 4.6% expected. Inflation impact: First round effects relatively minor Diesel, kerosene and LPG are together 6.3% of the WPI. The increases should thus add 64 bp to the WPI YoY (Figure 2). It is interesting to note that the Rs2/litre increase in prices last year was effective from 26 June 2010 – WPI YoY is unlikely to see any decline therefore.
Figure 2: Impact on WPI inflation due to the price increases Weight IncreaseDiesel 4.7% 8%Kerosene 0.7% 16%LPG 0.9% 16%Total 6.3% 0.64%Source: Company data, Credit Suisse estimates
Despite price controls, diesel prices in India have risen at a faster pace than WPI for the past decade, and yet have lagged international crude prices by far (Figure 3).
Figure 3: Diesel has risen faster than WPI, but much slower than crude
100150200250300350400450500
Jun-02 Jun-04 Jun-06 Jun-08 Jun-10Diesel Delhi Diesel Mumbai Crude (INR) WPI
Normalized; Jun-02 = 100
Source: IOC, Bloomberg, Economic Adviser to Govt. of India, Credit Suisse estimates Sectors impacted by the increase ● For implications on oil & gas companies please refer to India Oil &
Gas analyst Sanjay Mookim’s note published today. ● Telecom companies run their towers mostly on diesel gensets. An
8% increase in energy costs drives a 4-8% cut in profits (Bharti 4%, Reliance Comm 5% and Idea 8%). About half of their energy costs are diesel, so they could see 2-4% impact on earnings.
● Banks – high fiscal deficits would push up bond yields: a 100 bp rise would hurt bank earnings by 5-15%. SBI and BoI would be the most impacted. Further, with inflation being higher, a pause in rate hikes gets pushed out – a negative for banks.
● Autos – the delay in diesel price hikes (whereas petrol prices are deregulated) had boosted sales of diesel cars. The heavy weather around diesel price hikes suggests the trend may continue, but for the near term such stocks (e.g., M&M) may take a breather.

Monday, 27 June 2011
Asian Daily
- 9 of 22 -
India Oil and Gas Sector-------------------------------------------------------------------------------------- Fuel price increases – upstream, standalone refiners should see obvious benefits Sanjay Mookim / Research Analyst / 9122 6777 3806 / [email protected] Saurabh Mishra / Research Analyst / 91 22 6777 3894 / [email protected]
● The government on Friday increased retail price of diesel by 8% and that of LPG and kerosene by 16%. The excise duty on diesel has been reduced from Rs4.6 to Rs2 per litre. Customs duty on both crude (5%) and on products (7.5%) has been cut by 5%.
● The retail price hikes should generate Rs240 bn (US$5.3 bn) in FY12. The tax cuts do not generate additional revenue, but will lead to another reduction of Rs250 bn (US$5.5 bn) in FY12 losses, which could still be of the order of Rs1.1-1.2 tn (US$25 bn). Given HSD/LPG and SKO are 58% of consumption, the reduction in tax collections (Rs490 bn, US$11 bn p.a.) will be higher than the reduction in losses.
● The residual Rs1.1 tn in losses will still be the highest ever. The tax cuts mean the central government has run out of ‘other’ options. At the current oil price level, and without state level tax cuts, further retail price hikes cannot be ruled out, in our view.
● If the government lets upstream companies share in the retail price increases, ONGC, OILI and GAIL’s EPS could incrementally benefit 16%, 18% and 9%, respectively. The import duty cut can hurt CAIL/RIL crude price realisations, but should marginally increase the tariff protection for domestic refiners.
Valuation metrics Company Ticker CS Price Year P/E (x) P/B rating Local Target T T+1 T+2 (x)ONGC ONGC IN N 272.8 307.0 03/10 9.5 8.7 2.0OIL India OINL IN O 1,282 1,496 03/10 9.6 9.9 2.0Indian Oil Corp. IOCL IN N 337.1 388.0 03/10 7.1 6.8 1.4Hindustan Petroleum HPCL IN U 392.5 347.0 03/10 7.0 6.8 1.0Bharat Petroleum BPCL IN U 634.4 595.0 03/10 9.3 9.5 1.5Cairn India CAIR IN N 310.1 388.0 03/10 9.7 5.3 1.5Note: O = OUTPERFORM, N = NEUTRAL, U = UNDERPERFORM Source: Company data, Credit Suisse estimates Retail prices increased, finally … The government of India on Friday finally passed a slew of measures to stem the cash losses faced by PSU oil companies on retail sales:
● Diesel prices have been increased by Rs3/litre (8%). The impact on the final prices will be c.20-30% higher due to state-level taxes.
● LPG prices have been increased by Rs50 per cylinder (16%). ● PDS kerosene prices have been increased Rs2/litre (16%). ● Customs duty on petroleum products has been reduced from
7.5% to 2.5%. The 5% duty on crude has been done away with. ● Excise duty on diesel has been cut from Rs4.6/litre to Rs2/litre. … should lead to a modest reduction in FY12 under-recoveries Total FY12 under-recoveries (losses on retail fuel sales) were initially estimated to be c.Rs1,600-Rs1,800 bn (US$36-40 bn) – depending on oil prices. The increase in retail prices for diesel/LPG and SKO will reduce these by c.Rs240 bn (US$5.3 bn) for the rest of the year, by our estimates. This relatively modest dent in losses is a reflection of two things: (1) the c.Rs450 bn (US$10 bn) of losses that have already crystallised in 1Q FY12 and (2) the very large unit deficits that are being incurred on each of HSD/LPG and SKO.
Tax cuts reduce loss estimates further, but are an indirect funding mechanism, not additional revenue The reduction in diesel excise duty and the elimination of customs duty on crude could further reduce FY12E under-recoveries by c.Rs250 bn (US$5.5 bn) for the rest of the year, in our view. Total under-recoveries for FY12 would still be of the order of Rs1,100 – Rs1,200 bn (US$24-26 bn).
● Tax cuts do not generate additional revenue, and are only an internal transfer mechanism.
● An elimination of customs duty on crude is an inefficient means of addressing the under-recovery problem. Given HSD/LPG and SKO represent only 58% of the total product consumption in India, the reduction in government tax collections (forecast at Rs490 bn, US$11 bn annualised) will be more than the reduction in under-recoveries. The government has in effect also helped reduce prices for non-controlled fuels in India (such as MS, naphtha, ATF and others).
Ammunition spent? Despite these large (politically) retail price increases, residual FY12 under-recoveries are still the largest the government has ever funded, and can continue to pressure government finances. We note that the central government has almost run out of ammunition on taxes and can potentially take only another Rs2/litre cut on diesel. Unless the states agree to tax cuts, more retail price hikes cannot be ruled out, if crude remains high. Impact on oil companies Directionally, a reduction in overall under-recoveries is a positive for all oil PSU companies. Yet, further policy clarity is necessary in order to quantify these gains.
● Residual losses are still large. IOCL/BPCL/HPCL earnings still depend on government intentions at year end. Larger, sustained price reforms seem unlikely at current crude prices.
● ONGC/OILI and GAIL should theoretically ‘earn’ 33% of the reduction in under-recoveries. Government action in FY11 (when subsidy shares were increased) makes this assumption less certain. It is also likely that the finance ministry, having lost Rs490 bn in tax revenue, will be unwilling to share that portion with upstream. If benefits of only the retail price increases were passed on, ONGC’s EPS would benefit by Rs5 (16%), OILI’s by Rs23.7 (18%) and GAIL’s by Rs2.9 (9%) (at 33% upstream subsidy sharing).
● The elimination of import duties can hurt pricing for crude pricing for CAIL and RIL. We note, however, that the companies were likely not pricing to full import parity. The reduction in realisations may not be as high as well. A 3% reduction in crude prices would affect our CAIL target price by 3.5%.
● At least the four controlled products are currently priced on a ‘trade parity’ basis, which relies on only an 80% parity to import prices. The 5% reduction in crude and product duties should therefore lead to a small expansion in refining tariff protection, and should be a positive for standalone refiners that sell into India.

Monday, 27 June 2011
Asian Daily
- 10 of 22 -
Tech Mahindra --------------------------------------------------------------------------------RESTRICTED Analyst meet takeaways Manish Nigam / Research Analyst / 852 2101 7067 / [email protected] Sagar Rastogi / Research Analyst / 91 22 6777 3851 / [email protected]
● Tech Mahindra (TechM) and Mahindra Satyam (MSat) held their first joint analyst meet on Friday.
● Management indicated that overall IT spend in the telecoms vertical could rebound in 2H FY12. Further, it expects to benefit from the trends of convergence and increased offshoring in developed markets; and greenfield implementations and introduction of revenue-boosting products in emerging markets. It also stated that its capabilities were world-class and that its win ratio was well over 50% in any significant telecoms deal.
● Management was confident of strong growth in non-BT revenues and highlighted potential for improving margins by right-sizing the employee pyramid.
● On MSat, management indicated that it was on track to achieve industry-level operating margins and revenue growth in one-two years. Given some pending legal/regulatory issues, it expects that merger process could be completed earliest by May 2012.
First-ever joint analysts meet Tech Mahindra (TechM) and Mahindra Satyam (MSat) held their first joint analyst meet on Friday. Speakers included Mr Vineet Nayyar, CEO of TechM and Chairman of MSat, Mr C P Gurnani, CEO of MSat and the business heads of both companies. Telecoms vertical to recover in 2H FY12 Management indicated that overall IT spend in the telecoms vertical could rebound in 2H FY12. Further, it said that the addressable market for offshore IT vendors such as TechM had increased significantly after the financial crisis as operators in developed markets were under pressure to cut costs. It also expected to benefit from the trend of convergence of telecoms, media and internet. In emerging markets, implementing greenfield projects and introduction of new products to boost revenues would be the key drivers for growth. It also stated that its telecoms capabilities were world-class and that its win ratio was well over 50% in any significant deal in telecoms.
Separately, management said that telecoms operators were increasingly looking upon their IT vendors as ‘partners’ and wanted to share both risks and benefits of projects. Consequently, the commercial model was evolving from time- and material-based pricing to outcome-based pricing. Non-BT business to drive revenue growth Management stated that revenues from its largest client, BT, could continue to stagnate but it was confident of growing revenues from other clients. Management highlighted that its non-BT revenues had grown at a 25% CAGR (in US$ terms) over FY08-11 despite the recession. Employee pyramid to be key driver for margin improvement Management indicated that improving the employee pyramid by hiring more freshers would be a key lever for improving margins at both TechM and MSat. For instance, it stated that only 20% of MSat’s employees were less than 30 years of age.
While, it expected to see improved realisations due to better service-mix, management did not expect significant like-for-like price increases. Mahindra Satyam turnaround on track Management indicated that it was on track to achieve industry-level operating margins and revenue growth in one-two years.
According to management, the average deal size was increasing and it was seeing embargoes lifted from a number of clients; there was significant potential for improvement on this front.
Management mentioned that Mahindra Satyam had never operated at an EBITDA margin of over 3%; hence, it believes that achieving EBITDA margin of 13% in 4Q FY11 was a significant achievement. Merger earliest by May 2012 Management also stated that it could start the merger process only after the settlement of some pending issues namely: (1) pending litigation by Aberdeen and Satyam group companies and (2) tax demand from the Indian government. It believes that it has a strong position in each of these cases. However, it expects that even in the most optimistic scenario, it was unlikely to complete the merger process before May 2012.
It believes that synergies will mainly be on revenue front and that cost synergies had been largely realised.
Price (24 Jun 11, Rs) 692.70TP (Prev. TP Rs) —Est. pot. % chg. to TP —52-wk range (Rs) 801.00 - 564.00Mkt cap (Rs/US$ mn) 87,785.2/ 1,946.8
Bbg/RIC TECHM IN / TEML.BO Rating (prev. rating) R (R) Shares outstanding (mn) 126.73 Daily trad vol - 6m avg (mn) 0.1 Daily trad val - 6m avg (US$ mn) 1.6 Free float (%) 1,718.0 Major shareholders Mahindra Group -
48%, BT - 23%
Performance 1M 3M 12MAbsolute (%) 2.9 (6.0) (6.4)Relative (%) 1.6 (5.4) (9.0)
Year 3/09A 3/10A 3/11E 3/12E 3/13ERevenues (Rs mn) 44,647 46,254 — — —EBITDA (Rs mn) 12,825 11,325 — — —Net profit (Rs mn) 10,146 7,091 — — —EPS (Rs) 83.4 58.1 - Change from prev. EPS (%) n.a. n.a. - Consensus EPS (Rs) n.a. n.a. EPS growth (%) 30.6 (30.4) n.a. n.a. n.a.P/E (x) 8.3 11.9 — — —Dividend yield (%) 0.6 0 EV/EBITDA (x) 6.4 8.8 — — —P/B (x) 4.3 2.9 — — —ROE (%) 63.4 29.4 — — —Net debt (net cash)/equity (%) (27.5) 39.6 — — — Note 1: Tech Mahindra provides offshore IT services primarily to global telecoms companies.
Monday, 27 June 2011
Asian Daily
- 11 of 22 -
Malaysia DiGi ------------------------------------------------------------------------------- Maintain OUTPERFORM A good hiding place? EPS: ▼ TP: ▲ Foong Wai Loke / Research Analyst / 603 2723 2082 / [email protected]
● We have lowered net profits for DiGi by 20-22% for FY11-12E to reflect accelerated depreciation charges as DiGi embarks on a major network modernisation programme. However, guidance is for capex/sales to be below 10% from 2013 compared with 13% in 2010, and we have lowered our capex estimates accordingly.
● We have also lifted our FY11-12E EBITDA by 3% to closer align ourselves with the company’s continued strong margin delivery and guidance for improving margins. Taking into account all of the aforementioned changes, we have raised our target price to RM33.20 (from RM29.60).
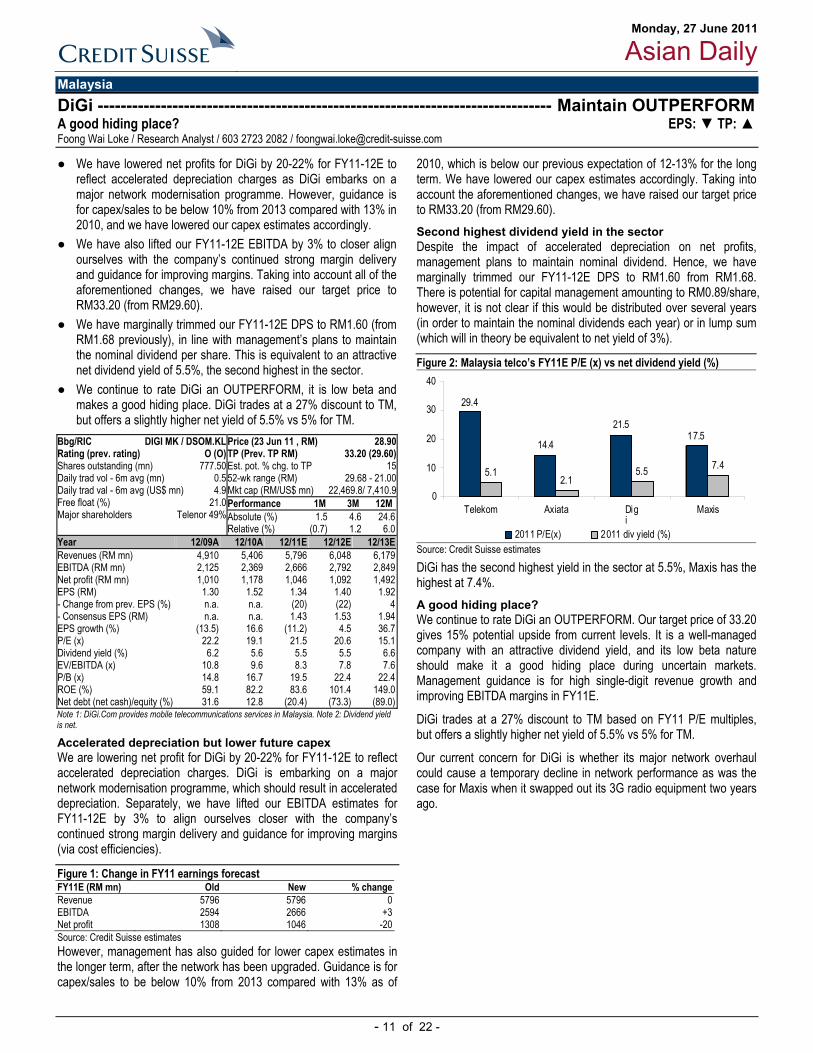
● We have marginally trimmed our FY11-12E DPS to RM1.60 (from RM1.68 previously), in line with management’s plans to maintain the nominal dividend per share. This is equivalent to an attractive net dividend yield of 5.5%, the second highest in the sector.
● We continue to rate DiGi an OUTPERFORM, it is low beta and makes a good hiding place. DiGi trades at a 27% discount to TM, but offers a slightly higher net yield of 5.5% vs 5% for TM.
Accelerated depreciation but lower future capex We are lowering net profit for DiGi by 20-22% for FY11-12E to reflect accelerated depreciation charges. DiGi is embarking on a major network modernisation programme, which should result in accelerated depreciation. Separately, we have lifted our EBITDA estimates for FY11-12E by 3% to align ourselves closer with the company’s continued strong margin delivery and guidance for improving margins (via cost efficiencies).
Figure 1: Change in FY11 earnings forecast FY11E (RM mn) Old New % changeRevenue 5796 5796 0EBITDA 2594 2666 +3Net profit 1308 1046 -20Source: Credit Suisse estimates However, management has also guided for lower capex estimates in the longer term, after the network has been upgraded. Guidance is for capex/sales to be below 10% from 2013 compared with 13% as of
2010, which is below our previous expectation of 12-13% for the long term. We have lowered our capex estimates accordingly. Taking into account the aforementioned changes, we have raised our target price to RM33.20 (from RM29.60). Second highest dividend yield in the sector Despite the impact of accelerated depreciation on net profits, management plans to maintain nominal dividend. Hence, we have marginally trimmed our FY11-12E DPS to RM1.60 from RM1.68. There is potential for capital management amounting to RM0.89/share, however, it is not clear if this would be distributed over several years (in order to maintain the nominal dividends each year) or in lump sum (which will in theory be equivalent to net yield of 3%).
Figure 2: Malaysia telco’s FY11E P/E (x) vs net dividend yield (%)
29.4
14.4
21.517.5
5.12.1
5.5 7.4
0
10
20
30
40
Telekom Axiata Digi
Maxis
2011 P/E(x) 2011 div yield (%) Source: Credit Suisse estimates
DiGi has the second highest yield in the sector at 5.5%, Maxis has the highest at 7.4%. A good hiding place? We continue to rate DiGi an OUTPERFORM. Our target price of 33.20 gives 15% potential upside from current levels. It is a well-managed company with an attractive dividend yield, and its low beta nature should make it a good hiding place during uncertain markets. Management guidance is for high single-digit revenue growth and improving EBITDA margins in FY11E.
DiGi trades at a 27% discount to TM based on FY11 P/E multiples, but offers a slightly higher net yield of 5.5% vs 5% for TM.
Our current concern for DiGi is whether its major network overhaul could cause a temporary decline in network performance as was the case for Maxis when it swapped out its 3G radio equipment two years ago.
Price (23 Jun 11 , RM) 28.90TP (Prev. TP RM) 33.20 (29.60) Est. pot. % chg. to TP 1552-wk range (RM) 29.68 - 21.00Mkt cap (RM/US$ mn) 22,469.8/ 7,410.9
Bbg/RIC DIGI MK / DSOM.KL Rating (prev. rating) O (O) Shares outstanding (mn) 777.50 Daily trad vol - 6m avg (mn) 0.5 Daily trad val - 6m avg (US$ mn) 4.9 Free float (%) 21.0 Major shareholders Telenor 49%
Performance 1M 3M 12MAbsolute (%) 1.5 4.6 24.6Relative (%) (0.7) 1.2 6.0
Year 12/09A 12/10A 12/11E 12/12E 12/13ERevenues (RM mn) 4,910 5,406 5,796 6,048 6,179EBITDA (RM mn) 2,125 2,369 2,666 2,792 2,849Net profit (RM mn) 1,010 1,178 1,046 1,092 1,492EPS (RM) 1.30 1.52 1.34 1.40 1.92- Change from prev. EPS (%) n.a. n.a. (20) (22) 4- Consensus EPS (RM) n.a. n.a. 1.43 1.53 1.94EPS growth (%) (13.5) 16.6 (11.2) 4.5 36.7P/E (x) 22.2 19.1 21.5 20.6 15.1Dividend yield (%) 6.2 5.6 5.5 5.5 6.6EV/EBITDA (x) 10.8 9.6 8.3 7.8 7.6P/B (x) 14.8 16.7 19.5 22.4 22.4ROE (%) 59.1 82.2 83.6 101.4 149.0Net debt (net cash)/equity (%) 31.6 12.8 (20.4) (73.3) (89.0) Note 1: DiGi.Com provides mobile telecommunications services in Malaysia. Note 2: Dividend yield is net.

Monday, 27 June 2011
Asian Daily
- 12 of 22 -
Pakistan Pakistan Fertiliser Sector -------------------------------------------------- Maintain OVERWEIGHT Engro analyst briefing: Enven achieves COD; FFC to benefit from upcoming urea price hike Farhan Rizvi, CFA / Research Analyst / 65 6212 3036 / [email protected]
● Engro Corp held an analyst briefing to announce the COD of its new urea plant (Enven) and ease investor concerns about future cash flows after the stock fell approximately 12% over five sessions.
● Management stated that cash flows of the old plant would be sufficient to meet debt obligations for 2011, while a strong legal recourse should ensure agreed gas supply going forward. Moreover, planned urea price hike from 1 July and scope for future price increases due to solid farm economics should be able to cover for any forced majeure events in the future.
● We maintain our positive long-term view on Engro and believe the broader fundamentals remain intact with sufficient room to increase prices given better farm economics. Moreover, a 46% price differential to international prices would make it unsustainable for the government to continue with huge subsidies.
● We expect a PRs100-120/bag price hike from 1 July to cover for both cash flow losses as well as likely 10-15% hike in gas prices, with FFC once again being the prime beneficiary of this price rise.
Figure 1: Engro’s share price has fallen sharply in recent weeks
-20%
-15%
-10%
-5%
0%
5%
10%
25-May 31-May 6-Jun 12-Jun 18-Jun 24-JunENGRO FFC KSE
Price performance
-20%
-15%
-10%
-5%
0%
5%
10%
25-May 31-May 6-Jun 12-Jun 18-Jun 24-JunENGRO FFC KSE
Price performance
Source: Bloomberg, Credit Suisse estimates Enven finally achieves COD after nearly a 10-month delay Engro Corp finally announced COD (Commercial Operations Date) for Enven more than 10 months later than the original plan of July/August 2010. The rather hurried analyst briefing was aimed at easing investor concerns about the company’s financial health. Repeated delays at Enven and lack of clarity on near-term gas supply led to the stock stumbling approximately 12% over five sessions (between 15 June and 22 June), hitting nearly the six-month low of PRs162.
Management announced that Enven has produced 118,000 tonnes of urea with the plant enjoying an agreed 80% gas supply after the resolution of the forced majeure event due to technical issues at two gas fields.
Cash flows adequate to meet debt obligations; EFL IPO to raise PRs2 bn While consistent gas supply to Enven is crucial for Engro to meet long-term debt obligations, concerns about the ability to meet near-term obligations are exaggerated, in our view. We concur with the management assertion of no near-term debt servicing risk as cash flows from the old plant should be sufficient meet 2011E debt servicing obligations of PRs12.5 bn. Our view is based on the strong pricing power in case of future disruptions amid solid farm economics and the fact that local prices are at 46% discount to international prices. Moreover, management said, IPO of Engro Fertiliser (EFL) planned in 3Q 2011 would raise PRs2 bn while IFC had also agreed to inject US$30 mn as a convertible loan, with the option likely to be exercised in due course.
Over the medium term though, we expect Engro’s strong legal position, alternative fuel arrangements by the government such as LNG and new gas productions to somewhat improve the overall supply situation. With international urea prices likely to remain upbeat due to reduced Chinese supplies, it would be unsustainable for the government to continue with huge subsidies especially against the backdrop of idle capacities. Hence, we reiterate our positive long-term view on the company, as broader fundamentals remain intact although gas supply at Enven would continue to drive near-term stock behaviour FFC remains the main beneficiary of future price hike Engro’s management has announced its plans to increase urea price effective from 1 July after taking into account the upward revisions to gas prices. We expect the company to increase prices in the range of PRs100-120/bag to take into account approximately 10-15% gas price hike as well as cash flow losses due to persistent gas disruptions. FFC would once again be the prime beneficiary of this price hike with a potential positive earnings impact of 7-18% over 2011-12E.
Figure 2: Sensitivity of FFC to potential urea price hikes Base case PRs100/bag PRs120/bag 2011E 2012E 2011E 2012E 2011E 2012ERevenues (PRsmn) 50,941 52,716 52,667 56,162 53,099 57,023 GP margin (%) 51% 49% 52% 52% 53% 53%EPS (PRs) 16.9 17.1 18.1 19.6 18.4 20.2 Target Price (PRs) 137 147 151 Change from base case Revenues (PRs mn) 3.4% 6.5% 4.2% 8.2%GP margin (%) 3.2% 6.4% 3.9% 7.9%EPS (PRs) 7.2% 14.3% 9.0% 17.9%Target Price (PRs) 7.3% 10.2%Source: Credit Suisse estimates.
Valuation metrics Company Ticker CS Price Year EPS Chg(%) TP (%) Up/dn EPS EPS grth (%) P/E (x) Div. yld
(%)ROE P/B
rating Local Target T T+1 T+2 Chg (%) T+1 T+2 T+1 T+2 T+1 T+2 T+1 (%) (x)Engro Corporation ENGRO PA O 169.3 220.8 12/10 3 1 13 30 22.7 28.3 31 25 7.5 6.0 4.7 26.7 1.8Fauji Fertiliser FFC PA N 152.0 137.0 12/10 0 0 0 (10) 16.9 17.1 30 1 9.0 8.9 10.0 88.7 7.6Note: O = OUTPERFORM, N = NEUTRAL, U = UNDERPERFORM Source: Company data, Credit Suisse estimates

Monday, 27 June 2011
Asian Daily
- 13 of 22 -
Singapore Singapore Market Strategy ---------------------------------------------- Maintain UNDERWEIGHT Tourist arrival growth remains robust Sean Quek, CFA / Research Analyst / 65 6212 3337 / [email protected] Kwee Hong Ching / Research Analyst / 65 6212 3142 / [email protected]
● According to the Singapore Tourism Board (STB), visitor arrivals in Singapore jumped 17% YoY (+3% MoM) to 1.10 mn in April. This was driven mainly by strong growth in visitor arrivals from Hong Kong (+47%), China (+44% YoY) and Philippines (+40%).
● YTD, visitor arrivals rose 16% YoY to 4.22 mn, in line with our forecast of 16% growth in 2011 to 13.5 mn. STB forecasts 12-13 mn visitor arrivals (and 16-27% growth in tourism receipts to S$22-24 bn) for 2011.
● The strong growth in tourist visitation, especially from Hong Kong, supports the view that the strong appreciation of the SGD against the USD has not materially impacted demand. In our view, the 6% appreciation of the SGD against the Singapore ‘tourism-weighted’ basket of currencies shows that the impact is not as severe as the headline SDG/USD appreciation of 12% suggests.
● Pricing power for the tourism sector is expected to remain strong given the strong demand, high utilisation rates and limited incremental capacity. Our key picks here include Genting Singapore and CDLHT.
Figure 1: Monthly Singapore visitor arrivals (mn) and YoY growth (%)
0.650.700.750.800.850.900.951.001.051.101.15
Jan-
06Ma
y-06
Sep-
06
Jan-
07Ma
y-07
Sep-
07Ja
n-08
May-
08Se
p-08
Jan-
09Ma
y-09
Sep-
09Ja
n-10
May-
10Se
p-10
Jan-
11
-18%-12%-6%0%6%12%18%24%30%36%42%
# of visitors (mn) YoY (%) [RHS]
Visi tor arrivals (mn) YoY (%)
Source: STB, CEIC
According to STB, visitor arrivals to Singapore jumped 17% YoY to 1.10 mn in April. Hong Kong SAR (+47%), P R China (+44% YoY) and the Philippines (+40%) registered the highest growth among the top 15 markets. YTD, visitor arrivals rose 16% YoY to 4.22 mn, in line with our forecast of 16% growth in 2011 to 13.5 mn. STB forecasts 12-13 mn visitor arrivals (and 16-27% growth in tourism receipts to S$22-24 bn) for 2011. Currency impact not as significant as it seems The strong growth in tourist visitation, especially from Hong Kong, supports the view that the strong appreciation of the SGD against the USD has not really impacted demand. In our view, the 6% appreciation of the SGD against the Singapore ‘tourism-weighted’ basket of currencies over the past 12 months shows that the impact is not as severe as the headline SGD/USD appreciation of 12% suggests.
Figure 2: SGD appreciation (12 mths) versus Singapore tourism weighted basket of currencies
12.29.2
6.8 6.5 5.9 5.9
0.2
-6.9 -6.9
5.2
1.7
-10
-5
0
5
10
15
USA IN ID CH TH PH MY KR JP UK AUCurrency change (12M) Tourism adjusted
(%)
Tourism adjusted : 6.1%
Source: Bloomberg, Credit Suisse estimates Hotel revpar rose 8% YoY in April While average hotel occupancy remains unchanged YoY at 86%, while revenue per available room (revpar) rose 8% YoY (but slid 3% MoM) to S$198 in April. Consequently, total hotel room revenue rose 12% YoY (and 1% MoM) to an estimated S$172 mn for the month. Limited capacity = pricing power Pricing power for the tourism sector is expected to remain strong given the strong demand, high utilisation rates and limited incremental capacity. With limited new supply, we expect hotel occupancy to hover at the 80-90% level in the near term.
In our view, the overall infrastructure constraint is not necessarily negative for the tourism sector since it will attract higher-value visitors. This seems to be built into the Singapore Tourism Board’s projections for 2011, where tourism receipts are expected to jump 16-27%, substantially ahead of the 3-12% projected growth in visitor arrivals.
Given our view that potential moderation in population and economic growth for Singapore will affect domestic demand growth over the medium term, we prefer more externally driven sectors including tourism. Our key picks here include Genting Singapore and CDLHT.
Figure 3: Key tourism plays Mkt cap Price (S$) TP Upside YTD pref. (%)Company Bberg Rat. (S$ mn) [24 Jun] (S$) (%) Abs. Rel. Genting GENS SP O 23,411 1.92 2.65 38 (12) (8)CDLHT CDREIT SP O 1,940 2.02 2.63 30 (3) 1SATS SATS SP O 2,847 2.57 3.20 24 (11) (7)ComfortDelGro CD SP O 2,969 1.42 1.75 23 (8) (5)MCT MCT SP O 1,610 0.865 1.05 21 (2)* 2*SIA SIA SP O 17,019 14.24 15.90 12 (7) (3)Tiger Airways TGR SP N 660 1.21 1.65 36 (35) (31)* since listing Source: Company data, Credit Suisse estimates
Monday, 27 June 2011
Asian Daily
- 14 of 22 -
South Korea Korea Oil Refining Sector -------------------------------------------------- Maintain OVERWEIGHT Benefit from tight refining dynamics ahead A-Hyung Cho / Research Analyst / 822 3707 3735 / [email protected] Jihong Choi / Research Analyst / 82 2 3707 3796 / [email protected]
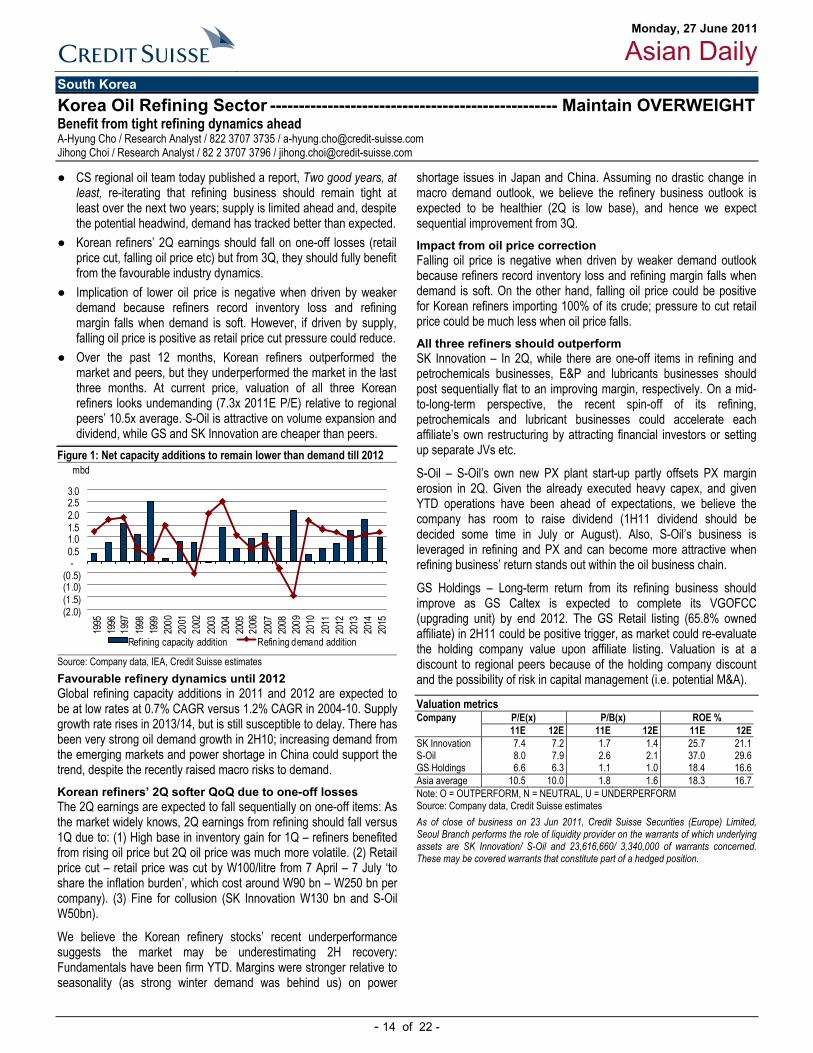
● CS regional oil team today published a report, Two good years, at least, re-iterating that refining business should remain tight at least over the next two years; supply is limited ahead and, despite the potential headwind, demand has tracked better than expected.
● Korean refiners’ 2Q earnings should fall on one-off losses (retail price cut, falling oil price etc) but from 3Q, they should fully benefit from the favourable industry dynamics.
● Implication of lower oil price is negative when driven by weaker demand because refiners record inventory loss and refining margin falls when demand is soft. However, if driven by supply, falling oil price is positive as retail price cut pressure could reduce.
● Over the past 12 months, Korean refiners outperformed the market and peers, but they underperformed the market in the last three months. At current price, valuation of all three Korean refiners looks undemanding (7.3x 2011E P/E) relative to regional peers’ 10.5x average. S-Oil is attractive on volume expansion and dividend, while GS and SK Innovation are cheaper than peers.
Figure 1: Net capacity additions to remain lower than demand till 2012
(2.0)(1.5)(1.0)(0.5)
-0.51.01.52.02.53.0
1995
1996
1997
1998
1999
2000
2001
2002
2003
2004
2005
2006
2007
2008
2009
2010
2011
2012
2013
2014
2015
Refining capacity addition Refining demand addition
mbd
Source: Company data, IEA, Credit Suisse estimates Favourable refinery dynamics until 2012 Global refining capacity additions in 2011 and 2012 are expected to be at low rates at 0.7% CAGR versus 1.2% CAGR in 2004-10. Supply growth rate rises in 2013/14, but is still susceptible to delay. There has been very strong oil demand growth in 2H10; increasing demand from the emerging markets and power shortage in China could support the trend, despite the recently raised macro risks to demand. Korean refiners’ 2Q softer QoQ due to one-off losses The 2Q earnings are expected to fall sequentially on one-off items: As the market widely knows, 2Q earnings from refining should fall versus 1Q due to: (1) High base in inventory gain for 1Q – refiners benefited from rising oil price but 2Q oil price was much more volatile. (2) Retail price cut – retail price was cut by W100/litre from 7 April – 7 July ‘to share the inflation burden’, which cost around W90 bn – W250 bn per company). (3) Fine for collusion (SK Innovation W130 bn and S-Oil W50bn).
We believe the Korean refinery stocks’ recent underperformance suggests the market may be underestimating 2H recovery: Fundamentals have been firm YTD. Margins were stronger relative to seasonality (as strong winter demand was behind us) on power
shortage issues in Japan and China. Assuming no drastic change in macro demand outlook, we believe the refinery business outlook is expected to be healthier (2Q is low base), and hence we expect sequential improvement from 3Q. Impact from oil price correction Falling oil price is negative when driven by weaker demand outlook because refiners record inventory loss and refining margin falls when demand is soft. On the other hand, falling oil price could be positive for Korean refiners importing 100% of its crude; pressure to cut retail price could be much less when oil price falls. All three refiners should outperform SK Innovation – In 2Q, while there are one-off items in refining and petrochemicals businesses, E&P and lubricants businesses should post sequentially flat to an improving margin, respectively. On a mid-to-long-term perspective, the recent spin-off of its refining, petrochemicals and lubricant businesses could accelerate each affiliate’s own restructuring by attracting financial investors or setting up separate JVs etc.
S-Oil – S-Oil’s own new PX plant start-up partly offsets PX margin erosion in 2Q. Given the already executed heavy capex, and given YTD operations have been ahead of expectations, we believe the company has room to raise dividend (1H11 dividend should be decided some time in July or August). Also, S-Oil’s business is leveraged in refining and PX and can become more attractive when refining business’ return stands out within the oil business chain.
GS Holdings – Long-term return from its refining business should improve as GS Caltex is expected to complete its VGOFCC (upgrading unit) by end 2012. The GS Retail listing (65.8% owned affiliate) in 2H11 could be positive trigger, as market could re-evaluate the holding company value upon affiliate listing. Valuation is at a discount to regional peers because of the holding company discount and the possibility of risk in capital management (i.e. potential M&A).
Valuation metrics Company P/E(x) P/B(x) ROE % 11E 12E 11E 12E 11E 12ESK Innovation 7.4 7.2 1.7 1.4 25.7 21.1S-Oil 8.0 7.9 2.6 2.1 37.0 29.6GS Holdings 6.6 6.3 1.1 1.0 18.4 16.6Asia average 10.5 10.0 1.8 1.6 18.3 16.7Note: O = OUTPERFORM, N = NEUTRAL, U = UNDERPERFORM Source: Company data, Credit Suisse estimates As of close of business on 23 Jun 2011, Credit Suisse Securities (Europe) Limited, Seoul Branch performs the role of liquidity provider on the warrants of which underlying assets are SK Innovation/ S-Oil and 23,616,660/ 3,340,000 of warrants concerned. These may be covered warrants that constitute part of a hedged position.

Monday, 27 June 2011
Asian Daily
- 15 of 22 -
Thailand Thailand Market Strategy---------------------------------------------- Maintain MARKET WEIGHT Election scenario analysis Dan Fineman / Research Analyst / 662 614 6218 / [email protected] Siriporn Sothikul, CFA / Research Analyst / 662 614 6217 / [email protected]
● With one week to go before elections and almost all polls pointing to a Pheu Thai Party (PT) victory, we analyse the market implications of a change of government.
● The margin of victory is critical. A big win would increase the risk opponents would use force to oust PT, but also improve the chances of having a stable, reformist government. In other words, investors would face a sharply divergent binary outcome. A slim PT win, on the other hand, would lessen chances of extreme outcomes and increase the possibility of a neutral scenario.
● Although the consensus increasingly expects a PT government, we see no sign in valuations or performance that the market has discounted the more negative post-election scenarios.
● We reiterate that the 6-12 month outlook is more balanced, but that investors with a 1-2 month time horizon should either exit Thailand or Overweight sectors with limited political risk. We are OVERWEIGHT building materials, petrochemicals, utilities and consumer staples.
Figure 1: Thailand has performed in line with the region since pollsstarted giving PT lead
0.96
0.98
1.00
1.02
1.04
1.06
6-M
ay8-
May
10-M
ay12
-May
14-M
ay16
-May
18-M
ay20
-May
22-M
ay24
-May
26-M
ay28
-May
30-M
ay1-
Jun
3-Ju
n5-
Jun
7-Ju
n9-
Jun
11-J
un13
-Jun
15-Ju
n17
-Jun
19-J
un21
-Jun
23-J
un
(Indexed)
MSCI Thailand rel. to MSCI Asia ex-JapanSource: Datastream, Credit Suisse All polls point to a PT government All the polls point to a PT government. The polls with the methodologies and sample sizes we consider strongest – the Suan Dusit nationwide poll and the Turakit Bundit Bangkok polls – give PT a lead of landslide proportions. The other leading pollster – ABAC – gives PT a smaller 5 pp lead in voter preferences, which we see as sufficient to win about half the seats in Parliament. Because public opinion surveys in Thailand have a mixed track record, we still give a 20% chance of the Democrats leading the next government, but our base case assumes PT leads. Significance of big win Were PT to win a landslide victory, we see both high risk and considerable upside potential. A large majority in Parliament would enable PT to pursue a general political amnesty, including for Thaksin Shinawatra. An amnesty might provoke anti-Thaksin groups into using force to oust a PT government, a highly negative outcome for the market. On the other hand, a resounding electoral win might make it harder for Thaksin opponents to succeed in the use of force and could induce them to pursue reconciliation. Under that scenario, Thailand
could enjoy a strong government with reduced risk of violence. We would expect a stable PT government to cut corporate taxes and accelerate the infrastructure build-out. In other words, a landslide win would present the market with a stark binary outcome. Significance of a slim victory A narrow victory could move the range of outcomes away from the extremes and towards more neutral territory. Were PT to win a small majority, it would find it harder to pursue amnesty, to the likely satisfaction of Thaksin’s opponents. With a weaker PT government, Thaksin opponents might also judge that they would have a chance of winning the next round of elections or even encouraging enough PT MPs to defect to bring down the government. If PT won a narrow victory, we see less chance of positive structural reforms and more pressure to pursue unwelcome populist measures, but also less risk of the use of force to change governments. 260-280 seats needed to pursue amnesty We think PT needs at least 260, and possibly 280, seats to achieve amnesty. The Nation newspaper has argued that amnesty would require amendment of Article 309 of the constitution, which sanctions legal actions subsequent to the 2006 coup. In a motion to amend the constitution, the 500 MPs in the House of Representatives and 100 Senators vote as a single body, meaning that 301 votes are required. We believe that very few of the 49 appointed Senators would support an amendment, and that at most 20-30 of the 51 elected Senators would vote for it. That means PT would need about 270-280 votes from MPs. In theory, some of those votes could come from small parties PT brought into government, but PT MPs would be a much more reliable source of votes for such a controversial measure. Thus, we deem 280 ideal from PT’s perspective, with 260 a possibility in conjunction with coalition partners.
Were PT to lead a government but not amend the constitution, 240 seats would likely be sufficient. In theory, PT needs 250 seats to block the Democrats from leading another coalition, but in practice we think that if PT gets 240, small parties will consider joining it. Short-term risk/reward trade-off bad We believe that many foreign investors underestimate the chances of reconciliation after a PT win, and see somewhat balanced risks on a 6-12 month time horizon regardless of whether PT wins a large or slim victory. But we reiterate that we see little reason to be in the market on a 1-3 month view. Even if reconciliation is achieved, the market would not be certain of its success for 6-12 months or more. We do not believe the market has priced in a PT victory. Thailand has performed exactly in line with NJA markets since 6 May, when public opinion polls began to show a lead for PT (Figure 1).
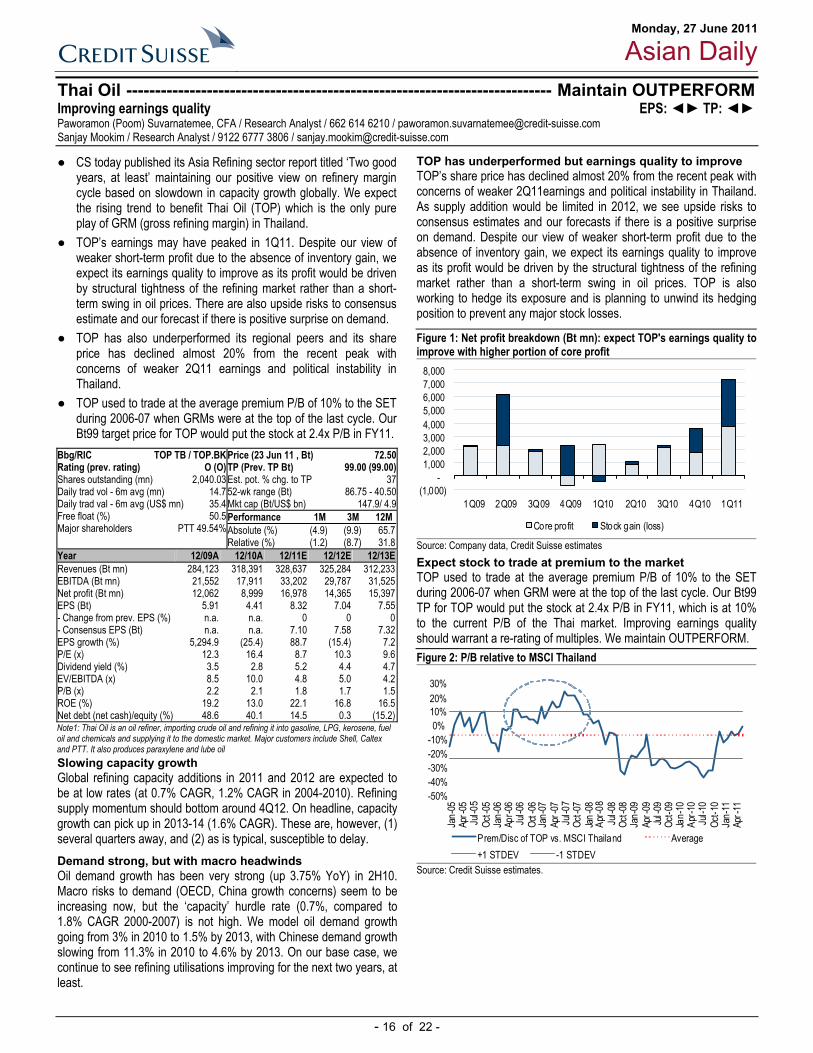
Monday, 27 June 2011
Asian Daily
- 16 of 22 -
Thai Oil -------------------------------------------------------------------------- Maintain OUTPERFORM Improving earnings quality EPS: ◄► TP: ◄► Paworamon (Poom) Suvarnatemee, CFA / Research Analyst / 662 614 6210 / [email protected] Sanjay Mookim / Research Analyst / 9122 6777 3806 / [email protected]
● CS today published its Asia Refining sector report titled ‘Two good years, at least’ maintaining our positive view on refinery margin cycle based on slowdown in capacity growth globally. We expect the rising trend to benefit Thai Oil (TOP) which is the only pure play of GRM (gross refining margin) in Thailand.
● TOP’s earnings may have peaked in 1Q11. Despite our view of weaker short-term profit due to the absence of inventory gain, we expect its earnings quality to improve as its profit would be driven by structural tightness of the refining market rather than a short-term swing in oil prices. There are also upside risks to consensus estimate and our forecast if there is positive surprise on demand.
● TOP has also underperformed its regional peers and its share price has declined almost 20% from the recent peak with concerns of weaker 2Q11 earnings and political instability in Thailand.
● TOP used to trade at the average premium P/B of 10% to the SET during 2006-07 when GRMs were at the top of the last cycle. Our Bt99 target price for TOP would put the stock at 2.4x P/B in FY11.
Slowing capacity growth Global refining capacity additions in 2011 and 2012 are expected to be at low rates (at 0.7% CAGR, 1.2% CAGR in 2004-2010). Refining supply momentum should bottom around 4Q12. On headline, capacity growth can pick up in 2013-14 (1.6% CAGR). These are, however, (1) several quarters away, and (2) as is typical, susceptible to delay. Demand strong, but with macro headwinds Oil demand growth has been very strong (up 3.75% YoY) in 2H10. Macro risks to demand (OECD, China growth concerns) seem to be increasing now, but the ‘capacity’ hurdle rate (0.7%, compared to 1.8% CAGR 2000-2007) is not high. We model oil demand growth going from 3% in 2010 to 1.5% by 2013, with Chinese demand growth slowing from 11.3% in 2010 to 4.6% by 2013. On our base case, we continue to see refining utilisations improving for the next two years, at least.
TOP has underperformed but earnings quality to improve TOP’s share price has declined almost 20% from the recent peak with concerns of weaker 2Q11earnings and political instability in Thailand. As supply addition would be limited in 2012, we see upside risks to consensus estimates and our forecasts if there is a positive surprise on demand. Despite our view of weaker short-term profit due to the absence of inventory gain, we expect its earnings quality to improve as its profit would be driven by the structural tightness of the refining market rather than a short-term swing in oil prices. TOP is also working to hedge its exposure and is planning to unwind its hedging position to prevent any major stock losses.
Figure 1: Net profit breakdown (Bt mn): expect TOP's earnings quality to improve with higher portion of core profit
(1,000)-
1,0002,0003,0004,0005,0006,0007,0008,000
1Q09 2Q09 3Q09 4Q09 1Q10 2Q10 3Q10 4Q10 1Q11
Core profit Stock gain (loss)
Source: Company data, Credit Suisse estimates Expect stock to trade at premium to the market TOP used to trade at the average premium P/B of 10% to the SET during 2006-07 when GRM were at the top of the last cycle. Our Bt99 TP for TOP would put the stock at 2.4x P/B in FY11, which is at 10% to the current P/B of the Thai market. Improving earnings quality should warrant a re-rating of multiples. We maintain OUTPERFORM. Figure 2: P/B relative to MSCI Thailand
-50%-40%-30%-20%-10%0%
10%20%30%
Jan-
05Ap
r-05
Jul-0
5Oc
t-05
Jan-
06Ap
r-06
Jul-0
6Oc
t-06
Jan-
07Ap
r-07
Jul-0
7Oc
t-07
Jan-
08Ap
r-08
Jul-0
8Oc
t-08
Jan-
09Ap
r-09
Jul-0
9Oc
t-09
Jan-
10Ap
r-10
Jul-1
0Oc
t-10
Jan-
11Ap
r-11
Prem/Disc of TOP vs. MSCI Thailand Average+1 STDEV -1 STDEV
Source: Credit Suisse estimates.
Price (23 Jun 11 , Bt) 72.50TP (Prev. TP Bt) 99.00 (99.00) Est. pot. % chg. to TP 3752-wk range (Bt) 86.75 - 40.50Mkt cap (Bt/US$ bn) 147.9/ 4.9
Bbg/RIC TOP TB / TOP.BK Rating (prev. rating) O (O) Shares outstanding (mn) 2,040.03 Daily trad vol - 6m avg (mn) 14.7 Daily trad val - 6m avg (US$ mn) 35.4 Free float (%) 50.5 Major shareholders PTT 49.54%
Performance 1M 3M 12MAbsolute (%) (4.9) (9.9) 65.7Relative (%) (1.2) (8.7) 31.8
Year 12/09A 12/10A 12/11E 12/12E 12/13ERevenues (Bt mn) 284,123 318,391 328,637 325,284 312,233EBITDA (Bt mn) 21,552 17,911 33,202 29,787 31,525Net profit (Bt mn) 12,062 8,999 16,978 14,365 15,397EPS (Bt) 5.91 4.41 8.32 7.04 7.55- Change from prev. EPS (%) n.a. n.a. 0 0 0- Consensus EPS (Bt) n.a. n.a. 7.10 7.58 7.32EPS growth (%) 5,294.9 (25.4) 88.7 (15.4) 7.2P/E (x) 12.3 16.4 8.7 10.3 9.6Dividend yield (%) 3.5 2.8 5.2 4.4 4.7EV/EBITDA (x) 8.5 10.0 4.8 5.0 4.2P/B (x) 2.2 2.1 1.8 1.7 1.5ROE (%) 19.2 13.0 22.1 16.8 16.5Net debt (net cash)/equity (%) 48.6 40.1 14.5 0.3 (15.2) Note1: Thai Oil is an oil refiner, importing crude oil and refining it into gasoline, LPG, kerosene, fuel oil and chemicals and supplying it to the domestic market. Major customers include Shell, Caltex and PTT. It also produces paraxylene and lube oil

Monday, 27 June 2011
Asian Daily
- 17 of 22 -
Thai Tap Water -------------------------------------------------------------Upgrade to OUTPERFORM Upgrade on attractive valuation EPS: ▼ TP: ▲ Thaniya Kevalee / Research Analyst / 662 614 6219 / [email protected] Siriporn Sothikul, CFA / Research Analyst / 662 614 6217 / [email protected]
● Following the recent share price weakness, we see a good opportunity to accumulate TTW, which now offers 31% potential upside to our DCF-based target price. We thus upgrade the stock from Neutral to OUTPERFORM.
● TTW’s cash flow is of high quality with tariff linked directly to inflation. Strong cash flow and balance sheet should sustain attractive dividend, yield which we forecast to rise towards 8.1% by 2014 (6.8% this year). Despite a 6% cut in our earnings forecast (on new electricity cost assumption), we raise our target price slightly to Bt7 (from Bt6.9) as we include small capacity expansion at its subsidiary and roll out our DCF model to end-2012.
● While new investment opportunities remain unclear, we forecast TTW to maintain its ROE at around 20% over the long term. This, coupled with the high dividend yield, is the key attraction.
● With increasing political uncertainties, we believe defensive plays will attract more investor interest. Although we prefer RATCH and GLOW, we also consider TTW a good candidate.
Strong cash flow supports attractive yield With limited possibility of contract renegotiation (see detailed discussion in Legal risk abates further, future growth remains unclear, 14 March 2011), we consider TTW’s cash flow to be of high quality. TTW’s water tariffs are adjusted annually based upon CPI, which helps protect its high EBITDA and EBIT margin of around 80% and 60%, respectively. Strong cash flow should help support the steady rise in dividend payment—TTW has a policy to raise absolute dividend every year. We forecast that TTW will raise its dividend per share by Bt0.02 every year (it paid Bt0.35/share last year), which implies an attractive dividend yield of 6.8% this year, and rising to 8.1% by 2014 (Figure 1). Earnings estimates reduced by 6% but ROE remains solid We have reduced our earnings estimates over 2011-13 by 6%. This is mainly due to our new electricity cost assumption (the biggest cost item accounting for 55% of total operating costs and expenses), which is 23% higher than our previous estimate. Our previous estimate appeared too low in light of the 1Q11 results and management’s latest guidance. Also, the government has recently made the ‘free electricity for the poor’ campaign a permanent policy, which we expect will lead
to higher power tariff for big industrial users. In spite of this, TTW’s ROE remains very attractive at around 20% (Figure 1). But we raise our DCF-based TP slightly to Bt7/share This is due to two reasons. First, we roll out our DCF model to end-2012. Second, TTW has a plan to raise the water production capacity at its subsidiary, Pathum Thani Water (PTW), by around 50,000 cu m/day, i.e., by around 13% of existing capacity. As shown in Figure 2, PTW’s sales volume has been running above minimum daily off-take since last year and the May volume is only 7% below the maximum capacity. The expansion requires around Bt500 mn investment. We believe TTW will decide to go ahead with the expansion plan, as our DCF model suggests incremental value of Bt0.20/share from the planned expansion, which should be completed by end-2012. Upgrade on valuation The recent weakness in the share price was due to: (1) very strong price performance at the beginning of this year, boosted by lower legal risk, and (2) disappointing 1Q11 results, as unusually cold whether led to lower-than-expected consumption while electricity cost was higher than expected. We believe this provides a good opportunity to buy, with 31% potential upside to our new target price. Amid rising political uncertainties, we see limited downside risk from here and reasonable protection with high yield. Due to unclear investment opportunities, however, we prefer RATCH and GLOW. Figure 1: Attractive dividend yield, solid ROE
8.5
6.87.4
7.78.1
0
5
10
15
20
25
2011E 2012E 2013E 2014E 2015E
(%)
6
7
8
9(%)
ROE (%, LHS) Dividend yield (%, RHS) Source: Company data, Credit Suisse estimates. Figure 2: PTW: Sales volume almost hit maximum capacity
88
168
248
328
Jan-
10Fe
b-10
Mar-1
0Ap
r-10
May-
10Ju
n-10
Jul-1
0Au
g-10
Sep-
10Oc
t-10
Nov-
10De
c-10
Jan-
11Fe
b-11
Mar-1
1Ap
r-11
May-
11
Capacity Sales Off take
(cu m/day)
Off take
SalesCapaci ty
Source: Company data
Price (23 Jun 11 , Bt) 5.35TP (Prev. TP Bt) 7.00 (6.90) Est. pot. % chg. to TP 3152-wk range (Bt) 6.95 - 4.44Mkt cap (Bt/US$ mn) 21,346.5/ 697.6
Bbg/RIC TTW TB / TTW.BK Rating (prev. rating) O (N) Shares outstanding (mn) 3,990.00 Daily trad vol - 6m avg (mn) 3.9 Daily trad val - 6m avg (US$ mn) 0.8 Free float (%) — Major shareholders Ch. Karnchang:
33.68%
Performance 1M 3M 12MAbsolute (%) (7.0) (10.8) 19.4Relative (%) (3.3) (9.7) (5.0)
Year 12/09A 12/10A 12/11E 12/12E 12/13ERevenues (Bt mn) 4,048 4,395 4,617 4,864 5,124EBITDA (Bt mn) 3,241 3,548 3,661 3,858 4,065Net profit (Bt mn) 1,594 2,063 2,083 2,096 2,023EPS (Bt) 0.40 0.52 0.52 0.53 0.51- Change from prev. EPS (%) n.a. n.a. (6) (6) (6)- Consensus EPS (Bt) n.a. n.a. 0.54 0.54 0.52EPS growth (%) 6.3 29.5 1.0 0.7 (3.5)P/E (x) 13.4 10.3 10.2 10.2 10.6Dividend yield (%) 5.2 6.5 6.8 7.4 7.6EV/EBITDA (x) 9.1 8.1 7.4 6.7 6.1P/B (x) 2.5 2.3 2.1 2.0 1.9ROE (%) 18.8 22.8 21.3 20.1 18.5Net debt (net cash)/equity (%) 94.3 77.9 57.1 42.6 31.4 Note 1: TTW owns two state concessions to produce treated water in Samut Sakhon, Nakhon Pathom and Pathum Thani, with 100% market share in these provinces.
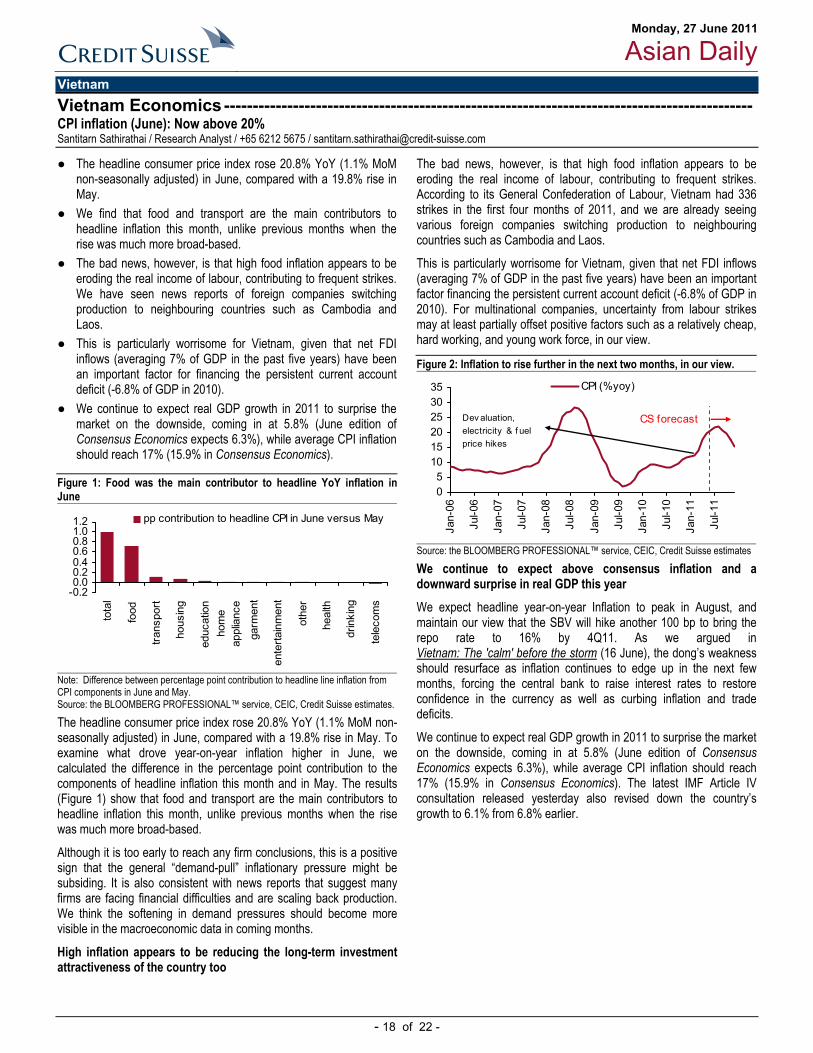
Monday, 27 June 2011
Asian Daily
- 18 of 22 -
Vietnam Vietnam Economics-------------------------------------------------------------------------------------------- CPI inflation (June): Now above 20% Santitarn Sathirathai / Research Analyst / +65 6212 5675 / [email protected]
● The headline consumer price index rose 20.8% YoY (1.1% MoM non-seasonally adjusted) in June, compared with a 19.8% rise in May.
● We find that food and transport are the main contributors to headline inflation this month, unlike previous months when the rise was much more broad-based.
● The bad news, however, is that high food inflation appears to be eroding the real income of labour, contributing to frequent strikes. We have seen news reports of foreign companies switching production to neighbouring countries such as Cambodia and Laos.
● This is particularly worrisome for Vietnam, given that net FDI inflows (averaging 7% of GDP in the past five years) have been an important factor for financing the persistent current account deficit (-6.8% of GDP in 2010).
● We continue to expect real GDP growth in 2011 to surprise the market on the downside, coming in at 5.8% (June edition of Consensus Economics expects 6.3%), while average CPI inflation should reach 17% (15.9% in Consensus Economics).
Figure 1: Food was the main contributor to headline YoY inflation in June
-0.20.00.20.40.60.81.01.2
tota
l
food
trans
port
hous
ing
educ
atio
nho
me
appl
ianc
ega
rmen
t
ente
rtain
men
t
othe
r
heal
th
drin
king
tele
com
s
pp contribution to headline CPI in June versus May
Note: Difference between percentage point contribution to headline line inflation from CPI components in June and May. Source: the BLOOMBERG PROFESSIONAL™ service, CEIC, Credit Suisse estimates.
The headline consumer price index rose 20.8% YoY (1.1% MoM non-seasonally adjusted) in June, compared with a 19.8% rise in May. To examine what drove year-on-year inflation higher in June, we calculated the difference in the percentage point contribution to the components of headline inflation this month and in May. The results (Figure 1) show that food and transport are the main contributors to headline inflation this month, unlike previous months when the rise was much more broad-based. Although it is too early to reach any firm conclusions, this is a positive sign that the general “demand-pull” inflationary pressure might be subsiding. It is also consistent with news reports that suggest many firms are facing financial difficulties and are scaling back production. We think the softening in demand pressures should become more visible in the macroeconomic data in coming months.
High inflation appears to be reducing the long-term investment attractiveness of the country too
The bad news, however, is that high food inflation appears to be eroding the real income of labour, contributing to frequent strikes. According to its General Confederation of Labour, Vietnam had 336 strikes in the first four months of 2011, and we are already seeing various foreign companies switching production to neighbouring countries such as Cambodia and Laos.
This is particularly worrisome for Vietnam, given that net FDI inflows (averaging 7% of GDP in the past five years) have been an important factor financing the persistent current account deficit (-6.8% of GDP in 2010). For multinational companies, uncertainty from labour strikes may at least partially offset positive factors such as a relatively cheap, hard working, and young work force, in our view.
Figure 2: Inflation to rise further in the next two months, in our view.
05
101520253035
Jan-
06
Jul-0
6
Jan-
07
Jul-0
7
Jan-
08
Jul-0
8
Jan-
09
Jul-0
9
Jan-
10
Jul-1
0
Jan-
11
Jul-1
1
CPI (%yoy)
CS forecastDev aluation, electricity & f uel price hikes
Source: the BLOOMBERG PROFESSIONAL™ service, CEIC, Credit Suisse estimates
We continue to expect above consensus inflation and a downward surprise in real GDP this year We expect headline year-on-year Inflation to peak in August, and maintain our view that the SBV will hike another 100 bp to bring the repo rate to 16% by 4Q11. As we argued in Vietnam: The 'calm' before the storm (16 June), the dong’s weakness should resurface as inflation continues to edge up in the next few months, forcing the central bank to raise interest rates to restore confidence in the currency as well as curbing inflation and trade deficits.
We continue to expect real GDP growth in 2011 to surprise the market on the downside, coming in at 5.8% (June edition of Consensus Economics expects 6.3%), while average CPI inflation should reach 17% (15.9% in Consensus Economics). The latest IMF Article IV consultation released yesterday also revised down the country’s growth to 6.1% from 6.8% earlier.
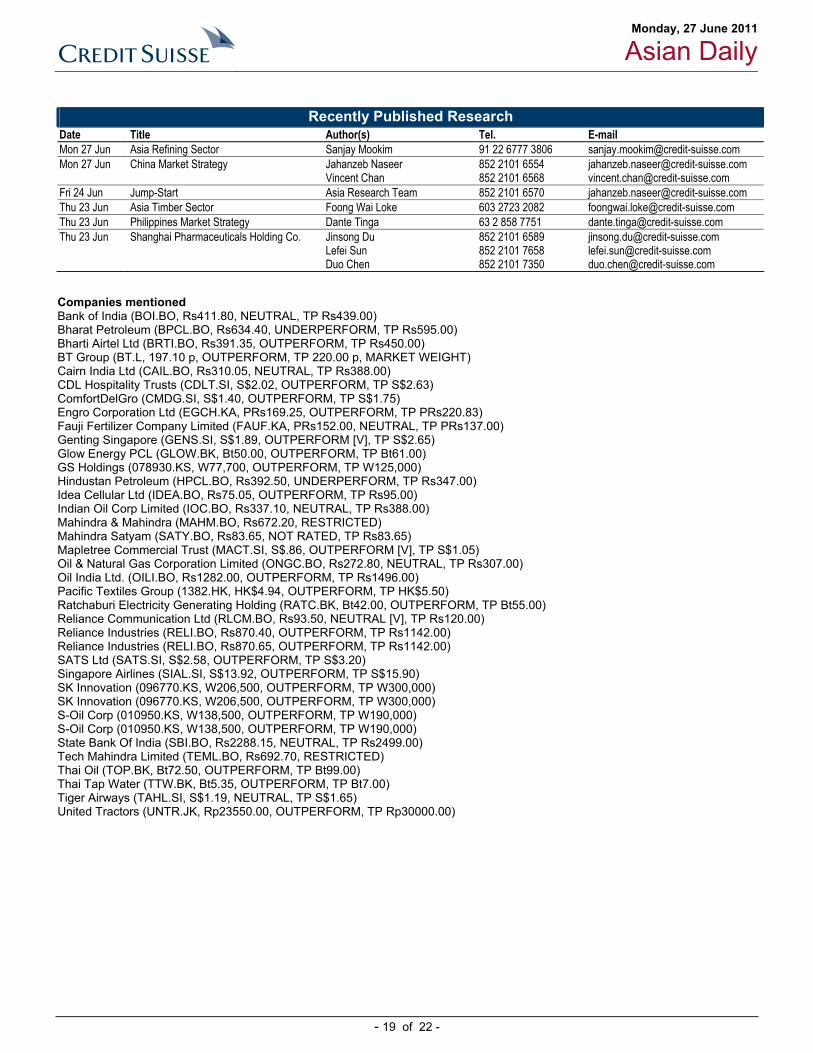
Monday, 27 June 2011
Asian Daily
- 19 of 22 -
Recently Published Research Date Title Author(s) Tel. E-mail Mon 27 Jun Asia Refining Sector Sanjay Mookim 91 22 6777 3806 [email protected] Mon 27 Jun China Market Strategy Jahanzeb Naseer
Vincent Chan 852 2101 6554 852 2101 6568
[email protected] [email protected]
Fri 24 Jun Jump-Start Asia Research Team 852 2101 6570 [email protected] Thu 23 Jun Asia Timber Sector Foong Wai Loke 603 2723 2082 [email protected] Thu 23 Jun Philippines Market Strategy Dante Tinga 63 2 858 7751 [email protected] Thu 23 Jun Shanghai Pharmaceuticals Holding Co. Jinsong Du
Lefei Sun Duo Chen
852 2101 6589 852 2101 7658 852 2101 7350
[email protected] [email protected] [email protected]
Companies mentioned Bank of India (BOI.BO, Rs411.80, NEUTRAL, TP Rs439.00) Bharat Petroleum (BPCL.BO, Rs634.40, UNDERPERFORM, TP Rs595.00) Bharti Airtel Ltd (BRTI.BO, Rs391.35, OUTPERFORM, TP Rs450.00) BT Group (BT.L, 197.10 p, OUTPERFORM, TP 220.00 p, MARKET WEIGHT) Cairn India Ltd (CAIL.BO, Rs310.05, NEUTRAL, TP Rs388.00) CDL Hospitality Trusts (CDLT.SI, S$2.02, OUTPERFORM, TP S$2.63) ComfortDelGro (CMDG.SI, S$1.40, OUTPERFORM, TP S$1.75) Engro Corporation Ltd (EGCH.KA, PRs169.25, OUTPERFORM, TP PRs220.83) Fauji Fertilizer Company Limited (FAUF.KA, PRs152.00, NEUTRAL, TP PRs137.00) Genting Singapore (GENS.SI, S$1.89, OUTPERFORM [V], TP S$2.65) Glow Energy PCL (GLOW.BK, Bt50.00, OUTPERFORM, TP Bt61.00) GS Holdings (078930.KS, W77,700, OUTPERFORM, TP W125,000) Hindustan Petroleum (HPCL.BO, Rs392.50, UNDERPERFORM, TP Rs347.00) Idea Cellular Ltd (IDEA.BO, Rs75.05, OUTPERFORM, TP Rs95.00) Indian Oil Corp Limited (IOC.BO, Rs337.10, NEUTRAL, TP Rs388.00) Mahindra & Mahindra (MAHM.BO, Rs672.20, RESTRICTED) Mahindra Satyam (SATY.BO, Rs83.65, NOT RATED, TP Rs83.65) Mapletree Commercial Trust (MACT.SI, S$.86, OUTPERFORM [V], TP S$1.05) Oil & Natural Gas Corporation Limited (ONGC.BO, Rs272.80, NEUTRAL, TP Rs307.00) Oil India Ltd. (OILI.BO, Rs1282.00, OUTPERFORM, TP Rs1496.00) Pacific Textiles Group (1382.HK, HK$4.94, OUTPERFORM, TP HK$5.50) Ratchaburi Electricity Generating Holding (RATC.BK, Bt42.00, OUTPERFORM, TP Bt55.00) Reliance Communication Ltd (RLCM.BO, Rs93.50, NEUTRAL [V], TP Rs120.00) Reliance Industries (RELI.BO, Rs870.40, OUTPERFORM, TP Rs1142.00) Reliance Industries (RELI.BO, Rs870.65, OUTPERFORM, TP Rs1142.00) SATS Ltd (SATS.SI, S$2.58, OUTPERFORM, TP S$3.20) Singapore Airlines (SIAL.SI, S$13.92, OUTPERFORM, TP S$15.90) SK Innovation (096770.KS, W206,500, OUTPERFORM, TP W300,000) SK Innovation (096770.KS, W206,500, OUTPERFORM, TP W300,000) S-Oil Corp (010950.KS, W138,500, OUTPERFORM, TP W190,000) S-Oil Corp (010950.KS, W138,500, OUTPERFORM, TP W190,000) State Bank Of India (SBI.BO, Rs2288.15, NEUTRAL, TP Rs2499.00) Tech Mahindra Limited (TEML.BO, Rs692.70, RESTRICTED) Thai Oil (TOP.BK, Bt72.50, OUTPERFORM, TP Bt99.00) Thai Tap Water (TTW.BK, Bt5.35, OUTPERFORM, TP Bt7.00) Tiger Airways (TAHL.SI, S$1.19, NEUTRAL, TP S$1.65) United Tractors (UNTR.JK, Rp23550.00, OUTPERFORM, TP Rp30000.00)
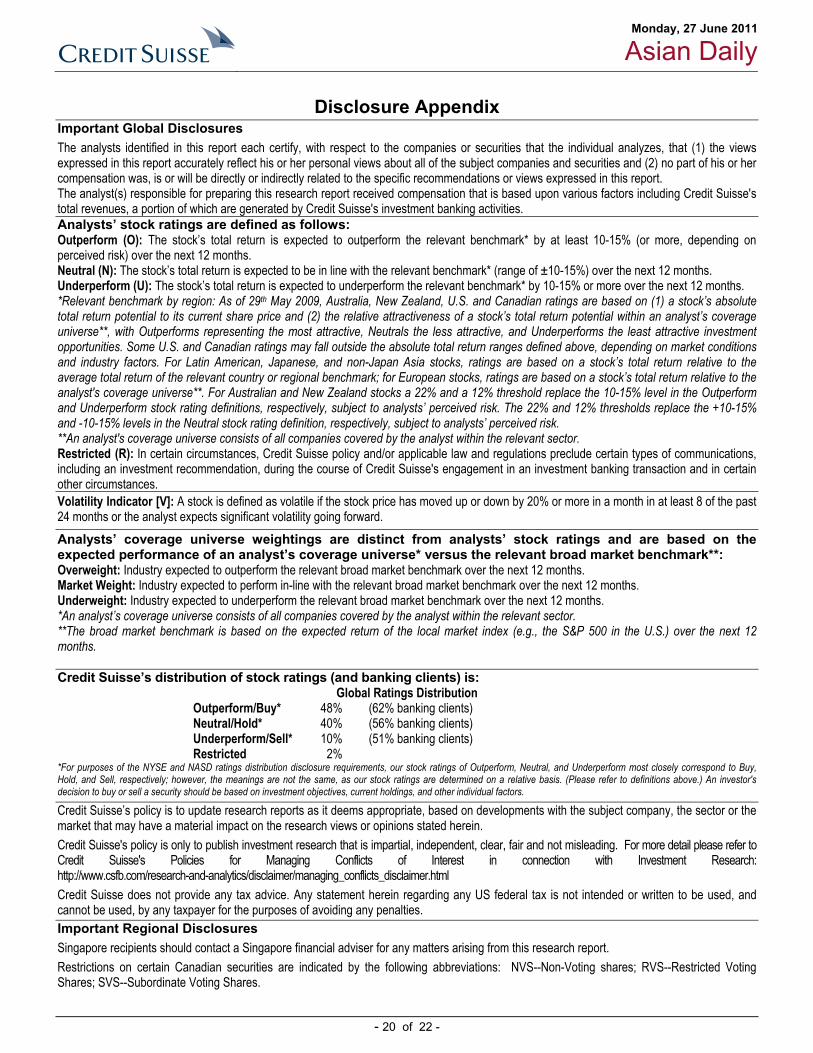
Monday, 27 June 2011
Asian Daily
- 20 of 22 -
Disclosure Appendix Important Global Disclosures The analysts identified in this report each certify, with respect to the companies or securities that the individual analyzes, that (1) the views expressed in this report accurately reflect his or her personal views about all of the subject companies and securities and (2) no part of his or her compensation was, is or will be directly or indirectly related to the specific recommendations or views expressed in this report. The analyst(s) responsible for preparing this research report received compensation that is based upon various factors including Credit Suisse's total revenues, a portion of which are generated by Credit Suisse's investment banking activities. Analysts’ stock ratings are defined as follows: Outperform (O): The stock’s total return is expected to outperform the relevant benchmark* by at least 10-15% (or more, depending on perceived risk) over the next 12 months. Neutral (N): The stock’s total return is expected to be in line with the relevant benchmark* (range of ±10-15%) over the next 12 months. Underperform (U): The stock’s total return is expected to underperform the relevant benchmark* by 10-15% or more over the next 12 months. *Relevant benchmark by region: As of 29th May 2009, Australia, New Zealand, U.S. and Canadian ratings are based on (1) a stock’s absolute total return potential to its current share price and (2) the relative attractiveness of a stock’s total return potential within an analyst’s coverage universe**, with Outperforms representing the most attractive, Neutrals the less attractive, and Underperforms the least attractive investment opportunities. Some U.S. and Canadian ratings may fall outside the absolute total return ranges defined above, depending on market conditions and industry factors. For Latin American, Japanese, and non-Japan Asia stocks, ratings are based on a stock’s total return relative to the average total return of the relevant country or regional benchmark; for European stocks, ratings are based on a stock’s total return relative to the analyst's coverage universe**. For Australian and New Zealand stocks a 22% and a 12% threshold replace the 10-15% level in the Outperform and Underperform stock rating definitions, respectively, subject to analysts’ perceived risk. The 22% and 12% thresholds replace the +10-15% and -10-15% levels in the Neutral stock rating definition, respectively, subject to analysts’ perceived risk. **An analyst's coverage universe consists of all companies covered by the analyst within the relevant sector. Restricted (R): In certain circumstances, Credit Suisse policy and/or applicable law and regulations preclude certain types of communications, including an investment recommendation, during the course of Credit Suisse's engagement in an investment banking transaction and in certain other circumstances. Volatility Indicator [V]: A stock is defined as volatile if the stock price has moved up or down by 20% or more in a month in at least 8 of the past 24 months or the analyst expects significant volatility going forward.
Analysts’ coverage universe weightings are distinct from analysts’ stock ratings and are based on the expected performance of an analyst’s coverage universe* versus the relevant broad market benchmark**: Overweight: Industry expected to outperform the relevant broad market benchmark over the next 12 months. Market Weight: Industry expected to perform in-line with the relevant broad market benchmark over the next 12 months. Underweight: Industry expected to underperform the relevant broad market benchmark over the next 12 months. *An analyst’s coverage universe consists of all companies covered by the analyst within the relevant sector. **The broad market benchmark is based on the expected return of the local market index (e.g., the S&P 500 in the U.S.) over the next 12 months. Credit Suisse’s distribution of stock ratings (and banking clients) is:
Global Ratings Distribution Outperform/Buy* 48% (62% banking clients) Neutral/Hold* 40% (56% banking clients) Underperform/Sell* 10% (51% banking clients) Restricted 2%
*For purposes of the NYSE and NASD ratings distribution disclosure requirements, our stock ratings of Outperform, Neutral, and Underperform most closely correspond to Buy, Hold, and Sell, respectively; however, the meanings are not the same, as our stock ratings are determined on a relative basis. (Please refer to definitions above.) An investor's decision to buy or sell a security should be based on investment objectives, current holdings, and other individual factors.
Credit Suisse’s policy is to update research reports as it deems appropriate, based on developments with the subject company, the sector or the market that may have a material impact on the research views or opinions stated herein. Credit Suisse's policy is only to publish investment research that is impartial, independent, clear, fair and not misleading. For more detail please refer to Credit Suisse's Policies for Managing Conflicts of Interest in connection with Investment Research: http://www.csfb.com/research-and-analytics/disclaimer/managing_conflicts_disclaimer.html Credit Suisse does not provide any tax advice. Any statement herein regarding any US federal tax is not intended or written to be used, and cannot be used, by any taxpayer for the purposes of avoiding any penalties. Important Regional Disclosures Singapore recipients should contact a Singapore financial adviser for any matters arising from this research report. Restrictions on certain Canadian securities are indicated by the following abbreviations: NVS--Non-Voting shares; RVS--Restricted Voting Shares; SVS--Subordinate Voting Shares.

Monday, 27 June 2011
Asian Daily
- 21 of 22 -
Individuals receiving this report from a Canadian investment dealer that is not affiliated with Credit Suisse should be advised that this report may not contain regulatory disclosures the non-affiliated Canadian investment dealer would be required to make if this were its own report. For Credit Suisse Securities (Canada), Inc.'s policies and procedures regarding the dissemination of equity research, please visit http://www.csfb.com/legal_terms/canada_research_policy.shtml. As of the date of this report, Credit Suisse acts as a market maker or liquidity provider in the equities securities that are the subject of this report. Principal is not guaranteed in the case of equities because equity prices are variable. Commission is the commission rate or the amount agreed with a customer when setting up an account or at anytime after that. Please find the full reports, including disclosure information, on Credit Suisse's Research and Analytics Website (http://www.researchandanalytics.com) Taiwanese Disclosures: Reports written by Taiwan-based analysts on non-Taiwan listed companies are not considered recommendations to buy or sell securities under Taiwan Stock Exchange Operational Regulations Governing Securities Firms Recommending Trades in Securities to Customers. Important Credit Suisse HOLT Disclosures With respect to the analysis in this report based on the Credit Suisse HOLT methodology, Credit Suisse certifies that (1) the views expressed in this report accurately reflect the Credit Suisse HOLT methodology and (2) no part of the Firm’s compensation was, is, or will be directly related to the specific views disclosed in this report. The Credit Suisse HOLT methodology does not assign ratings to a security. It is an analytical tool that involves use of a set of proprietary quantitative algorithms and warranted value calculations, collectively called the Credit Suisse HOLT valuation model, that are consistently applied to all the companies included in its database. Third-party data (including consensus earnings estimates) are systematically translated into a number of default variables and incorporated into the algorithms available in the Credit Suisse HOLT valuation model. The source financial statement, pricing, and earnings data provided by outside data vendors are subject to quality control and may also be adjusted to more closely measure the underlying economics of firm performance. These adjustments provide consistency when analyzing a single company across time, or analyzing multiple companies across industries or national borders. The default scenario that is produced by the Credit Suisse HOLT valuation model establishes the baseline valuation for a security, and a user then may adjust the default variables to produce alternative scenarios, any of which could occur. Additional information about the Credit Suisse HOLT methodology is available on request. The Credit Suisse HOLT methodology does not assign a price target to a security. The default scenario that is produced by the Credit Suisse HOLT valuation model establishes a warranted price for a security, and as the third-party data are updated, the warranted price may also change. The default variables may also be adjusted to produce alternative warranted prices, any of which could occur. CFROI®, HOLT, HOLTfolio, HOLTSelect, ValueSearch, AggreGator, Signal Flag and “Powered by HOLT” are trademarks or service marks or registered trademarks or registered service marks of Credit Suisse or its affiliates in the United States and other countries. HOLT is a corporate performance and valuation advisory service of Credit Suisse. Additional information about the Credit Suisse HOLT methodology is available on request. Important MSCI Disclosures The MSCI sourced information is the exclusive property of Morgan Stanley Capital International Inc. (MSCI). Without prior written permission of MSCI, this information and any other MSCI intellectual property may not be reproduced, re-disseminated or used to create any financial products, including any indices. This information is provided on an “as is” basis. The user assumes the entire risk of any use made of this information. MSCI, its affiliates and any third party involved in, or related to, computing or compiling the information hereby expressly disclaim all warranties of originality, accuracy, completeness, merchantability or fitness for a particular purpose with respect to any of this information. Without limiting any of the foregoing, in no event shall MSCI, any of its affiliates or any third party involved in, or related to, computing or compiling the information have any liability for any damages of any kind. MSCI, Morgan Stanley Capital International and the MSCI indexes are services marks of MSCI and its affiliates. The Global Industry Classification Standard (GICS) was developed by and is the exclusive property of Morgan Stanley Capital International Inc. and Standard & Poor’s. GICS is a service mark of MSCI and S&P and has been licensed for use by Credit Suisse. For Credit Suisse disclosure information on other companies mentioned in this report, please visit the website at www.credit-suisse.com/researchdisclosures or call +1 (877) 291-2683. Disclaimers continue on next page.

Monday, 27 June 2011
Asian Daily
- 22 of 22 -
Disclaimers This report is not directed to, or intended for distribution to or use by, any person or entity who is a citizen or resident of or located in any locality, state, country or other jurisdiction where such distribution, publication, availability or use would be contrary to law or regulation or which would subject Credit Suisse AG, the Swiss bank, or its subsidiaries or its affiliates (“CS”) to any registration or licensing requirement within such jurisdiction. All material presented in this report, unless specifically indicated otherwise, is under copyright to CS. None of the material, nor its content, nor any copy of it, may be altered in any way, transmitted to, copied or distributed to any other party, without the prior express written permission of CS. All trademarks, service marks and logos used in this report are trademarks or service marks or registered trademarks or service marks of CS or its affiliates. The information, tools and material presented in this report are provided to you for information purposes only and are not to be used or considered as an offer or the solicitation of an offer to sell or to buy or subscribe for securities or other financial instruments. CS may not have taken any steps to ensure that the securities referred to in this report are suitable for any particular investor. CS will not treat recipients as its customers by virtue of their receiving the report. The investments or services contained or referred to in this report may not be suitable for you and it is recommended that you consult an independent investment advisor if you are in doubt about such investments or investment services. Nothing in this report constitutes investment, legal, accounting or tax advice or a representation that any investment or strategy is suitable or appropriate to your individual circumstances or otherwise constitutes a personal recommendation to you. CS does not offer advice on the tax consequences of investment and you are advised to contact an independent tax adviser. Please note in particular that the bases and levels of taxation may change. CS believes the information and opinions in the Disclosure Appendix of this report are accurate and complete. Information and opinions presented in the other sections of the report were obtained or derived from sources CS believes are reliable, but CS makes no representations as to their accuracy or completeness. Additional information is available upon request. CS accepts no liability for loss arising from the use of the material presented in this report, except that this exclusion of liability does not apply to the extent that liability arises under specific statutes or regulations applicable to CS. This report is not to be relied upon in substitution for the exercise of independent judgment. CS may have issued, and may in the future issue, a trading call regarding this security. Trading calls are short term trading opportunities based on market events and catalysts, while stock ratings reflect investment recommendations based on expected total return over a 12-month period as defined in the disclosure section. Because trading calls and stock ratings reflect different assumptions and analytical methods, trading calls may differ directionally from the stock rating. In addition, CS may have issued, and may in the future issue, other reports that are inconsistent with, and reach different conclusions from, the information presented in this report. Those reports reflect the different assumptions, views and analytical methods of the analysts who prepared them and CS is under no obligation to ensure that such other reports are brought to the attention of any recipient of this report. CS is involved in many businesses that relate to companies mentioned in this report. These businesses include specialized trading, risk arbitrage, market making, and other proprietary trading. Past performance should not be taken as an indication or guarantee of future performance, and no representation or warranty, express or implied, is made regarding future performance. Information, opinions and estimates contained in this report reflect a judgement at its original date of publication by CS and are subject to change without notice. The price, value of and income from any of the securities or financial instruments mentioned in this report can fall as well as rise. The value of securities and financial instruments is subject to exchange rate fluctuation that may have a positive or adverse effect on the price or income of such securities or financial instruments. Investors in securities such as ADR’s, the values of which are influenced by currency volatility, effectively assume this risk. Structured securities are complex instruments, typically involve a high degree of risk and are intended for sale only to sophisticated investors who are capable of understanding and assuming the risks involved. The market value of any structured security may be affected by changes in economic, financial and political factors (including, but not limited to, spot and forward interest and exchange rates), time to maturity, market conditions and volatility, and the credit quality of any issuer or reference issuer. Any investor interested in purchasing a structured product should conduct their own investigation and analysis of the product and consult with their own professional advisers as to the risks involved in making such a purchase. Some investments discussed in this report have a high level of volatility. High volatility investments may experience sudden and large falls in their value causing losses when that investment is realised. Those losses may equal your original investment. Indeed, in the case of some investments the potential losses may exceed the amount of initial investment, in such circumstances you may be required to pay more money to support those losses. Income yields from investments may fluctuate and, in consequence, initial capital paid to make the investment may be used as part of that income yield. Some investments may not be readily realisable and it may be difficult to sell or realise those investments, similarly it may prove difficult for you to obtain reliable information about the value, or risks, to which such an investment is exposed. This report may provide the addresses of, or contain hyperlinks to, websites. Except to the extent to which the report refers to website material of CS, CS has not reviewed the linked site and takes no responsibility for the content contained therein. Such address or hyperlink (including addresses or hyperlinks to CS’s own website material) is provided solely for your convenience and information and the content of the linked site does not in any way form part of this document. Accessing such website or following such link through this report or CS’s website shall be at your own risk. This report is issued and distributed in Europe (except Switzerland) by Credit Suisse Securities (Europe) Limited, One Cabot Square, London E14 4QJ, England, which is regulated in the United Kingdom by The Financial Services Authority (“FSA”). This report is being distributed in Germany by Credit Suisse Securities (Europe) Limited Niederlassung Frankfurt am Main regulated by the Bundesanstalt fuer Finanzdienstleistungsaufsicht ("BaFin"). This report is being distributed in the United States by Credit Suisse Securities (USA) LLC ; in Switzerland by Credit Suisse AG; in Canada by Credit Suisse Securities (Canada), Inc..; in Brazil by Banco de Investimentos Credit Suisse (Brasil) S.A. or its affiliates; in Mexico by Banco Credit Suisse (México), S.A. (transactions related to the securities mentioned in this report will only be effected in compliance with applicable regulation); in Japan by Credit Suisse Securities (Japan) Limited, Financial Instrument Firm, Director-General of Kanto Local Finance Bureau (Kinsho) No. 66, a member of Japan Securities Dealers Association, The Financial Futures Association of Japan; elsewhere in Asia/Pacific by whichever of the following is the appropriately authorised entity in the relevant jurisdiction: Credit Suisse (Hong Kong) Limited, Credit Suisse Equities (Australia) Limited , Credit Suisse Securities (Thailand) Limited, Credit Suisse Securities (Malaysia) Sdn Bhd, Credit Suisse AG, Singapore Branch, Credit Suisse Securities (India) Private Limited regulated by the Securities and Exchange Board of India (registration Nos. INB230970637; INF23097637; INB010970631; INF010970631), having registered address at 9th Floor, Ceejay House, Dr A.B.Road, Worli, Mumbai – 18, India, T- +91-22-6777 3777, Credit Suisse Securities (Europe) Limited, Seoul Branch, Credit Suisse AG, Taipei Securities Branch, PT Credit Suisse Securities Indonesia, and elsewhere in the world by the relevant authorised affiliate of the above. Research on Taiwanese securities produced by Credit Suisse AG, Taipei Securities Branch has been prepared by a registered Senior Business Person. Research provided to residents of Malaysia is authorised by the Head of Research for Credit Suisse Securities (Malaysia) Sdn. Bhd., to whom they should direct any queries on +603 2723 2020. In jurisdictions where CS is not already registered or licensed to trade in securities, transactions will only be effected in accordance with applicable securities legislation, which will vary from jurisdiction to jurisdiction and may require that the trade be made in accordance with applicable exemptions from registration or licensing requirements. Non-U.S. customers wishing to effect a transaction should contact a CS entity in their local jurisdiction unless governing law permits otherwise. U.S. customers wishing to effect a transaction should do so only by contacting a representative at Credit Suisse Securities (USA) LLC in the U.S. Please note that this report was originally prepared and issued by CS for distribution to their market professional and institutional investor customers. Recipients who are not market professional or institutional investor customers of CS should seek the advice of their independent financial advisor prior to taking any investment decision based on this report or for any necessary explanation of its contents. This research may relate to investments or services of a person outside of the UK or to other matters which are not regulated by the FSA or in respect of which the protections of the FSA for private customers and/or the UK compensation scheme may not be available, and further details as to where this may be the case are available upon request in respect of this report. Any Nielsen Media Research material contained in this report represents Nielsen Media Research's estimates and does not represent facts. NMR has neither reviewed nor approved this report and/or any of the statements made herein. If this report is being distributed by a financial institution other than Credit Suisse AG, or its affiliates, that financial institution is solely responsible for distribution. Clients of that institution should contact that institution to effect a transaction in the securities mentioned in this report or require further information. This report does not constitute investment advice by Credit Suisse to the clients of the distributing financial institution, and neither Credit Suisse AG, its affiliates, and their respective officers, directors and employees accept any liability whatsoever for any direct or consequential loss arising from their use of this report or its content. Copyright 2011 CREDIT SUISSE AG and/or its affiliates. All rights reserved. ASIA/PACIFIC: +852 2101-6000 EUROPE: +44 (20) 7888-8888 UNITED STATES OF AMERICA: +1 (212) 325-2000