Engro Powergen Qadirpur Limited Analyst Briefing …...Engro Corporation Portfolio Engro Corporation...
7
Engro Powergen Qadirpur Limited Analyst Briefing Q1 2017 April 21, 2017
Transcript of Engro Powergen Qadirpur Limited Analyst Briefing …...Engro Corporation Portfolio Engro Corporation...

Engro Powergen Qadirpur Limited
Analyst Briefing Q1 2017
April 21, 2017

Engro Corporation Portfolio
Engro Corporation
Engro Fertilizers
56.5%
Engro Foods
40.0%
Engro Eximp Agri Products
100%
Engro Powergen
100%
Engro Powergen Qadirpur
68.9%
Sindh Engro Coal Mining
12.8%
Engro Powergen Thar
50.1%
GEL Utility Limited
45%
Engro Polymer & Chemicals
56.2%
Engro Vopak
50%
Elengy Terminal Pakistan
80%
Engro Elengy Terminal
100%
Engro Foundation

Key Highlights for Q1 2017
EPQL achieved PAT of PKR 669 M for Q1 2017 vs PKR 459 M in Q1 2016
Plant demonstrated a Billable Capacity Factor of 100.6% in Q1 2017 vs 99.9% last year
Management negotiated 110 M from insurance against the damages due to Guddu Transformer Failure
Plant Load Factor was 98.3% in Q1 2017 vs 21.1% (Lower Load Factor in Q1 2016 was due to Guddu Transformer failure at NTDC end)
Overall Liquidity remained under control

1,421
994 876
1,148 1,244
1,175
1,364
982 1,073
879 1,037
1,270
-
500
1,000
1,500
2,000
4Q2015 1Q2016 2Q2016 3Q2016 4Q2016 1Q2017
PK
R in
MN
EPQL - Billing & Receipts (excluding DPI)
Average Monthly Billing Average Monthly Receipts
*Exclusive of GIDC amounts
1,073 961 1,380 786 856 997 1,488 856 766 1,189 840 1,782
1,004838
386 702 723
855
805
1,146
1,394
1,726
2,257
1,568
Apr-16 May-16 Jun-16 Jul-16 Aug-16 Sep-16 Oct-16 Nov-16 Dec-16 Jan-17 Feb-17 Mar-17
PEPCO Receivables (in PKR Mn)
Reciepts - LHS Total overdue Receivables (Exc. Interest) - RHS

461
99
Q1 - 2017 Q1 - 2016
Net Electrical Output (Gw)
98.3%
21.1%
Q1 - 2017 Q1 - 2016
Load Factor100.6% 99.9%
Q1 - 2017 Q1 - 2016
Billable Availability Factor
669
368
Q1 - 2017 Q1 - 2016
PAT (Pkr Mn)
Lower due
to Guddu
transformer
issue
Lower due
to Guddu
transformer
issue
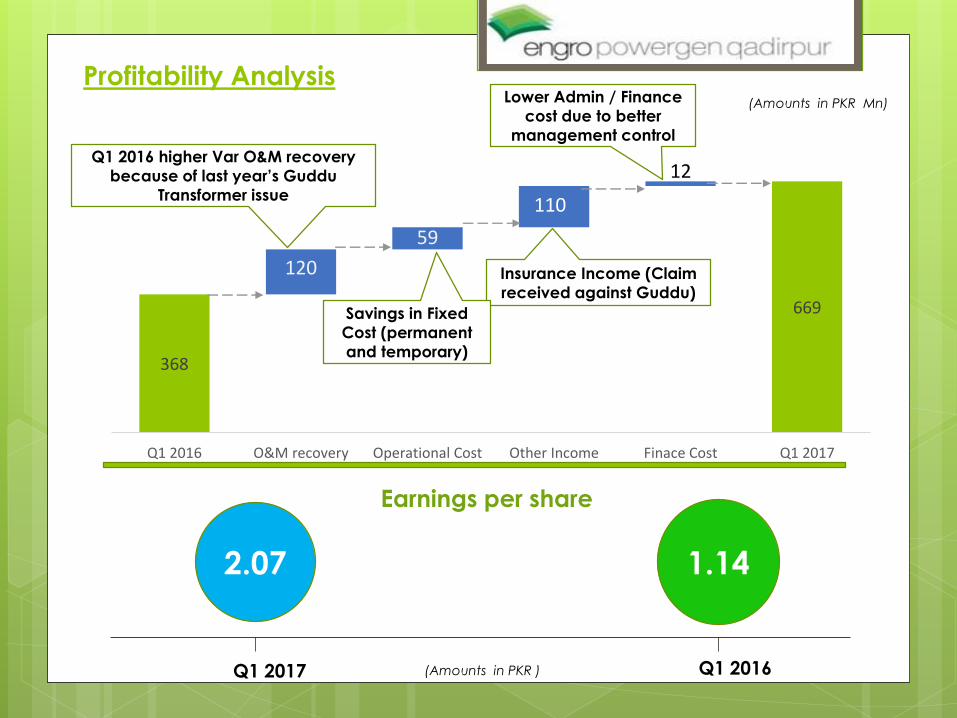
368
669
120
59
110
12
Q1 2016 O&M recovery Operational Cost Other Income Finace Cost Q1 2017
2.07 1.14
Q1 2017 Q1 2016
Profitability Analysis
(Amounts in PKR )
Earnings per share
(Amounts in PKR Mn)
Q1 2016 higher Var O&M recovery
because of last year’s Guddu
Transformer issue
Insurance Income (Claim
received against Guddu)
Lower Admin / Finance
cost due to better
management control
Savings in Fixed
Cost (permanent
and temporary)

Thank you.
Any Questions?