Makaba Macanda Research Data Management: Unisa experience LIASA: 03/10/2012.
Upload
duongkhanhCategory
view
217download
4
SOUTH AFRICAN HOUSEHOLD WEALTH INDEX Q2 2015 1
Q2 2015

2 SOUTH AFRICAN HOUSEHOLD WEALTH INDEX Q2 2015
EXECUTIVE SUMMARY AND HIGHLIGHTS
• South African households’ net wealth decreased in real terms (2010 prices) in the second quarter of
2015 (Q2 2015).
• Momentum/Unisa estimates that real household net wealth declined by 3.9% compared to Q1 2015
(Quarter over quarter seasonally adjusted and annualised - QoQSAA). This means that real
household net wealth declined by R64.5 billion to R6 424 billion (R6.424 trillion) over the quarter.
• This decline was large enough to wipe out all wealth gains since a year ago (Q2 2014). In Q2 2015
real household net wealth was R9 billion less than a year ago.
• The consequence of this decline is that households will have to review their future lifestyle
expectations, as well as adjust their other saving, retirement and investment goals.
• The main cause of the deterioration in the real value of household net wealth can be ascribed to a
relatively strong decline in the purchasing power of the value (real value) of household assets.
• Momentum/Unisa estimates that the real value of household assets declined by R86.4 billion, or
4.3% on a QoQSAA basis. Similarly, the real value of household liabilities declined by R21.9 billion
or 6.0% compared to the real value of liabilities in Q1 2015.
• The real value of household assets was adversely affected by a decline in the real value of financial
assets invested in shares listed at the JSE, stagnation in households’ contributions to contractual
savings products (to annuities, official- and private retirement funds and pension- and group life
business), and a slowdown in house price growth.
• The decline in the real value of household liabilities can be attributed to the un-affordability of debt
as reflected by among others, a further increase in the average weighted interest rate on loans
during Q2 2015. The average weighted interest rate increased to an estimated 12.1% in Q2 2015
from 11.9% in Q1 2015 and is now at the highest level since Q1 2015.
• At 21.9% of amended disposable income, the average instalment (to repay debt) was 6% higher
than a year ago (Q2 2014).

SOUTH AFRICAN HOUSEHOLD WEALTH INDEX Q2 2015 3
TABLE 1: OVERVIEW OF HOUSEHOLD WEALTH INDICATORS (Q UARTERLY)
Household wealth indicators Q4 2014
Q1 2015
Direc -tion
Q2 2015
Direc -tion
Momentum/Unisa Household liabilities (Real R’ billion) 1 415 1 420 ���� 1 398 ����
Momentum/Unisa Household assets (Real R’ billion) 7 721 7 908 ���� 7 822 ����
Momentum/Unisa Household net wealth (Real R’ billion) 6 307 6 488 ���� 6 424 ����
Momentum/Unisa Household liabilities to Disposable Income 78.5 78.3 ���� 76.8 ����
Household net saving(+)/dis-saving(-) (R’ billion) -51.4 -53.3 ���� -52.6 ����
Momentum/Unisa Household assets to Disposable Income 428.2 436.3 ���� 429.8 ����
Momentum/Unisa Household net wealth to Disposable Income 349.8 357.9 ���� 353.0 ����
Momentum/Unisa Household liabilities (Nominal QoQSAA %) 6.1 1.9 ���� 1.6 ����
Momentum/Unisa Household assets (Nominal QoQSAA %) 4.8 10.5 ���� 3.5 ����
Momentum/Unisa Household net wealth (Nominal QoQSAA %) 4.6 12.5 ���� 3.9 ����
Momentum/Unisa Household liabilities (Real QoQSAA %) 2.1 1.6 ���� -6.1 ����
Momentum/Unisa Household assets (Real QoQSAA %) 0.9 10.1 ���� -4.3 ����
Momentum/Unisa Household net wealth (Real QoQSAA %) 0.7 12.0 ���� -3.9 ����
Household debt service costs (Nominal QoQSAA %) 15.5 7.0 ���� 9.8 ����
Key: ���� = growing at slower pace (QoQSAA % change); � = growing at a faster pace (QoQSAA % change);Red colour = not preferred direction in terms of the pace (QoQSAA); Black colour = Preferred direction in terms of the pace (QoQSAA);���� = increase and preferred; ���� increase and not preferred; ���� = decrease and preferred; ���� decrease and not preferred;↔ = unchanged. Note: The above analysis on the preferred direction and pace is done against the prevailing economic environment – which was muted in 2014. The colour coding may therefore be different during different economic circumstances. For instance, if households’ debt increases and they have a negative net saving situation, it means that they borrow money to save –hence the arrow will be up and red. However, if their debt increases and they have a positive net savings situation, the arrow will be up and green. 1. SOUTH AFRICAN HOUSEHOLD BALANCE SHEET
1.1 Background
The strength or weakness of households’ balance sheets as reflected by their liabilities, assets and net
wealth, count among some of the most important economic indicators in South Africa. Analysis of the
balance sheet provides valuable information on the sufficiency of households’ savings, their retirement
prospects, affordability of debt, and their lifestyle expectations. A strong balance sheet is needed for
households to be financially well, which, in turn is essential for their resilience to deal with shocks and to
contribute to a robust economy.
This household wealth report is constructed around the above-mentioned balance sheet measures, with
a specific focus on the second quarter of 2015 (Q2 2015). Additional statistics are provided in the
annexure.

4 SOUTH AFRICAN HOUSEHOLD WEALTH INDEX Q2
2. SOUTH AFRICAN HOUSEHOLD NET WEALTH
South African households’ net wealth is very low by international standards. At around 350% as a
percentage of disposable income it is just more than half the
countries. And to rub further salt into the wounds, South African household net wealth took a further step
backward in Q2 2015. Although household net wealth increased in current prices, deeper analysis
shows that it actually deteriorated on a number of fro
achieve their goals, retire well, and maintain current lifestyles.
Momentum/Unisa estimated the value of South African households’ net wealth
subtracting their liabilities from assets
R8 351 billion.
However, the increase in household net wealth was smaller than the increase in the value of
households’ disposable income. Consequ
declined from 357.9% in Q1 2015 to 353.0% in Q2 2015 (see figure 1). This ratio had been stagnating
for 18 months and is also at a similar level as eight years ago.
FIGURE 1: HOUSEHOLD NET WEALT
Source: Momentum/UNISA calculations.
200
225
250
275
300
325
350
375
400
20
05
/…
20
06
/…
20
07
/…
20
07
/…
20
08
/…
OLD WEALTH INDEX Q2 2015
SOUTH AFRICAN HOUSEHOLD NET WEALTH
South African households’ net wealth is very low by international standards. At around 350% as a
percentage of disposable income it is just more than half the approximately 650% recorded in developed
countries. And to rub further salt into the wounds, South African household net wealth took a further step
backward in Q2 2015. Although household net wealth increased in current prices, deeper analysis
it actually deteriorated on a number of fronts and will negatively affect
achieve their goals, retire well, and maintain current lifestyles.
Momentum/Unisa estimated the value of South African households’ net wealth –
subtracting their liabilities from assets – to have increased by R78.9 billion during Q2 2105 to
However, the increase in household net wealth was smaller than the increase in the value of
households’ disposable income. Consequently the ratio of household net wealth to disposable income
declined from 357.9% in Q1 2015 to 353.0% in Q2 2015 (see figure 1). This ratio had been stagnating
for 18 months and is also at a similar level as eight years ago.
FIGURE 1: HOUSEHOLD NET WEALT H AS PERCENTAGE OF DISPOSABLE INCOME STAGNATING
20
08
/…
20
09
/…
20
10
/…
20
10
/…
20
11
/…
20
12
/…
20
13
/…
20
13
/…
South African households’ net wealth is very low by international standards. At around 350% as a
approximately 650% recorded in developed
countries. And to rub further salt into the wounds, South African household net wealth took a further step
backward in Q2 2015. Although household net wealth increased in current prices, deeper analysis
nts and will negatively affect households’ ability to
– which is calculated by
to have increased by R78.9 billion during Q2 2105 to
However, the increase in household net wealth was smaller than the increase in the value of
ently the ratio of household net wealth to disposable income
declined from 357.9% in Q1 2015 to 353.0% in Q2 2015 (see figure 1). This ratio had been stagnating
H AS PERCENTAGE OF DISPOSABLE INCOME STAGNATING
20
14
/…
20
15
/…

SOUTH AFRICAN HOUSEHOLD WEALTH INDEX Q2 2015 5
This phenomenon of stagnating net wealth to income at a relatively low level, is unsettling from a living
standard point of view. It shows that households’ income is not sufficiently employed to accumulate
wealth in order to maintain or improve living standards - and where the income had indeed been
employed for wealth creating purposes, it did not generate sufficient returns. The low returns are, among
others, the consequence of an economy failing to grow at potential and at the same time sustaining large
imbalances. This is illustrated by economic growth that contracted at a pace of 0.6% in Q2 2015
compared to Q1 2015, the rand exchange rate which depreciated by almost 10% against the US dollar
over the past year, the expanded unemployment rate that remained elevated at 35%, electricity
generation which is less than a year ago and the current account deficit that remained around 4% of
gross domestic product (GDP).
This lack of wealth creation is also visible from other statistics. When expressed in real terms (constant
2010 prices), household net wealth declined by 3.9% (QoQSAA) compared to Q1 2015. This means
that prices increased at a faster rate than household net wealth, making the achievement of some
personal financial goals more difficult. This decline in real household net wealth represents a decrease
of R64.5 billion in Q2 2015 to R6 424 billion. And compared to a year ago (Q2 2014), real household net
wealth was 1.9% or R9.1 billion less.
A decline in the purchasing power of household net wealth also means that on average households will
not retire well, or according to their expectations – unless they adjust their behaviour by channelling a
larger share of their income towards contractual and emergency savings, as well as reducing their
outstanding debt levels.
3. SOUTH AFRICAN HOUSEHOLD LIABILITIES
South African households’ liabilities - consisting of outstanding debts, namely loans/credit and unpaid
accounts, such as municipal, cell phone, medical and school fees - were estimated at R1 817.6 billion at
the end of Q2 2015. Nevertheless, household liabilities showed a slow growing and sometimes
contracting trend over the past few years - as shown by figure 2.

6 SOUTH AFRICAN HOUSEHOLD WEALTH INDEX Q2
FIGURE 2: THE PACE AND GROWTH IN REAL HOUSEHOLD LIA BILITIES ARE CONTRACTING
Source: Momentum/UNISA calculations.
When expressed in real terms (2010 prices) the pace and growth in household liabilities contracted in
Q2 2015. Compared to Q1 2015 hous
lower than in Q2 2014. This contributed to the ratio of household liabilities to disposable income
declining from around 78% over the past year to 76.8% in Q2 2015.
However, this does not necessarily mean that households are under less financial pressure, or that they
are deleveraging. On the contrary, as shown by figure 3, statistics from the National Credit Regulator
(NCR) suggest that the proportion of approved loans declined to 43.9% in
Q1 2015. When accounting for the fact that the number of loan applications continued to increase in
Q2 2015, it means households are “almost desperately” reverting to loans in an attempt to finance their
expenses – however, the majority are unsuccessful.
-10
-8
-6
-4
-2
0
2
4
6
8
10
2011
/03
2011
/04
2012
/01
2012
/02
2012
/03
2012
/04
Liabilities QoQSAA % change
OLD WEALTH INDEX Q2 2015
FIGURE 2: THE PACE AND GROWTH IN REAL HOUSEHOLD LIA BILITIES ARE CONTRACTING
When expressed in real terms (2010 prices) the pace and growth in household liabilities contracted in
Q2 2015. Compared to Q1 2015 household liabilities contracted at a pace of 6.0%, while it was 0.3%
lower than in Q2 2014. This contributed to the ratio of household liabilities to disposable income
declining from around 78% over the past year to 76.8% in Q2 2015.
necessarily mean that households are under less financial pressure, or that they
are deleveraging. On the contrary, as shown by figure 3, statistics from the National Credit Regulator
(NCR) suggest that the proportion of approved loans declined to 43.9% in Q2 2015 from 47.4% in
Q1 2015. When accounting for the fact that the number of loan applications continued to increase in
Q2 2015, it means households are “almost desperately” reverting to loans in an attempt to finance their
jority are unsuccessful.
2012
/04
2013
/01
2013
/02
2013
/03
2013
/04
2014
/01
2014
/02
2014
/03
2014
/04
Liabilities QoQSAA % change Liabilities YoY % change
FIGURE 2: THE PACE AND GROWTH IN REAL HOUSEHOLD LIA BILITIES ARE CONTRACTING
When expressed in real terms (2010 prices) the pace and growth in household liabilities contracted in
ehold liabilities contracted at a pace of 6.0%, while it was 0.3%
lower than in Q2 2014. This contributed to the ratio of household liabilities to disposable income
necessarily mean that households are under less financial pressure, or that they
are deleveraging. On the contrary, as shown by figure 3, statistics from the National Credit Regulator
Q2 2015 from 47.4% in
Q1 2015. When accounting for the fact that the number of loan applications continued to increase in
Q2 2015, it means households are “almost desperately” reverting to loans in an attempt to finance their
2015
/01
2015
/02

FIGURE 3: APPROVED LOAN APPLICATIONS DECLINING AGAI N IN Q2 2015
Source: National Credit Regulator; Momentum/UNISA calculations.
A further indication of the financial pressure that households are experiencing is visible from th
slowdown in the pace of durable goods (normally financed by loans) acquisitions. The volume of durable
goods purchased increased at a slowing pace of 0.2% in Q2 2015 compared to 1.3% in Q1 2015. In
relation to a year ago, durable goods purchases were 2.
and 4.4% registered in Q4 2014. This was among others, caused by the crowding out effect of interest
rate increases that contributed to households allocating a larger portion of their income to the repayment
of debt. NCR and Reserve Bank consumer credit statistics show that households’ instalments
expressed as a percentage of their (amended
ago to (21.9%).
Households’ financial burden is also illustrated by thei
outstanding credit in Q2 2015. This is worrisome as it followed a gradual decline that lasted four
consecutive quarters from 12.9% in Q1 2014 to 11.9% in Q1 2015. Putting it differently, arrears per
account increased from R8 573 in Q1 2015 to R9 292 in Q2 2015. Although such a jump in arrears is
alarming, it might be a technical or data issue and as such,
conclusions can be drawn (while it might also be an i
Everything is not negative, though. It seems that consumers had been improving their account
payments. In Q2 2015 some 73.6% of all accounts had been in good standing (accounts up to date and
one and two months in arrears) compared to 72.7% in Q1 2015.
1 Disposable income plus debt service costs.
30
35
40
45
50
55
60
65
70
2007
Q4
2008
Q1
2008
Q2
2008
Q3
2008
Q4
2009
Q1
2009
Q2
2009
Q3
2009
Q4
2010
Q1
2010
Q2
SOUTH AFRICAN HOUSEHOLD WEALTH INDEX Q2
FIGURE 3: APPROVED LOAN APPLICATIONS DECLINING AGAI N IN Q2 2015
Source: National Credit Regulator; Momentum/UNISA calculations.
A further indication of the financial pressure that households are experiencing is visible from th
slowdown in the pace of durable goods (normally financed by loans) acquisitions. The volume of durable
goods purchased increased at a slowing pace of 0.2% in Q2 2015 compared to 1.3% in Q1 2015. In
relation to a year ago, durable goods purchases were 2.7% higher – down from the 3.5% in Q1 2015
and 4.4% registered in Q4 2014. This was among others, caused by the crowding out effect of interest
rate increases that contributed to households allocating a larger portion of their income to the repayment
bt. NCR and Reserve Bank consumer credit statistics show that households’ instalments
expressed as a percentage of their (amended1) disposable income increased 6% compared to a year
Households’ financial burden is also illustrated by their amount in arrears that increased to 12.4% of their
outstanding credit in Q2 2015. This is worrisome as it followed a gradual decline that lasted four
consecutive quarters from 12.9% in Q1 2014 to 11.9% in Q1 2015. Putting it differently, arrears per
count increased from R8 573 in Q1 2015 to R9 292 in Q2 2015. Although such a jump in arrears is
data issue and as such, more clarification is needed before definite
(while it might also be an increase in debt write-offs).
Everything is not negative, though. It seems that consumers had been improving their account
payments. In Q2 2015 some 73.6% of all accounts had been in good standing (accounts up to date and
mpared to 72.7% in Q1 2015.
Disposable income plus debt service costs.
2010
Q3
2010
Q4
2011
Q1
2011
Q2
2011
Q3
2011
Q4
2012
Q1
2012
Q2
2012
Q3
2012
Q4
2013
Q1
2013
Q2
2013
Q3
2013
Q4
2014
Q1
2014
Q2
2014
Q3
OLD WEALTH INDEX Q2 2015 7
A further indication of the financial pressure that households are experiencing is visible from the
slowdown in the pace of durable goods (normally financed by loans) acquisitions. The volume of durable
goods purchased increased at a slowing pace of 0.2% in Q2 2015 compared to 1.3% in Q1 2015. In
down from the 3.5% in Q1 2015
and 4.4% registered in Q4 2014. This was among others, caused by the crowding out effect of interest
rate increases that contributed to households allocating a larger portion of their income to the repayment
bt. NCR and Reserve Bank consumer credit statistics show that households’ instalments
) disposable income increased 6% compared to a year
r amount in arrears that increased to 12.4% of their
outstanding credit in Q2 2015. This is worrisome as it followed a gradual decline that lasted four
consecutive quarters from 12.9% in Q1 2014 to 11.9% in Q1 2015. Putting it differently, arrears per
count increased from R8 573 in Q1 2015 to R9 292 in Q2 2015. Although such a jump in arrears is
more clarification is needed before definite
Everything is not negative, though. It seems that consumers had been improving their account
payments. In Q2 2015 some 73.6% of all accounts had been in good standing (accounts up to date and
2014
Q3
2014
Q4
2015
Q1
2015
Q2

8 SOUTH AFRICAN HOUSEHOLD WEALTH INDEX Q2 2015
In sum, although the lower household debt to disposable income ratio paints a picture of deleveraging,
many households are experiencing a deterioration in their financial situation. This is highlighted by
statistics that show an increase in the proportion of new loan applications that had been rejected.
Furthermore, the arrears ratio increased again. This was, among others, brought about by higher
interest rates that caused their instalment ratio to increase, leaving fewer funds available to finance other
expenses, which, in turn caused them to default and unsuccessfully apply for more loans. With price
increases and interest rates expected to increase further, the pressure to default on more loans might
increase further. As such, the current slow pace at which liabilities are increasing might continue for a
while.
4. SOUTH AFRICAN HOUSEHOLD ASSETS
Household assets are dominated by financial assets that comprise approximately 70% of their total
assets. Financial assets mainly consist of investments, which in turn are dominated by contributions to
retirement funds. In the non-financial assets category, residential property is the largest asset category
and also the second largest category after households’ interests in retirement funds.
Momentum/Unisa estimates that the value of household assets increased to R10 169 billion in Q2 2015
from R10 083 billion in Q1 2015. This increase of only R86 billion between the two quarters is equal to
an annualised growth rate of 3.5%, while household assets were 4.1% higher than a year before.
However, when expressed in purchasing power, or real terms (2010 prices), the value of household
assets declined by R86.4 billion to R7 822 billion in Q2 2015. This is 4.3% lower compared to Q1 2015
and 0.1% less than in Q1 2014. This spells danger as it means that the value of households’ assets
could purchase less than a year before.
During Q2 2015 the value of household assets was mainly affected by the return on their investments,
their contributions to retirement funds, the pace of new investments in residential property and the
growth in house prices.
As for the returns on investments the news is not good. The JSE All Share Index (Alsi) was 0.7% lower
at the end of Q2 2015 compared to the end of Q1 2015 and only 1.7% higher than at the end of
Q2 2014. This means that the prices of listed company shares in which investments were made
declined in real terms, negatively affecting the value of households’ financial assets.
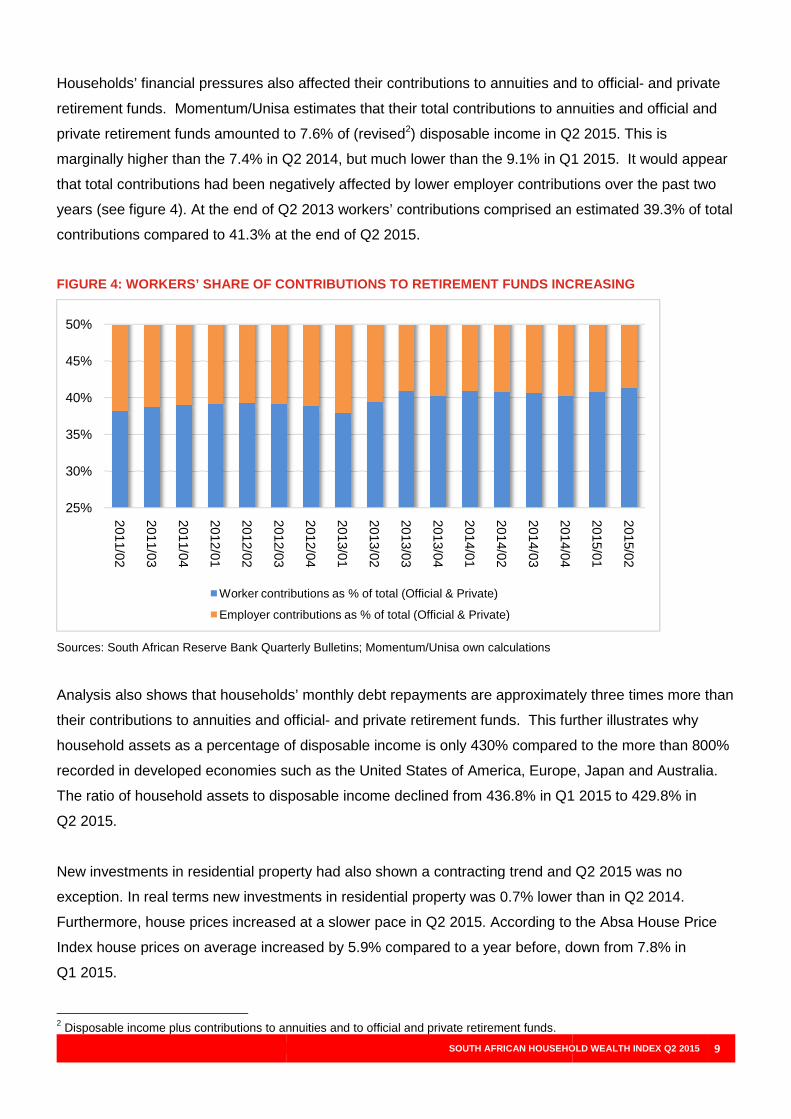
Households’ financial pressures also affected their contributions to annuities and to official
retirement funds. Momentum/Unisa estimates that their total contributions to annuities and official and
private retirement funds amounted to 7.6% of (revised
marginally higher than the 7.4% in Q2 2014, but much lower than the 9.1% in Q1 2015. It would appear
that total contributions had been negatively affected by lower employer contributions over the past two
years (see figure 4). At the end of Q2 2013 workers’ contributions comprised an estimated 39.3% of total
contributions compared to 41.3% at the end of Q2 2015.
FIGURE 4: WORKERS’ SHARE OF CONTRIBUTIONS TO RETIRE MENT FUNDS INCREASING
Sources: South African Reserve Bank Quarterly Bulletins; Momentum/Unisa own calculations
Analysis also shows that households’ monthly debt repayments are approximately three times more than
their contributions to annuities and official
household assets as a percentage of disposable income is only 430% compared to
recorded in developed economies such as the United States of America, Europe, Japan and Australia.
The ratio of household assets to disposable income dec
Q2 2015.
New investments in residential property had also shown a contracting trend and Q2 2015 was no
exception. In real terms new investments in residential property was 0.7% lower than in Q2 2014.
Furthermore, house prices increased at a slower pace in Q2 2015. According to the Absa House Price
Index house prices on average increased by 5.9% compared to a year before, down from 7.8% in
Q1 2015.
2 Disposable income plus contributions to annuities and to official a
25%
30%
35%
40%
45%
50%
2011/02
2011/03
2011/04
2012/01
2012/02
2012/03
Worker contributions as % of total (Official & Private)
Employer contributions as % of total (Official & Private)
SOUTH AFRICAN HOUSEHOLD WEALTH INDEX Q2
al pressures also affected their contributions to annuities and to official
retirement funds. Momentum/Unisa estimates that their total contributions to annuities and official and
private retirement funds amounted to 7.6% of (revised2) disposable income in Q2 2015. This is
marginally higher than the 7.4% in Q2 2014, but much lower than the 9.1% in Q1 2015. It would appear
that total contributions had been negatively affected by lower employer contributions over the past two
4). At the end of Q2 2013 workers’ contributions comprised an estimated 39.3% of total
contributions compared to 41.3% at the end of Q2 2015.
FIGURE 4: WORKERS’ SHARE OF CONTRIBUTIONS TO RETIRE MENT FUNDS INCREASING
uarterly Bulletins; Momentum/Unisa own calculations
Analysis also shows that households’ monthly debt repayments are approximately three times more than
their contributions to annuities and official- and private retirement funds. This further illustrates
household assets as a percentage of disposable income is only 430% compared to
recorded in developed economies such as the United States of America, Europe, Japan and Australia.
The ratio of household assets to disposable income declined from 436.8% in Q1 2015 to 429.8% in
New investments in residential property had also shown a contracting trend and Q2 2015 was no
exception. In real terms new investments in residential property was 0.7% lower than in Q2 2014.
house prices increased at a slower pace in Q2 2015. According to the Absa House Price
Index house prices on average increased by 5.9% compared to a year before, down from 7.8% in
Disposable income plus contributions to annuities and to official and private retirement funds.
2012/03
2012/04
2013/01
2013/02
2013/03
2013/04
2014/01
2014/02
2014/03
2014/04
Worker contributions as % of total (Official & Private)
Employer contributions as % of total (Official & Private)
OLD WEALTH INDEX Q2 2015 9
al pressures also affected their contributions to annuities and to official- and private
retirement funds. Momentum/Unisa estimates that their total contributions to annuities and official and
able income in Q2 2015. This is
marginally higher than the 7.4% in Q2 2014, but much lower than the 9.1% in Q1 2015. It would appear
that total contributions had been negatively affected by lower employer contributions over the past two
4). At the end of Q2 2013 workers’ contributions comprised an estimated 39.3% of total
FIGURE 4: WORKERS’ SHARE OF CONTRIBUTIONS TO RETIRE MENT FUNDS INCREASING
Analysis also shows that households’ monthly debt repayments are approximately three times more than
and private retirement funds. This further illustrates why
household assets as a percentage of disposable income is only 430% compared to the more than 800%
recorded in developed economies such as the United States of America, Europe, Japan and Australia.
lined from 436.8% in Q1 2015 to 429.8% in
New investments in residential property had also shown a contracting trend and Q2 2015 was no
exception. In real terms new investments in residential property was 0.7% lower than in Q2 2014.
house prices increased at a slower pace in Q2 2015. According to the Absa House Price
Index house prices on average increased by 5.9% compared to a year before, down from 7.8% in
2014/04
2015/01
2015/02

10 SOUTH AFRICAN HOUSEHOLD WEALTH INDEX Q2 2015
The above analyses show that the purchasing power value of household assets lost ground in almost
every asset class. The bad news is that this situation is set to continue – unless households in the
middle and high income classes make some behavioural changes by prioritising asset growth instead of
borrowing. This will be necessary if they want to maintain their current living standards.
5. CONCLUSION The real value of household net wealth declined during Q2 2015. The decline wiped out all net wealth
gains since Q2 2014.
This means that households will have to lower their lifestyle expectations and review their financial
goals. Moreover, they need to change their financial behaviour as they apportion almost three times
more money to the repayment of debt than to contractual savings (contributions to annuities and official-
and private retirement funds). In short, households in especially the middle- and high income categories
urgently need to prioritise their savings to consumption.
Compiled By: Mr. Johann van Tonder, Momentum, Economist & Researcher: Financial Wellness Tel: 012 673 8302 | Mobile: 081 041 9699 Email: [email protected] Reviewed By: Prof. Bernadene de Clercq, UNISA, Mobile: 083 442 4659 Email: [email protected] Me. JacolizeMeiring, UNISA, Mobile: 082 354 5777 Email [email protected] Department of Taxation, College of Accounting Sciences, Unisa General Contact Details Momentum: https://www.momentum.co.za/for/you/sponsorships/household-financial-wellness-index UNISA: Department of Taxation 012 429 3720 PO Box 392, UNISA, 0003

SOUTH AFRICAN HOUSEHOLD WEALTH INDEX Q2 2015 11
NOTES By analysing the changes and levels of South African households’ liabilities, assets and net wealth,
Momentum/Unisa attempts to develop outcome-based measures that can be useful to policy makers,
companies, financial advisors and households in the quest to improve the financial wellness of South
African individuals and households.
Such outcome-based measures include, among others, the following:
• identification of the variables that affect and drive the value of household liabilities, assets and
net wealth;
• estimating the levels of and changes in household liabilities, assets and net wealth; and
• constantly developing new indicators that can assist in gauging whether households’ financial
situation is improving or deteriorating.
To estimate the level, change in and drivers of households’ liabilities, assets and net wealth, an
econometric model was developed using the South African Reserve Bank’s (SARB) estimates of these
variables as a benchmark. The financial ratios were estimated from the Momentum/Unisa estimates of
the household balance sheet, as well as statistics from the National Credit Regulator and Statistics
South Africa (Stats SA).
Bibliography ABSA. www.absa.co.za
The Association for Savings and Investment South Africa.www.asisa.org.za
Bloomberg www.bloomberg.com
International Monetary Fund.www.imf.org
JSE www.jse.co.za
Reserve Bank of Australia.www.rba.gov.au
Trading Economics www.tradingeconomics.com
National Credit Regulator.www.ncr.org.za.
South African Reserve Bank. Quarterly Bulletin. September 2015. www.resbank.co.za
Statistics South Africa.www.statssa.gov.za

12 SOUTH AFRICAN HOUSEHOLD WEALTH INDEX Q2 2015
ANNEXURE TABLE A1: MOMENTUM/UNISA HOUSEHOLD LIABILITIES, ASSETS AND NE T WEALTH INDICES: QUARTERLY NOMINAL SEASONALLY ADJUSTED AND ANNUALISE D (SAA): 2010 = 100
Quarter HH Liabilities SAA HH Assets SAA HH Net Wealth SAA
2010/01 97.66 98.15 98.28 2010/02 102.24 95.86 94.22 2010/03 98.54 101.69 102.49 2010/04 101.57 104.30 105.01 2011/01 103.09 105.72 106.39 2011/02 105.85 107.16 107.50 2011/03 108.51 105.66 104.93 2011/04 111.34 110.62 110.44 2012/01 113.84 113.42 113.32 2012/02 116.42 115.18 114.86 2012/03 119.51 119.74 119.79 2012/04 122.10 126.98 128.24 2013/01 125.31 128.90 129.82 2013/02 126.57 128.96 129.57 2013/03 129.20 136.91 138.88 2013/04 131.44 141.36 143.90 2014/01 133.49 148.13 151.89 2014/02 134.73 153.69 158.55 2014/03 136.76 152.86 156.98 2014/04 138.80 154.67 158.75 2015/01 139.46 158.57 163.48 2015/02 140.01 159.93 165.03
Source: Momentum/Bureau of Market Research at Unisa: Own calculations.

SOUTH AFRICAN HOUSEHOLD WEALTH INDEX Q2 2015 13
TABLE A2: MOMENTUM/UNISA HOUSEHOLD LIABILITIES, ASSETS AND NE T WEALTH AS PERCENTAGE OF DISPOSABLE INCOME: QUARTERLY SEASONALLY ADJUSTED AND ANNUALISED (SAA)
Quarter Liabilities (SAA) to Disposable Income
Assets (SAA) to Disposable Income
Net Wealth (SAA) to Disposable Income
2010/01 81.72 402.30 320.58 2010/02 83.72 384.45 300.74 2010/03 78.72 397.87 319.15 2010/04 78.86 396.68 317.82 2011/01 78.36 393.56 315.21 2011/02 78.03 386.91 308.88 2011/03 78.31 373.51 295.19 2011/04 78.36 381.35 302.99 2012/01 79.27 386.85 307.58 2012/02 79.29 384.22 304.92 2012/03 79.51 390.14 310.64 2012/04 78.66 400.70 322.04 2013/01 79.80 402.07 322.27 2013/02 79.29 395.68 316.39 2013/03 79.54 412.79 333.26 2013/04 79.53 418.95 339.42 2014/01 79.07 429.75 350.68 2014/02 78.48 438.49 360.01 2014/03 78.41 429.23 350.82 2014/04 78.46 428.22 349.77 2015/01 78.34 436.28 357.94 2015/02 76.83 429.83 353.00
Source: Momentum/Bureau of Market Research at Unisa: Own calculations.

14 SOUTH AFRICAN HOUSEHOLD WEALTH INDEX Q2 2015
TABLE A3: MOMENTUM/UNISA HOUSEHOLD LIABILITIES, ASSETS AND NE T WEALTH: REAL (2010 prices) QUARTER OVER QUARTER SEASONALLY ADJUSTED AND ANNUALISED PERCENTAGE CHANGE (QoQSAA % CHANGE)
Quarter Liabilities Assets Net Wealth
2010/01 3.61 7.38 8.37 2010/02 15.44 -12.57 -18.81 2010/03 -16.76 22.13 35.04 2010/04 8.63 6.56 6.05 2011/01 1.08 0.50 0.36 2011/02 2.55 -2.59 -3.84 2011/03 3.64 -11.30 -14.80 2011/04 1.81 10.36 12.72 2012/01 5.70 6.88 7.18 2012/02 2.88 0.02 -0.71 2012/03 5.39 10.85 12.30 2012/04 -0.61 15.41 19.80 2013/01 8.31 3.66 2.54 2013/02 -0.82 -4.55 -5.46 2013/03 2.52 19.96 24.66 2013/04 0.75 6.91 8.42 2014/01 -0.91 12.31 15.59 2014/02 -1.24 10.27 13.00 2014/03 1.35 -6.59 -8.26 2014/04 2.15 0.95 0.69 2015/01 1.56 10.06 12.04 2015/02 -6.04 -4.30 -3.92
Source: Momentum/Bureau of Market Research at Unisa: Own calculations.

SOUTH AFRICAN HOUSEHOLD WEALTH INDEX Q2 2015 15
TABLE A4: MOMENTUM/UNISA HOUSEHOLD LIABILITIES, ASSETS AND NE T WEALTH: REAL YEAR OVER YEAR PERCENTAGE CHANGE (YoY % CHANGE )
Quarter Liabilities Assets Net Wealth
2010/01 -5.48 11.30 16.58 2010/02 2.45 6.34 7.47 2010/03 -1.12 7.52 9.89 2010/04 1.98 5.14 5.95 2011/01 1.35 3.41 3.94 2011/02 -1.60 6.24 8.43 2011/03 3.94 -1.92 -3.37 2011/04 2.27 -1.06 -1.88 2012/01 3.42 0.48 -0.26 2012/02 3.50 1.14 0.54 2012/03 3.93 6.94 7.73 2012/04 3.31 8.14 9.39 2013/01 3.94 7.31 8.18 2013/02 3.00 6.07 6.87 2013/03 2.29 8.18 9.69 2013/04 2.63 6.13 6.99 2014/01 0.37 8.28 10.24 2014/02 0.27 12.26 15.27 2014/03 -0.02 5.45 6.76 2014/04 0.32 3.95 4.80 2015/01 0.95 3.43 3.99 2015/02 -0.30 -0.17 -0.14
Source: Momentum/Bureau of Market Research at Unisa: Own calculations.

16 SOUTH AFRICAN HOUSEHOLD WEALTH INDEX Q2 2015
TABLE A5: MOMENTUM/UNISA HOUSEHOLD LIABILITIES, ASSETS AND NE T WEALTH: REAL SEASONALLY ADJUSTED AND ANNUALISED ESTIMATES ( R’ billion)
Quarter Liabilities Assets Net Wealth
2010/01 1 267 816 6 241 106 4 973 290 2010/02 1 327 228 6 095 062 4 767 834 2010/03 1 279 268 6 465 632 5 186 364 2010/04 1 318 538 6 632 086 5 313 548 2011/01 1 338 352 6 722 181 5 383 829 2011/02 1 374 165 6 813 853 5 439 688 2011/03 1 408 716 6 718 604 5 309 888 2011/04 1 445 395 7 033 930 5 588 535 2012/01 1 477 891 7 211 969 5 734 078 2012/02 1 511 429 7 323 728 5 812 299 2012/03 1 551 492 7 613 334 6 061 841 2012/04 1 585 073 8 074 158 6 489 085 2013/01 1 626 726 8 195 822 6 569 096 2013/02 1 643 200 8 199 755 6 556 555 2013/03 1 677 281 8 705 132 7 027 851 2013/04 1 706 326 8 988 257 7 281 931 2014/01 1 732 942 9 418 873 7 685 931 2014/02 1 749 051 9 772 132 8 023 081 2014/03 1 775 439 9 719 257 7 943 818 2014/04 1 801 872 9 834 931 8 033 058 2015/01 1 810 543 10 082 825 8 272 282
2015/02 1 817 646 10 168 829 8 351 183
Source: Momentum/Bureau of Market Research at Unisa: Own calculations.

SOUTH AFRICAN HOUSEHOLD WEALTH INDEX Q2 2015 17
TABLE A6: MOMENTUM/UNISA HOUSEHOLD LIABILITIES, ASSETS AND NE T WEALTH: ANNUAL VALUES AT YEAR END EXPRESSED IN CURRENT PRIC ES
Liabilities Assets Net Wealth
1993 128 937 911 914 782 977 1994 157 617 1 177 014 1 019 397 1995 231 446 1 254 512 1 023 066 1996 284 335 1 421 560 1 137 225 1997 283 601 1 455 543 1 171 942 1998 273 384 1 475 845 1 202 461 1999 302 152 1 867 089 1 564 937 2000 363 227 2 026 482 1 663 256 2001 395 833 2 342 876 1 947 043 2002 430 621 2 462 632 2 032 011 2003 510 049 2 693 712 2 183 663 2004 603 122 3 234 891 2 631 769 2005 740 920 3 981 111 3 240 191 2006 909 196 4 869 579 3 960 383 2007 1 256 670 5 572 189 4 315 520 2008 1 195 954 5 417 649 4 221 695 2009 1 249 294 6 095 132 4 845 838 2010 1 318 538 6 632 086 5 313 548 2011 1 445 395 7 033 930 5 588 535 2012 1 585 073 8 074 158 6 489 085 2013 1 706 326 8 988 257 7 281 931 2014 1 801 872 9 834 931 8 033 058
Source: Momentum/Bureau of Market Research at Unisa: Own calculations.

18 SOUTH AFRICAN HOUSEHOLD WEALTH INDEX Q2 2015
TABLE A7: VARIOUS INDICATORS
Real Net Wealth per
person
Solvency ratio 1)
Debt repayment (instalment) 2)
as % of income 3)
Contributions to retirement funds 4) as % of income 3)
Bank deposits as % of income
3)
2009 97947 4.90 23.96 4.85 2.84 2010 102335 5.06 21.57 4.93 2.74 2011 98964 4.89 21.41 4.77 2.74 2012 106577 5.13 22.35 4.58 2.79 2013 112249 5.33 24.24 4.80 2.83 2014 115722 5.42 23.48 4.55 3.05
Source: Momentum/Bureau of Market Research at Unisa: South African Reserve Bank Quarterly Bulletins; National Credit Regulator. 1) The number of times assets exceed liabilities. 2) Capital, interest and costs. Developmental loans included from 2013. 3) Total income after tax available for spending and saving.
4) Employer and employee contributions to official and private retirement funds.