Momentum profiles for open shell molecules: studies of...
21
Chemical Physics ELSEVIER Chemical Physics 201 (1995) 1-21 Momentum profiles for open shell molecules: studies of the HOMOs of NO, 0 2 and NO 2 by electron momentum spectroscopy and SCF, post-Hartree-Fock and DFT calculations J. Rolke a, N. Cann a, y. Zheng a, B.P. Hollebone a, C.E. Brion a,*, Y.A. Wang b E.R. Davidson b Department of Chemistry, University of British Columbia, 2036 Main Mall, Vancouver, B.C., V6T 1ZI , Canada b Department of Chemistry, Indiana University, Bloomington, IN 47405, USA Abstract Measurements of the outermost valence electron orbital momentum profiles of the open shell molecules NO, 0 2 and NO 2 have been obtained using electron momentum spectroscopy (EMS). The presently reported experimental momentum profiles of NO and 0 2 display much improved statistics compared with previously published EMS results while the data for the HOMO of NO 2 is the f'trst reported. In the case of NO, the present measurements are considerably different from previous results and these differences appear to be due to the presence of NO 2 impurities in the previous work. The EMS measurements provide a stringent test of basis set effects and the quality of ab initio methods in the description of these open shell systems. The experimental momentum profiles have been compared with theoretical spherically averaged momentum profiles from several basis sets calculated at the level of the target Hartree-Fock approximation (THFA) with a range of basis sets using both unrestricted Hartree-Fock (UHF) and restricted open shell Hartree-Fock (ROHF) methods. Various configuration interaction calculations such as multi-reference singles and doubles configuration interaction (MRSD-CI), averaged coupled pair functional (ACPF) and quasi-degenerate variational perturbation theory (QDVPT) calculations of the full ion-neutral overlap amplitude have also been compared to experiment to investigate the effects of electron correlation and relaxation. The experimental momentum profiles have further been compared to calculations at the level of the target Kohn-Sham approximation (TKSA) using density functional theory (DFT) with the local density approximation and also with gradient corrected exchange-correlation potentials. In addition to momentum profiles, other electronic properties such as total energies, dipole moments, quadmpole moments and values of the electronic spatial extent have been calculated by the various theoretical methods and compared to experimental values. I. Introduction Electron momentum spectroscopy (EMS) is a unique experimental technique for the study of the electron density distributions (momentum profiles) in individual atomic and molecular orbitals [1-4]. It ' Corresponding author. has been demonstrated that the measured electron impact ionization (e,2e) differential cross sections provide images of the orbital electron density in momentum space which correspond very closely to Hartree-Fock canonical molecular orbitals [2,5]. Thus, EMS measurements provide sensitive experi- mental tests for quantum mechanical calculations. In particular, the technique has been found to be ex- 0301-0104/95/$09.50 © 1995 Elsevier Science B.V. All fights reserved SSDI 0301-0104(95)00241-3
Transcript of Momentum profiles for open shell molecules: studies of...

Chemical Physics
E L S E V I E R Chemical Physics 201 (1995) 1-21
Momentum profiles for open shell molecules: studies of the HOMOs of NO, 0 2 and NO 2 by electron momentum
spectroscopy and SCF, post-Hartree-Fock and DFT calculations
J. Rolke a, N. Cann a, y. Zheng a, B.P. Hollebone a, C.E. Brion a,*, Y.A. Wang b E.R. Davidson b
Department of Chemistry, University of British Columbia, 2036 Main Mall, Vancouver, B.C., V6T 1ZI , Canada b Department of Chemistry, Indiana University, Bloomington, IN 47405, USA
Abstract
Measurements of the outermost valence electron orbital momentum profiles of the open shell molecules NO, 0 2 and NO 2 have been obtained using electron momentum spectroscopy (EMS). The presently reported experimental momentum profiles of NO and 0 2 display much improved statistics compared with previously published EMS results while the data for the HOMO of NO 2 is the f'trst reported. In the case of NO, the present measurements are considerably different from previous results and these differences appear to be due to the presence of NO 2 impurities in the previous work. The EMS measurements provide a stringent test of basis set effects and the quality of ab initio methods in the description of these open shell systems. The experimental momentum profiles have been compared with theoretical spherically averaged momentum profiles from several basis sets calculated at the level of the target Hartree-Fock approximation (THFA) with a range of basis sets using both unrestricted Hartree-Fock (UHF) and restricted open shell Hartree-Fock (ROHF) methods. Various configuration interaction calculations such as multi-reference singles and doubles configuration interaction (MRSD-CI), averaged coupled pair functional (ACPF) and quasi-degenerate variational perturbation theory (QDVPT) calculations of the full ion-neutral overlap amplitude have also been compared to experiment to investigate the effects of electron correlation and relaxation. The experimental momentum profiles have further been compared to calculations at the level of the target Kohn-Sham approximation (TKSA) using density functional theory (DFT) with the local density approximation and also with gradient corrected exchange-correlation potentials. In addition to momentum profiles, other electronic properties such as total energies, dipole moments, quadmpole moments and values of the electronic spatial extent have been calculated by the various theoretical methods and compared to experimental values.
I . Introduction Electron momentum spectroscopy (EMS) is a
unique experimental technique for the study of the electron density distributions (momentum profiles) in i nd iv idua l atomic and molecular orbitals [1-4] . It
' Corresponding author.
has been demonstrated that the measured electron impact ionization (e,2e) differential cross sections provide images of the orbital electron density in momentum space which correspond very closely to Har t r ee -Fock canonical molecular orbitals [2,5]. Thus, EMS measurements provide sensitive experi- mental tests for quantum mechanical calculations. In particular, the technique has been found to be ex-
0301-0104/95/$09.50 © 1995 Elsevier Science B.V. All fights reserved SSDI 0301-0104(95)00241-3

2 J. Rolke et al./Chemical Physics 20l (1995) 1-21
tremely useful in the evaluation and design of self consistent field (SCF) as well as correlated molecu- lar wavefunctions [2,5,6]. In theoretical quantum chemistry, ab initio wavefunctions are generally opti- mized using the c~terion of energy minimization according to the variational theorem. However, un- less an extremely high degree of energy convergence is achieved [5], energy minimization procedures alone are often inadequate since they heavily emphasize the short spatial range (i.e. high momentum) part of the molecular potential. Due to the well-known prob- lem of different rates of convergence for electronic properties [5], wavefunctions that provide low total energies can often be inadequate for calculating properties such as dipole moment, ( r 2 ) and momen- tum profiles which are more strongly dependent on the medium and long-range parts of the charge distri- bution. EMS measurements of momentum profiles, being highly sensitive to the longer range spatial (i.e. low momentum) regions of the wavefunction, pro- vide an additional practical criterion useful in the development of "universal" wavefunctions that pro- vide an adequate model applicable in all regions of momentum and position space [2,5,6]. Wavefunc- tions tested in this more stringent fashion are there- fore likely to be more suitable for the calculation of a wide range of electronic properties than those which have been designed with energy optimization as the sole criterion.
The technique of EMS has been extensively ap- plied to closed shell molecules [2-4]. In particular, EMS measurements have been compared with high level (near SCF limit and MRSD-CI) calculations for a growing range of closed shell diatomic and small polyatomic molecules [2,4]. Very recently this work on closed shell molecules has been extended [7,8] to include calculations using density functional theory (DFT). In contrast, open shell molecules have re- ceived much less attention experimentally because of their reactive nature and theoretically because of the more challenging nature of quantum mechanical cal- culations for such species. In view of the challenging experimental and theoretical problems associated with open shell molecules, we have carried out a detailed experimental and theoretical investigation of the electron momentum profiles for the outermost (HOMO) orbitals of NO, 0 2 and NO 2. These are benchmark molecules for quantum chemistry and are
among the most common stable open shell species. These molecules are also of importance in processes such as ozone formation, nitrogen fixation [9], neuro- transmission [10], smog and acid rain [9].
Previously reported EMS studies of the HOMOs of NO [11-13] and 02 [13,14] show limited statistics ~nd considerable scatter due to the low cross sections involved for these partially filled orbitals. In addi- tion, no theoretical momentum profiles were pre- sented in the EMS study of 02 by Suzuki et al. [14]. The SCF wavefunctions employed in the earlier work on NO by Brion et al. [11] involved only minimal and double-zeta basis sets and more advanced calcu- lations were not considered. Furthermore, the instru- mental momentum resolution was not always taken into account in previous work when comparing the experimental and theoretical momentum profiles. The adequate incorporation of finite angular acceptances (i.e. momentum resolution effects) has been found to be essential for the meaningful comparison of exper- iment and theory, particularly at lower momentum [2,15,16]. The experimental and theoretical study of NO by Fantoni et al. [12] included the use of the same Kouba and Ohm unrestricted Hartree-Fock (UHF) wavefunction [17] presented in the work of Brion et al. [11]. In contrast, the theoretical treatment presented in the work of Tossell et al. [13] was limited in that calculations were presented only with small basis sets at the restricted open shell Hartree- Fock (ROHF) level which may not provide an ade- quate model of open shell molecules. In the ROHF method [18-20] only the highest orbital is partially filled and all other electrons are part of an a , /3 pair that has the same spatial orbital. Alternatively, the UHF method assigns different spatial orbitals to all a and /3 electrons. Because the unpaired electron affects the a and /3 spin manifolds differently, the UHF total energy for the molecule is lower than the ROHF energy. However, it is well-known that UHF wavefunctions also contain some degree of spin con- tamination [18,21] and therefore are not true eigen- functions of the total spin operator ~2.
In order to obtain improved EMS measurements for the HOMOs of NO and 02, an energy dispersive multichannel EMS spectrometer was used [7] in the present work. The multichannel spectrometer has a much faster data accumulation rate compared with the earlier reported single channel instrument [22].

J. Rolke et al . / Chemical Physics 201 (1995) 1-21 3
The measurements for NO 2 were carried out on the single channel instrument and the present results are the first to be reported. In addition, much larger basis sets and more complex theoretical methods have been used for NO and 0 2 to calculate theoretical momentum profiles which also incorporate the im- proved resolution folding procedures [16]. Theoreti- cal momentum profiles at the target Hartree-Fock approximation (THFA) level from both the UHF and ROHF methods are shown for all molecules. Mo- mentum profiles from post-Hartree-Fock methods such as multi-reference singles and doubles configu- ration interaction (MRSD-CI) methods, averaged coupled pair functional (ACPF) [23] and quasi-de- generate variational perturbation theory (QDVPT) [24,25] are also presented in order to assess the role of electron correlation and relaxation effects.
An alternative method to the use of Hartree-Fock or post-Hartree-Fock methods is that of density functional theory. Duffy et al. [26] and Casida [27] have recently developed a method for the calculation of orbital momentum profiles for selected closed shell atoms and molecules using Kohn-Sham den- sity functional theory in the target Kohn-Sham ap- proximation (TKSA). Casida [27] has shown that the Kohn-Sham orbitals evaluated with the exact ex- change-correlation functional are approximately Dyson orbitals and, as will be discussed later, may be related to the EMS cross section. In addition, density functional results for selected molecular properties have been shown to be comparable to high level SCF and MRSD-CI calculations [7,8,28]. DFT calculations allow considerable computational sav- ings for larger molecules and with appropriate func- tionals the calculations have an inherent handling of the "correlation" of the electrons in an atom or molecule through the exchange-correlation potential term of the DFT Hamiltonian [26]. DFT calculations have been compared to EMS measurements for larger closed shell molecules such as acetone [7] and ethy- lene [8] and to species of prototype biochemical interest such as dirnethoxymethane [29] and glycine [30]. However, no published work to date has com- pared EMS momentum profiles for open shell molecules with momentum profiles from DFT. Thus, TKSA-DFT calculations using the local density ap- proximation of Vosko et al. [31], the gradient cor- rected exchange hole term of Perdew and Yue
[32,33], and a combination of the Perdew exchange and Becke correlation potential functions [34] are shown for the HOMOs of all three molecules in the present work.
2. Methods
2.1. Experimental method and theoretical back- ground
The construction and operation of both the sym- metric non-coplanar single channel [22] and energy dispersive multichannel [7] EMS spectrometer used in the present work have been described in detail and thus only a brief description will be given here. An electron beam (30/zA for multichannel EMS and 50 /zA for single channel EMS) ionizes the gaseous target molecules ( ~ 10 -5 Torr) at an impact energy of E 0 = 1200 eV + binding energy. The scattered and ejected electrons are electron optically retarded, selected energetically by electrostatic analyzers and detected in coincidence.
In the symmetric non-coplanar scattering geome- try, the two outgoing electrons are selected at equal polar angles (0~ = 01 = 45 °) relative to the incoming electron beam and at equal energies (E 1 = E 2 = 600 eV). Under these high impact energy and high mo- mentum transfer conditions, the plane wave impulse approximation (PWIA) provides a good description of the collision [3] and the ionized electron essen- tially undergoes a clean "knock-out" collision. In the PWlA, the momentum p of the ejected electron prior to knock-out is related to the out-of-plane azimuthal angle ~b (the angle between the two outgo- ing electrons) as follows [1,3]:
p = {(2pl cos 01
. . ~ 2 ~ 1 / 2
+ [ 2 p l sin 01 sin(~b/2)J ) , (1)
where Pl = ~/2E1 and Po = ~ in atomic units. Scanning the impact energy of the incoming electron allows the binding energy spectrum of the target molecule to be obtained at a typical energy resolu- tion of 1.7 eV fwhm for the single channel EMS spectrometer and 1.4 eV fwhm for the multichannel EMS instrument. Scanning the azimuthal angle over
4 J. Rolke et al. / Chemical Physics 201 (1995) 1-21
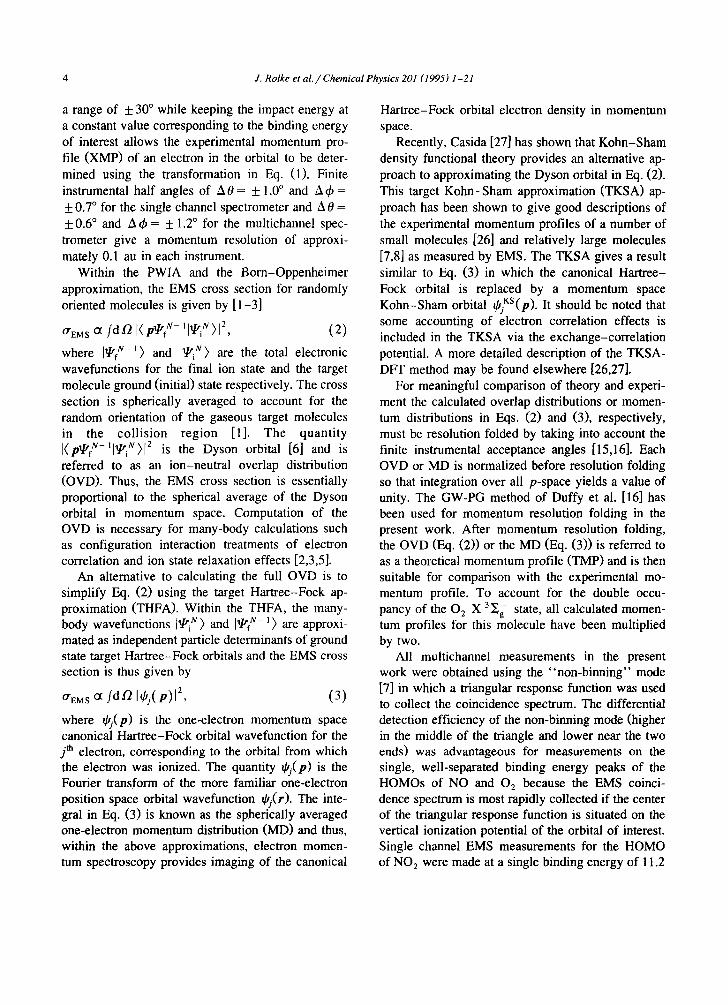
a range of + 30 ° while keeping the impact energy at a constant value corresponding to the binding energy of interest allows the experimental momentum pro- file (XMP) of an electron in the orbital to be deter- mined using the transformation in Eq. (1). Finite instrumental half angles of A 0 = + 1.0 ° and A ~b = + 0.7 ° for the single channel spectrometer and A 0 = + 0.6 ° and A~b = + 1.2 ° for the multichannel spec- trometer give a momentum resolution of approxi- mately 0.1 au in each instrument.
Within the PWIA and the Born-Oppenheimer approximation, the EMS cross section for randomly oriented molecules is given by [1-3]
O'EM s Or /dO 1( pa/rf N- '[~iU)l 2, (2)
where Iqrt u - l ) and [a/ri N) are the total electronic wavefunctions for the final ion state and the target molecule ground (initial) state respectively. The cross section is spherically averaged to account for the random orientation of the gaseous target molecules in the collision region [1]. The quantity [(pa/tN-llaP'iN)[2 is the Dyson orbital [6] and is referred to as an ion-neutral overlap distribution (OVD). Thus, the EMS cross section is essentially proportional to the spherical average of the Dyson orbital in momentum space. Computation of the OVD is necessary for many-body calculations such as configuration interaction treatments of electron correlation and ion state relaxation effects [2,3,5].
An alternative to calculating the full OVD is to simplify Eq. (2) using the target Hartree-Fock ap- proximation (THFA). Within the THFA, the many- body wavefunctions [qtiu ) and [qrfu- J ) are approxi- mated as independent particle determinants of ground state target Hartree-Fock orbitals and the EMS cross section is thus given by
O'EM s ¢X f d a [~j(p)l 2, (3)
where ~0j(p) is the one-electron momentum space canonical Hartree-Fock orbital wavefunction for the jth electron, corresponding to the orbital from which the electron was ionized. The quantity ~j(p) is the Fourier transform of the more familiar one-electron position space orbital wavefunction ~bj(r). The inte- gral in Eq. (3) is known as the spherically averaged one-electron momentum distribution (MD) and thus, within the above approximations, electron momen- tum spectroscopy provides imaging of the canonical
Hartree-Fock orbital electron density in momentum space.
Recently, Casida [27] has shown that Kohn-Sham density functional theory provides an alternative ap- proach to approximating the Dyson orbital in Eq. (2). This target Kohn-Sham approximation (TKSA) ap- proach has been shown to give good descriptions of the experimental momentum profiles of a number of small molecules [26] and relatively large molecules [7,8] as measured by EMS. The TKSA gives a result similar to Eq. (3) in which the canonical Hartree- Fock orbital is replaced by a momentum space Kohn-Sham orbital ~0iKS(p). It should be noted that some accounting of electron correlation effects is included in the TKSA via the exchange-correlation potential. A more detailed description of the TKSA- DFT method may be found elsewhere [26,27].
For meaningful comparison of theory and experi- ment the calculated overlap distributions or momen- tum distributions in Eqs. (2) and (3), respectively, must be resolution folded by taking into account the finite instrumental acceptance angles [15,16]. Each OVD or MD is normalized before resolution folding so that integration over all p-space yields a value of unity. The GW-PG method of Duffy et al. [16] has been used for momentum resolution folding in the present work. After momentum resolution folding, the OVD (Eq. (2)) or the MD (Eq. (3)) is referred to as a theoretical momentum profile (TMP) and is then suitable for comparison with the experimental mo- mentum profile. To account for the double occu- pancy of the 0 2 X 3Eg state, all calculated momen- tum profiles for this molecule have been multiplied by two.
All multichannel measurements in the present work were obtained using the "non-binning" mode [7] in which a triangular response function was used to collect the coincidence spectrum. The differential detection efficiency of the non-binning mode (higher in the middle of the triangle and lower near the two ends) was advantageous for measurements on the single, well-separated binding energy peaks of the HOMOs of NO and 02 because the EMS coinci- dence spectrum is most rapidly collected if the center of the triangular response function is situated on the vertical ionization potential of the orbital of interest. Single channel EMS measurements for the HOMO of NO 2 were made at a single binding energy of 11.2

J. Rolke et al./ Chemical Physics 201 (1995) 1-21 5
eV. The NO and NO 2 samples were obtained from Matheson gas products while the 0 2 sample was obtained from Medigas gas products. All gas sam- ples were of > 99.0% purity. Some additional con- siderations regarding the handling of the NO gas sample are discussed in the next section.
2.2. Gas samples and sample handling for NO
Experience in the present work has shown that great care is needed in handling and introducing NO gas samples into the spectrometer. In the initial phases of the present experimental study of the HOMO XMP of NO using a single channel EMS spectrometer, surprising and unexpected results were obtained as shown by the open triangles in Fig. l a. Previous experimental measurements [ 11-13] of the momentum profile of the 2"rr HOMO of NO display considerable scatter and uncertainties due to the very low cross section arising from the single occupancy of the 2~r orbital and the broad nature of the mo- mentum profile. This can be seen in Fig. lb where the previous results from Brion et al. [11] (filled squares), Fantoni et al. [12] (open inverted triangles), and Tossell et al. [13] (filled diamonds) are shown. The data from Fantoni et al. [12] is that collected at 800 eV, although some data were also presented at 2600 eV. Within the limited statistics the three ex- perimental results appear to be in reasonable agree- ment with each other and with the theoretical mo- mentum profile (TMP) from the Kouba and Ohm (K and O-U) calculation [17]. In the original publica- tions, the K and O-U TMP was thought by Brion et al. [11] and also by Fantoni et al. [12] to agree well for shape with the HOMO momentum profiles as shown in Fig. lb. It should be noted, however, that while it was reported [11] that the K and O-U wavefunction was a CI calculation, it has since been found that the momentum profile reported in Ref. [11] and presumably also that in Ref. [12] was calcu- lated from the leading configuration of the CI wave- function only and thus was in fact an SCF and not a CI treatment. The K and O-U momentum profile shown in Fig. 1 is also from the leading configura- tion only. It should also be noted that the previous measurements [11,12] show very little data in the low momentum region below p - - 0 . 2 au and that nearly all data points below 0.5 au are higher than
predicted by the K and O-U theory. The measure- ments of Tossell et al. [13] which are reasonably consistent with the other experiments [11,12] were in poor agreement with calculations based on the SCF wavefunction of Cade and Wahl [35].
A consideration of Fig. la and Fig. lb shows that in the region above ~ 0.3 au the present single channel measurements (open triangles) are generally consistent with the three earlier published experi- ments [11-13]. However, below ,,-0.3 au the data points unexpectedly rise as zero momentum is ap- proached. This is in marked contrast to all calcula- tions (see Fig. 1 and also Fig. 2 below) which, as expected from symmetry considerations, show a de- creasing cross section as zero momentum is ap- proached. The high data points at low momentum persisted in repeated measurements, not withstanding the poor statistics inherent in the case of the single channel spectrometer. A further measurement in our laboratory (open circles in Fig. la) using the high precision and improved statistics of a recently built momentum dispersive multichannel EMS spectrome- ter [36] produced similar spuriously high results at low momentum. It is noteworthy that above ~ 0.2 au these measurements (like the earlier data [ 11-13] in Fig. lb) are in close conformity with the less accurate K and O-U calculation but not with the very accurate and highly correlated 168-ACPF ion-neu- tral overlap calculation (dotted line in Fig. l a) de- scribed in Section 3 below.
The anomalous behavior in the experimental re- suits which is manifested particularly at lower mo- menta has been found to be due to NO 2 impurities in the sample gas introduced to the collision chamber. Consideration of the respective Franck-Condon widths and the fact that the HOMO ionization poten- tial of NO 2 is close to that of NO indicate that any small NO a impurity would cause the observed spuri- ous effects particularly at the lowest momenta be- cause of the very intense s-type NO a HOMO mo- mentum profile (see Fig. 4 below). Careful consider- ation of the purity of the commercial gas cylinders and the results of other spectroscopic experiments [37] indicated that the NO: impurity observed in the EMS measurements was not present in the NO cylin- ders. Clearly, the NO z impurity was being generated in the stainless steel sample handling and introduc- tion system of the EMS spectrometers. Since, as is

6 J. Rolke et a l . /Chemical Physics 201 (1995) 1-21
wel l -known, NO is readily oxid ized to NO 2 by
a tmospher ic oxygen an obvious possibi l i ty would be
a leak in the sample system. However , careful leak
test ing e l imina ted this as the cause. A further possi-
bil i ty would be react ion o f N O with oxygen contain-
ing species (e.g. H 2 0 , 0 2 , previous ly s tudied
molecules , etc.) adsorbed on the walls of the inlet
manifold, va lves and leak valve. Initial measure-
ments for N O on the energy dispersive mul t ichannel
EMS instrument [7] also showed a s imilar " t u r n i n g -
( a ) NO 9.54 eV
0.04 ~ SO (NO/NO 2 impur i ty)- o MC (NO/NO 2 impur i ty) • MC (NO)
/ Y ~ " ~ . . - - K&O-U (x88%) N02 /~ / ' T i (b~ . . . . 168-ACPF Impurity ~/~,/ Y ~ . - ....... NO 2 207-QDVPT
o
( -
2 (- 0.00 +--
(b) , .~ • I TT I Brion et oi.
-~ 0 0.04 ~ l ,7 F8Gg~)on~/et ol.
-- ~ ~r I)I I ± I~I~X~IT ~ Tossell et ol.
04 Z -- K&O-U
0.02
0.00 0 1 2
Momentum (o.u.) Fig. 1. (a) Experimental momentum profiles for the 2~" orbital of NO from the present work. Shown are the XMPs from a single channel EMS spectrometer (open triangles), a multichannel momentum dispersive multichannel EMS spectrometer (open circles) and a multichannel energy dispersive EMS spectrometer (filled circles). The single channel and momentum dispersive results contain some degree of contamination from NO 2 (see Section 2.2 for details). The estimated contribution due to NO 2 impurity is represented by the NO 2 207-QDVPT momentum profile (long dashed line) multiplied by 0.04. Also shown are the calculated theoretical spherically averaged K and O-U momentum profile [11] (multiplied by a factor of 0.88) and the 168-ACPF momentum profile for NO. (b) Previous experimental momentum profiles for the 27r orbital of NO. Shown are the XMPs from Brion et al. [11] (filled squares), Fantoni et al. [12] (open inverted triangles) and Tossell et al. [13] (filled diamonds). The calculated spherically averaged K and O-U momentum profile is also shown. See text for further details.

J. Rolke et a l . / Chemical Physics 201 (1995) 1-21 7
up" at low momentum. However, after repeated flushing to remove suspected NO 2 impurities, overnight stagnation (to allow reaction) and evacua- tion, very different results, as indicated by the solid circles in Fig. l a, were eventually obtained. These procedures were repeated daily during the measure- ments. It can be seen from this high precision data that the low momentum "turning-up" has essen- tially gone and also that the XMP is shifted over to higher momentum below 1.0 au. Furthermore these measurements are in generally very good agreement with the shape of the high level 168-ACPF overlap calculation for NO (see Section 4.1) and in poor agreement with the shape of the K and O-U treat- ment. Note that the two calculations are separately height normalized to the experimental data sets in Fig. l a. It can be concluded that the gas sample for the solid circle data points in Fig. la is dominantly NO. However, some minimal pollution from residual N O 2 c a n n o t be discounted and this may be the reason for the remaining small discrepancy between the 168-ACPF theory and experiment at the lowest momenta. The estimated contribution from the (s- t ype - see Fig. 4) NO 2 impurity in the earlier open circle and open triangle data sets is shown by the shaded area under the long dashed line in Fig. l a. This long dashed line is the 207-QDVPT calculation for the HOMO of NO 2 (see Section 3 for a descrip- tion of this calculation) scaled appropriately. Based on these observations and a consideration of the presently reported very high level calculations, we suggest that the earlier published measurements for NO [11-13] were also complicated by varying de- grees of NO 2 impurity. It should be noted (Fig. lb) that these earlier measurements [11-13] all show higher cross sections at lower momenta than even the K and O-U calculation. The present work indi- cates that the apparently good agreement of earlier measurements with the K and O-U calculation is fortuitous due to the probable presence of NO 2 im- purities.
3. Calculations
Spherically averaged theoretical momentum pro- files have been calculated for the HOMO of each of the three molecules using several basis sets of vary- ing quality within the plane wave impulse and the
target Hartree-Fock approximations (via Eq. (3)). In order to investigate the role of electron correlation and relaxation effects, the ion-neutral overlap has also been calculated (via Eq. (2)) from the MRSD-CI, ACPF [23] and QDVPT [24,25] wavefunctions for both the ground and molecular ion states. In addi- tion, TKSA density functional theory calculations have also been performed for several exchange and correlation potentials using a variation of the large basis sets developed by Dunning and co-workers [38-41]. Various other calculated and experimental electronic properties for the three molecules are listed in Tables 1-3. The experimentally derived geome- tries for NO [42], 02 [43] and NO 2 [44] were used in all calculations.
It has been suggested that the total energy from Kohn-Sham DFF is in error because of shifted orbital energies relative to ionization potentials from Dyson's equation [26]. These differences cannot be avoided because they arise from the use of approxi- mate functionals in the DFT calculations. If the exact functionals could be obtained and used, the total energies from DFT would be comparable to those from Hartree-Fock and post-Hartree-Fock calcula- tions.
The dipole moment of NO is of special interest in quantum mechanical calculations because the pre- dicted dipole moment reversal [45-47] gives a N - O ÷ polarity which is counter to that from intuitive elec- tronegativity arguments. An experimental measure- ment of the dipole moment [48,49] gave a value of 0.15872 D with an N - O ÷ polarity as reported by Gray et al. [50]. While the sign of the dipole moment for NO is often incorrectly predicted by SCF calcula- tions, correlated treatments generally give the correct polarity [46]. Thus, a positive dipole moment for NO in Table 1 implies a polarity of N - O ÷. The experi- mental dipole moment for NO is from Ref. [48].
The degree of spin contamination is important in assessing the ability of a wavefunction to model an open shell system. The spin contamination is found by calculation of the expectation value of ~2. If no spin contamination is present then the expectation value of g2 is 0.75 for NO and NO 2 and 2.0 for O 2. ROHF calculations are free of spin contamination while interference from states of higher multiplicity is always present for UHF calculations. If the spin contamination becomes large, there may be some

8 J. Rolke et a l . /Chemical Physics 201 (1995) 1-21
doubt as to the utility of the UHF results. There is also some degree of spin contamination involved in the DFT calculations in the present work, but the results are not tabulated because of problems with the calculation of this property from DFT [51].
Details of the calculation methods are described below. The total number of contracted Gaussian-type orbital functions (CGTO) used is also given. All calculations with the STO-G, 6-311 + G * and AUG5 basis sets (described below) were done at the Uni- versity of British Columbia with the GAUSSIAN 92 program while all calculations with the 168-CGTO, 210-CGTO and 207-CGTO basis sets were done at Indiana University with the MELD program. Those calculations employing the UHF method have the " - U " extension added to the basis set symbol while the " - R " extension indicates the ROHF method. The ROHF calculations done at Indiana University in- volve both symmetry and equivalence restriction (i.e. all molecular orbitals are pure tr and "rr orbitals). This symmetry and equivalence restriction affects the results for NO, making the a'r x and '/'l'y orbitals equivalent partner functions in the I I irreducible representation of the C~ v point group. Symmetry or equivalence restrictions were not done with the UHF calculations from Indiana University or with the GAUSSIAN 92 calculations. Following the initial ROHF calculations, frozen core, multi-reference sin- gles and doubles configuration interaction (MRSD- CI) and averaged coupled pair functional (ACPF) calculations were performed on both the neutral molecules and cation radicals with the neutral sym- metry restricted ROHF K orbitals [52]. For NO 2, frozen core, quasi-degenerate variational perturbation theory (QDVPT) calculations were performed for comparison. MRSD-CI calculations are designated with the " - C I " extension added to the basis set symbol while ACPF and QDVPT calculations are designated with the " -ACPF" and " -QDVPT" ex- tensions, respectively. The details of the Kohn-Sham DFT calculations are described in Section 4.3.
(lu) STO-3G-U and (lr) STO-3G-R: These calcu- lations employed a minimal basis set (effectively single zeta). Each function is a contraction of three Gaussian functions. Both the nitrogen and oxygen atoms have a (6s,3p)/[2slp] contraction and thus 10 CGTO are used for NO and 02 while 15 CGTO are employed for NO 2. This basis was designed by Pople and co-workers [53].
(2u) 6-311 + G*-U and (2r) 6-311 + G *-R: These calculations used an augmented version of the 6-311G basis of Pople and co-workers [54]. The 6-311 + G * basis is formed by augmenting the 6-311G with diffuse s and p functions [55] and spherical d-type polarization functions [56] on both the nitrogen and oxygen atoms to produce a (12s,6p,ld)/[5s,4p, ld] contraction per atom. For NO and 02, a total of 44 CGTO are employed in the calculations while 66 CGTO are used for NO 2.
(3u) AUG5-U and (3r) AUG5-R: The basis set for these calculations was taken from the work of Dun- ning et al. [38-41]. The AUG5 basis set used in the present work is actually a truncated form of Dun- ning's aug-cc-pV5Z basis set in which all f, g and h functions have been removed. This truncation was adopted to provide compatibility with the density functional calculations since the DFT program can- not handle the higher I functions (see Section 4.2). Thus, the AUG5 consists of a (33s,13p,5d)/ [7s,6p,5d] contraction per atom. In addition, the d functions have been changed from spherical to Cartesian so that the SCF results from this basis set can be directly compared with the DFF results from this basis. Thus, a total of 1 I0 CGTO are used for NO and 02 while 165 CGTO are used for NO 2.
(4u) 168-U, (4r) 168-R, (4c) 168-CI and (4a) 168-ACPF: The 168 CGTO basis set for NO and 02 has a (19s, 14p,3d,2f, 1 g)/[7s,8p,3d,2f, lg] contraction per atom. The primary (18s,13p) functions are taken from Partridge [57], while the (3d,2f, lg) polarization functions are from Dunning [38]. The first fourteen s functions were contracted into two s functions using the first fourteen ls and 2s atomic orbital coeffi- cients. Similarly, the first seven p functions are contracted into one p function using the first seven 2p atomic orbital coefficients. This contracted basis set is further augmented by additional diffuse s and p functions from Partridge's supplementary functions for O- (2P) and N-(3P) [57]. All components of the d, f and g functions are kept in the calculations.
(5u) 207-U, (5r) 207-R, (5c) 207-CI, (5a) 207- ACPF and (5q) 207-QDVPT: The 207 CGTO basis set for NO 2 is obtained by removing all the g functions from the 168-CGTO basis sets used for N and O in NO and 0 2 , thus giving a (19s,14p,3d,2f)/[7s,8p,3d,2f] contraction per atom.
(6u) 210-U, (6r) 210-R, (6c) 210-CI and (6a) 210-ACPF: This 210 CGTO basis set for NO is the

J. Rolke et a l . / Chemical Physics 201 (1995) 1-21 9
augmented correlation consistent, polarized valence quadruple-zeta basis set (aug-cc-pVQZ) of Dunning et al. [38-41]. The basis set consists of a (13s,7p,4d,3f,2g)/[6s,5p,4d,3f,2g] contraction per atom.
4. Results and discussion
4.1. Comparison of experimental and theoretical mo- mentum profiles
High momentum resolution measurements have been made of the outermost valence electron experi- mental momentum profiles (XMPs) for each of NO (2-rr, Fig. 2), 0 2 (l'rrg, Fig. 3) and NO 2 (6a 1, Fig. 4). The XMPs for NO and 0 2 were collected on an energy dispersive multichannel EMS spectrometer while the XMP for NO 2 was collected with a single channel instrument. On each figure the mean binding energy at which each particular XMP was measured is noted (9.54 eV for NO, 12.30 eV for 0 2 and 11.23 eV for NO2). These values correspond to the vertical ionization potentials of the lowest lying peaks ob- served in the photoelectron spectra [58]. The outer- most XMP for each molecule is well separated in energy from the rest of the valence ionization mani- fold, which ensures that all the observed intensity of the momentum profile is due to ionization to the lowest lying ion state only and contains no mixing with other ionization processes. While NO 2 is known to exist in equilibrium with its dimer N20 4 in the gas phase, photoelectron spectroscopy [59] has shown that the dimer concentration is negligible at low pressures (0.01 Torr) and room temperature. Further- more, the first PES peak from the dimer was recorded at low temperatures and did not overlap extensively with the band from the HOMO of the monomer [59]. Since the present EMS experiments were done at even lower pressures ( ~ 10 -4 Torr) and the dimer peak at 12.39 eV was not observed in the EMS binding energy spectra, the present results contain no detectable contributions from N20 4.
Much better statistics have been obtained in the present work on NO and 02 compared to previous results on nitric oxide [11-13] and oxygen [13,14]. In addition, the comparison of theory and experiment was much more limited in previous work [11-13]
because of the small basis sets used and also because no post-Hartree-Fock calculations were done. No theoretical momentum profiles were presented in the earlier work on 02 of Suzuki et al. [14]. In the present work, the three experimental momentum pro- files are compared on Figs. 2 - 4 respectively with the theoretical momentum profiles (TMPs) calculated at the UHF and ROHF Hartree-Fock level and also with MRSD-CI, ACPF and QDVPT ion-neutral overlaps as described in Section 3 above. Selected properties for each calculation and corresponding experimental values are shown in Tables 1-3. The SCF basis sets used range from a very modest minimal STO-3G basis to the very much larger 168-GTO, 207-GTO and 210-GTO basis sets devel- oped in the course of the present work. The effects of many-body correlation and electronic relaxation are also seen on Figs. 2 - 4 from the MRSD-CI, ACPF and QDVPT calculations of the TMPs. The TMPs from the 210-CI and 210-ACPF treatments are very similar to their 168-CI and 168-ACPF counter- parts and therefore these calculations are not shown on Fig. 2 but the properties are listed in Table 1. It should be noted that the experimental instrumental angular resolution has been accounted for in all theoretical momentum profiles in Figs. 2 - 4 using the GW-PG method [ 16].
Experiment and theory are placed on a common intensity scale for each molecule by normalizing the experiment to the 168-ACPF momentum profiles for NO and 0 2 and the 207-QDVPT momentum profile for NO 2 (assuming unit pole strength). Since the wavefunctions are normalized all of the calculations are on a common relative intensity scale for each molecule. However, for profiles such as the NO 2 HOMO where s character is dominant (Fig. 4), it is often more difficult to distinguish the quality of TMPs than for p-type profiles such as the 2~r orbital of NO and l~g orbital of 0 2. A change in relative intensity at low p is often the only major distinguish- ing characteristic between two TMPs for dominantly s-type momentum profiles such as the NO 2 HOMO. As such, other normalizations to the XMP could be selected.
The UHF calculations of the momentum profiles in Figs. 2 - 4 show a trend of improving agreement with experiment as the basis set quality improves from the STO-3G (curve lu) which fits the observed

10 J. Rolke et al. / Chemical Physics 201 (1995) 1-21
0 . 0 4
03 (- ©
-+~ (-
0.02 ©
. - -
0 (1)
t-'r"
0.00
t _
I
3r,40 40 N O - 4r 6r. 9 . 5 4 eV
• MC Expt. 6r 2 1 0 - R 6u 2 1 0 - U 4a 168-ACPF 4c 1 68-CI 4r 1 6 8 - R 4u 1 6 8 - U 3r AUG5-R
5 u , ~ 3u AUGS-U 2u 2u 6 - 5 1 1 + G * - U
u STO-3G-U
l u
] 2
Momentum (o.u.)
MOMENTUM DENSITY POSITION DENSITY
-4
-8_ 8
0
(o.u.)
NO 27T
~ ~ . . . . . . . . 0 ¸ - . . . . . .
-4
-8 - 8 - 4
(°.°3
NO 27T
Fig. 2. Measured and calculated spherically averaged momentum profiles for the 2 w orbital of NO (upper panel). The solid circles represent the experimental energy dispersive multichannel EMS measurements. All calculations have been spherically averaged and folded with the experimental momentum resolution. See text and Table 1 for details of the wavefunctions and normalization procedures. The lower panels show the momentum and position density contour maps for an oriented NO molecule calculated at the Hartree-Fock level using the 168-R basis set. The contours represent 0.01, 0.03, 0.1, 0.3, 1.0, 3.0, 10.0, 30.0, and 99.0% of the maximum density. The side panels (right and top) show the density along the dashed lines (dashed vertical and horizontal lines) for each density map.

J. Rolke et a l . / Chemical Physics 201 (1995) 1-21 11
XMPs very poorly, to the intermediate quality results (6-311 + G*-U) to the large basis sets (curves 3u, 4u, 5u and 6u). There is a "UHF basis set limit" at which these Hartree-Fock momentum profiles tend to converge and little or no further improvement in shape fit with experiment is seen upon an increase in basis set size. An improvement in shape fit is brought about only by use of the ROHF method (curves 3r, 4r, 5r and 6r). ROHF calculations were also obtained for a[1 molecules with the STO-3G and 6-311 + G * basis sets (calculations lr and 2r, respectively) and the results are given in Tables 1-3 (these TMPs are not shown in Figs. 2-4) . The STO-3G-R momentum
profiles for 0 2 and NO 2 are identical to the STO- 3G-U momentum profiles for these two molecules. However, in all other cases in the present work the ROHF momentum profiles displayed a higher rela- tive intensity at low momentum than their UHF counterparts. This effect is thought to be due to the influence of the energy minimization constraint in constructing SCF wavefunctions. For an optimized UHF wavefunction, the additional flexibility intro- duced by different ~ and /3 spin manifolds leads to a lower total energy and a more contracted r-space HOMO density than an ROHF wavefunction with the same basis set. Thus, the ROHF method leads to
Table 1
Calcula ted and experimental propert ies for N O X 2 H
Basis set and Total energy ( g 2 ) /x (D) b Pmax (au) c
calcula t ion method ~ (hartree)
S C F calcula t ions
I u S T O - 3 G - U - 127.530 0 .9660 + 0 .2492 1.27
1 r S T O - 3 G - R - 127.526 0 .7500 + 0 .1559 1.20
2u 6-311 + G * -U - 129.284 0 .8104 - 0 .3019 0 .94
2r 6-311 + G *-R - 129.277 0 .7500 - 0 . 3 6 1 7 0.89
3u A U G 5 - U - 129.304 0 .8024 - 0.2391 0.91
3r A U G 5 - R - 129.296 0 .7500 - 0 .2873 0.85
4u 168-U - 129.309 0 .7984 - 0 .2440 0.91
4r 168-R - 129.299 0 .7500 - 0 .2753 0.86
6u 210-U - 129.307 0.7981 - 0 .2397 0.91
6r 210-R - 129.297 0 .7500 - 0 .2689 0.89
p o s t - H a r t r e e - F o c k calculat ions
4c 168-CI - 129.713 0 .7500 + 0 . 1 3 8 8 0.86
4a 168-ACPF - 129.730 0 .7500 + 0 .1779 0.85
6c 210-CI - 129.712 0 .7500 + 0 . 1 4 3 2 0.88
6a 2 1 0 - A C P F - 129.728 0 .7500 + 0 . 1 8 0 5 0.86 D F F calculat ions d
3l A U G 5 - L - 128.981 - + 0 .2536 0.77
3p A U G 5 - P - 130.088 - + 0 .2322 0.76
3b A U G 5 - B P - 129.967 - + 0 .2316 0.79 exper imental - 129.900 e + 0 . 1 5 8 f 0.85
Calculat ions per formed at the experimental equi l ibr ium bondlength of 1.151 ,~ (2.175 au), Ref. [42].
b A positive dipole m o m e n t p. implies a polari ty of N - O +. Calcula ted dipole momen t s are for a non-relativist ic, non-vibrat ing,
non-rotat ing molecule. c The Pm~x corresponds to the value o f m o m e n t u m where the intensity o f the m o m e n t u m profile is at a m a x i m u m (see Fig. 2).
d The total energy f rom K o h n - S h a m DFT has been sugges ted to be in error because of shifted orbital energies relative to ionization potentials from D y s o n ' s equat ion [26] - see also Section 3.
The " e x p e r i m e n t a l " total energy is the es t imated non-relativist ic, non-vibrat ing, infinite nuclear mass total energy. Total energy obtained
by adding the atomic energies f rom Ref. [70] to the D o values f rom Ref. [49] plus the zero point energy f rom the frequencies in Ref. [49]. A
numerical H a r t r e e - F o c k calculat ion with the R O H F method was also reported to give a total energy o f - 129.2991 hartree for NO [71].
f Refs. [48-50] .
Present work , + 0.05.

12 J. Rolke et a l . / Chemical Physics 201 (1995) 1-21
a more diffuse r-space density distribution because of its additional orbital constraint. For the s-type HOMO of NO 2 (Fig. 4), the increased intensity is concentrated near p = 0 and no appreciable shape difference results between ROHF and UHF TMPs although ROHF leads to higher intensity at low p than UHF. It should be also be noted that other calculated properties differ considerably in the UHF and ROHF methods (see Tables 1-3). In particular, as noted above, the UHF method always results in a lower energy then the ROHF method, but spin con- tamination can be problematic for UHF wavefunc- tions. For example, there is a high degree of spin contamination for the STO-3G-U and 6-311 + G *-U calculations for NO (Table 1). However, the spin contamination for UHF calculations on 02 and NO z is reasonably small (Tables 2 and 3).
Post-Hartree-Fock methods such as CI calcula- tions [2,5,60,61] have often provided a further signif- icant improvement in the shape fit with the XMP over Hartree-Fock level calculations, particularly where second row atoms are involved. From Fig. 2 it can be seen that a comparably good description of the observed momentum profile of NO is achieved by the larger basis set restricted Hartree-Fock (AUG5-R (3r), 168-R (4r) and 210-R (6r)) and post- Hartree-Fock (168-CI (4c) and 168-ACPF (4a)) cal- culations. Although not shown on Fig. 2, the 210-CI and 210-ACPF TMPs give very similar results (see Table 1). However, there is still a small discrepancy between the NO XMP and all theory at low momen- tum below p --~ 0.4 au. This could be due to a very small amount of impurity NO 2 (see Section 2.2) although it is found (see Section 4.3) that a much
Table 2 Calculated and experimental propert ies for 0 2 X 3v~
Basis set and Total energy ( j 2 ) ~gzz ( r 2 )e Pm~
calculat ion method ~ (hartree) (au) b (au) c (au) a
SCF calculat ions I u S T O - 3 G - U - 147.634 2 .0034 - 0 .9307 40.652 1.36
I r S T O - 3 G - R - 147.632 2 .0000 - 0 .9258 40.649 1.36
2u 6-311 + G * -U - 149.660 2 .0488 - 0 .4304 43 .744 1.10
2r 6-311 + G * -R - 149.638 2 .0000 - 0 .4708 43.673 1.07
3u A U G 5 - U - 149.686 2 .0488 - 0 .1574 43.446 1.07
3r A U G 5 - R - 149.663 2 .0000 - 0 .2304 43.385 1.05
4u 168 -U - 149.691 2 .0484 - 0 .2178 43 .446 1.07
4r 168-R - 149.667 2 .0000 - 0 .2768 43 .386 1.05
p o s t - H a r t r e e - F o c k calculat ions
4c 168-CI - 150.133 2 .0000 - 0 .2766 43.337 1.03
4a 168-ACPF - 150.146 2 .0000 - 0 .2716 43 .410 1.03
DFT calculat ions ~ 31 A U G 5 - L - 149.338 - - 0 .3259 43.878 0.96
3p A U G 5 - P - 150.547 - - 0 .3390 43 .924 0.95
3b A U G 5 - B P - 150.418 - - 0 .3224 43.708 0.98
exper imental - 150.326 f - 0 . 2 9 g 44.4 + 0.2 " 1.0
a Calculat ions per formed at the experimental equi l ibr ium bondlength o f 1.20748 A (2.28181 au), Ref. [43].
b The quadrupole momen t is defined as 0:: = 1/2(Y~qi(3z2i- ri2)), summing over all nuclei and electrons. Calcula ted quadrupole
moments are for a non-relativist ic, non-vibrat ing, non-rota t ing molecule. c The electronic spatial extent is defined as ( r 2 ) = (Y 'r 2) , summing over all electrons.
The Pm~ corresponds to the value of momen tum where the intensity o f the m o m e n t u m profile is at a m a x i m u m (see Fig. 3).
e The total energy f rom K o h n - S h a m DFT has been suggested to be in e r ror because o f shifted orbital energies relative to ionizat ion
potentials f rom D y s o n ' s equat ion [26], see also Section 3. f The " e x p e r i m e n t a l " total energy is the est imated non-relat ivist ic , non-vibra t ing , infinite nuclear mass total energy. Total energy obtained
by adding the a tomic energies f rom Ref. [70] to the D o values f rom Ref. [49] plus the zero point energy f rom the f requencies in Ref. [49].
g R e c o m m e n d e d value f rom Ref. [72]. h Ref. [73]
Present work , + 0.05.

J. R olke et al. / Chemical Physics 201 (1995) 1-21 13
0 .06
>-,
O3 O.04 C- (1)
C-
(D > 0 .02
0
r'K
0 .00 0
Zl-c,4a 3 r , 4 r
l u
1 2 Momentum (a.u.)
02 17 g 12.30 eV • MC Expt. 4a 1 6 8 - A C P F 4c 1 6 8 - C I 4r 1 6 8 - R 4u 1 6 8 - U 3r A U G 5 - R 3u A U G 5 - U 2u 6 - 3 1 1 + G , - U .1 u STO- 3 G - U
- 4
- 8 - 8
MOMENTUM DENSITY
- 4 0 ~. ;~
(o.u.)
POSITION DENSITY
Oz 8 1 ig
4
1
g ~ J - - 4 0 4
(o.u.) Fig. 3. Measured and calculated spherically averaged momentum profiles for the llrg orbital of 02 (upper panel). The solid circles represent the experimental energy dispersive multichannel EMS measurements. All calculations have been spherically averaged and folded with the experimental momentum resolution. See text and Table 2 for details of the wavefunctions and normalization procedures. The lower panels show the momentum and position density contour maps for an oriented O 2 molecule calculated at the Harlree-Fock level using the 168-R basis set. The contours represent 0.01, 0.03, 0.1, 0.3, 1.0, 3.0, 10.0, 30.0, and 99.0% of the maximum density. The side panels (right and top) show the density along the dashed lines (dashed vertical and horizontal lines) for each density map.

14 J. Rolke et a l . / Chemical Physics 201 (1995) 1-21
> . 0 . 2
(-
2 _c
~ 0.1
L~ C~
0.0
I I
5a,5q N 02 6 a 1 11 .25 eV
• SC Expt 5q 207 -QDVPT
2 0 7 - A C P F ~c 5° ~7_.~0, 5 r 5u 207--U 5r AUG5-R 3u AUG5-U 2u 6 - 3 1 1 + G * - U lu S T O - 3 0 - U
r -
0 1 2
Momentum (a.u.)
MOMENTUM DENSITY
- 4
- 8
POSITION DENSITY
21 i r i i 4 0 4 B
(o.u.)
8
'4 I , - - -88 _ 0 4
(o.u.)
NO2 6a~
f
~JN'--... o
Fig. 4. Measured and calculated spherically averaged momentum profiles for the 6a~ orbital of NO 2 (upper panel). The solid circles represent the experimental single channel EMS measurements. All calculations have been spherically averaged and folded with the experimental momentum resolution. See text and Table 3 for details of the wavefunctions and normalization procedures. The lower panels show the momentum and position density contour maps for an oriented NO2 molecule calculated at the Hartrce-Fock level using the 207-R basis set. The contours represent 0.01, 0.03, 0.1, 0.3, 1.0, 3.0, 10.0, 30.0, and 99.0% of the maximum density. The side panels (right and top) show the density along the dashed lines (dashed vertical and horizontal lines) for each density map.

J. Rolke et al. / Chemical Physics 201 (1995) 1-21 15
Table 3
Calculated and experimental properties for NO 2 X 2A
Basis set and Total energy ( g 2 ) /z (D) b
calculation method ~ (hartree)
SCF calculations
lu STO-3G-U - 2 0 1 . 2 7 3 0.7619 +0.2435
1 r STO-3G-R - 201.268 0.7500 + 0.2758
2u 6 - 3 1 1 + G * - U - 2 0 4 . 0 8 7 0.7702 +0 .7187
2r 6-311 + G *-R - 2 0 4 . 0 7 8 0.7500 +0 .8073
3u AUG5-U - 2 0 4 . 1 2 1 0.7712 +0 .6610
3r AUG5-R - 204.112 0.7500 + 0.7446
5u 207-U - 204.129 0.7713 + 0.6584
5r 207-R - 204.120 0.7500 + 0.7629
post -Har t ree-Fock calculations
5c 207-C1 - 204.752
5a 207-ACPF - 204.795
5q 207-QDVPT - 204.806
DFY calculations ~
3 l AUG5-L - 203.710
3p AUG5-P - 205.400
3b AUG5-BP - 2 0 5 . 2 1 7
experimental - 205.085 ~
0.7500 + 0.4373
0.7500 + 0.4740
0.7500 + 0.4857
+ 0.2689
+ 0.2668 + 0.2463
+ 0.289 ~
Calculations performed at the experimental equil ibrium
bondlength of 1.19455 b, (2.25737 au) and bond angle of 133.851 °, Ref. [44]. b
A positive dipole moment implies a polarity of N ÷ 0 2. Calcu- lated dipole moments are for a non-relativistic, non-vibrating, non-rotating molecule.
~ The total energy from K o h n - S h a m DFF has been suggested to
be in error because of shifted orbital energies relative to ionization
potentials from Dyson ' s equation [26]. See also Section 3. d The "expe r imen ta l " total energy is the estimated non-relativis-
tic, non-vibrating, infinite nuclear mass total energy. Total energy
obtained by adding the atomic energies from Ref. [70] to the D o values from Ref. [74] plus the zero point energy from the frequen- cies in Ref. [74].
Ref. [75].
better fit is given by a DFT calculation. The 168-CI (4c) and 168-ACPF (4a) calculations for O 2 (Fig. 3) both show a significant improvement in shape over the ROHF momentum profiles (3r and 4r) but the experimental momentum profile for 0 2 still shows slightly less intensity above ~ 1.4 au than is pre- dicted by all calculations. It should be noted that the DFF momentum profiles provide an improved pre- diction of the intensity in this region (see Section 4.3 for a discussion). Although the 207-CI (5c), 207- ACPF (5a) and 207-QDVPT (5q) post-Hartree-Fock calculations for NO 2 are reasonably similar in shape to the ROHF momentum profiles (3r and 5r), they do
show higher intensity at lower p and fit the XMP quite well within the statistical precision of the data.
Turning to a more detailed consideration of the various calculations, it can be seen that the minimal basis set STO-3G-U results are in very poor agree- ment with both the observed experimental momen- tum profiles (curves lu on Figs. 2-4) and electronic properties (Tables 1-3). For NO 2 in particular the STO-3G-U momentum profile exhibits a very differ- ent s to p ratio from the XMP and the other TMPs. The poor total energy for all molecules and inaccu- rate quadrupole ( r 2 ) e and values for 0 2 reflect the low degree of basis set saturation in the STO-3G-U calculations. While the dipole moments for NO and NO 2 are closer to experiment than those from sev- eral large basis sets, it is well known that the STO-3G often produces accurate dipole moments because of a fortuitous error cancellation [20].
The 6-311 + G*-U intermediate size basis set calculation (curve 2u on Figs. 2-4), including dif- fuse and polarization functions, provides a better description than the STO-3G-U wavefunction for each molecule. However, the low momentum regions of all three XMPs are still underestimated. For NO 2 the 6-311 + G *-U momentum profile is comparable to the results of the larger basis set Hartree-Fock (UHF and ROHF) calculations. Although in general improvements are also obtained for other calculated properties for all three molecules (Tables 1-3) rela- tive to the STO-3G-U calculation, significant further improvements occur with larger basis sets.
The AUG5-U TMP (curves 3u on Figs. 2-4) provides a further small improvement in shape com- pared to the 6-311 + G *-U momentum profiles for NO and 02. The AUG5-U momentum profile for NO 2 differs only in intensity from the 6-311 + G *-U TMP. Improvements are also seen in most other properties in Tables 1-3 although Ozz for 0 2 from this calculation is too small.
The UHF momentum profiles from larger basis sets (curves 3u, 4u, 5u and 6u on Figs. 2-4) tend to converge. However, there is still some fluctuation in other properties with basis set size (Tables 1-3). In particular, there is still variation in total energy at the millihartree level. The dipole moments of NO and NO 2 and the quadrupole moment of 0 2 also vary significantly with change in basis set size. Of these UHF calculations, the 168-U provides generally the

16 J. Rolke et a l . / Chemical Physics 201 (1995) 1 -2 l
best description of the range of properties considered here for NO and 0 2 while the 207-U provides the best description of the properties of NO 2.
The ROHF momentum profiles for NO and O 2 (curves 3r, 4r and 6r on Figs. 2 and 3) show greater intensity at low momentum and better agreement (i.e. shape/Pma x) with the observed XMP than UHF calculations with the same basis set. Greater intensity at low momentum is also seen for the ROHF mo- mentum profiles for NO 2 (curves 3r and 5r on Fig. 4) than their UHF counterparts. It is of interest that these ROHF TMPs for NO have much the same intensity and shape as those from post-Hartree-Fock methods (curves 4c and 4a). The larger basis set ROHF momentum profiles for 0 2 and NO 2 con- verge (at least for shape and intensity) similar to the situation for the UHF momentum profiles. For other electronic properties (Tables 1-3), the ROHF calcu- lations obviously result in slightly higher total ener- gies than comparable UHF calculations, but the ROHF wavefunctions are free of spin contamination. Post-Hartree-Fock methods are required for further improvements in the total energy and for the dipole moments of NO and NO 2. The 168-R result for 0 2 provides ~gzz and (r2)~ values comparable to the higher level post-Hartree-Fock calculations.
The direct calculation of the ion-neutral overlap including electronic correlation and relaxation by the MRSD-CI and ACPF methods produces only minor changes in the level of agreement between the mea- sured and calculated momentum profiles of NO (Fig. 2). Curves 4c and 4a predict only slightly more intensity at low momentum than the Hartree-Fock level calculation with the same basis set (4r), with curve 4a producing (along with 3r and 6r) very similar results. However, a small discrepancy be- tween experiment and theory persists at low momen- tum (see above). Somewhat larger changes in the level of agreement between experiment and theory are seen upon calculation of the MRSD-CI and ACPF momentum profiles for 0 2 (Fig. 3). Curves 4c and 4a are clearly in closer agreement with the observed XM, , , ~ . . . . c,w momentum region than the Hartree-Fock calculations 3r and 4r (although some small discrepancy still apparently remains between experiment and theory in the high momentum region above 1.5 au). The MRSD-CI and particularly the ACPF and QDVPT theoretical momentum profiles
for N O 2 (curves 5c, 5a and 5q on Fig. 4, respec- tively) also differ considerably from the Hartree- Fock level calculation (curve 5r) and generally good agreement can be seen for the 207-ACPF (5a) and 207-QDVPT (5q) momentum profiles to which the XMP has been normalized. It should also be noted with the post-Hartree-Fock calculations that there is a significant improvement in the total energies of all molecules, as well as for the dipole moments of NO and NO 2 and the quadrupole moment of 0 2 (Tables 1-3). However, there is little difference in the ( r 2)~ values of O 2 relative to the SCF calculations. Since the post-Hartree-Fock calculations are based on ini- tial ROHF Hartree-Fock results, they are free of spin contamination. It should be noted that the post- Hartree-Fock calculations for NO using the 168- GTO basis set generally yield better values of the properties than those using the 210-GTO basis set for a given type of calculation.
4.2. Density maps in momentum and position space
The momentum and position space density con- tour maps corresponding to oriented NO, 0 2 and NO 2 molecules presented in Figs. 2 - 4 (bottom pan- els) are of pedagogical interest and also provide some insight into the (spherically averaged) experi- mental and theoretical momentum profiles. These maps are slices of the orbital electron density (/q J21) through the molecular plane of each oriented molecule in position space and with momentum per- pendicular and parallel with respect to the molecular plane in momentum space. The calculations are based on the near Hartree-Fock limit results for each molecule (168-R for NO and O 2 and 207-R for NO 2) which have been found to provide good de- scriptions of the XMPs of these molecules at the SCF level. The origin for the position space maps is the molecular center of mass and all dimensions are in atomic units. The side panels on each map show slices of the momentum or position space density along the vertical (right panel) and horizontal (top panel) dotted lines.
The HOMO of NO is predicted (from simple Hartree-Fock theory) to be a completely antibonding • r * orbital with no s-type contributions. Accord- ingly, the r-map (Fig. 2) for this molecule displays

J. Rolke et al. / Chemical Physics 201 (1995) 1-21 17
an orbital consisting mainly of atomic p-type func- tions on each atom. While the general shape of this orbital is similar to that of the 1 ~rg orbital of 0 2 (Fig. 3), the p-type orbital components for NO are not of equal intensity on N and O. In addition, there is a "filling-in" along the perpendicular "nodal" plane in p-space. Since the Kouba and Ohm treatment [17] was erroneously considered (see Section 2.2) to give the best fit to the momentum profiles in earlier work [11] the fact that the corresponding HOMO r-map of NO became more non-bonding (and hence less anti- bonding) as the amount of nodal character in the orbital decreased was thought to be significant. How- ever, it has been found in the present work that the K and O-U wavefunction does not provide an accept- able fit to the NO XMP once the NO 2 impurity has been eliminated (see Section 2.2 and Fig. 1). Thus any deductions [11] arising from the non-bonding or antibonding character of this orbital predicted using the Kouba and Ohm wavefunction are inappropriate. It should also be noted that while there is some filling-in along the perpendicular plane, the intensity at the origin of the p-map is exactly zero (see top panel). Thus, spherical averaging of this momentum density should give a momentum profile with zero intensity at p = 0. In this regard it should be noted that the calculated spherically averaged momentum profiles in Fig. 3 have non-zero intensity at p = 0 due to the fact that they have been folded with the instrumental resolution function to compare with ex- periment.
The simple Hartree-Fock MO picture would pre- dict the HOMO of 0 2 to be a completely antibond- ing rr * orbital with no s-type contributions. The nodal planes along r - - 0 in each direction (one nodal plane along the bond axis and one perpendicu- lar to the bond axis) are consistent with this interpre- tation. The high Pmax value (1.0 au, see Table 2) for the l~rg momentum profile of O 2 is a reflection of the multiple nodal structure [11,62] of this orbital (i.e. p = iha(~b)/ax) . Similar considerations apply to NO. On considering the momentum density map of O 2, the additional lobes are the result of interfer- ence of the wavefunctions on the atomic centers reflecting the (anti)bonding nature of the orbital. Such multiple lobes in momentum space are com- monly called "bond oscillations" [63-65] and in the case of diatomic molecules they appear at a spacing
of 2"rr/bondlength (similar to diffraction spots in a two slit diffraction experiment).
The p-map for the 6a I orbital of the triatomic species NO 2 is more complex than those for the diatomic molecules NO and 0 2 (Fig. 4). The com- plexity of the p-map indicates the difficulties that often arise in interpreting momentum space represen- tations for larger molecules. The multicenter nature of this molecule is reflected in the complex oscilla- tory behavior in momentum space. It should be noted that the momentum space wavefunction contains all the symmetry characteristics of the position space wavefunction with the addition of an inversion cen- ter and thus the p-map contains a center of symme- try (even though such a symmetry element is not present in the C2v point group). Finally, on the p-map there is a large momentum density at p = 0 (top and right panels in the p-map) and thus the spherically averaged NO 2 6al momentum profile (Fig. 4) is strongly s-type in contrast to the p-type momentum profiles of NO and 0 2 ( Figs. 2 and 3). In the r-map, the HOMO displays the a 1 symmetry characteristic of a totally symmetric orbital in the C2v molecular point group.
4.3. Calculation o f the momentum profiles using density functional theory
Kohn-Sham density functional theory provides an alternative approach to Hartree-Fock and also in particular to configuration interaction methods for calculating theoretical momentum profiles [26,27]. The density functional theory calculations presented here were obtained by the method of Duffy et al. [26] using the deMon program [66,67]. Three DFT calcu- lations are presented here for each of the three molecules using the AUG5 orbital basis set (de- scribed in Section 3), which is a truncated form of the aug-cc-pV5Z of Dunning et al. [38-41]. Trunca- tion was necessary because the deMon program is not equipped to handle f, g, or h functions. It should also be noted that all calculations which were per- formed using this basis set were carded out with six-membered Cartesian d functions. All calculations used a random extra-fine grid, the (5,4;5,4) auxiliary basis for fitting the charge density and exchange- correlation potential, and the energy convergence was set at 10 -7 hartree. Calculations were done with

18 J. Rolke et a l . / Chemical Physics 201 (1995) 1-21
the local density approximation [31] as well as with two non-local potential functions as given by the gradient corrected exchange hole term of Perdew and Yue [32,33] and the exchange-corre la t ion potential correction of Becke and Perdew [33,34]. The K o h n - Sham orbitals have been extracted from the result and the EMS cross sections have been calculated
using the TKSA as outlined in Section 2.1. The instrumental angular resolution effects [15,16] were then incorporated and the resulting theoretical mo- mentum profiles are shown in Fig. 5. For purposes of comparison, MRSD-CI, ACPF and QDVPT momen- tum profiles for each molecule are also shown. Val- ues of selected electronic properties from the DFT calculations are given in Tables 1-3. Calculations in which the local density approximation of Vosko et al. [31] was used are designated with the " - L "
extension added to the basis set symbol while those calculations employing the method of Perdew and Yue [32,33] have the " - P " extension. Finally, the Becke-Perdew non-local (i.e. gradient corrected) ex- change-corre la t ion potential [33,34] calculations are designated with a " - B P " extension.
While K o h n - S h a m DFT momentum profiles of- ten provide reasonable shapes for the TMPs, it has been observed that intensities for K o h n - S h a m mo- mentum profiles may not be entirely comparable to the intensities of TMPs from Har t r ee -Fock or post- Har t r ee -Fock calculations [26,27]. This can occur because overly spatially diffuse orbitals may result from some choices for the exchange-corre la t ion functional in the K o h n - S h a m calculations and thus the momentum profile may be more intense at low p (by the reciprocity of r- and p-space). All DFT
0 .04
0.02
>~
(.n c- (D 0 .00
c-
(b 0 .04 >
@ 0.02 rr"
0 .00
NO
i i
02 ln- 0.3
0.2
0.1
0.0
Post-Hartree-Fock Calculations 5q 207-QDVPT 5a 207-ACPF 5c 207-CI 4a 168-ACPF 4c 1 6 8 - C I
DFT Calculations 5b A U G 5 - B P 5p A U O 5 - P 5 l A U G 5 - L
5c ' ~"~-.~__q&_
0 1 2 0 1
NO 6a 2 1
• SO Expt
i
2
Momentum (e.u.) Fig. 5. Measured and calculated spherically averaged DFT momentum profiles for the HOMOs of NO, 02 and NO 2. The solid circles represent the experimental multichannel or single channel measurements also shown on Figs. 2-4. Selected MRSD-CI, ACPF and QDVPT calculated momentum profiles are also shown for comparison with the DFT momentum profiles. All calculations have been spherically averaged and folded with the experimental momentum resolution. See text and Tables 1-3 for details of the wavefunctions and normalization procedures. Note that the normalizations of experiment to theory differ from those used in Figs. 2-4.

J. Rolke et a l . / Chemical Physics 201 (1995) 1-21 19
momentum profiles in Fig. 5 appear at 100% of their calculated relative intensity and the XMPs have been normalized to the DFT TMPs for the present com- parison (note that different normalizations were se- lected for Figs. 2-4). It can be seen that the DFT momentum profiles are more intense at low p than the MRSD-CI, ACPF and QDVPT results.
It can be seen from Fig. 5 that there is very good overall agreement between the DFT Target Kohn- Sham momentum profiles and the experimental mo- mentum profiles of all three molecules. In terms of intensity of the DFT momentum profiles, the order- ing is AUG5-P (curve 3p), AUG5-L (curve 3l) and AUG5-BP (curve 3b) for all molecules. For NO, there are some noticeable shape differences between the three DFI" TMPs, with the Becke-Perdew non- local calculation (curve 3b) fitting the best. How- ever, for 0 2 and NO 2, the shape differences between the DFT TMPs from the local density approximation and those from the non-local potentials are minimal. Thus, the local density approximation results appear to be at least as good a model of the momentum profiles for the HOMOs of 0 2 and NO 2 as the more sophisticated non-local potential treatments.
Somewhat better agreement with the shape of the observed XMP of NO is given by the DFF curve 3b (Fig. 5) in the low momentum region ( < 0.5 au) than for the high level post-Hartree-Fock calculations (see Fig. 5, and also refer to curves 4c and 4a on Fig. 2). Furthermore, the DFT momentum profiles for 0 2 achieve better agreement in the high momentum region than the Hartree-Fock and post-Hartree-Fock calculations (compare Figs. 3 and 5). For NO 2 the intensities are different and the shape fit with the XMP is roughly comparable to those from the Hartree-Fock and post-Hartree-Fock TMPs (com- pare Figs. 4 and 5). On comparing other properties, dipole moments from the DFT calculations ( Tables 1 and 3) are within 0.1 D of experiment. While the DFT dipole moments for NO 2 are closer to experi- ment than those from MRSD-CI or ACPF, the oppo- site is true for the dipole moment of NO. DFT quadmpole moments and ( r 2 )e values for 0 2 are in reasonable agreement with the experimental values. However, it should be noted that some degree of spin contamination is present in the DFT calculations for open shell molecules that is not ~resent for the CI results. The expectation value of S 2 from the deMon
program is not considered to be meaningful and thus it has been omitted from the tables. The problems associated with g2 determination in DFT calcula- tions have recently been discussed by Wang, Becke and Smith [51]. In addition, as discussed above, there is the well-known problem of obtaining absolute energies from DFT [68,69]. However, it can be said that the DFT treatments provide quite good values of the other properties in the present work.
5. Conclusions
The present EMS results for NO and 0 2 are an improvement over previous measurements and the data show considerably less scatter. The results for NO are significantly different from previously pub- lished measurements in the low momentum region and the differences can be attributed to contamina- tion by NO 2 in the earlier work. In addition, we have reported the first measurements and calculations for the XMP for the 6a I HOMO of NO 2. A wide range of Hartree-Fock and high level post-Hartree-Fock (MRSD-CI, ACPF and QDVPT) calculations have also been performed and generally good agreement was obtained between theoretical and experimental momentum profiles for all three open shell molecules. At a given Hartree-Fock level, ROHF calculations are found to give much better predictions of the shapes of the momentum profiles than UHF meth- ods. Post-Hartree-Fock calculations produce only small changes in the momentum profiles of NO and 0 2 while the difference is greater in the case of NO 2. The small but significant discrepancies remain- ing between theory and experiment for 0 2 (at higher momentum) and NO (at lower momentum) even at the post-Hartree-Fock level are reduced by the den- sity functional theory calculations.
Acknowledgements
This work received financial support from the Canadian National Networks of Centres of Excel- lence (Centres of Excellence in Molecular and Inter- facial Dynamics), the Natural Sciences and Engineer- ing Research Council of Canada (NSERC) and the United States National Science Foundation (NSF).

20 J. Rolke et al. / Chemical Physics 201 (1995) 1-21
Two of us (JR and BPH) gratefully acknowledge NSERC Postgraduate Scholarships. One of us (NC) gratefully acknowledges NSERC and UBC Killam Postdoctoral Fellowships. We also thank N. Lermer and B.R. Todd of our research group at the Univer- sity of British Columbia for their preliminary mo- mentum dispersive measurements of NO that helped to confirm the presence of NO 2 contamination.
References
[1] C.E. Brion, Intern. J. Quantum Chem. 19 (1986) 1397. [2] C.E. Brion, in: The physics of electronic and atomic colli-
sions, eds. T. Anderson et al. (American Institute of Physics Press, New York, 1993) p. 350, and references therein.
[3] I.E. McCarthy and E. Weigold, Rept. Progr. Phys. 54 (1991) 789.
[4] K.T. Leung, in: Theoretical models of chemical bonding, ed. Z.B. Maksic (Springer, Berlin, 1991).
[5] A.O. Bawagan, C.E. Brion, E.R. Davidson and D. Feller. Chem. Phys. 113 (1987) 19.
[6] D. Feller, C.H. Boyle and E.R. Davidson, J. Chem. Phys. 86 (1987) 3424.
[7] Y. Zheng, J.J. Neville, C.E. Brion, Y. Wang and E.R. Davidson, Chem. Phys. 188 (1994) 109.
[8] B.P. Hollebone, J.J. Neville, Y. Zheng, C.E. Brion, Y. Wang and E.R. Davidson, Chem. Phys. 196 (1995) 13.
[9] D.F. Shriver, P.W. Atkins and C.H. Langford, Inorganic chemistry (Freeman, New York, 1990).
[10] P. Feldman, O. Griffith and D. Stuehr, C and E News. 71(50) (1993) 26.
[11] C.E. Brion, J.P.D. Cook, I.G. Fuss and E. Weigold, Chem. Phys. 64 (1982) 287.
[12] R. Fantoni, A. Giardini-Guidoni and R. Tiribelli, Electron. Spectry. Relat. Phenom. 26 (1982) 99.
[13] J.A. Tossell, J.H. Moore, M.A. Coplan, G. Stefani and R. CamiUoni, J. Am. Chem. Soc. 104 (1982) 7416.
[14] I.H. Suzuki, E. Weigold and C.E. Brion, J. Electron. Spectry. Relat. Pbenom. 20 (1980) 289.
[15] A.O. Bawagan and C.E. Brion, Chem. Phys. 144 (1990) 167. [16] P. Duffy, M.E. Casida, C.E. Brion and D.P. Chong, Chem.
Phys. 159 (1992) 347. [17] J.E. Kouba and Y. Ohm, Intern. J. Quantum Chem. 5 (1971)
539. [18] I.N. Levine, Quantum chemistry, 4th Ed. (Prentice Hall,
Englewood Cliffs, 1991). [19] A. Szabo and N. Ostlund, Quantum chemistry, 1st Ed.
(McGraw-Hill, Toronto, 1982). [20] W. Hehre, L. Radom, P.von R. Schleyer and J.A. Pople, Ab
initio molecular orbital theory (Wiley-Interscience, New York, 1986).
[21] L. Farnell, J. Pople and L. Radom, J. Phys. Chem. 87 (1983) 79.
[22] K.T. Leung and C.E. Brion, Chem. Phys. 82 (1983) 87.
[23] J. Gdanitz and R. Ahlrichs, Chem. Phys. Letters 143 (1988) 413.
[24] R.J. Cave and E.R. Davidson, J. Chem. Phys. 89 (1988) 6798.
[25] C.W. Murray, S.C. Racine and E.R. Davidson, Intern. J. Quantum Chem. 42 (1992) 273.
[26] P. Duffy, D.P. Chong, M.E. Casida and D.R. Salahub, Phys. Rev. A 50 (1995) 4704, and references therein.
[27] M.E. Casida, Phys, Rev. A 51 (1995) 2005. [28] P. Duffy, D.P. Chong and M. Dupuis, J. Chem. Phys. 102
(1995) 3312. [29] J.J. Neville, Y. Zheng, C.E. Brion, N. Cann, S. Wolfe and C.
Kim, to be published. [30] Y. Zheng, J.J. Neville and C.E. Brion, Science, 3 Novemoer
1995 issue. [31] S.H. Vosko, L. Wilk and M. Nussair, Can. J. Phys. 58 (1980)
1200. [32] J.P. Perdew, Phys. Rev. B 33 (1986) 8800. [33] J.P. Perdew and W. Yue, Phys. Rev. B 33 (1986) 8800. [34] A.D. Becke, Phys. Rev. A 38 (1988) 3098. [35] P.E. Cade and A.C. Wahl, At. Data Nucl. Data Tables 13
(1974) 339. [36] B.R. Todd, N. Lermer and C.E. Brion, Rev. Sci. Instrum. 65
(1994) 349. [37] W.F. Chart, G. Cooper and C.E. Brion, Chem. Phys. 170
(1993) 111. [38] T.H. Dunning Jr., J. Chem. Phys. 90 (1989) 1007. [39] R,A. Kandall, T.H. Dunning Jr. and R.J. Harrison, J. Chem.
Phys.96 (1992) 6796. [40] D.E. Woon and T.H. Dunning Jr., J. Chem. Phys. 98 (1993)
1358. [41] D.E. Woon and T.H. Dunning Jr., J. Chem. Phys. 99 (1993)
1914 [42] J.H. Shaw, J. Chem. Phys. 24 (1956) 399. [43] E. Tiemann, J. Mol. Spectry. 91 (1982) 60. [44] Y. Morino and M. Tanimoto, Can. J. Phys. 62 (1984) 1315. [45] F.P. BiUingsley, J. Chem. Phys. 62 (1975) 864. [46] S. Green, Chem. Phys. Letters 13 (1972) 552. [47] S. Green, Chem. Phys. Letters 23 (1973) 115. [48] R.M. Neumann, Astrophys. J. 161 (1970) 779. [49] K. Huber and G. Herzberg, Constants of diatomic molecules
(Van Nostrand Reinhold, New York, 1979) pp. 466-480. [50] J.A. Gray, R.L. Farrow, J.L. Durant and L.R. Thorne, J.
Chem. Phys. 99 (1993) 4327. [51] J. Wang, A.D. Becke and V.H. Smith Jr., J. Chem. Phys. 102
(1995) 3477. [52] D. Feller and E.R. Davidson, J. Chem. Phys. 74 (1981) 3977. [53] W.J. Hehre, R.F. Step, art and J.A. Pople, J. Chem. Phys. 51
(1969) 2657. [54] R. Krishnan, M.J. Frisch and J.A. Pople, J. Chem. Phys. 72
(1980) 4244. [55] T. Clark, J. Chandrasekhar, G.W. Spitznagel and P.von R.
Schleyer, J. Comput. Chem. 4 (1983) 294. [56] M.J. Frisch, J.A. Pople and J.S. Binkley, J. Chem. Phys. 80
(1984) 3265. [57] H. Partridge, Near Hartree-Fock quality GTO basis sets for
the first and third row atoms, NASA Technical Memorandum 101044 (1989) 73; 79; 85.

J. Rolke et a l . / Chemical Physics 201 (1995) 1-21 21
[58] K. Kimura, S. Katsumata, Y. Achiba, T. Yamazaki and S. Iwata, Handbook of HeI photoelectron spectra of fundamen- tal organic molecules (Halsted Press, New York, 1981).
[59] T. Yamazaki and K. Kimura, Chem. Phys. Letters 43 (1976) 502.
[60] A.O. Bawagan, R. Muller-Fiedler, C.E. Brion, E.R. Davidson and C. Boyle, Chem. Phys. 120 (1988) 335.
[61] B.P. Hollebone, Y. Zheng, C.E. Brion, E.R. Davidson and D. Feller, Chem. Phys. 171 (1993) 303.
[62] A.O. Bawagan, C.E. Brion, M.A. Coplan, J.A. Tossell and J.H. Moore, Chem. Phys. 110 (1986) 153.
[63] J.P.D. Cook and C.E. Brion, J. Electron Spectry. Relat. Phenom. 15 (1979) 233.
[64] K.T. Leung and C.E. Brion, Chem. Phys. 82 (1983) 113. [65] J.R. Epstein and A.C. Tanner, Compton scattering, ed. B.G.
Williams (McGraw-Hill, New York, 1977) p. 209. [66] A. St.-Amant and D.R. Salahub, Chem. Phys. Letters 169
(1990) 387. [67] D.R. Salahub, R. Fournier, P. Mlanarski, I. Papai, A. St.-
Amant and J. Ushio, in: Density functional methods in chemistry, eds. J. Labanowski and J. Andzelm (Springer, New York, 1991) p. 77.
[68] R.O. Jones and O. Gunnarson, Rev. Mod. Phys. 61 (1989) 689.
[69] R.G. Parr and W.Yang, Density functional theory of atoms and molecules (Oxford Univ. Press, Oxford, 1989).
[70] S.J. Chakravorty, S.R. Gwaltney and E.R. Davidson, Phys. Rev. A 47 (1993) 3649.
[71] D. Feller, E.D. Glendening, E.A. McCullough Jr. and R.J. Miller, J. Chem. Phys. 99 (1993) 2829.
[72] D.E. Stogryn and A.P. Stogryn, Mol. Phys. 4 (1966) 371. [73] Y. Zhang, A.W. Ross and M. Fink, Z. Physik. D 18 (1991)
163. [74] G. Herzberg, Molecular spectra and molecular structure, Vol.
3 (Van Nostrand, New York, 1966). [75] S. Heitz, R. Lampka, D. Weidauer and A. Hese. J. Chem.
Phys, 94 (1991) 2532.