
Molex Inc. - Texas Tech Universitymmoore.ba.ttu.edu/ValuationReports/Fall2008/Molex-Fall2008.pdf ·...
244
1 Molex Inc. Project Group Members: Johnnie Davis [email protected] Eric Gordon [email protected] Monica Longer [email protected] Katelyn Owens [email protected] Allina Pokorny [email protected]
Transcript of Molex Inc. - Texas Tech Universitymmoore.ba.ttu.edu/ValuationReports/Fall2008/Molex-Fall2008.pdf ·...
1
Molex Inc.
Project Group Members:
Johnnie Davis [email protected]
Eric Gordon [email protected]
Monica Longer [email protected]
Katelyn Owens [email protected]
Allina Pokorny [email protected]
2
Table of Contents
Executive Summary 12
Business and Industry Analysis 21
Company Overview 21
Industry Overview 22
Five Forces Model 25
Rivalry of Existing Firms 26
Industry Growth Rate 27
Concentration of Competitors 28
Differentiation 30
Switching Costs 30
Economies of Scale 31
Learning Economies 32
Exit Barriers 33
Conclusion 33
Threat of New Entrants 34
3
Economies of Scale 34
First Mover Advantage 36
Legal Barriers 36
Conclusion 37
Threat of Substitute Products 38
Relative Price and Performance 38
Customers’ Willingness to Switch 39
Conclusion 40
Bargaining Power of Customers 40
Switching Cost 41
Differentiation 41
Importance of Product for Cost and Quality 41
Number of Customers 42
Volume of Customers 42
Conclusion 43
Bargaining Power of Suppliers 43
Switching Cost 43
Differentiation 44

4
Importance of Product for Cost and Quality 44
Number of Suppliers 44
Volume of Suppliers 45
Conclusion 45
Customer and Supplier Bargaining Power Conclusion 45
Analysis of Key Success Factors for Value Creation in the Industry 46
Cost Leadership 46
Economies of Scale and Efficient Production 47
Lower Input Costs 48
Simpler Product Designs 48
Differentiation 49
Product Quality 49
Product Variety 50
Brand Image 51
Flexible Delivery 52
Customer Service 52
Research and Development 53
Conclusion 54
5
Firm Competitive Advantage Analysis 54
Product Quality and Brand Image 55
Product Variety 55
Customer Service 56
Flexible Delivery 56
Research and Development 57
Conclusion 58
Formal Accounting Analysis 58
Key Accounting Policies 59
Research & Development 59
Goodwill 61
Pension Liabilities 62
Operating and Capital Leases 63
Currency Risk 64
Accounting Flexibility 65
Research & Development 65
Operating and Capital Leases 67
Pension Plans 68
6
Goodwill 69
Currency 70
Evaluate Accounting principles 71
Research and Development 71
Operating and Capital Leases 73
Pension Plans 74
Goodwill 76
Currency 78
Qualitative Analysis 78
Research and Development 79
Operating and Capital Leases 80
Pensions 81
Goodwill 82
Currency 82
Quantitative Accounting Measures and Disclosure 83
Sales Manipulation Diagnostic 84
Net Sales/Accounts Receivables 84
Net Sales/Cash from Sales 86

7
Net Sales/Inventory 88
Conclusion 90
Expense Manipulation Diagnostic 90
Asset Turnover 90
CFFO/OI 93
CFFO/NOA 95
Total Accruals/Sales 97
Pension/SG&A 98
Conclusion 100
Potential Red Flags 101
Undoing Accounting Distortion or Irregularities 102
Goodwill 104
Conclusion 107
Financial Analysis Forecasting Financials and Cost of Capital Estimation 108
Financial Analysis 108
Liquidity Ratio Analysis 108
Current Ratio 109
Quick Asset Ratio 110
8
Working Capital Turnover 112
Accounts Receivables Turnover 113
Days Sales Outstanding 115
Inventory Turnover 116
Days Supply Inventory 118
Cash to Cash Cycle 119
Conclusion 121
Profitability Analysis 122
Gross Profit Margin 122
Operating Expense Ratio 124
Operating Profit Margin 125
Net Profit Margin 126
Asset Turnover 128
Return on Assets 129
Return on Equity 131
Conclusion 132
Firm Growth Rate Ratios 133
Internal Growth Rate 134
Sustainable Growth Rate 135
Conclusion 137
Capital Structure Analysis 137
Debt to Equity 138
Times Interest Earned 139
Debt Service Margin 141
Z-scores 143
Conclusion 145
Estimating Cost of Capital 145
Cost of Equity 145
Size Adjusted 148
9
Alternative Cost of Equity 148
Cost of Debt 149
Weighted Average Cost of Capital 150
Financial Statement Forecasting 152
Income Statement 152
Income Statement (Restated) 157
Balance Sheet 160
Balance Sheet (Restated) 164
Statement of Cash Flows 167
Statement of Cash Flows (Restated) 171
Valuation Analysis 174
Method of Comparables 174
Price/Earnings Trailing 174
Price/Earnings Forecast 175
Price/Book 176
Price Earnings Growth (P.E.G.) 177
Price/EBITDA 178
Enterprise Value/EBITDA 179
Price/Free Cash Flows 180
Dividends/Price 182
Conclusion 182
10
Intrinsic Valuation Models 183
Discounted Dividends Model 183
Discounted Free Cash Flows Model 185
Residual Income Model 187
Abnormal Earnings Growth Model (A.E.G.) 190
Long Run Residual Income Model 192
Analyst Recommendations 196
Appendices 198
Sales Manipulation Diagnostic Ratios 198
Expense Manipulation Diagnostic Ratios 199
Liquidity Ratios 202
Profitability Ratios 205
Firm Growth Rate Ratios 208
Capital Structure Ratios 210
Altman Z-Scores 212
Cost of Debt 213
Weighted Average Cost of Capital 214
Weighted Average Cost of Equity 215
11
Year 1 Rates 215
Year 3 Rates 216
Year 4 Rates 217
Year 5 Rates 218
Year 6 Rates 219
Methods of Comparables 220
Intrinsic Valuation Models 224
Works Cited 238
12
Executive Summary
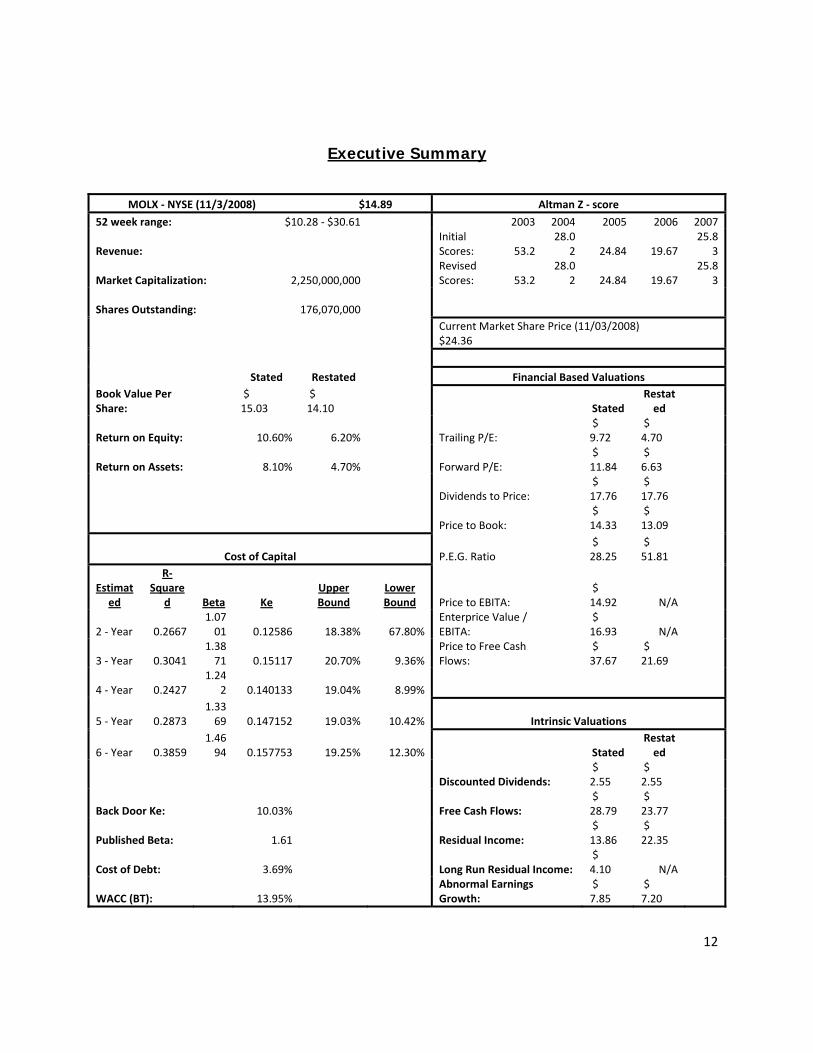
MOLX ‐ NYSE (11/3/2008) $14.89 Altman Z ‐ score
52 week range: $10.28 ‐ $30.61 2003 2004 2005 2006 2007
Revenue: Initial Scores: 53.2
28.02 24.84 19.67
25.83
Market Capitalization: 2,250,000,000 Revised Scores: 53.2
28.02 24.84 19.67
25.83
Shares Outstanding:
176,070,000
Current Market Share Price (11/03/2008) $24.36
Stated Restated Financial Based Valuations Book Value Per Share:
$ 15.03
$ 14.10 Stated
Restated
Return on Equity: 10.60% 6.20% Trailing P/E: $ 9.72
$ 4.70
Return on Assets: 8.10% 4.70% Forward P/E: $ 11.84
$ 6.63
Dividends to Price: $ 17.76
$ 17.76
Price to Book: $ 14.33
$ 13.09
Cost of Capital P.E.G. Ratio $ 28.25
$ 51.81
Estimated
R‐Square
d Beta Ke Upper Bound
Lower Bound Price to EBITA:
$ 14.92 N/A
2 ‐ Year 0.2667 1.0701 0.12586 18.38% 67.80%
Enterprice Value / EBITA:
$ 16.93 N/A
3 ‐ Year 0.3041 1.3871 0.15117 20.70% 9.36%
Price to Free Cash Flows:
$ 37.67
$ 21.69
4 ‐ Year 0.2427 1.24
2 0.140133 19.04% 8.99%
5 ‐ Year 0.2873 1.3369 0.147152 19.03% 10.42% Intrinsic Valuations
6 ‐ Year 0.3859 1.4694 0.157753 19.25% 12.30% Stated
Restated
Discounted Dividends: $ 2.55
$ 2.55
Back Door Ke: 10.03% Free Cash Flows: $ 28.79
$ 23.77
Published Beta: 1.61 Residual Income: $ 13.86
$ 22.35
Cost of Debt: 3.69% Long Run Residual Income: $ 4.10 N/A
WACC (BT): 13.95% Abnormal Earnings Growth:
$ 7.85
$ 7.20
13
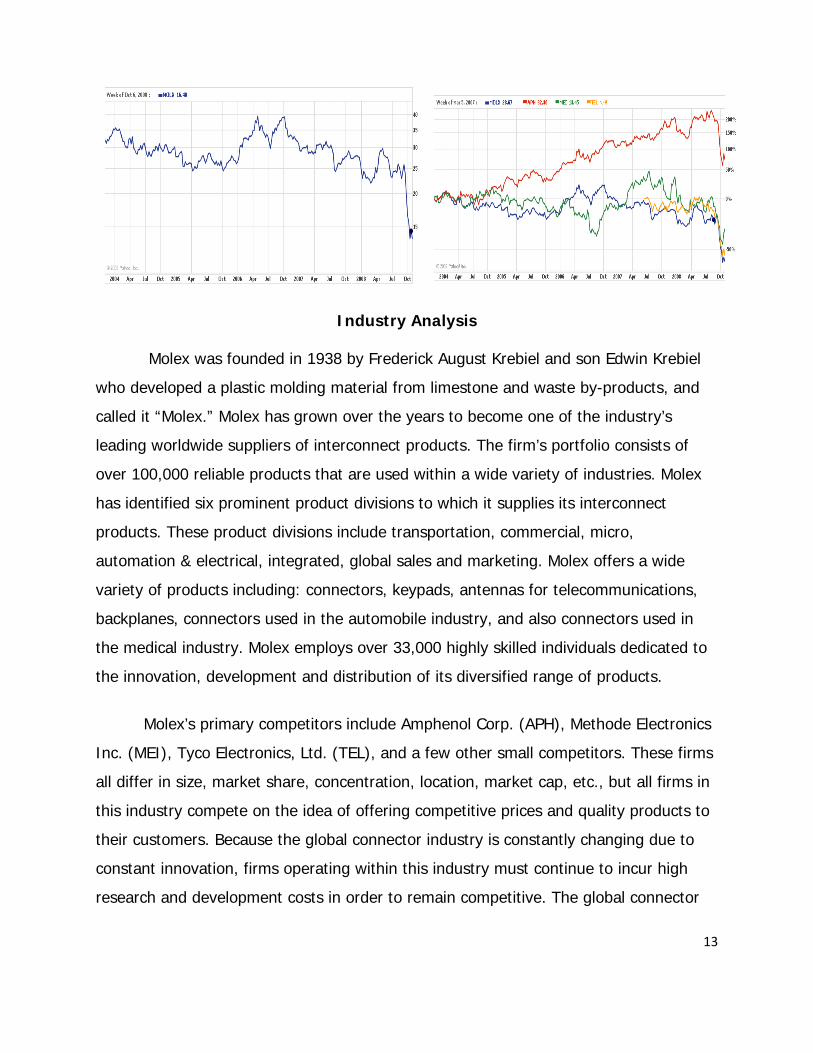
Industry Analysis
Molex was founded in 1938 by Frederick August Krebiel and son Edwin Krebiel
who developed a plastic molding material from limestone and waste by-products, and
called it “Molex.” Molex has grown over the years to become one of the industry’s
leading worldwide suppliers of interconnect products. The firm’s portfolio consists of
over 100,000 reliable products that are used within a wide variety of industries. Molex
has identified six prominent product divisions to which it supplies its interconnect
products. These product divisions include transportation, commercial, micro,
automation & electrical, integrated, global sales and marketing. Molex offers a wide
variety of products including: connectors, keypads, antennas for telecommunications,
backplanes, connectors used in the automobile industry, and also connectors used in
the medical industry. Molex employs over 33,000 highly skilled individuals dedicated to
the innovation, development and distribution of its diversified range of products.
Molex’s primary competitors include Amphenol Corp. (APH), Methode Electronics
Inc. (MEI), Tyco Electronics, Ltd. (TEL), and a few other small competitors. These firms
all differ in size, market share, concentration, location, market cap, etc., but all firms in
this industry compete on the idea of offering competitive prices and quality products to
their customers. Because the global connector industry is constantly changing due to
constant innovation, firms operating within this industry must continue to incur high
research and development costs in order to remain competitive. The global connector
14
industry is so competitive it is difficult for one firm to establish a competitive advantage
over their competitors. The industry is characterized as having high amounts of
differentiation, switching costs, learning economies of scale, barriers to entry and a
mixed concentration of competitors. All of these factors contribute to the high level of
competition experienced in the global connector industry.
The capacities at which some of these companies within the electronic connector
industry are operating make it difficult for a new company entering into the market to
directly compete. New entrants would have to invest a considerable amount of capital
in their first years of operation, most likely forcing them to compete at a cost
disadvantage, compared to that of their competitors. Legal barriers such as patents and
trademarks also serve to deter new entrants from entering the interconnect product
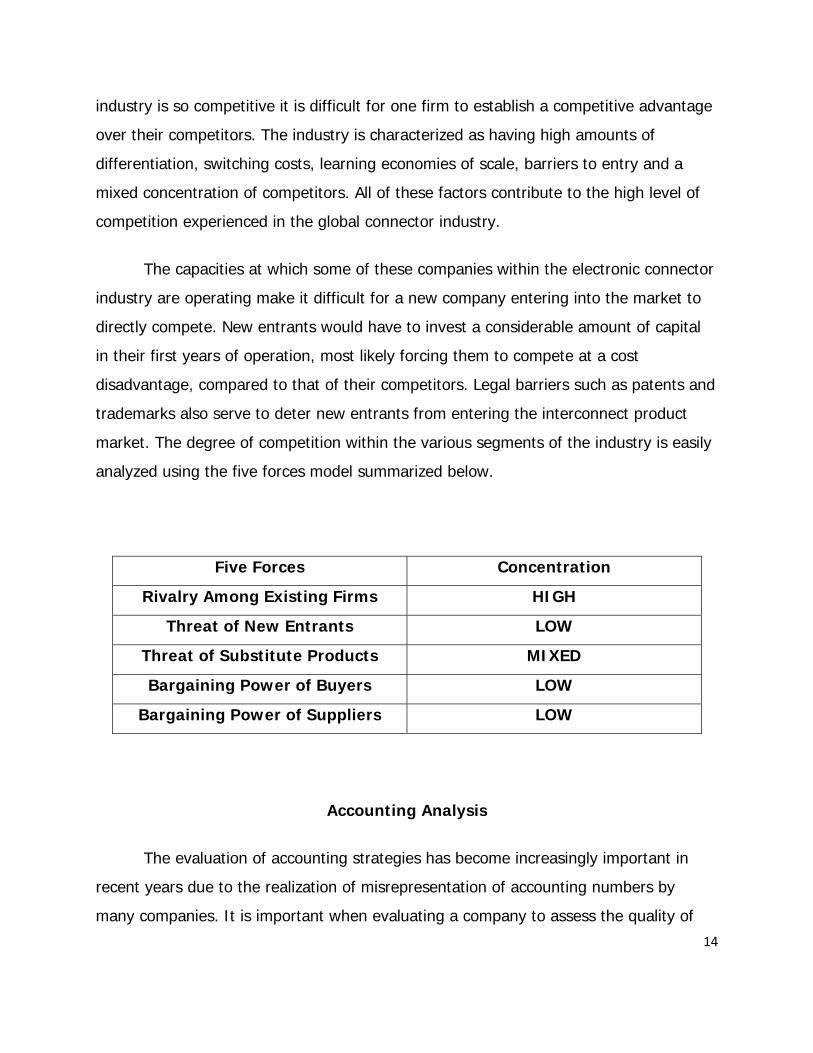
market. The degree of competition within the various segments of the industry is easily
analyzed using the five forces model summarized below.
Five Forces Concentration
Rivalry Among Existing Firms HIGH
Threat of New Entrants LOW
Threat of Substitute Products MIXED
Bargaining Power of Buyers LOW
Bargaining Power of Suppliers LOW
Accounting Analysis
The evaluation of accounting strategies has become increasingly important in
recent years due to the realization of misrepresentation of accounting numbers by
many companies. It is important when evaluating a company to assess the quality of

15
disclosure within their financial statements and annual reports. High disclosure is
characterized by firm’s ability to represent thorough information regarding accounting
numbers, policies, and personal strategies implemented to the public. Low disclosure is
characterized by the hesitance of a company to provide thorough information to the
public, which makes them appear untrustworthy. Low disclosure can be a red flag to
investors, implicating the possibility of distortion within the firm’s financial statements.
The level of disclosure within the interconnector industry is generally high
concerning the disclosure of leases, pensions, goodwill, currency, and research and
development. Research and development continues to be a driving competitive factor
within this growing market, and while the majority of the firms in operation disclosed an
abundant amount of information one in particular chose not to. Molex and its
competitors Amphenol and Methode choose to implement a high level of disclosure in
reporting research and development, while Tyco Electronics chooses to simply
generalize. While comparing retirement benefits throughout the industry we concluded
that Methode had very low disclosure compared to its competitors, revealing limited if
not minimal information concerning its pension plans. On the other hand, the remaining
competitors within the industry disclosed a vast amount of information concerning their
specific pension, post-retirement, and defined contribution plans. The high level of
disclosure demonstrated by Molex is consistent with the levels established by its
competitors within the industry. A high level of disclosure suggests a firm’s willingness
to disclose thorough information regarding its accounting policies and strategies;
therefore implying the company is less likely to distort financial information.
Financial Analysis, Cost of Capital Estimation, and Forecasting
To successfully evaluate a company an analyst must complete a three step
process that includes ratio analysis, the forecasting of financials, and determining the
16
cost of capital of the company. Financial ratios produce easily comparable numbers so
that analysts, investors and creditors seeking information can identify relationships and
trends within the industry. Ratios were developed to measure the liquidity, profitability,
growth and capital structure of firms. The calculation of the liquidity ratios allows
analysts to measure the ability of a firm to meet its short-term financial obligations.
Molex’s current and quick ratio were significantly higher than their competitors, which
suggests a high level of liquidity. Molex demonstrated a low accounts receivable
turnover ratio compared to its competitors which we attributed to inefficiencies in debt
collections. After examining all the liquidity ratios we can see that many of Molex’s
competitors have comparably similar ratios, while some ratios including days supply in
inventory illustrate vast differences between firms. Profitability ratios measure the
ability of a firm to effectively generate revenues and cover expenses. By using sales
and income figures as the denominator in these ratios we can accurately view how
Molex successfully uses cost management to operate the firm. When viewing ratios
such as gross profit margin and operating expense ratio, Molex out performs the
industry average. We attribute this to Molex’s success in sales and gross profit.
However, when observing operating profit margin and net profit margin Molex performs
below the industry average. Our reasoning behind this factor is that Molex might have
significant expenses or poor cost management that overall negatively affects earnings.
When comparing Molex’s asset turnover to the industry we are the only company that is
able to maintain a stable and sound growth over a five year period thus suggesting that
Molex is effective at using assets to generate sales. When comparing Molex’s return on
assets to the rest of the industry, Molex initially appears to have a stable five year
growth, however, after restating Molex’s financials, Molex is below the industry
average. We attribute this drop to Molex acquiring two companies in 2006 and 2007.
The impairment of goodwill associated with the two acquisitions negatively affected
assets and therefore decreased the return on assets on the restatement. Finally, when
examining return on equity the industry trend is downward sloping. However, when
observing Molex we might fall below the industry average but we do not follow the

17
downward sloping trend. In fact Molex is the only company to maintain a steady growth
in the five year period. Overall when using profitability ratios to compare Molex to the
rest of the global connector industry it is obvious that Molex excels in sales and
generating revenue from assets, however, other ratios suggest that there could be
efficiency or cost management problems in the firm. This is an important factor to
consider when investing in Molex. Capital structure ratios are used to explain how a
firm finances their assets. Firms can use debt or equity to fund projects and assets.
Debt comes from loans or bonds while equity is from selling shares of company stock.
Capital structure ratios can measure the firm’s financial leverage, credit worthiness,
ability to make interest payments, and ability to pay off debt holders. A firm that has
little to no equity will have a poor credit rating which means high interest rates. A firm
with lots of equity can make its payments on debt with ease and do so with a low
interest rate. The three capital structure ratios used are debt to equity, times interest
earned, debt service margin.
We also examined growth rates because they can help evaluate if a firm can
maintain its future increasing profits without the need of outside financing or changing
capital structure. The two growth rates used are the sustainable (SGR) and internal
growth rates (IGR). Graphing these two growth rates can help distinguish trends or
irregularities between the firm and the industry.
The next step in our prospective analysis was calculating the cost of capital. In
order to find the appropriate rate for our valuations, we had to find the
weighted average rates of both debt and equity financing. To find the cost of equity, we
first calculated beta from a series regression analysis. After deriving the 4.02% risk
free rate from the St. Louis Federal Reserve, a market risk premium of 8% and our beta
of 1.47, we used CAPM to calculate an initial cost of equity of 15.78%. However, when
computing CAPM it fails to account for the market value of the firm also known as the
“size effect”. Therefore, the appropriate cost of equity for Molex based on our market
value is 17.48%. When comparing our size adjusted cost of equity of 17.48% to our

18
backdoor cost of equity of 10.03%, we feel that the size adjusted cost of equity is a
more accurate representation of our company based on our explanatory power of
38.6% and our market value of 2.26 billion. Next we derived our cost of debt. By
using the three month financial AA grade commercial paper rating for the St. Louis
Federal Reserve, we were able to account for the debt associated with accounts
payable, salaries, bonuses, commissions and other accrued expenses. We then applied
the 10 year treasury yield for risk free rate as the interest rate for income taxes payable
and used the interest rates as stated in the 10-K to account for long term debt and debt
associated with short term loans, pensions and postretirement benefits. With our cost
of debt as 3.69% and our cost of equity of 17.48%, we found our weighted average
cost of capital before tax to be 13.95% as stated and 13.7% restated.
The final step and a key part in the valuation of the company in the financial
analysis is the forecasting of financial statements. The most vital part of the forecasting
is to foresee what net sales growth is going to be because the rest of the forecasting is
linked back to this growth rate. A major item that was taken into consideration is the
recession that the economy is currently in. Due to this we decided to use a negative
growth rate for the first two years and a slow positive growth rate for the third year.
The fourth year, 2012, is the year that we foresee the economy recovering and Molex
with have a stable 15% growth year for the flowing years. When forecasting many of
the entries in the financial statements we used the averages and results that came from
the profitability, liquidity, and capital structure ratios. For example, in the balance sheet
when we forecasted our current liabilities we used our already forecasted current assets
and divided by our current ratio of 2.7 to get the current liabilities for each year. This
method of uses ratios was used in many other lines in order to keep the numbers as
accurate as possible. One thing to keep in mind is that statement of cash flows would
be the least precise. We are certain that our numbers on the income statement and
balance sheet were done with accuracy, but the fact is that the statement of cash flows
is the most challenging for even the most talent analysis to forecast to the point that

19
one major part, the cash flows from financing activities, cannot even be reasonably
assumed. We feel that our forecasted numbers would very beneficial in an investor
that is looking at Molex.
Valuation
To accurately value a firm you must utilize both methods of comparables and
intrinsic methods of valuation. Methods of comparables are a set of eight ratios that
compute an estimated price per share which is then compared to a published stock
price to determine the value of a firm. Information is collected and used to calculate
these ratios for the industry competitors, which is then used in the calculation of the
industry average. The industry average, which excludes the data of Molex, was then
multiplied by a correlating factor to determine the implied price per share. We used a
15% margin of safety when comparing the implied price per share to Molex’s published
November 3, 2008 price of $14.89. If the price implied by the methods was below
$12.66 Molex was considered overvalued, and if the implied price was above $17.19
then it was considered undervalued. The results varied from each method of
comparable which suggests that these ratios offer limited to no reliability. The implied
price per share is dependent on the performance of Molex’s competitors, therefore
making the methods of comparables an inadequate method of valuation.
The intrinsic valuation methods are considered a more reliable form of valuation
compared to the methods of comparables. These models are supported by financial
theories which assure a higher level of explanatory power. The firm’s performance is
estimated by forecasting the financial statements of a firm. The financial statements
are forecasted to predict company performance, then discounted back into present day
values. The intrinsic valuation method consists of five models which include: discounted
dividends, discounted free cash flows, residual income, abnormal earnings growth , and
long-run residual income. Dividends are the most difficult item on the financials to
forecast, therefore the discounted dividends model yields the least amount of
20
explanatory power. Dividends are sensitive to growth rates, even the smallest changes
in growth dramatically affect the time consistent price based on the model. The
discounted free cash flows model is considered unreliable based on the inability to
accurately forecast future cash flows of a firm. As with the discounted dividend model,
the discounted free cash flow model is sensitive to increasing growth rates which
causes its prices to vary significantly. Molex’s estimated share price using WACCBT of
13.7% and a 0% growth rate produced a share price of $21.35, which assumes Molex
is undervalued. The residual income model can be considered a reliable factor when
valuing a firm because it offers one of the highest explanatory powers. This model
yielded an estimated price of $13.68 implying Molex is overvalued. The abnormal
earnings growth model directly correlates with the residual income model in that if you
subtract A.E.G. of any given year by residual income in that same year it should equal
zero. This implies that A.E.G offers the same amount of explanatory power as the
residual income model. A.E.G. produced an estimated share price of $9.33 which
suggests that Molex is considerably overvalued. The last intrinsic value model is the
long-run residual income model which is very solid is the direction of the company
being overvalued. The model has a good explanatory power which helps in the valuing
process. After conducting the various valuation models we consider Molex to be
overvalued.

21
Business and Industry Analysis
Company Overview
Molex was founded in 1938 by Frederick August Krebiel and son Edwin Krebiel
who developed a plastic molding material from limestone and waste by-products, and
called it “Molex.” They began using the Molex plastic material to make a variety of
products, including flower pots, toys, salt dispensers, clock cases, and insulators.
“Molex is the second-largest manufacturer of electronic connectors worldwide in terms
of revenue.” “Net revenue was $3.3 billion for fiscal 2008.” “Molex is a leading supplier
of connector products, with their core business being the manufacture and sale of over
100,000 different electronic components” (Molex 10-K). Molex is a top supplier of
connector components to telecommunications, computer, consumer, automotive and
industrial electronics markets. They offer a wide variety of products including:
connectors, keypads, antennas for telecommunications, backplanes, connectors used in
the automobile industry, and also connectors used in the medical industry. “Molex’s
products are essential to a large number of original equipment manufacturers
throughout the world.” “Molex’s headquarter is located in Lisle, Illinois with operating
locations in 17 different countries.” (Molex.com)
The company’s telecommunications division offers many products for mobile
phones and devices, networking equipment, and switches and transmission equipment.
Some of their products include high speed optical signal lines, backplane connectors,
keyboards, and antennas. These products are mainly produced for the mobile phone
industry. Molex also manufactures connectors for home and portable audio, CD and
DVD players, as well as plasma and LCD televisions. In addition to all of these
products, “they offer manufacturing services to integrate specific components into a
customer’s product” (Molex 10-K).
22
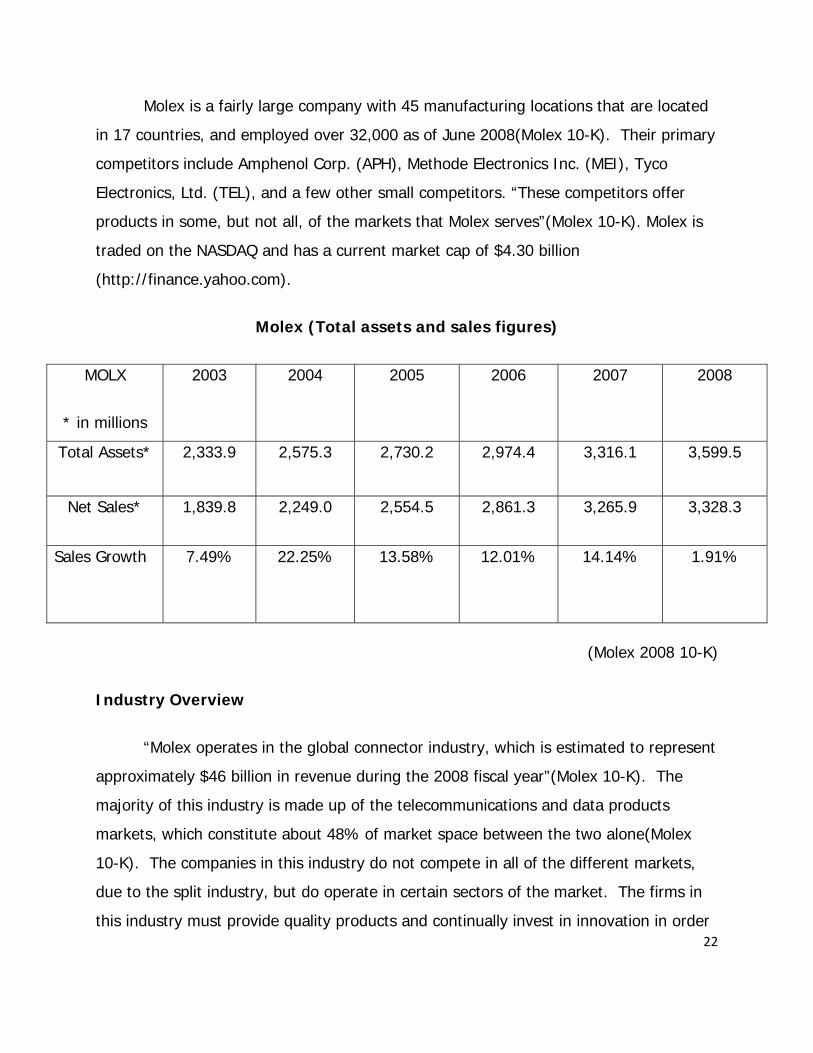
Molex is a fairly large company with 45 manufacturing locations that are located
in 17 countries, and employed over 32,000 as of June 2008(Molex 10-K). Their primary
competitors include Amphenol Corp. (APH), Methode Electronics Inc. (MEI), Tyco
Electronics, Ltd. (TEL), and a few other small competitors. “These competitors offer
products in some, but not all, of the markets that Molex serves”(Molex 10-K). Molex is
traded on the NASDAQ and has a current market cap of $4.30 billion
(http://finance.yahoo.com).
Molex (Total assets and sales figures)
MOLX
* in millions
2003 2004 2005 2006 2007 2008
Total Assets* 2,333.9 2,575.3 2,730.2 2,974.4 3,316.1 3,599.5
Net Sales* 1,839.8 2,249.0 2,554.5 2,861.3 3,265.9 3,328.3
Sales Growth 7.49% 22.25% 13.58% 12.01% 14.14%
1.91%
(Molex 2008 10-K)
Industry Overview
“Molex operates in the global connector industry, which is estimated to represent
approximately $46 billion in revenue during the 2008 fiscal year”(Molex 10-K). The
majority of this industry is made up of the telecommunications and data products
markets, which constitute about 48% of market space between the two alone(Molex
10-K). The companies in this industry do not compete in all of the different markets,
due to the split industry, but do operate in certain sectors of the market. The firms in
this industry must provide quality products and continually invest in innovation in order
23
for them to continually gain market share. The firms competing for market share in this
industry include Amphenol Corporation, Tyco Electronics, Ltd., Methode Electronics Inc.,
and many other small and large firms(Molex 10-K). These firms all differ in size, market
share, concentration, location, market cap, etc., but the one thing that all firms in this
industry compete on is the idea of offering competitive pricing and quality products to
their customers.
These companies must incur high research and development cost, in order to
compete in this very innovative industry. “We must continue to make investments in
research and development in order to continue to develop new products, enhance
existing products and achieve market acceptance for such products”(Molex 10-K).
In an industry where connectors and electronic devices are continually getting smaller
and smaller, and more technologically advanced, it is vital for a company in this market
to invest substantial amounts of revenue in research and development. Molex exceeds
the global connector industry average in terms of research and development expenses,
“Incurring costs of $164 million in 2008, and $159 million in 2007”; which is a lot higher
than the industry average of research and development costs(Molex 10-K).
Manufacturing costs within the connector industry are relatively high, but
companies are well compensated by the large amounts of profits that are received. The
industry, as a whole, has seen substantial amounts of growth during the last five-six
years due to the increasing demand throughout the telecommunications and data
markets. Most of the companies in this industry manufacture around 100,000 different
products, so the firms tend to differ in size, sales, total assets, etc. The four firms listed
below (shown with their net sales figures and total assets) are four of the main
competitors in the global connector industry.
24
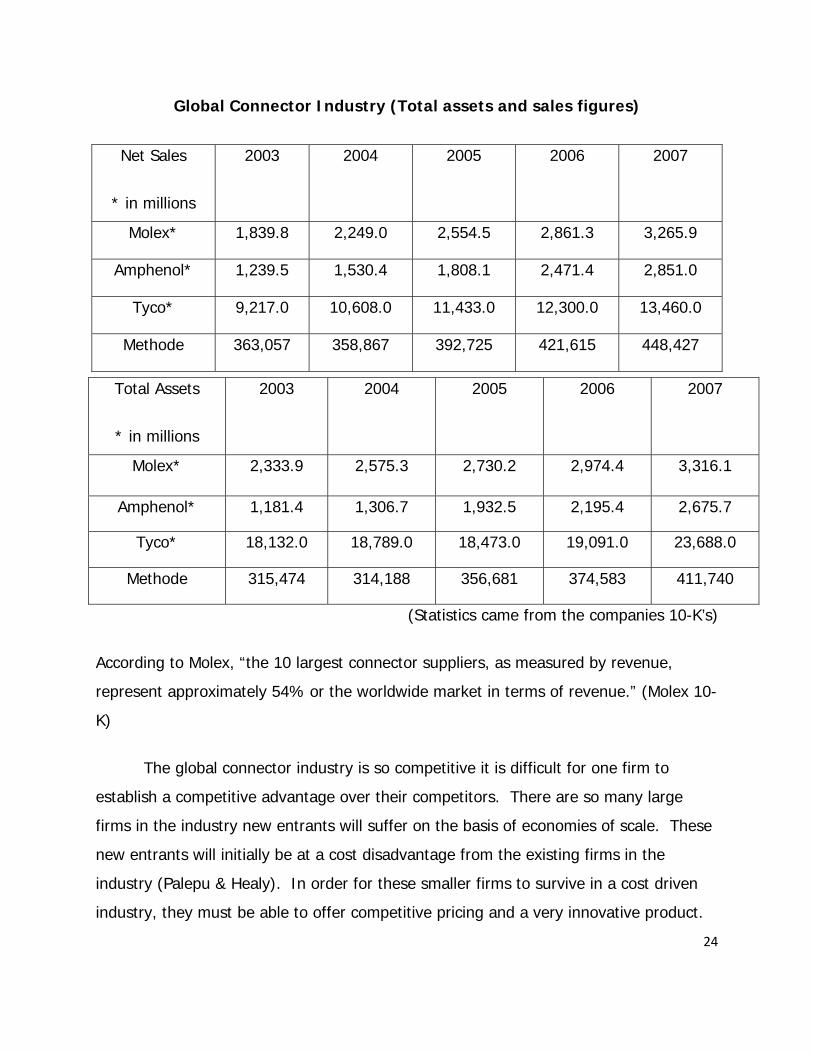
Global Connector Industry (Total assets and sales figures)
(Statistics came from the companies 10-K’s)
According to Molex, “the 10 largest connector suppliers, as measured by revenue,
represent approximately 54% or the worldwide market in terms of revenue.” (Molex 10-
K)
The global connector industry is so competitive it is difficult for one firm to
establish a competitive advantage over their competitors. There are so many large
firms in the industry new entrants will suffer on the basis of economies of scale. These
new entrants will initially be at a cost disadvantage from the existing firms in the
industry (Palepu & Healy). In order for these smaller firms to survive in a cost driven
industry, they must be able to offer competitive pricing and a very innovative product.
Net Sales
* in millions
2003 2004 2005 2006 2007
Molex* 1,839.8 2,249.0 2,554.5 2,861.3 3,265.9
Amphenol* 1,239.5 1,530.4 1,808.1 2,471.4 2,851.0
Tyco* 9,217.0 10,608.0 11,433.0 12,300.0 13,460.0
Methode 363,057 358,867 392,725 421,615 448,427
Total Assets
* in millions
2003 2004 2005 2006 2007
Molex* 2,333.9 2,575.3 2,730.2 2,974.4 3,316.1
Amphenol* 1,181.4 1,306.7 1,932.5 2,195.4 2,675.7
Tyco* 18,132.0 18,789.0 18,473.0 19,091.0 23,688.0
Methode 315,474 314,188 356,681 374,583 411,740

25
Lately, some of the firms in the industry have downsized their operations due to
the recent decline in the stock market. This has mainly been seen in the automotive
side of their operations because of the recent incline in gas prices. Tyco Electronics
stated, “That they plan to close three plants and consolidate production of its
automotive products in Europe…”. “They plan to take charges of $115 million in an
effort to streamline its portfolio and reallocate resources to core operations”
(online.wsj.com). Overall, the connector industry, as a whole, is experiencing nominal
growth rates and will continue to grow as long as we remain a technology based
economy.
Five Forces Model
When analyzing an industry it is important to thoroughly understand what issues
drive and power a business. In order to do so, you must be able to identify key success
factors that create value for the company. The five forces model is an analysis of how
five competitive factors can determine a company’s profitability and a firm’s success in
an industry. It is important to understand how these factors influence competition and
what issues can make or break a business. Porter’s five forces focus on rivalry amongst
existing firms, threat of new entrants, threat of substitute products, bargaining power
of buyers, and bargaining power of suppliers. The following is a table that reflects how
each force influences profitability and competition in our industry. We will discuss how
firms handle the five forces and how they successfully compete in the global connector
industry.
Five Forces Concentration
Rivalry Among Existing Firms HIGH
Threat of New Entrants LOW
Threat of Substitute Products MIXED

26
Bargaining Power of Buyers LOW
Bargaining Power of Suppliers LOW
Rivalry Among Existing Firms
When observing a particular industry you need to be able to evaluate the level of
competition that exists between operating firms. The level of competition within an
industry determines different strategies implemented by firms. If firms decide to
implement an aggressive pricing strategy they choose to push prices closer to marginal
cost. Another strategy is the coordination between competitors to compete with similar
prices, or in non-price dimensions. The technology industry is forever growing and
expanding, and as a result the firms operating in the production of electronic
connectors are forced to compete at a very high level. A number of factors including,
industry growth rate, concentration, differentiation, switching costs, scale economies,
learning economies, excess capacity and exit barriers are considered when determining
the level of competition within a particular industry.
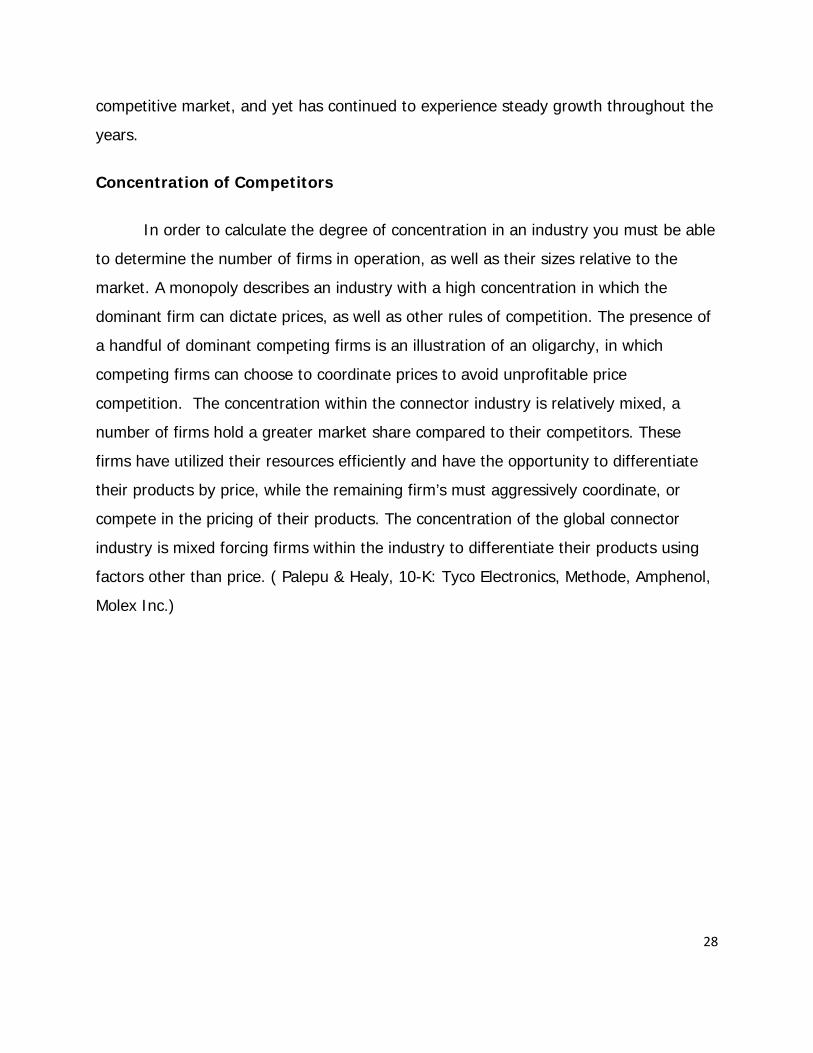
Industry Growth

27
In an industry like the one of electronic connectors, that is constantly innovating
and changing, it’s important to take into account the growth experienced by the
diversified electronics industry as a whole. Each of the companies operating within this
industry has experienced rapid growth as more and more of their products are needed
to operate both commercial and specialty items demanded by their customers (Refer to
graph above). This growth in the industry has lead to an increase in the functionality of
electrical connectors in products ranging from mobile phones to robotics. In terms of
industry growth, it’s not a priority of individual firms to concentrate on capturing a
greater percentage of market shares when the industry is growing constantly. But, price
wars will develop in an industry when it becomes sluggish, because competing with
other firms in the industry on price is the only way for the company to grow. A good
implication of growth is the comparison and calculation of percentage change in sales of
major firms operating within the industry. Commonly high percentage growth in the
industry suggests low competition, while low percentage suggests high competition.
This particular industry is an exception to this regularity in that it operates in a highly
00.020.040.060.080.10.120.140.160.18
2003 2004 2005 2006 2007
Industry Sales Growth
Industry Sales Growth
28
competitive market, and yet has continued to experience steady growth throughout the
years.
Concentration of Competitors
In order to calculate the degree of concentration in an industry you must be able
to determine the number of firms in operation, as well as their sizes relative to the
market. A monopoly describes an industry with a high concentration in which the
dominant firm can dictate prices, as well as other rules of competition. The presence of
a handful of dominant competing firms is an illustration of an oligarchy, in which
competing firms can choose to coordinate prices to avoid unprofitable price
competition. The concentration within the connector industry is relatively mixed, a
number of firms hold a greater market share compared to their competitors. These
firms have utilized their resources efficiently and have the opportunity to differentiate
their products by price, while the remaining firm’s must aggressively coordinate, or
compete in the pricing of their products. The concentration of the global connector
industry is mixed forcing firms within the industry to differentiate their products using
factors other than price. ( Palepu & Healy, 10-K: Tyco Electronics, Methode, Amphenol,
Molex Inc.)
29
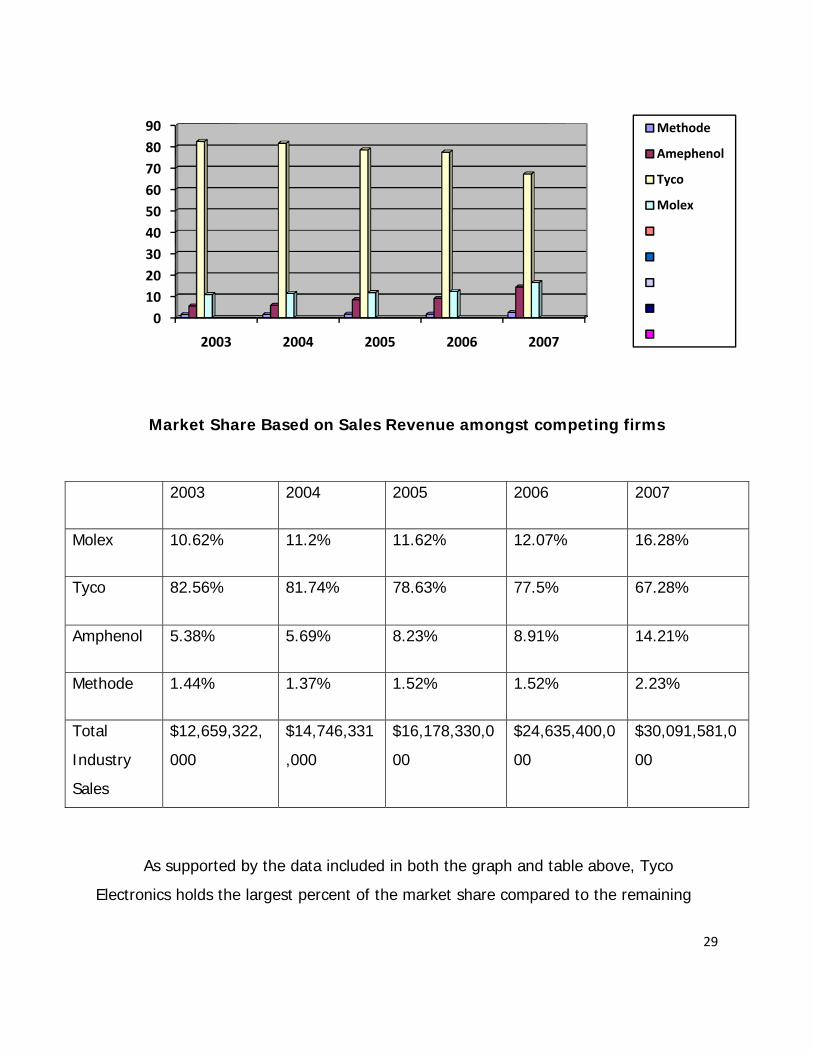
Market Share Based on Sales Revenue amongst competing firms
As supported by the data included in both the graph and table above, Tyco
Electronics holds the largest percent of the market share compared to the remaining
0102030405060708090
2003 2004 2005 2006 2007
Methode
Amephenol
Tyco
Molex
2003 2004 2005 2006 2007
Molex 10.62% 11.2% 11.62% 12.07% 16.28%
Tyco 82.56% 81.74% 78.63% 77.5% 67.28%
Amphenol 5.38% 5.69% 8.23% 8.91% 14.21%
Methode 1.44% 1.37% 1.52% 1.52% 2.23%
Total
Industry
Sales
$12,659,322,
000
$14,746,331
,000
$16,178,330,0
00
$24,635,400,0
00
$30,091,581,0
00
30
firms operating within its industry. Although the remaining firms’ market shares are
minuscule in comparison to Tyco Electronics, each firm’s market share has been slowing
growing each year while Tyco Electronics has experienced decreases.
Differentiation
The attempt made by firms competing in highly competitive markets to set their
products apart from their competitors is referred to as differentiation. It is vital for firms
to differentiate their products as well as other business strategies in order to
accommodate the ever changing needs of consumers. Differentiation can be a detail as
insignificant as color or shape, but can help a product to appear unique when compared
to the products of a competitor. Limited opportunities to differentiate a product’s
physical attributes results in a firm’s focus on aspects such as customer service, brand
recognition, and quality. Firms competing in the global connector industry have
unlimited opportunities to differentiate their products. They are constantly innovating
and redesigning their products to appeal to the industry’s changing consumer. Firms
within the industry also make a valid effort to differentiate and improve the services
offered to their consumers. Differentiation of products within the market remains the
driving factor of success in the global connector industry (10-K : Molex Inc., Tyco
Electronics).
Switching Costs
The commitment firms have to their specific industry depends on the costs
associated with switching the labor of their resources into another market. There are
many risks a firm has to take into account with considering switching into a different
industry including: exit fees, search costs, and equipment costs. Although firms
producing global connectors operate within many diverse markets, the cost of
completely exiting the market and entering into a different industry would be very high.
Their manufacturing process consists of automated machines producing high numbers
31
of complex connectors; it would be difficult for the firms to use their pre-existing
resources for another type of production other than electronic connectors. Because of
the difficulty firms would face in trying to use their resources in another industry, we
would classify the industry as having high switching costs. (Wikipedia, 10-K: Molex Inc)
Economies of Scale
As the number of goods increases in production so must the efficiency as stated
in economies of scale. Larger companies that continue to reduce price per unit as
output increases, are able to use their resources to compete on a larger geographical
scale. Smaller firms are limited in their ability to grow and sometimes encounter
increases in production costs as output is also increased. Electronic connector firms
operate in many different markets, and own production facilities in numerous countries.

32
The amount of capital and resources at their disposal enables the firms to
compete at the level they do. To compete within the connector industry you must own
many production facilities, operate in a number of markets and generate considerable
revenues to own a large percentage of the total market share. Measuring and
comparing the total property, plant, and equipment owned and operated by firms
competing in the industry is a valuable way to support or disprove the assumption given
in the theory of economy of scales. Refer to the table above, most of the firms
competing in the global connector industry are able to achieve economies of scale due
to their individual size and total current assets. (investopedia.com, Answers.com,
molex.com, tycoelectronics.com)
Learning Economies
Firms operating within this industry spend a large percentage of yearly revenues
on the research and development of new products. By continuing to invest in research
and development these firms are serving as a catalyst in the development of new
products, as well as the improvement of products in existence. Because these firms
operate in an industry that is constantly changing and developing it’s paramount to
their existence to acquire highly innovative and intelligent personnel. Firms operating in
Total Assets 2003 2004 2005 2006 2007
Molex 2,333,854 2,575,286 2,730,162 2,974,420 3,316,108
Amphenol 1,181,384 1,306,711 1,932,540 2,195,397 2,675,733
Tyco 18,132,000 18,789,000 18,473,000 19,091,000 23,688,000
Methode 315,474 314,188 356,681 374,583 411,740
Total Assets:
Industry
21,962,712
22,985,185
23,492,383
24,635,400
30,091,581
33
the electronic connector industry continue to be very competitive in their search for
qualified engineers and technicians.
Exit Barriers
Exit Barriers refer to the consequences a company accepts when deciding to exit
the industry. Some important exit barriers to consider are the investment of specialized
equipment, specialized skills, and high fixed costs. If the company has a large amount
of asset worth in specialized equipment it faces a difficult exit barrier because the
equipment is not easily transferrable between markets. Property, plant and equipment
are considered assets of the company but they are not easily transferred into a liquid
asset such as cash or marketable securities, thus it will be harder for a company to
dispose of these assets without considerable time and effort. Skills that are exclusive to
your industry are also another asset that is difficult to transfer between markets, the
costs of retraining can be extremely costly in both time and money. Contracts entered
into by companies also serve as barriers to exit, in that they are obligated to perform
the said duties presented in contracts. In the global connector industry has high exit
barriers because its equipment and skills are highly specialized, making it difficult for
them to exit the industry without incurring significant costs. (10-k: Molex Inc.,
www.agmrc.org, Palepu & Healy)
Conclusion
The global connector industry is highly competitive as a result of its industry
growth rate, concentration of competitors, level of differentiation, switching costs, exit
barriers, economies and learning economies of scale. The industry continues to
experience steady growth year after year as a result of our innovative nature which
allows unlimited opportunities for growth within the industry. The concentration of
competitors within the industry is mixed, forcing firms with lower market share to
differentiate their products using factors other than price, like customer service, and
34
quality. Differentiation within the industry remains high, and important to the success of
any firm operating in the global connector market. Switching costs are high making it
difficult for existing firms to use their current resources in alternate industries. High
level of learning economies of scale force firms to compete aggressively when recruiting
personnel within the industry. High barriers to exit will force companies to remain and
compete within the market. All of these factors contribute to the high level of
competition experienced in the global connector industry.
Threat of New Entry
Firms operating within certain industries fear the threat of new entrants, and
new entrants and new products that may make their existing products obsolete. The
technology industry is constantly changing, forcing companies to constantly innovate
their products. The capacity at which some of these companies within the electronic
connector industry are operating make it difficult for a new company entering into the
market to directly compete. Factors such as, economies of scale, first mover advantage,
distribution access, relationships, and legal barriers act as deterrents to new entrants in
the electronic connector industry.
Economies of Scale
The size and resources of a company continue to be a significant barrier to entry
in the global connector industry. Firms operating within the connector industry have
large amounts of capital invested in property, plant & equipment as well as research
and development. Both of these assets are very important to the success of such

35
companies that supply their products to a number of industries and countries around
the world. Each company reports the reinvestment of at least 5% of their revenues
back into the company in the form of research and development. If a new firm were to
try to enter into the industry they would have to invest a large sum in both of these
areas to be able to compete on the same level as the companies in existence. The
graph below further illustrates the average assets available in the global connector
industry, without significant capital or property, plant and equipment a new entrant
would fail to successfully penetrate the market. New entrants would have to invest a
considerable amount of capital in their first years of operation, most likely forcing them
to compete at a cost disadvantage, compared to that of their competitors.
0
5000000
10000000
15000000
20000000
25000000
30000000
35000000
2003 2004 2005 2006 2007
Total Assets : Industry
Total Assets : Industry
36
First Mover Advantage
Early entrants into the industry can experience a number of advantages not
available to those entering at a later time. The earliest entrants have the opportunity to
develop relationships with suppliers, as well as the possibility of developing the
standards of the industry they operate in. Information reflected in many of the firms’
10-Ks has indicated that each individual firm chooses to purchase the raw materials
needed for their products from a limited number of suppliers in order to take advantage
of competitive pricing. The firms operating within the industry have recognized that the
raw materials that they use in the production of global connectors have continued in to
increase in price; therefore they remain faithful to a smaller pool of suppliers in order to
receive the best price. The relationships developed between supplier and firm can lead
to exclusive contracts in which the companies in agreement only deal with one another,
this can be disheartening to those firms entering the industry at a later time. The
opportunity for a firm to develop the industry standards is an incredible advantage to
those early entrants. This insures that all entrants from now on have to adhere to the
standards and regulations exemplified by these early entrants. Pre-existing firms within
the connector industry have been in existence as early as 1932, most starting out
producing simple products and growing throughout the years into intercontinental
production powerhouses. A company trying to enter into the electronic connector
industry would lack the experience, knowledge, and understanding already maintained
by firms in operation.
Legal Barriers
In a research intensive industry, like that of electronic connectors, legal barriers
such as patents, copyrights, contracts, and regulations limit the number of firms able to
enter. Many, if not all of the firms producing electronic connectors have patents on a
majority of their products, making it hard for new entrants to start production without
extensive research of existing patents held by competitors. Molex, one of the industry

37
competitors claims in its most recent annual 10-K to have received over 539 patents for
its products. While some firms like Tyco and Amphenol believe that the number of
patents it has doesn’t affect its overall competitive position, others like Methode believe
that its ability to compete within its industry depends on its ability to maintain the
propriety nature of their technology. The accumulation of patents a company considers
valued assets can serve as a major deterrent to firms trying to enter into the industry
because they would have to spend a large amount of time researching the competitor’s
products as not to infringe any legitimate patents. The firms operating within the
connector industry own production facilities around the globe, and as a result must
comply with regulations enforced by the different governments. Due to the recent focus
on environmental consciousness the European Union has enforced new regulations
involving environmental and equipment disposal within the connector industry. This
specific government has imposed RoHS, which stands for the “restriction of the use of
certain hazardous substances in electrical and electronic equipment”. This regulation
prohibits the production and selling of new electrical and electronic equipment
containing more than agreed levels of lead, cadmium, mercury, hexavalent chromium,
polybrominated biphenyl (PBB) and polybrominated diphenyl ether (PBDE) flame
retardants. New entrants considering opening production facilities must take into
account these newly enacted regulations. Barriers to entry for firms considering
entering a particular market in the future are very high due to the many patents in
effect, and the addition of environmental regulations.
Conclusion
Threat of new entrants into the electronic connector industry remains low. The
industry is constantly innovating and expanding across the globe and has made it
necessary for companies to have high amounts of capital, and revenues invested in
tangible assets as well as research and development. Existing companies can also utilize
the first mover advantage, by using their knowledge of the business, and recognition of
the industry standards. Firms wanting to enter into the connector industry must also

38
consider the many patents held by companies in existence. These potential new
entrants must also take into account the regulations regarding production within the
industry. These factors make it difficult for new entrants to compete or succeed in the
global connector industry without proper funding and planning.
Threat of Substitute Products
“The threat of substitute products depends on the price and performance of
competing products, as well as the customers’ willingness to substitute the product.”
(Palepu & Healy) Some of the firms in the industry do not supply the same products as
their competitors, but the industry as a whole, provides the same main product line
from company-to-company. Firms in the connector industry produce a lot of products
that can fairly easily be substituted by their competitors. So firms have lower bargaining
power and more incentive to offer competitive pricing among the existing firms in the
industry. But, since part of the industry deals with a lot of technology based products,
there is room for companies to compete on the basis of innovation and technology
advances throughout the market place. The threat of substitute products in the global
connector industry leads to competitive pricing and products for the consumer to
choose from.
Relative Price and Performance
One key factor associated with the threat of substitute products is the
competitors’ relative price and performance. “The threat of substitutes depends on the
relative price and performance of the competing products or services and on customers’
willingness to substitute.” (Palepu & Healy) “In an industry where there is low product

39
differentiation between suppliers, the buyer tends to have a relative high bargaining
power, leading to a high level of price competition among firms.”
The increasing competition among firms in the global connector industry is
constantly leading firms to create new innovative products. Our economy is continually
moving towards a more technology based world, and firms in the connector industry
are going to have to capitalize on this in order to succeed. Since firms are spending
around five percent of total revenue on R&D, prices are going to tend to move upward,
which in turn is going to lead to more product differentiation among firms in the
connector industry. The firms who decide to produce these more sophisticated products
will, in turn, separate themselves from their competitors. This will give the more
innovative companies an incentive to continually develop more profitable products.
These more advanced products are going to be used to substitute the cheaper
products, on the basis of quality and performance, but will not compete on price. Firms
in the industry must rely on their products to perform at a level higher than the overall
industry standard in order to succeed.
Customers’ Willingness to Switch
Another factor that deals with the threat of substitute products is the customers’
willingness to switch products. A small price difference in a product can create a
customers’ willingness to switch to a different product. So very competitive pricing is
needed in an industry where there is an absence of high switching costs. Brand loyalty
is also a factor than can lead a customer to switching to a more effective product.
The connector industry is an industry which experiences rapid change and
improvements on products as well as innovation. This makes firms stay up to date on
40
the latest technological improvements and advancements, and also have the latest, and
fastest products. In an industry where a customer has an incentive to do some research
on products and find out which firm produces the best, there are going to be some
moderate switching costs. Due to the fact, that it is very timely and costly to perform
this kind of research on so many companies and their products. Companies’ in this
industry want to create strong relationships with customers’ in order to build a powerful
brand image, and gain the “brand loyalty” that every firm seeks.
Conclusion
In an industry where there is a moderate amount of substitute products, firms
must compete on the basis of competitive pricing and quality products, in order to
create value for their customers’. In an industry where firms are spending adequate
amounts of their revenue on R&D the customer has a smaller a smaller incentive to look
around for substitute products. So overall, the threat of substitute products in the
industry is moderate.
Bargaining Power of Customers
In the competitive industry of electronic connectors competition is everywhere.
The largest customer’s in the industry are mega companies such as: Dell, Cisco, Ford,
GM, IBM, Motorola and Nokia. There are thousands of other companies who use
electrical connectors in their products. Electrical connectors are in almost every
electronic device in the World. Connectors are in high demand, but do the customers or
suppliers have the majority of bargaining power?
41
Switching Cost
The switching cost for customers depends on the connector they are using.
Some companies use generic, off-the-shelf connectors which require low switching
costs. Other companies have custom connectors made specifically for their products.
The custom-made connectors have to be designed to fit their manufacturing process.
To switch from one custom connector to another could cause the manufacturing
process to be reformatted thus increasing the cost of switching. With the use of the
internet manufactures can search for new products by the millions. Using a Google
search engine with the key word search of “electronic connectors” over 992,000 web
sites appear. Almost every large connector company has online catalogs that allow
manufactures to research products and compare prices. The convenience of this online
shopping saves time and money due to increased efficiency of switching products with
a push of a button.
Differentiation
Many connectors provide the same function as each other but there are multiple
factors that differentiate them for the others. The differences may be in size, wattage,
frequency, material, durability, and application. The customers have a wide range of
products to choose from. Many connectors are specifically made so that only like
connectors can be used and a competing brand cannot be substituted.
Importance of Product for Cost and quality
Electronic connectors are an inexpensive input into the final product. Due to
small fraction of cost to the end product, customers will not spend much effort
shopping for the lowest possible price. Large manufactures pay close attention to prices
especially when they are having financial troubles. According to the Wall Street Journal,
Dell Computers is cutting cost everywhere it can to save money and to increase profits.
Dell Computers puts pressure on their suppliers which includes the connector

42
companies to lower prices. A threat of switching suppliers can be enough to influence
the electronic connector supplier to lower their cost (Scheck, A1).
The quality of the electronic connector is essential for the final product. If a
connector is of poor quality it can cause the final product to malfunction. A faulty
connector in a line of computers can cause a malfunction creating a partial or full loss
of ability. Many repairs to replace a faulty connector require costly disassembly and
remanufacturing.
Number of Customers
The lists of customers are enormous. As mentioned before there are connectors
in almost every electronic device in the world. High competition between customers is
very common. The computer and telecommunication industry uses large amounts of
connectors compared the consumer product industry. A computer can have hundreds of
connectors when a washing machine may only have three or four. According to
(electronic-oems.com) they have over 1,526 electronic manufactures listed in their
index. There are thousands more that are unlisted that also use connectors in their
manufacturing processes.
Volume of Customers
Customers usually buy connectors in bulk orders with little lead time. The orders
of connectors could be in the million unit range or more. Long term contracts for
connectors are uncommon because of the rapid technology changes and the ever
changing trends in the electronics industry. Selling connectors in large orders creates
economies of scale because the costs are divided between millions of products lowering
manufacturing cost and transportation cost per unit. Customers tend to stock up
components before holidays such as Christmas to meet dramatically increased
demands.
43
Conclusion
Customers of electronic connectors can be classified as less price sensitive due
to differentiated connectors, the high switching cost due to reformatting the
manufacturing process, and the small cost of the connector to the final product.
Customers do not spend large amounts of efforts trying to shop for the lowest cost
connectors. Backwards integration is not a likely threat to the industry because the
connector industry is highly diversified. Owning your suppliers creates more risk and
would increase losses if the industry takes a downturn.
The customers do not hold as much price setting power as suppliers but they do
hold the power of demand. The customers create a large demand with their final
products such as HD TV’s or new cell phones causing the connector industry to
compete with innovated new products and low prices to influence customers to use
their products by the millions.
Bargaining Power of Suppliers
When suppliers have little competition and few substitutes they can become very
powerful. The materials sold by suppliers to make electronic connectors are palladium
salts, plastic resins, copper alloys, gold, and components. The price and availability of
these products play a critical role in the connector industry. Most of these commodities
have very few substitutes and a high level of competition.
Switching Cost
The switching cost for the connector industry to switch suppliers is very low due
to the large number of suppliers available. When switching from one brand of high
grade copper to another, it will not change anything within the manufacturing process
or end products; unless the copper comes in bars instead of wire spools or is of a lower

44
quality. Often manufactures order supplies from multiple suppliers because their orders
are two large to be filled by just one. Overall, switching suppliers is easy and very low
cost.
Differentiation
The undifferentiated products supplied by supplier’s causes them to lose some
power over the connector industry. High grade copper alloy from one supplier will be
physically identical to another’s. To distinguish a competitive advantage over other
copper suppliers the company may have great customer service, large inventories, and
fast delivery to satisfy the need of a large connector company. In overall product there
is no differentiation.
Importance of product for Cost and Quality
The cost of the raw supplies is the number one determining factor as to what
the connector industry will charge for their products. Many of the commodities listed
previously have volatile prices. For example, oil is the main ingredient for plastic, and as
the supply and price of oil fluctuates so does the price of plastic (How plastics are
made, 1). According to the Wall Street Journal light crude oil prices have increased27%
from September 12, 2007 to September 12, 2008 (Reuters, 1). If a commodity is in
short supply and high demand prices will skyrocket creating profit losses in the
connector industry. The quality of the product supplied will be very close if not
undistinguishable. Plastic resins may have slight chemical differences form one supplier
to another but the overall products are almost identical.
Number of Suppliers
There are thousands of suppliers in the global market for the connector industry.
Most of these suppliers provide their products to many various other industries not just
for connectors. Just a few examples of how raw copper can be used is to make pipe,

45
kitchen ware, or electronic connectors. According to (Copper.org) in the United States
there are more than 80 raw copper suppliers. Copper suppliers can be found
throughout the world not just the United States. The high level of competition among
suppliers will help keep prices down.
Volume of Suppliers
Suppliers sell in bulk orders to the connector industry. The commodities sold
have long shelf lives allowing the buyers to buy before anticipated price increases and
not having to worry about their inventories becoming obsolete. Commodities may be in
short demand and could even increase the value of a connector company’s inventory;
also the exact opposite could happen creating a loss in the value of inventory.
Conclusion
Suppliers are very price sensitive due to undifferentiated products and low
switching cost. Due to this price sensitive condition the connector industry will shop
around for the lowest cost product available. The lower they buy the commodities
needed the higher profits they will make. When commodity prices fluctuate the market
determines the price, the supplier then adds their cost of overhead, labor, and a small
spread of profit to determine the price for the buyers in the connector industry.
Customer and Supplier Bargaining Power Conclusion
Customer and supplier power over the connector industry does not produce a
clear cut winner. The huge customers like Dell, and IBM have a great amount of power
over demand and specifications of the products. The suppliers seem determine prices
due to the fluctuations in the commodities they sell. The connector industry is
comprised of customers and suppliers where no one force dominates over the other.
Both suppliers and customers do their part to set price and supply a demand.
46
Analysis of Key Success Factors for Value Creation in the Industry
Identifying and analyzing the key success factors of a firm’s given industry is vital
in determining a firm’s future profitability, industry standing, and best competitive
strategy. The most prominent and practiced of strategies are cost leadership and
differentiation. The cost leadership strategy attempts to gain a competitive advantage
primarily by reducing its economic costs below its competitors. For example, tight cost
controls, global sourcing, economies of scale and scope, and a simpler product design
that reduces manufacturing costs. The differentiation strategy seeks individuality within
an industry. Firms that compete applying the differentiation strategy use three
guidelines to be successful. First firms must define characteristics of a product or
service that the customers deem important and valuable. Then the firm must meet the
chosen customer need in a matchless way. Finally the firm must attain their
individuality at a cost that is lower than what the customer would want to pay. While
the global connector industry is a highly technological market that puts a huge
emphasis differentiation, it is also extremely important to consumers and investors that
a high quality product is made while also minimizing costs. Thus we will discuss how
both strategies are vital to the success of a firm in the global connector industry(Palepu,
Healy 2-9).
Cost Leadership
The global connector industry manufactures thousands of different types of
products. While most products created and manufactured in this industry are of a
highly differentiated nature, some products are considered commodities and can be
purchased from several different companies. Due to this situation, switching costs for
this industry are fair making the industry reasonably price competitive while still putting
the bulk of the emphasis on differentiation. A few examples of how the global
47
connector industry competes on cost are simpler product design, efficient production,
and economies of scale.
Economies of scale and efficient production
When working in an industry that is as highly competitive as that of global
connectors, it is not only important to set yourself apart from other competing firms by
differentiation, but by also making sure that the firm is able to make a product that is of
an impeccable quality and at the most affordable price. It is common in this industry to
mass produce products that create large volumes of inventory causing costs to
decrease thus driving down prices for consumers(Amphenol, Molex, Tyco 10ks). While
all firms in this industry follow this trend Molex describes the industry process very
thoroughly. “In the global connector industry firms analyze and design the
manufacturing patterns of the customers along with their own supply chain economics
to help ensure that the manufacturing operations are of sufficient scale and are located
strategically to minimize production costs and maximize customer service”(Molex 10K).
Another method that companies in the global connector industry use to expand and
become more efficient is by mergers and acquisitions of existing companies. From
1999 to 2007 Tyco, Molex, Amphenol, and Methode all acquired other companies in the
global connector industry. Companies in the global connector industry participate in
acquisitions in hope that as a company grows production increases thus lowering
production costs and improving production efficiency. In many cases acquisitions lower
costs but another reason why companies in the global connector industry participate in
acquisitions is because they can also diversify customer base thus increasing company
sales. Efficient production is an important factor to consider when analyzing the
connector industry because it ultimately creates more value for the company in terms of
cutting costs, ensuring customer satisfaction, and encouraging brand loyalty.

48
Lower input costs
While economies of scale and efficient production are some of the most common
ways to cut costs for firms in the global connector industry, lowering input costs such as
materials cost and outsourcing are other beneficial ways to control costs in this
competitive industry. For example, outsourcing is extremely common in any type of
technological business because it may be cheaper to design a product in China,
manufacture it in Taiwan, and sale it in the United States then it would be to design,
make, and sale a product in just one country. Another method of lowering input costs
is by having control over suppliers and obtaining the best quality materials at the lowest
cost. However, in the global connector industry a majority of products used such as
plastics, copper, and gold have experienced an over-all price increase in the past year
due to soaring petroleum prices and the increase of certain commodities. An example
of this situation is the automobile industry, an industry in which a majority of companies
in the global connector industry have as a customer base. According to The Wall Street
Journal, the automobile industry is suffering from huge sales declines. Rather than
cutting prices, some companies are being forced to increase them due to certain
increases in commodities(Takahashi 1). This is an excellent example of how firms in
certain industries cannot always control certain factors associated with costs and pricing
that ultimately drive down or damage a firm’s value. While the automobile industry
operates differently from the global connector industry they do correlate. Due to the
fact that the automobile industry is a primary customer of companies in the global
connector industry, a large decline in automobile sales could result in a large decline in
connector industry sales. This is an important factor to consider when investing in
companies in the global connector industry.
Simpler product designs
While the global connector industry is characterized by aggressive advances in
technology and innovative product development, some products are considered
49
commodities that require little originality and have a 25-30 year life span, for instance,
wiring and cables. Although a majority of firms in this industry spend more time and
money towards research and development, in the global connector industry it is
possible to create a simple approach to making certain products that are not only cost
effective but of a reputable quality. It is important to consider these factors in this
industry due to the broad variety of products each firm produces(Amphenol, Molex,
Tyco 10Ks).
Differentiation
When pursuing the differentiation strategy, a company must find a way to stand
out from their competitors in such a way that customers will value. Being unique in an
industry is the key for a company to distinguish themselves from others. It is crucial for
a company to determine what products are in demand, listen to their customers needs,
and then produce the best products based on that information. This will ensure that
the company will provide good customer service and maintain a positive image of the
company. In respect to the electronic connectors industry, this holds especially true
due to the heavy competition between companies like Molex Inc., Tyco Electronics,
Amphenol Corporation, and Methode Electronics. If another firm is doing a better job in
differentiating themselves then that company will receive a better competitor advantage
in the industry. An example of this would be if Tyco had a way of delivering products
to customers quicker than the others then they would be differentiating themselves and
gaining a competitor advantage. When a company stands out from their competitors is
when the company gains the differentiation and competitor advantage.
Product quality
Companies must produce high quality products in order to keep a competitive
edge. If a company’s product quality is not up to the standard of its competitors in the
market, then the company will surely fail. Most customers will be well informed about

50
the quality of all the products on the market and compare different companies to make
the best decision. For example, if Methode has many glitches in their connectors and
has a history of having problems, but Amphenol has never had any issues with their
products, any well informed customer would clearly choose Amphenol. In the electronic
connectors industry their many companies for customers to choose from; therefore, if
one of the companies were to start slacking off and having problems with products, like
a poor connection with the wires, then the other companies would start receive some of
their business and vice-versa. Maintaining the quality of all the products is imperative
to the success of a company; a firm never wants a customer to feel that they were let
down by their products. Word of mouth publicity can have a serious effect on a
company’s success.
Product variety
While preserving the quality of a product, it is also essential that a firm offers
more than one product for a customer to choose from, especially when it comes to
returning customers. Customers often develop brand loyalty quite easily, which can
ensure the success of a company for many years. In the electronic connectors industry
firms usually compete in more than one segment of the industry. For example,
according to Amphenol’s 10-k, Amphenol competes in three different markets which
are: information technology and communications, industrial and automotive, and
commercial aerospace and military. The main markets that Tyco competes in are
electronic components, network solutions, wireless systems (Tyco 10-k). Methode
mainly competes in the markets such as automotive, interconnect, and power products
(Methode 10-k). The company Molex participates in the telecommunications, data
products, automotive, consumer, and industrial markets (Molex 10-k). By a company
having more than just more product line it enable the company to offer more products
to their customers so that they have a variety of choices.

51
Brand Image
The way a consumer feels about a certain brand is referred to as brand imaging.
Brand imaging can be based on the quality of the company’s products, the customer
service that is offered, or personal experiences consumers have had with the company.
In the electronic connectors industry, it is very important for a firm to have a good
brand image, due to the many competitors within this niche business. Since there are
so many companies all selling the same products, it is important for a company to
separate itself from the others by creating a strong brand image.
The concept of brand imaging goes hand-in-hand with product quality and
loyalty in that if a company like dell has been buying their goods from Molex for quite
some-time and feel secure with the company, then they have no reason to even look at
what Tyco, Amphenol, or Methode have to offer (Molex 10-k). Companies without a
strong brand image can lose sales because of their unfamiliarity to the customer and in
its particular industry. An example of a company that gains sales from positive brand
images is Intel, a computer company that buys their parts from electronic connector
companies. Intel has a new computer chip to enter the market that is receiving strong
reviews from computer makers (Clark). When a company such as Intel gets praised for
their new products so do the companies that supply the business that is having success.
Computer companies get their supplies from electronic connector industry companies,
therefore, when Intel looks good so does the company that supplies them. When dell
produces a new product Molex is the company that is also getting the thumbs up from
other companies. When a company has a recognizable brand image, then customers
will feel safer is purchasing their products. Since the connector industry services to
other businesses and does not spend much money on advertising and marketing the
companies to not release information regarding the amount of money that is spent on
marketing. Due to this being the case, there is not a way to show marketing to sales
ratio for the companies.
52
Flexible delivery
Flexible delivery refers to having more than one option in getting the goods to
the customer. If a firm only has one location that it ships all of its products from, then
they may lose the business from distant customers. The faster and easier it is for a
customer to receive their product, the more appealing the company will look. Due to
outsourcing helping cut costs, many industries have started to build more locations all
around the world, which helps in the delivery process. The companies Molex, Tyco,
Amphenol, and Methode all have locations around the world in places such as North
America, South America, Europe, Africa, Asia, Middle East, and New Zealand (Molex 10-
k, Tyco 10-k, Amphenol 10-k, Methode 10-k). By having so many locations it allows the
company to have less time in delivery for customers.
Customer service
Customer service is the willingness of a company to offer their services to assist
current and prospective customers. The better the customer service offered, the
happier the customer will be, which will most likely result in repeat customers. A prime
example of quality customer service is the service that comes from small businesses
because of the need for them to differentiate themselves. As stated by Kelly Spors,
“…a vivid reminder that small businesses need to figure out how to stand out in world
where they are competing against so many larger, wealthier rivals. And the answer is
often customer service.” In industries like electronic connectors competitors look every
similar and by acting like a small business in offering impeccable customer service by
taking time with customers, they can stand out from their other opponents. Most
customers expect a company to provide things like manufacturer’s warranty’s,
customers support, and other accommodations to help the customer with their
purchase. “In addition, most customers have a single Molex customer service contact
and a specific field salesperson to provide technical product and application expertise”
53
(Molex 10-k). Molex is exceeding customer’s expectations in order to provide their
clients in a way that they can be proud of.
Customer service, in some consumers’ eyes, is just as important as the products
themselves when they evaluate a company. Electronic companies highly value their
customers which is why they insist on establishing such strong working relationships
with their customers, according to Tyco’s 10-k. A company needs to feel obligated to
take the time to create very sturdy bases with their customers.
Research and Development
Research and Development means that a company is taking the time and money
to produce new products. The real key to research and development is to come up
with an innovative product that is going to help your company. When a company
develops a brand new product not only do the reputation of the company improve, but
the company gains the competitive advantage of being able to patent their product.
Research and development can make or break a company; therefore, it should be well
funded and well planned in every company.
In the electronic connecters industry research and development is one of the
most important segments of a company. If the company does not give sufficient
funding to that part of the business, then they will not have a chance in keeping up
with the herd. The company’s in the industry spend very different amounts of this
segment of the business. Companies such as Tyco will spend the enormous amount of
fifteen percent of net of their net revenue on their research and development
department (Tyco 10-k). On the other hand, there are companies like Molex that will
spend a fair five percent of net revenue on that branch of the company. The following
chart shows the actual percentages that the companies have spent on research and
development. Due to the lack of years that Tyco releases to the public we did not
include them because it would not have added value to analysis.
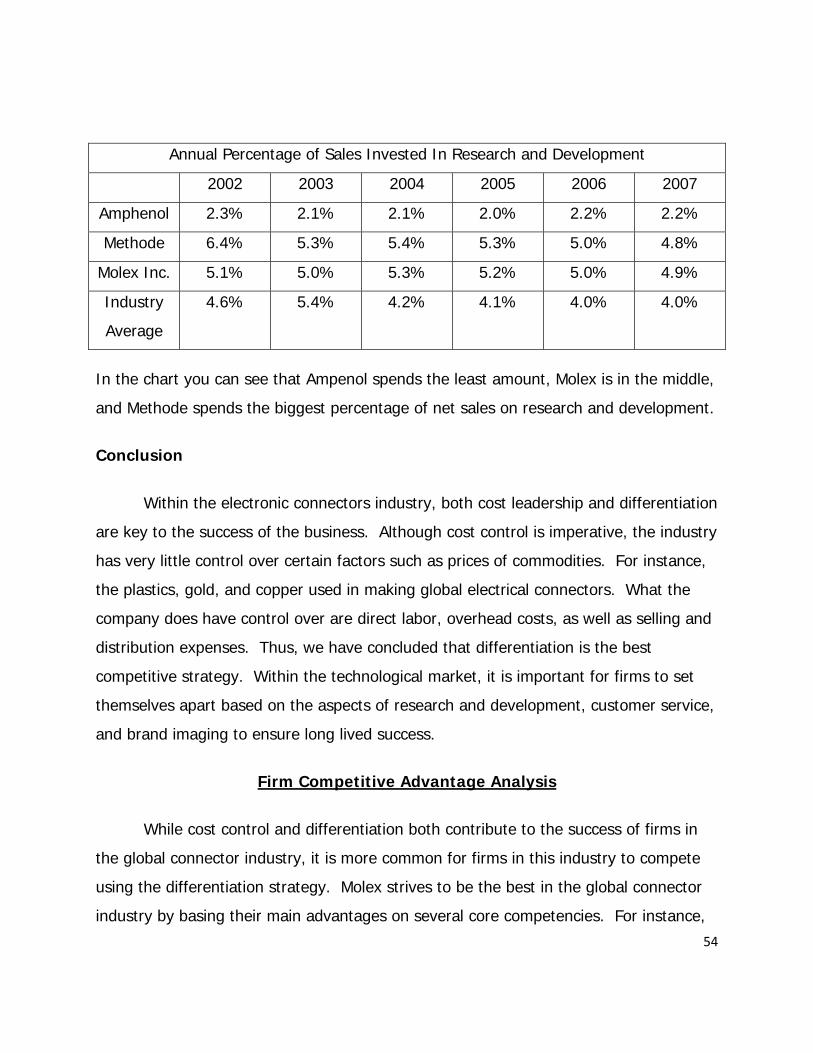
54
Annual Percentage of Sales Invested In Research and Development
2002 2003 2004 2005 2006 2007
Amphenol 2.3% 2.1% 2.1% 2.0% 2.2% 2.2%
Methode 6.4% 5.3% 5.4% 5.3% 5.0% 4.8%
Molex Inc. 5.1% 5.0% 5.3% 5.2% 5.0% 4.9%
Industry
Average
4.6% 5.4% 4.2% 4.1% 4.0% 4.0%
In the chart you can see that Ampenol spends the least amount, Molex is in the middle,
and Methode spends the biggest percentage of net sales on research and development.
Conclusion
Within the electronic connectors industry, both cost leadership and differentiation
are key to the success of the business. Although cost control is imperative, the industry
has very little control over certain factors such as prices of commodities. For instance,
the plastics, gold, and copper used in making global electrical connectors. What the
company does have control over are direct labor, overhead costs, as well as selling and
distribution expenses. Thus, we have concluded that differentiation is the best
competitive strategy. Within the technological market, it is important for firms to set
themselves apart based on the aspects of research and development, customer service,
and brand imaging to ensure long lived success.
Firm Competitive Advantage Analysis
While cost control and differentiation both contribute to the success of firms in
the global connector industry, it is more common for firms in this industry to compete
using the differentiation strategy. Molex strives to be the best in the global connector
industry by basing their main advantages on several core competencies. For instance,
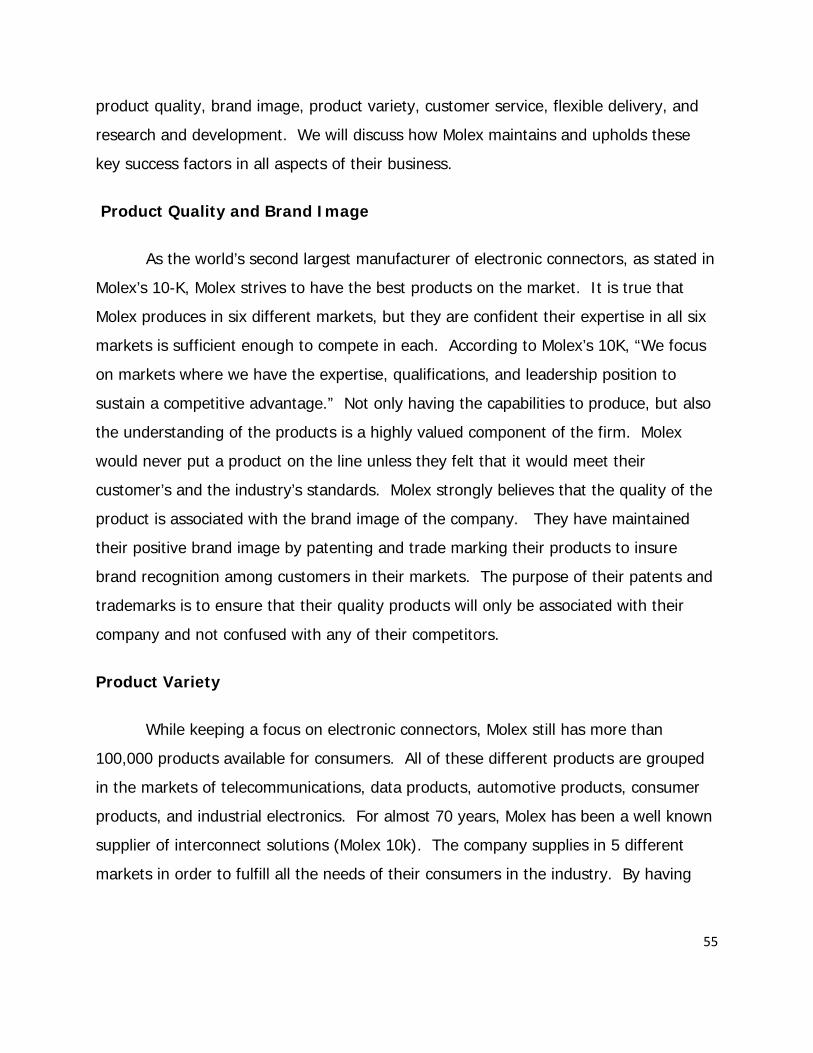
55
product quality, brand image, product variety, customer service, flexible delivery, and
research and development. We will discuss how Molex maintains and upholds these
key success factors in all aspects of their business.
Product Quality and Brand Image
As the world’s second largest manufacturer of electronic connectors, as stated in
Molex’s 10-K, Molex strives to have the best products on the market. It is true that
Molex produces in six different markets, but they are confident their expertise in all six
markets is sufficient enough to compete in each. According to Molex’s 10K, “We focus
on markets where we have the expertise, qualifications, and leadership position to
sustain a competitive advantage.” Not only having the capabilities to produce, but also
the understanding of the products is a highly valued component of the firm. Molex
would never put a product on the line unless they felt that it would meet their
customer’s and the industry’s standards. Molex strongly believes that the quality of the
product is associated with the brand image of the company. They have maintained
their positive brand image by patenting and trade marking their products to insure
brand recognition among customers in their markets. The purpose of their patents and
trademarks is to ensure that their quality products will only be associated with their
company and not confused with any of their competitors.
Product Variety
While keeping a focus on electronic connectors, Molex still has more than
100,000 products available for consumers. All of these different products are grouped
in the markets of telecommunications, data products, automotive products, consumer
products, and industrial electronics. For almost 70 years, Molex has been a well known
supplier of interconnect solutions (Molex 10k). The company supplies in 5 different
markets in order to fulfill all the needs of their consumers in the industry. By having
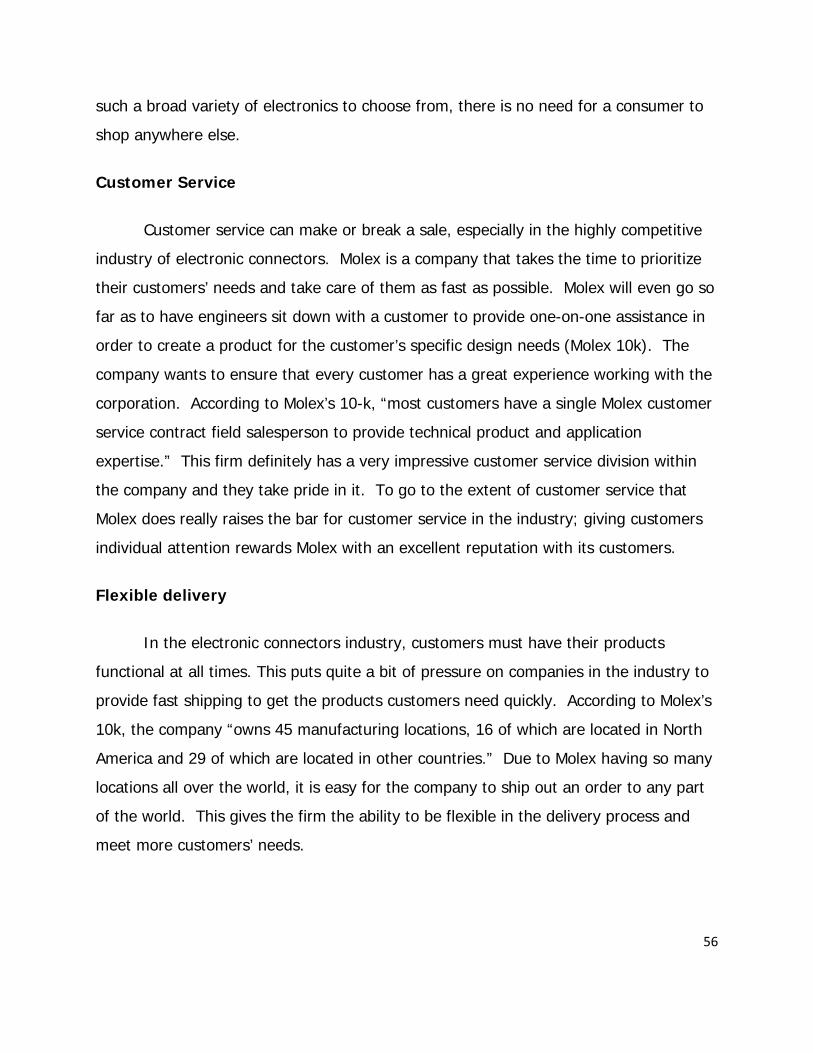
56
such a broad variety of electronics to choose from, there is no need for a consumer to
shop anywhere else.
Customer Service
Customer service can make or break a sale, especially in the highly competitive
industry of electronic connectors. Molex is a company that takes the time to prioritize
their customers’ needs and take care of them as fast as possible. Molex will even go so
far as to have engineers sit down with a customer to provide one-on-one assistance in
order to create a product for the customer’s specific design needs (Molex 10k). The
company wants to ensure that every customer has a great experience working with the
corporation. According to Molex’s 10-k, “most customers have a single Molex customer
service contract field salesperson to provide technical product and application
expertise.” This firm definitely has a very impressive customer service division within
the company and they take pride in it. To go to the extent of customer service that
Molex does really raises the bar for customer service in the industry; giving customers
individual attention rewards Molex with an excellent reputation with its customers.
Flexible delivery
In the electronic connectors industry, customers must have their products
functional at all times. This puts quite a bit of pressure on companies in the industry to
provide fast shipping to get the products customers need quickly. According to Molex’s
10k, the company “owns 45 manufacturing locations, 16 of which are located in North
America and 29 of which are located in other countries.” Due to Molex having so many
locations all over the world, it is easy for the company to ship out an order to any part
of the world. This gives the firm the ability to be flexible in the delivery process and
meet more customers’ needs.

57
Research and Development
Research and development is highly stressed in the electronic industry due to the
world constantly changing and finding more efficient ways of doing everyday tasks. It
is imperative that a company in this industry aggressively pursues the development of
new, creative, and innovative products; otherwise, it will most-likely fail. Molex, in the
fiscal year of 2008, generated about 23% of their revenue from new products alone
(Molex 10k). It is crucial to the firm’s success to create innovative products to keep
customers happy. The fact that a significant portion of the company’s revenue comes
from their innovative products proves that they have been successful in satisfying their
customers in this way. According to Molex’s 10k, the company spends approximately
five percent of net revenue in research and development. The following table shows
the percentage of net sales that was devoted towards research and development:
Annual Percentage of Sales Invested In Research and Development
2002 2003 2004 2005 2006 2007
Amphenol 2.3% 2.1% 2.1% 2.0% 2.2% 2.2%
Methode 6.4% 5.3% 5.4% 5.3% 5.0% 4.8%
Molex Inc. 5.1% 5.0% 5.3% 5.2% 5.0% 4.9%
Industry
Average
4.6% 5.4% 4.2% 4.1% 4.0% 4.0%
Due to the limited years that Tyco releases their information to the public we did
not feel that they would add much value to the chart. You can see in the chart that
when compared to their competitors, Molex spends a fair percentage of their sales on

58
research and development. Research and development enables the company to be
more creative in their product designs.
Conclusion
While all firms in the global connector industry compete using different cost
leadership strategies, in order to stand out from competitors firms must differentiate.
Molex prides itself on being a leader in innovative products while also providing
impeccable quality, customer service, and variety. Molex is a leader in research and
design in the global connector industry, thus creating new and up to date products to
ensure brand imaging and customer loyalty.
Formal Accounting Analysis
The accounting analysis is a series of six crucial steps to help acutely evaluate
and determine the reliability of a firm’s financial statements. Publicly traded companies
release their financial statement to potential investors or current shareholders in an
effort to attract or retain their monetary investment. When analysts use the following
steps, they can determine if the accounting methods used by the firm cause the firm to
be overvalued, undervalued, or stated correctly. The first step is to Identify Principal
accounting polices used by the firm and the industry. The key success factors of the
firm play a large role in determining which accounting policies are used. Step two is
evaluating how much accounting flexibility is present or possible in the firms accounting
methods and estimates. The third step is evaluating the accounting strategies used.
Managers may choose one strategy over another to hide unfavorable performance. The
next step is to evaluate the quality of disclosure. This boils down to how much
information the firm allows the public to see. If very little information is disclosed are
they hiding something? The fifth step is indentifying potential ‘red flags’ or
questionable accounting methods. Unexpected or unexplained write-offs could raise a

59
‘red flag’ for further investigation. The final step is undoing accounting distortions,
which if left unadjusted would be misleading to the analyst. Restating information to
adjust the distortions will allow the analyst to form a more accurate and true opinion of
the firm. Steps 1-6 derived from (Palepu & Healy)
Key Accounting Policies (KAP)
Molex has created a competitive advantage using key success factors such as
product differentiation, product variety, cost leadership, economies of scale, and global
distribution. These key success factors create opportunities for distortion and are
directly linked to key accounting policies that the firm will use. The firm chooses key
accounting policies that will produce the most favorable financial image to its
shareholders. Sometimes a firm will use accounting policies to distort or hide financial
problems. These accounting distortions may exist in areas such as; research and
development, goodwill, defined-benefit pension plans, capital leases and operating
leases, and currency risk. Not all distortions are deliberately created; some are caused
by estimation errors that occur when managers try to forecast future events such as
discount rates. Generally Accepted Accounting Principles (GAAP) allows managers to
choose the accounting policies that best fit their firm due to the managers “superior
knowledge of the business to determine how best to report the economies of key
business events” (Palepu & Healy). The following topics, as mentioned above, are
areas that managers use flexible accounting policies to distort their financial
statements.
Research and Development (R&D)
Research and Development is a key component for future growth in the
technology industry. Molex must invest large amounts of time and money into R&D,
trying to develop new products or manufacturing methods to gain a competitive
advantage over their competition. Many expensive projects in the R&D department are
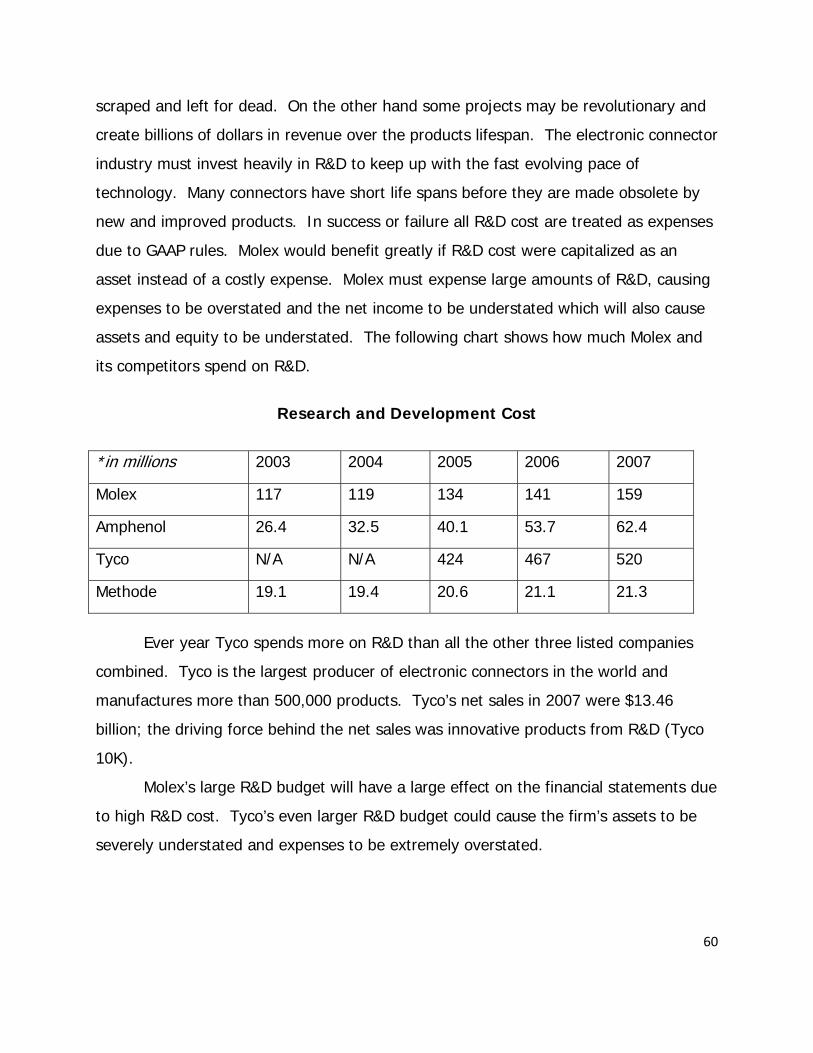
60
scraped and left for dead. On the other hand some projects may be revolutionary and
create billions of dollars in revenue over the products lifespan. The electronic connector
industry must invest heavily in R&D to keep up with the fast evolving pace of
technology. Many connectors have short life spans before they are made obsolete by
new and improved products. In success or failure all R&D cost are treated as expenses
due to GAAP rules. Molex would benefit greatly if R&D cost were capitalized as an
asset instead of a costly expense. Molex must expense large amounts of R&D, causing
expenses to be overstated and the net income to be understated which will also cause
assets and equity to be understated. The following chart shows how much Molex and
its competitors spend on R&D.
Research and Development Cost
*in millions 2003 2004 2005 2006 2007
Molex 117 119 134 141 159
Amphenol 26.4 32.5 40.1 53.7 62.4
Tyco N/A N/A 424 467 520
Methode 19.1 19.4 20.6 21.1 21.3
Ever year Tyco spends more on R&D than all the other three listed companies
combined. Tyco is the largest producer of electronic connectors in the world and
manufactures more than 500,000 products. Tyco’s net sales in 2007 were $13.46
billion; the driving force behind the net sales was innovative products from R&D (Tyco
10K).
Molex’s large R&D budget will have a large effect on the financial statements due
to high R&D cost. Tyco’s even larger R&D budget could cause the firm’s assets to be
severely understated and expenses to be extremely overstated.
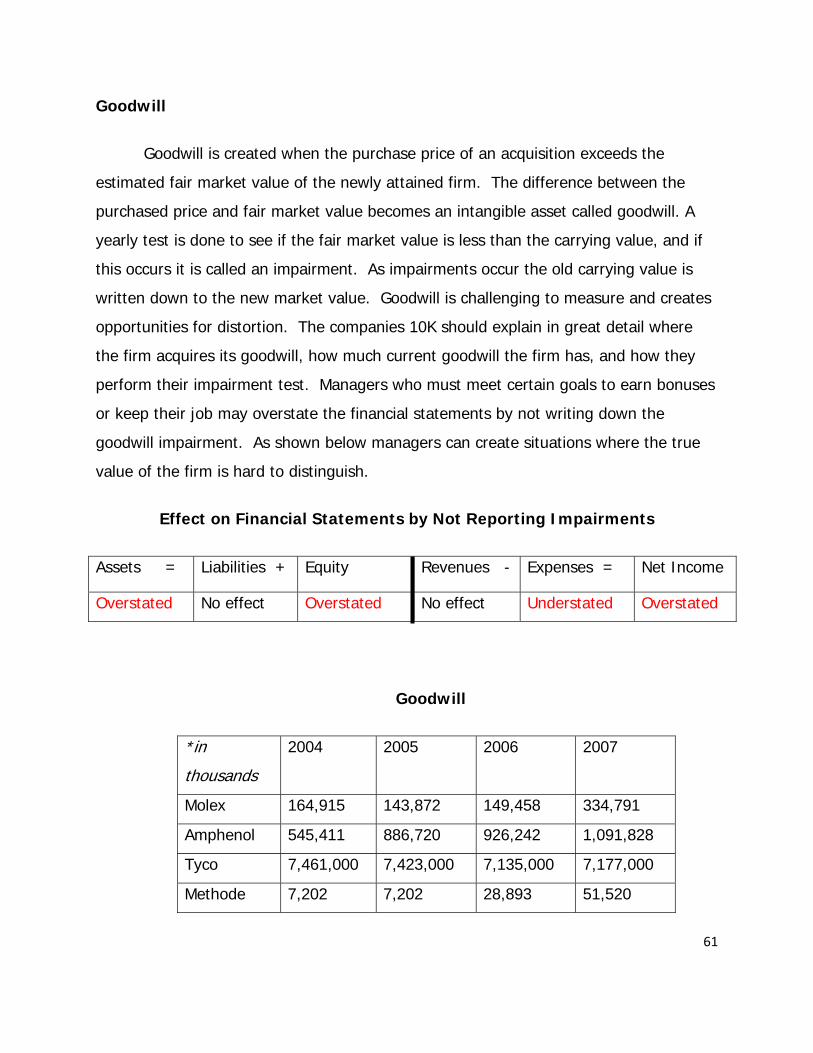
61
Goodwill
Goodwill is created when the purchase price of an acquisition exceeds the
estimated fair market value of the newly attained firm. The difference between the
purchased price and fair market value becomes an intangible asset called goodwill. A
yearly test is done to see if the fair market value is less than the carrying value, and if
this occurs it is called an impairment. As impairments occur the old carrying value is
written down to the new market value. Goodwill is challenging to measure and creates
opportunities for distortion. The companies 10K should explain in great detail where
the firm acquires its goodwill, how much current goodwill the firm has, and how they
perform their impairment test. Managers who must meet certain goals to earn bonuses
or keep their job may overstate the financial statements by not writing down the
goodwill impairment. As shown below managers can create situations where the true
value of the firm is hard to distinguish.
Effect on Financial Statements by Not Reporting Impairments
Assets = Liabilities + Equity Revenues - Expenses = Net Income
Overstated No effect Overstated No effect Understated Overstated
Goodwill
*in
thousands
2004 2005 2006 2007
Molex 164,915 143,872 149,458 334,791
Amphenol 545,411 886,720 926,242 1,091,828
Tyco 7,461,000 7,423,000 7,135,000 7,177,000
Methode 7,202 7,202 28,893 51,520

62
Goodwill as a Percent of Long Term Assets
2007
*before
impairment
Goodwill Percentage*
Molex 20.65%
Amphenol 73.5%
Tyco 57.80%
Methode 26.55%
Analysts would be concerned with the amount of goodwill held by Amphenol in
2007. Amphenol had over a billion dollars of goodwill which represented 73.5% of their
total long term assets (Amphenol 10K). The larger the amount of goodwill within a firm
tends to increases the risk of errors or manipulation by managers.
Goodwill should decrease over time, but due to the trend of convergence of
markets, acquisitions of small firms by large firms are increasing (Molex 10K). The
increase in acquisitions can be explained by firms trying to achieve economies of scale.
Molex currently holds 20.65% of total long term assets in the form of goodwill. Due to
the small percentage of goodwill held by Molex this area might be of little concern to an
analyst.
Pension Liabilities
A defined-benefit and pension plan is a projected benefit package provided by a
firm to provide a steam of cash flows to a retired employee. The post retirement value
provided by the firm is hard to predict due to changing discount rates, healthcare cost,
inflation rates, and longevity of life. The cost of the benefit and pension plans are
recorded as liabilities at the present value of the future expenditures. Mangers must
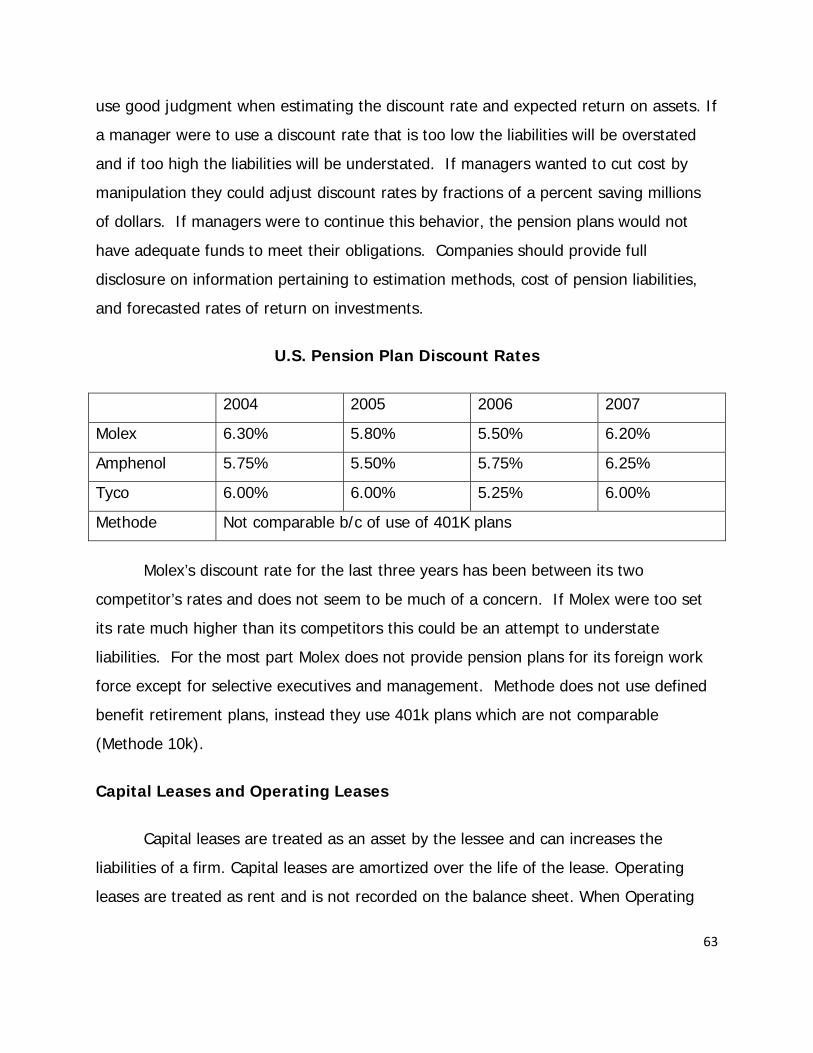
63
use good judgment when estimating the discount rate and expected return on assets. If
a manager were to use a discount rate that is too low the liabilities will be overstated
and if too high the liabilities will be understated. If managers wanted to cut cost by
manipulation they could adjust discount rates by fractions of a percent saving millions
of dollars. If managers were to continue this behavior, the pension plans would not
have adequate funds to meet their obligations. Companies should provide full
disclosure on information pertaining to estimation methods, cost of pension liabilities,
and forecasted rates of return on investments.
U.S. Pension Plan Discount Rates
2004 2005 2006 2007
Molex 6.30% 5.80% 5.50% 6.20%
Amphenol 5.75% 5.50% 5.75% 6.25%
Tyco 6.00% 6.00% 5.25% 6.00%
Methode Not comparable b/c of use of 401K plans
Molex’s discount rate for the last three years has been between its two
competitor’s rates and does not seem to be much of a concern. If Molex were too set
its rate much higher than its competitors this could be an attempt to understate
liabilities. For the most part Molex does not provide pension plans for its foreign work
force except for selective executives and management. Methode does not use defined
benefit retirement plans, instead they use 401k plans which are not comparable
(Methode 10k).
Capital Leases and Operating Leases
Capital leases are treated as an asset by the lessee and can increases the
liabilities of a firm. Capital leases are amortized over the life of the lease. Operating
leases are treated as rent and is not recorded on the balance sheet. When Operating
64
leases are used there is no depreciation or interest cost. These two methods when used
in different combinations can cause radical differences in the value of a firm. For
instance, if a company uses a lot of operating leases this reduces your liabilities, over
states your net income and the equity balances. Obviously this accounting method can
make a company look more valuable than they really are which is why it is extremely
important for investors to examine how much information companies disclose on
operating leases.
When examining the global connector industry, it is quite common for companies
to use both operating and capital leases. A lot of companies in this industry do
business in foreign countries therefore, making capital and operating leases a must.
Molex however, has had the best practice of maintaining their operating leases below
15% of their long term liabilities. Tyco, Amphenol, and Methode have all had their
operating leases total well above 15% of their long term liabilities thus creating a
potential ‘red flag’ for investors.
Currency Risk
When any company deals with currencies from multiple countries they run the
risk of losing value due to fluctuations in currencies rates. Every dominate company in
the electronic connector industry has multination operations, meaning they all must
deal with currency risk. Molex derives 72% of revenue from foreign markets. GAAP
requires financial statements to be composed of a uniform currency to give all financial
information comparable values. If Molex did not convert all foreign currency’s you
could not compare financials statement to Tyco or any other competitor without
performing very time consuming exchange rate conversions. The most common
currencies to be exchanged with our Dollar are; Euro, Japanese Yen, British Pound,
Chinese Renminbi, and Korean Won.

65
Due to volatile currency fluctuations and the vast amount of foreign operations in
the connector industry disclosure of currency risk management is essential. There are a
number of tools to help reduce the effect of volatile currencies, such as forwards
contracts and natural hedging. Molex uses natural hedging which means products are
Accounting Flexibility
The policies and approximations that a firm uses to produce the numbers on the
financial statements are known as accounting flexibility. These policies and
approximations include any methods and ways that the company measures to present
the companies disclosures. The flexibility of the company depends on how strict they
are with their policies and the standards that they hold. GAAP, General Accepted
Accounting Principles, has set certain standards that all companies are to meet, yet
there is room for flexibility. GAAP can only place so much control over a company’s
financial choices for their statements, so there are still grey areas where a firm has to
make official conclusions. For example, when evaluating the goodwill of a company
there is no true way to distinguish a set amount because it is an intangible asset.
Accounting flexibility can lead to a company having distorted numbers on their financial
statements due to not all firms having the same ethics and policies. It is highly relevant
for an analysis to know the flexibility that a business holds in order to have a better
understanding of the value a company holds.
Research and Development
Research and development is a vital role played within a company that operates
in the electronic connectors industry. In order to meet customer needs a company has
to have an amble amount of money flowing into the research and development portion
of the company. GAAP ruling states research and development should be expensed
regardless of the impact that it has in the company’s products. According to the
66
companies 10-k’s, Molex and all of their competitors report research and development
expenses at the time that it occurs. The reason for doing such a thing is that it is
compliance with the regulations that GAAP holds. Research and development
contributes to tremendous amount to sales revenue because the better a company is at
utilizing such a resource the better the resulting products will be.
The electronic connector’s industry spends a significant amount of net sales on
research and development due to the importance that this sector of the business. The
size of a company depends on how much money they will be able to send to this
division of the business. Some companies such as Tyco will spend up to fifteen percent
of their net revenue on their research and development department (Tyco 10-k). Then
there are companies like Molex that will spend a fair five percent of net revenue on that
branch of the company (Molex 10-k). The bigger the company the more funding they
will be able to have for research and development. It is difficult to determine exactly
what is included in the research and development expense. According to Molex’s 10-k,
the costs incurred from innovation are included in selling, general, and administrative
expenses, which makes it difficult to break down into segments. The only other
company that gave any information regarding what composes this expense is Tyco.
According to Tyco’s 10-k, items included in the research and development expense are:
salaries, direct costs incurred, building, and overhead. It is difficult to find a company
that is open about the costs that they have within research and development. With this
information, it can be concluded that the electronic connector’s industry has low
disclosure with research and development expenses.
Within the electronic connector’s industry there is a limited flexibility in recording
research and development. The accounting department does not provide sufficient
information regarding the expenses due to them not having the flexibility within that
segment of the business, even though it is such a large expense of the company. With
this knowledge one would need to keep in mind this expense, despite the lack of
flexibility.
67
Operating and Capital Leases
Majority companies do not own one-hundred percent of their assets; therefore,
they need to have leases on items that they do not own. Companies are given the
option to use operating or capital leases for their assets. An operating lease is treated
like a rent expense, where it never actually hits the books even though cash does flow
out. With an operating lease you can use the asset, but you do not have ownership of
the asset. A capital lease is very different from an operating lease. A capital lease is a
lot like a mortgage in the since that it is recorded in the books as long-term assets and
long-term liabilities. With this type of lease a company has to have extra cash for
interest expense and depreciate on the asset, but the company is considered to have
ownership on the asset.
Molex owns and leases their assets in all of their locations around the world.
As stated in Molex’s 10-k, “We own 88% of our manufacturing, design, warehouse and
office space and lease the remaining 12%.” The remaining twelve percent of the
company’s assets are leased using a capital lease, even though it comes with risks such
as taxes, interest, and payments. Some of Molex’s competitors use both operating and
capital leases, while others like Methode use only operating leases for their assets
(Methode 10-k). When a company uses operating leases it gives the company the
option to understate liabilities and overstate their net income. By using an operating
lease a company does not have to disclose their total liabilities on the balance sheet
which could potential lead to more distortion. A company choices the lease that they
feel is going to suit them the best whether it is a capital or an operating lease, it just
depends on how the firm want to have the lease in their records.
With firms having the option to choose between operating, capital, or even use
both types of leases it gives the accountants many options with typing by the financial
statements. By giving a firm such alternatives it makes it really easy to have distortion
of numbers slip onto the balance sheet. Another part to leases is that a company could

68
switch the type of lease that they are using in order to rearrange numbers even more.
If a company starts with an operating lease and decides that they want to switch to a
capital lease they have every right to do that, as long as it fits with the contract of the
asset. With operating and capital leases there is plenty of room for accounting
flexibility.
Pension Plans
A pension plan is an agreement between an employer and an employee to make
regular benefit payments following the employee’s retirement. The amount of the
payments is based on the number of years served by the employee as well as the
compensation that was received during the employee’s last year of service. The way a
company decides the amount of pension that is going to be rewarded is based on a
discount rate that is up to the company to settle on. A discount rate is essentially an
estimation that is used to discount future payments to the present value. With pension
plans the firm has to make an educated guess at how long an employee is going to
work for the company as well as how long the person is going to live after retiring.
Molex, as every company does, has their own way of creating a discount rate to
be used for pension plans. As stated in Molex’s 10-k, “The discount rate is determined
based on high-quality fixed income investments that match the duration of expected
benefit payments…is based on a yield curve constructed from a portfolio of high quality
corporate debt securities with various maturities.” Although it is for the company to
determine what a good fixed income investment would be, Molex seems to try and be
reasonable and fair with the amount of pension rewarded to the employees.
The following data, from Molex’s 10-k, shows the discount rate used in the years
2008 and 2007 in both the United States as well as the non-United States locations:
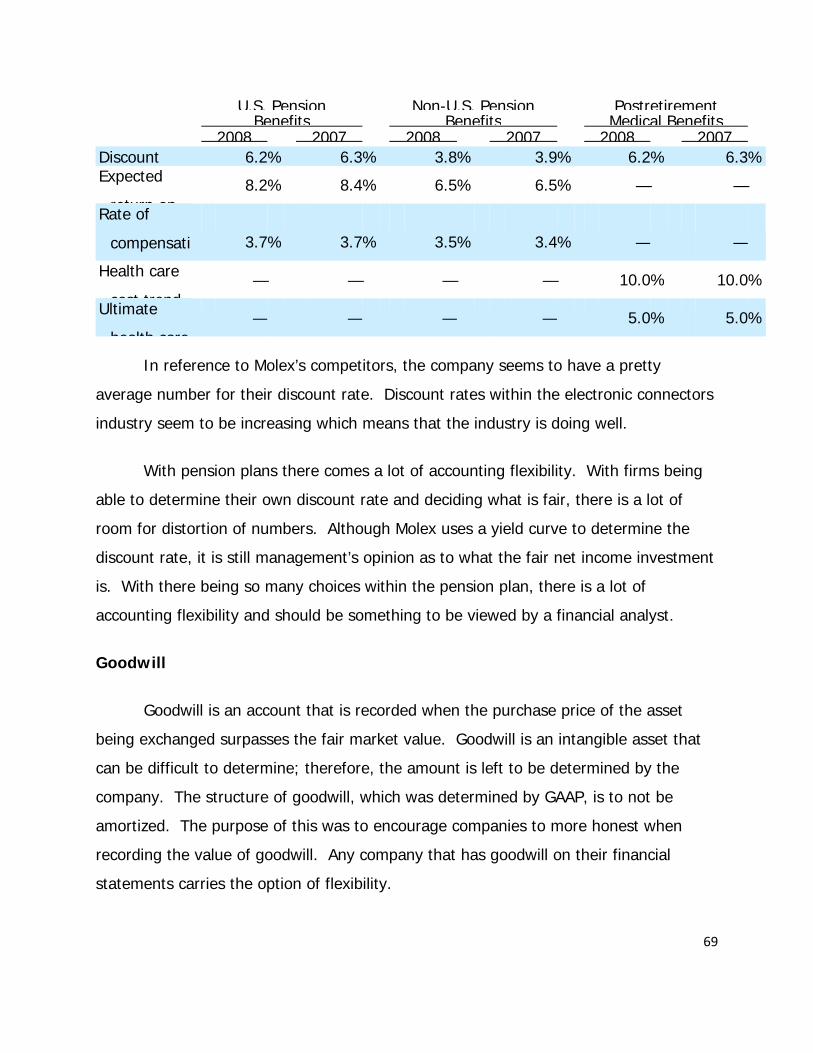
69
U.S. Pension Non-U.S. Pension PostretirementBenefits Benefits Medical Benefits
2008 2007 2008 2007 2008 2007Discount 6.2% 6.3% 3.8% 3.9% 6.2% 6.3%Expected
return on 8.2% 8.4% 6.5% 6.5% — —
Rate of
compensati 3.7% 3.7% 3.5% 3.4% — —
Health care
cost trend — — — — 10.0% 10.0%
Ultimate
health care — — — — 5.0% 5.0%
In reference to Molex’s competitors, the company seems to have a pretty
average number for their discount rate. Discount rates within the electronic connectors
industry seem to be increasing which means that the industry is doing well.
With pension plans there comes a lot of accounting flexibility. With firms being
able to determine their own discount rate and deciding what is fair, there is a lot of
room for distortion of numbers. Although Molex uses a yield curve to determine the
discount rate, it is still management’s opinion as to what the fair net income investment
is. With there being so many choices within the pension plan, there is a lot of
accounting flexibility and should be something to be viewed by a financial analyst.
Goodwill
Goodwill is an account that is recorded when the purchase price of the asset
being exchanged surpasses the fair market value. Goodwill is an intangible asset that
can be difficult to determine; therefore, the amount is left to be determined by the
company. The structure of goodwill, which was determined by GAAP, is to not be
amortized. The purpose of this was to encourage companies to more honest when
recording the value of goodwill. Any company that has goodwill on their financial
statements carries the option of flexibility.
70
Molex has quite a bit of goodwill accounted for on their financial statements.
The reason behind this is that on August 9, 2006 the acquisition of Woodhead
Industries, Inc. was completed (Molex 10-k). This gain was a tremendous step in
helping Molex to expand their products and the potential of the company as a whole.
Every year an annual goodwill impairment analysis is conducted; it is also possible for it
to occur more often if the company feels that it is needed. There has not been any
reporting of goodwill impairment since the fiscal year of 2005 in which Molex had a
charge of $22.9 million (Molex 10-k). This could bring up the concern that the
company could be over estimating the value of their newly acquired company. Molex
does give a decent description of the way that goodwill is measured, yet it all lenks
back to management’s opinion. When it comes down to it, if there is no real way to
determine the value of goodwill there will always be a lot of flexibility. Until the day
comes that goodwill can be properly measured and there is no opinions involved, there
will always be a large amount of flexibility and a possibility of manipulation of goodwill
in the financial statements.
Currency
For the foreign exchange rate there is very little room for accounting flexibility.
When the currency is exchanged there is always a set rate at which the money is
valued and that is really the only rate that a company can use. A foreign exchange rate
is public information; therefore, anyone could jump on their computer and verify that a
company is using a fair rate. Molex does a lot of business overseas and so they have to
deal with the currency rate fairly often. If the company were to try and distort the rate
at which the money is being traded it would be rather obvious when the auditor is
going through all of the financial statements. With the currency market there are ways
of confirming that a company is using a proper rate. With that being said, there is very
low flexibility involved with currency exchange.
71
Evaluating Accounting Principles
The evaluation of accounting strategies has become increasingly important in
recent years due to the realization of misrepresentation of accounting numbers by
many companies. The Securities and Exchange Commission has enacted many new
regulations to limit the possibility of manipulation of financial statements. However,
there are a number of “loop holes” allowed within the regulations under generally
accepted accounting principles that management can employ to otherwise manage their
books. It is important when evaluating a company to assess the quality of disclosure
within their financial statements and annual reports. A company with high disclosure
presents thorough information regarding accounting numbers, policies, and personal
strategies implemented. High disclosure is characterized by a company’s ability to
present relevant and helpful information in addition to the required SEC and GAAP
disclosures. A company implementing low disclosure in relation to its financial
statements presents the minimum information required by SEC and GAAP. Low
disclosure is characterized by the hesitance of a company to provide thorough
information to the public, which makes them appear untrustworthy. Another important
characteristic of accounting strategy that is helpful to evaluate is the company’s use of
conservative versus aggressive accounting policies. After determining both the
company’s level of disclosure, and its particular accounting policies a person should be
able to successfully evaluate the company’s accounting strategy.
Research and Development
Research and development is a vital role played within a company that operates
in the electronic connectors industry. In order to meet customer needs a company has
to have an amble amount of money flowing into the research and development portion
of the company. GAAP ruling states research and development should be expensed
regardless of the impact that it has in the company’s products. According to the
companies 10-k’s, Molex and all of their competitors report research and development
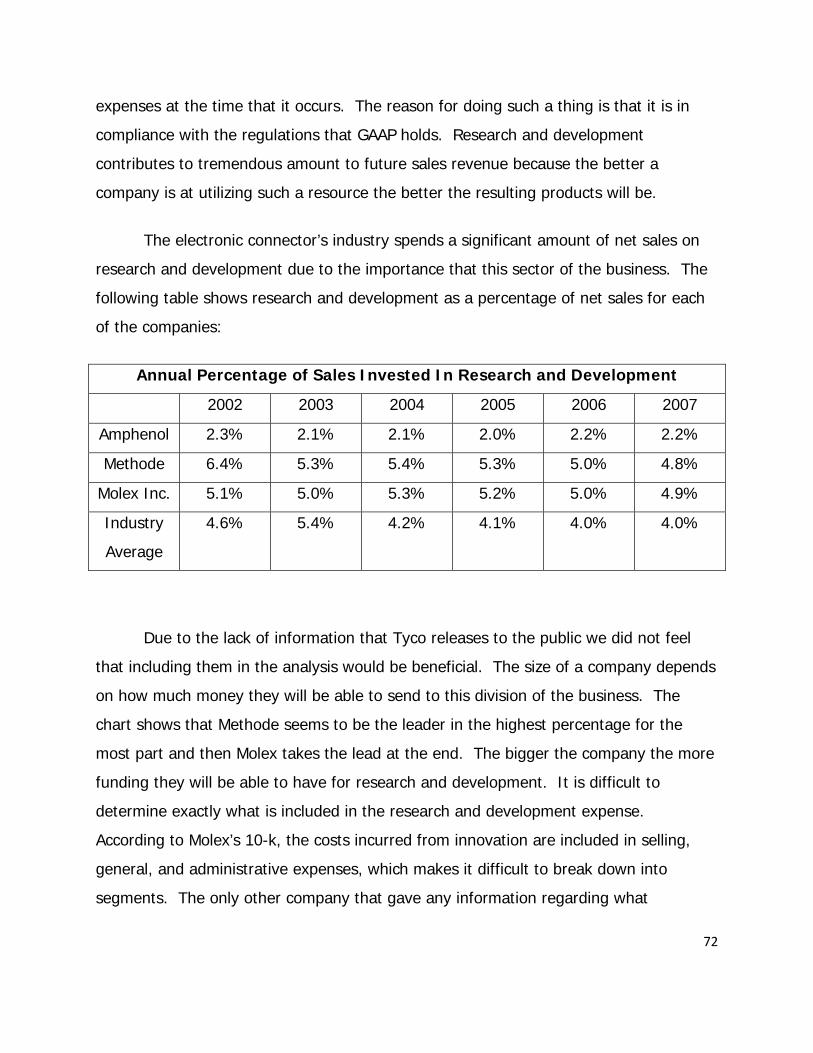
72
expenses at the time that it occurs. The reason for doing such a thing is that it is in
compliance with the regulations that GAAP holds. Research and development
contributes to tremendous amount to future sales revenue because the better a
company is at utilizing such a resource the better the resulting products will be.
The electronic connector’s industry spends a significant amount of net sales on
research and development due to the importance that this sector of the business. The
following table shows research and development as a percentage of net sales for each
of the companies:
Annual Percentage of Sales Invested In Research and Development
2002 2003 2004 2005 2006 2007
Amphenol 2.3% 2.1% 2.1% 2.0% 2.2% 2.2%
Methode 6.4% 5.3% 5.4% 5.3% 5.0% 4.8%
Molex Inc. 5.1% 5.0% 5.3% 5.2% 5.0% 4.9%
Industry
Average
4.6% 5.4% 4.2% 4.1% 4.0% 4.0%
Due to the lack of information that Tyco releases to the public we did not feel
that including them in the analysis would be beneficial. The size of a company depends
on how much money they will be able to send to this division of the business. The
chart shows that Methode seems to be the leader in the highest percentage for the
most part and then Molex takes the lead at the end. The bigger the company the more
funding they will be able to have for research and development. It is difficult to
determine exactly what is included in the research and development expense.
According to Molex’s 10-k, the costs incurred from innovation are included in selling,
general, and administrative expenses, which makes it difficult to break down into
segments. The only other company that gave any information regarding what

73
composes this expense is Tyco. According to Tyco’s 10-k, items included in the
research and development expense are: salaries, direct costs incurred, building, and
overhead. It is difficult to find a company that is open about the costs that they have
within research and development. With this information, it can be concluded that the
electronic connector’s industry has low disclosure with research and development
expenses.
Within the electronic connector’s industry there is a limited flexibility in recording
research and development. The accounting department does not provide sufficient
information regarding the expenses due to them not having the flexibility within that
segment of the business, even though it is such a large expense of the company. With
this knowledge one would need to keep in mind this expense, despite the lack of
flexibility.
Operating and Capital Leases
Majority companies do not operate by owning one-hundred percent of their
assets; therefore, they need leases on the assets that they do not own. Companies are
given the option to use operating or capital leases for their assets. An operating lease
is treated like a rent expense, where it never actually hits the books even though cash
does flow out. With an operating lease you can use the asset, but you do not have
ownership of the asset. A capital lease is very different from an operating lease. A
capital lease is a lot like a mortgage in the since that it is recorded in the books as long-
term assets and long-term liabilities. With this type of lease a company has to have
extra cash for interest expense and depreciate on the asset, but the company is
considered to have ownership on the asset.
Molex owns and leases their assets in all of their locations around the world.
As stated in Molex’s 10-k, “We own 88% of our manufacturing, design, warehouse and
office space and lease the remaining 12%.” The remaining twelve percent of the
74
company’s assets are leased using a capital lease, even though it comes with risks such
as taxes, interest, and payments. Some of Molex’s competitors use both operating and
capital leases, while others like Methode use only operating leases for their assets
(Methode 10-k). When a company uses operating leases it gives the company the
option to understate liabilities and overstate their net income. By using an operating
lease a company does not have to disclose their total liabilities on the balance sheet
which could potential lead to more distortion. A company choices the lease that they
feel is going to suit them the best whether it is a capital or an operating lease, it just
depends on how the firm want to have the lease in their records.
With firms having the option to choose between operating, capital, or even use
both types of leases it gives the accountants many options with typing by the financial
statements. By giving a firm such alternatives it makes it really easy to have distortion
of numbers slip onto the balance sheet. Another part to leases is that a company could
switch the type of lease that they are using in order to rearrange numbers even more.
If a company starts with an operating lease and decides that they want to switch to a
capital lease they have every right to do that, as long as it fits with the contract of the
asset. With operating and capital leases there is plenty of room for accounting
flexibility.
Pension Plans
Defined benefit plans and defined contribution plans are two of the retirement
plans a firm can choose to implement. Defined benefit plans are like pensions, ensuring
a fixed monthly payment with respect to increasing costs of living. If a company
chooses to employ the use of defined benefit plans they are guaranteeing retirement
income security for all employees involved in the plan. Defined benefit plans also
provide minimal to no investment risk, while allowing adjustments to changes in cost of
living throughout the years. A defined contribution plan allows the individual employee
to assist in the savings of his retirement. Amounts contributed to the plan are based on

75
income, expenses, gains and losses. One disadvantage of a defined contribution plan is
that there is no promised set of monthly payments during retirement, the payment
received is a result of the investment of both the employer and employee. An example
of a defined contribution plan is a 401 (k) and that is the type of plan Molex’s
competitor Methode employs. While comparing retirement benefits throughout the
industry we concluded that Methode had very low disclosure compared to its
competitors, revealing limited if not minimal information concerning its pension plans.
On the other hand, company’s like Molex, Amphenol and Tyco Electronics disclosed a
vast amount of information concerning their specific pension, post-retirement, and
defined contribution plans. The companies also disclosed estimates used in determining
the expenses associated with each plan. Molex and Amphenol choose to implement
both a defined contribution plan, as well as a defined benefit plan. Both of these
companies determine the discount rate based on high quality fixed income investments
that match the duration of the benefit payments expected. These firms also employ a
weighted average actuarial assumption to determine benefit obligation for the plans.
Molex also discloses, in addition to its information regarding its fixed contribution plans
and benefit plans, a description of its post retirement medical benefit plan that is
available to most U.S. employees.
Components of Net Periodic Benefit Cost for U.S. Pension Benefit as stated for Molex Inc.
(in thousands)
2006 2007 2008
Service Cost $ 3,239 2,287 3,380
Interest Cost $ 2,291 2,962 3,683
Expected Return on Plan Assets (3,070) (3,939) (4,625)
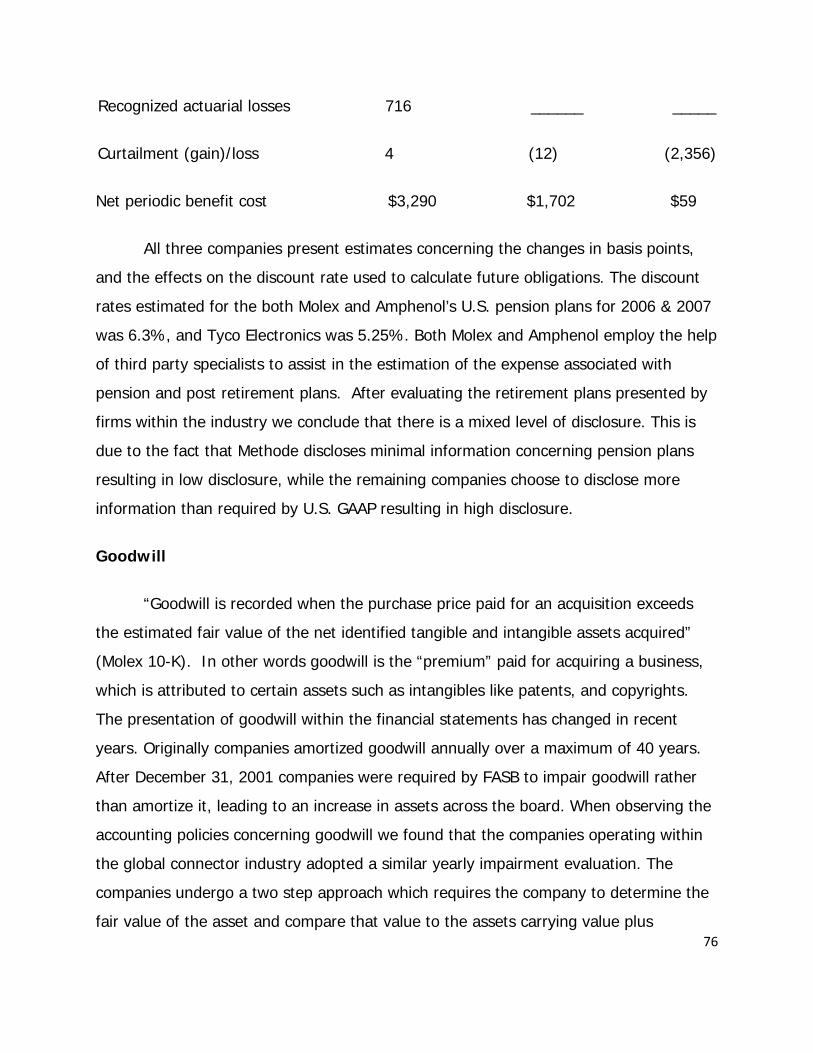
76
Recognized actuarial losses 716 ______ _____
Curtailment (gain)/loss 4 (12) (2,356)
Net periodic benefit cost $3,290 $1,702 $59
All three companies present estimates concerning the changes in basis points,
and the effects on the discount rate used to calculate future obligations. The discount
rates estimated for the both Molex and Amphenol’s U.S. pension plans for 2006 & 2007
was 6.3%, and Tyco Electronics was 5.25%. Both Molex and Amphenol employ the help
of third party specialists to assist in the estimation of the expense associated with
pension and post retirement plans. After evaluating the retirement plans presented by
firms within the industry we conclude that there is a mixed level of disclosure. This is
due to the fact that Methode discloses minimal information concerning pension plans
resulting in low disclosure, while the remaining companies choose to disclose more
information than required by U.S. GAAP resulting in high disclosure.
Goodwill
“Goodwill is recorded when the purchase price paid for an acquisition exceeds
the estimated fair value of the net identified tangible and intangible assets acquired”
(Molex 10-K). In other words goodwill is the “premium” paid for acquiring a business,
which is attributed to certain assets such as intangibles like patents, and copyrights.
The presentation of goodwill within the financial statements has changed in recent
years. Originally companies amortized goodwill annually over a maximum of 40 years.
After December 31, 2001 companies were required by FASB to impair goodwill rather
than amortize it, leading to an increase in assets across the board. When observing the
accounting policies concerning goodwill we found that the companies operating within
the global connector industry adopted a similar yearly impairment evaluation. The
companies undergo a two step approach which requires the company to determine the
fair value of the asset and compare that value to the assets carrying value plus
77
goodwill. If the asset’s carrying value exceeds the fair value estimated then the asset is
impaired. After the realization of impairment, a company must take the necessary steps
and tests in estimating the impairment loss. Molex, and its competitors disclose
definitions for goodwill, as well as the step-by-step process involved in calculating the
impaired goodwill of an acquired company or asset. All companies reveal amounts
attributed to goodwill, and account for increases with information involving current and
previous acquisitions. Under Financial Accounting Standard Board regulations all
companies are required to perform annual goodwill impairment evaluations. Molex’s
competitors, Amphenol and Methode both disclosed a considerable amount of
information concerning their firm’s goodwill, but Molex chose to disclose segmented
information concerning recent acquisitions that summarized estimated fair values of
assets acquired and liabilities assumed for Woodhead Industries, Inc. This amount of
disclosure helps readers of the financial statements to account for the purchasing price
of the acquired firm and the amount of goodwill so that it is not perceived as a made
up number. Molex and its competitors Amphenol and Methode appear to employ an
aggressive accounting approach to the recording of goodwill, seeing as none of the
companies has reported impairment to goodwill in recent years. This can be attributed
to the stable value associated with the acquired assets of acquired firms, or as neglect
on the part of the firms to realize a loss on goodwill. Molex’s competitor, Tyco
Electronics, was the only firm to disclose amounts of impaired goodwill in the recording
of its financials. In conclusion, we believe that Molex and the industry in which it
operates has a high level of disclosure in reference to goodwill. We have also come to
the conclusion that Molex, Amphenol and Methode employ aggressive accounting
policies which are reflected in their failure to report impairment, while Tyco Electronics
utilizes conservative accounting policies reflected in its disclosure of impairment to
goodwill.
78
Currency
Firms operating within the connector industry market conduct their business
throughout the globe. All companies that compete within this industry own multiple
sets of operations in many different countries. Molex, for example, attributed 52% of its
fiscal 2008 revenue to sales derived in the Asia-Pacific region alone. Firms operating
within other countries typically denominate purchases and sales made in that particular
country’s currency. Issues such as these are especially important during the translation
of foreign revenues into U.S. dollars. Companies operating in foreign markets are
subject to currency exchange rates assigned to each country throughout the globe. It is
our belief that Molex and its competitors practice conservative accounting policies in
reference to currency translation because the currency exchange rates of all countries
are given by a higher authority making them difficult to use in the distortion of
translating foreign currency. Molex discloses a sufficient amount of information
concerning the effect translation of currency has on their books. The company
accounted for every increase and decrease in certain aspects of the books with an
explanation. In conclusion, Molex provided ample information concerning the
translation of currency and its effects on the books. This further supports the firm’s
ongoing devotion to high disclosure throughout its company’s statements.
Qualitative analysis
The quality of disclosure is an important aspect to consider when investing in a
company. GAAP requires only a certain amount of disclosure and ultimately allows a lot
of flexibility for a firm to potentially hide certain factors that if disclosed would keep
someone from investing in a firm. It is up to the company to disclose additional
information to ensure credibility and provide a certain faith in a firm. The more
companies disclose the more honest their financials are thus creating a more accurate
79
value of a firm. If the information is deemed accurate or reliable there is a greater
chance of people investing in the firm. If the information does not match up it is
usually because the company purposefully stated their financials in a manner that
would initially look appealing but in reality is ‘red flag’ to potential financial trouble a
company could be in.
Research and development
Research and development expenses in the global connector industry are highly
disclosed. While it is required by GAAP to show how much research and development is
expensed by companies, each firm in the global connector industry discloses how much
money was spent each year on research and development, what the money went
towards, and how the percentage of research and development relates to net income
and sales. For example, Molex states that, “Our research and development activities
are directed toward developing technology innovations, primarily high speed signal
integrity, miniaturization, higher power delivery, optical signal delivery and sealed harsh
environment connectors that we believe will deliver the next generation of products.”
Molex realizes that it is extremely important to disclose what research and development
is going towards in order to provide support so that they can keep up with industry
trends and stay on the cutting edge of technology.
One reason companies in the global connector industry find it important to
disclose research and development is due to the fact that the global connector industry
is highly differentiated. Meaning there is a huge need to use research and development
to set companies apart in this industry. Companies in this industry feel that by stating
they spend a lot of money on their research and development they could potentially
gain more investors due to R&D being a key success factor in the global connector
industry.

80
Operating and Capital Leases
The level of disclosure that companies provide on their operating and capital
leases could have a positive or negative effect on the analysis of the company’s
financial information. Firms in the global connector industry have the choice of using
either operating leases or capital leases. An operating lease is treated like a rent
expense, where it never actually hits the books even though there is a cash outflow. A
capital lease is almost like a mortgage where it is recorded as a long-term asset or
liability. Molex offers a high level of disclosure regarding operating and capital leases.
Molex states in their 10-K, “We own 88% of our manufacturing, design,
warehouse and office space and lease the remaining 12%.” These twelve percent of
leases that Molex operates under are treated as capital leases. The industry offers a
moderate amount of disclosure on their operating and capital leases. Some of Molex’s
other competitor use both operating and capital leases and Methode uses only
operating leases.
The flexibility that companies have when reporting their operating and capital
leases makes it very easy for a manager to manipulate or distort numbers to make the
firm seem more valuable. If firms decided to capitalize leases when they should be
computed as operating leases, then assets and liabilities will be overstated on the
balance sheet. On the other hand, if a company decided to use an operating lease
when a capital lease was appropriate, then assets and liabilities will be understated. It
is imperative that potential investors understand operating and capital leases so that
they can correctly assign a value to the firm. With the quality of disclosure and
conservative accounting practices that Molex and its competitors offer, we believe that
we can effectively asses their operating and capital leases.
81
Defined benefit and pension plan
The quality of disclosure that Molex provides concerning defined benefit and
pension plans is considered average to their competitors. While Methode does not use
a defined benefit plan, Molex provides the same type of information as that of
Amphenol and Tyco. Each company discloses discount rates and expected costs of
future medical expenses, however, these discount rates can be extremely misleading.
For instance, Molex uses a higher discount rate for their U.S. pensions than their foreign
pensions making their liabilities look smaller than they possibly are. Another important
rate to examine is the health care cost trend. It states that medical costs are on
average 10% per year, however, it states that they think the rates will be 5% in 2010
and 2011. This percentage rate is unrealistic when you consider that costs usually rise
with time.
Molex also continues to say that, “Our overall investment strategy for the assets
in the pension funds is to achieve a balance between the goals of growing plan assets
and keeping risk at a reasonable level over a long-term investment horizon. In order to
reduce unnecessary risk, the pension funds are diversified across several asset classes
with a focus on total return”(Molex 10K). However, the 10K just states that U.S. plan
assets are 68% equity and 32% bonds. No where does it mention the types of stocks
and bonds they invest in that could help a potential investor know how much risk is
directly involved in these assets.
While Molex’s level of disclosure is average of their competitors some of their
statements can be misleading. It is quite common for this to happen in the global
connector industry, however, this does not mean that these actions or methods of
recording financial statements are deemed acceptable.

82
Goodwill
The quality of disclosure that Molex provides concerning goodwill is a little above
average of its competitors. For instance, each company in the industry performs an
annual impairment evaluation on their goodwill accounts to determine if an impairment
is necessary. In late 2006, Molex acquired Woodhead industries for $238.1 million and
a U.S. based company in 2007 for $42.5 million of which $23.9 million was goodwill.
The total for goodwill in 2007 was $334,791,000 which makes goodwill 20.6% of long
term assets. This percentage is higher than it should be and suggests that Molex needs
to restate their goodwill and allow for an impairment. However, 20.6% is not a large
number compared to Amphenol’s goodwill that totaled to 75% of their long term assets
or Tyco’s that totaled out to 57.7% of their long term assets. While Molex needs to
restate their financials and allow for an impairment of goodwill, they are still disclosing
and stating their financials better than most companies in their industry.
Currency
Molex has a large amount of disclosure regarding currency exchange rates. As
stated, “since a significant portion of our business is conducted outside the U.S., we
face substantial exposure to movements in non-U.S. currency exchange rates” (Molex
10-K). They explain how this currency risk could harm the results of operations and
how their measures to reduce currency risk may not be effective. They also disclose
that they may use financial instruments to hedge the U.S. dollar and other foreign
currencies arising from accounts receivable and accounts payable. Molex states that the
weakening of the U.S. dollar has cause foreign currency translation losses over the past
two years. “Certain products that we manufacture in Japan and Europe are sold in other
regions of the world at selling prices primarily denominated in or closely linked to the
U.S. dollar. As a result, changes in currency exchange rates may affect our cost of sales
reported in U.S. dollars without a corresponding effect on net revenue” (Molex 10K).
They provide forecasts for currency volatility during each year, and explain that if these
83
forecasts are over or understated that they could experience unanticipated currency or
hedge gains and losses. So we believe that Molex offers an accurate and substantial
amount of currency disclosure.
Quantitative Accounting Measures and Disclosure
Quantitative accounting disclosures are intended to help managers effectively
communicate a company’s financial statements. Financial statements allow shareholders
and potential investors the ability to see important information regarding the company
and in turn, the ability to extract a value of the company. Managers are allowed flexible
accounting standards under GAAP in order to better report the underlying economic
substance of transactions and events. Managers have the ability to distort the
accounting numbers in order to alter the apparent value of the firm, which could cause
investors to see a skewed version of what the underlying value of the firm is. This is
why it is important for analyst and potential investors to understand accounting
measures and how they are used to decipher information about a company’s financial
statements. Sales and expense diagnostic ratios allow analyst to asses the true value of
the firm and help to spot out potential “red flags” in their financial statements.
There are two quantitative accounting measures used to determine if the
company is accurately and reliably presenting their financial information. The first of
these two measures is the sales manipulation diagnostics. These ratios show the affect
of what various areas of the firm’s business activities have on their net sales. The ratio
is computed by dividing the firm’s net sales by the various areas of the firm’s business
activities including: cash from sales, net accounts receivable, unearned revenue,
warranty liabilities, and inventory. These ratios will help spot out any manipulation in
the accounting numbers, and if so, would lead to a “red flag” being raised. The second
quantitative measure is to look at the expense manipulation diagnostics. These ratios

84
are used to determine if there are any manipulations in a company’s reported expenses.
Managers want their company to appear profitable, and within the accounting flexibility
allowed by GAAP sometimes they are able to “cook the books”, or manipulate the
numbers. This is why it is important for investors to understand accounting techniques
in order to effectively assign a value to the firm.
Sales Manipulation Diagnostics:
The sales manipulation diagnostics is a tool used to review the financial
statements of Molex and their top competitors. By using financial ratios that assess the
revenues, accounts receivables, and inventories of the global connector industry, we
can study industry trends over the past five years and determine if Molex has raised
any ‘red flags’ that potential investors should be concerned with. These ratios will
ultimately determine is proper disclosure on financial statements has been achieved.
Net sales/ accounts receivable
This ratio compares the amount of total net sales to the amount of sales that are
credit transactions. This is an important ratio to examine, due to the fact that, the firm
has already performed a service in return for a promise that a company will pay them at
a later date. This does not mean cash will always be received, which is why we must
also examine the allowance for doubtful accounts to determine the odds of receiving
payment. Firms usually want a high ratio because this means they are reducing their
accounts receivable balance and receiving cash. The ratio is an excellent example of
how liquid the company is thus making the firm more appealing to investors.
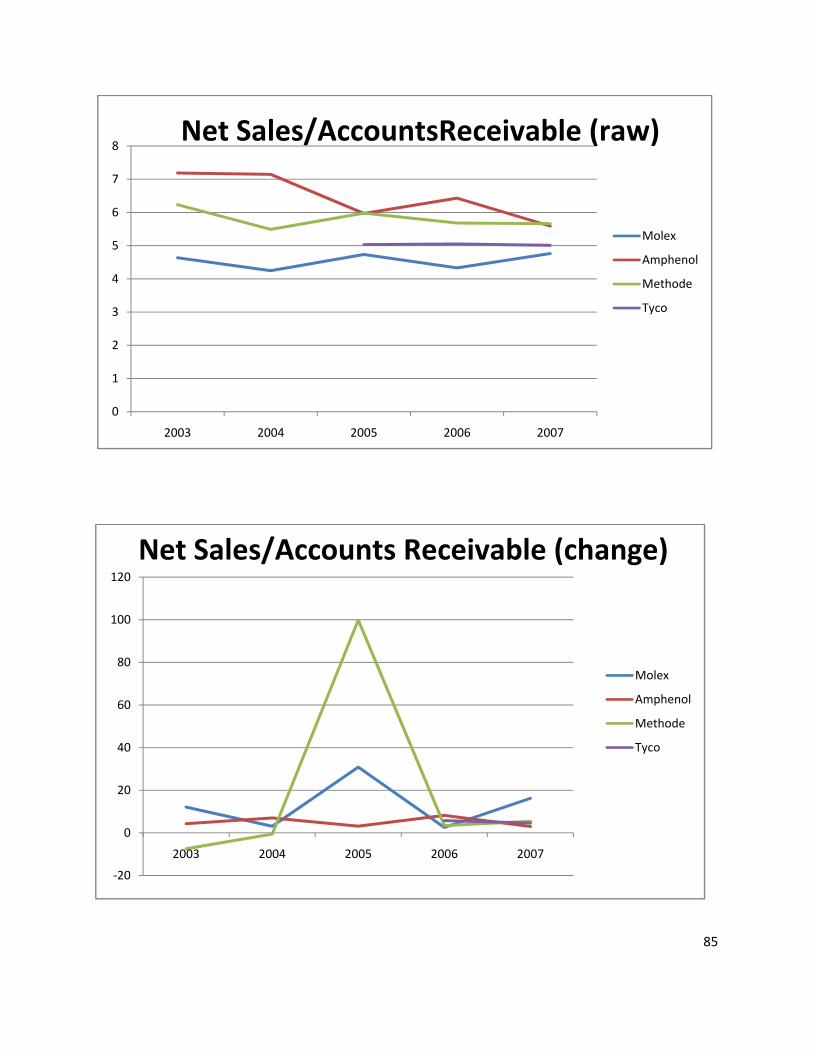
85
0
1
2
3
4
5
6
7
8
2003 2004 2005 2006 2007
Molex
Amphenol
Methode
Tyco
Net Sales/AccountsReceivable (raw)
‐20
0
20
40
60
80
100
120
2003 2004 2005 2006 2007
Molex
Amphenol
Methode
Tyco
Net Sales/Accounts Receivable (change)
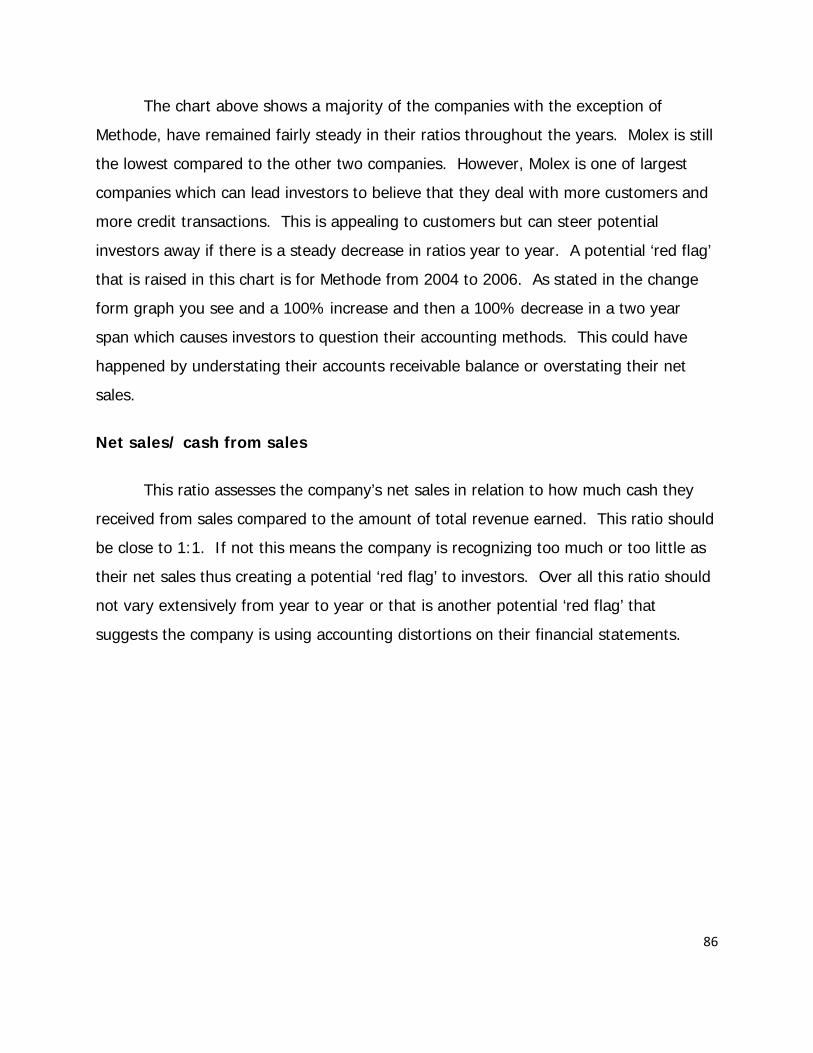
86
The chart above shows a majority of the companies with the exception of
Methode, have remained fairly steady in their ratios throughout the years. Molex is still
the lowest compared to the other two companies. However, Molex is one of largest
companies which can lead investors to believe that they deal with more customers and
more credit transactions. This is appealing to customers but can steer potential
investors away if there is a steady decrease in ratios year to year. A potential ‘red flag’
that is raised in this chart is for Methode from 2004 to 2006. As stated in the change
form graph you see and a 100% increase and then a 100% decrease in a two year
span which causes investors to question their accounting methods. This could have
happened by understating their accounts receivable balance or overstating their net
sales.
Net sales/ cash from sales
This ratio assesses the company’s net sales in relation to how much cash they
received from sales compared to the amount of total revenue earned. This ratio should
be close to 1:1. If not this means the company is recognizing too much or too little as
their net sales thus creating a potential ‘red flag’ to investors. Over all this ratio should
not vary extensively from year to year or that is another potential ‘red flag’ that
suggests the company is using accounting distortions on their financial statements.
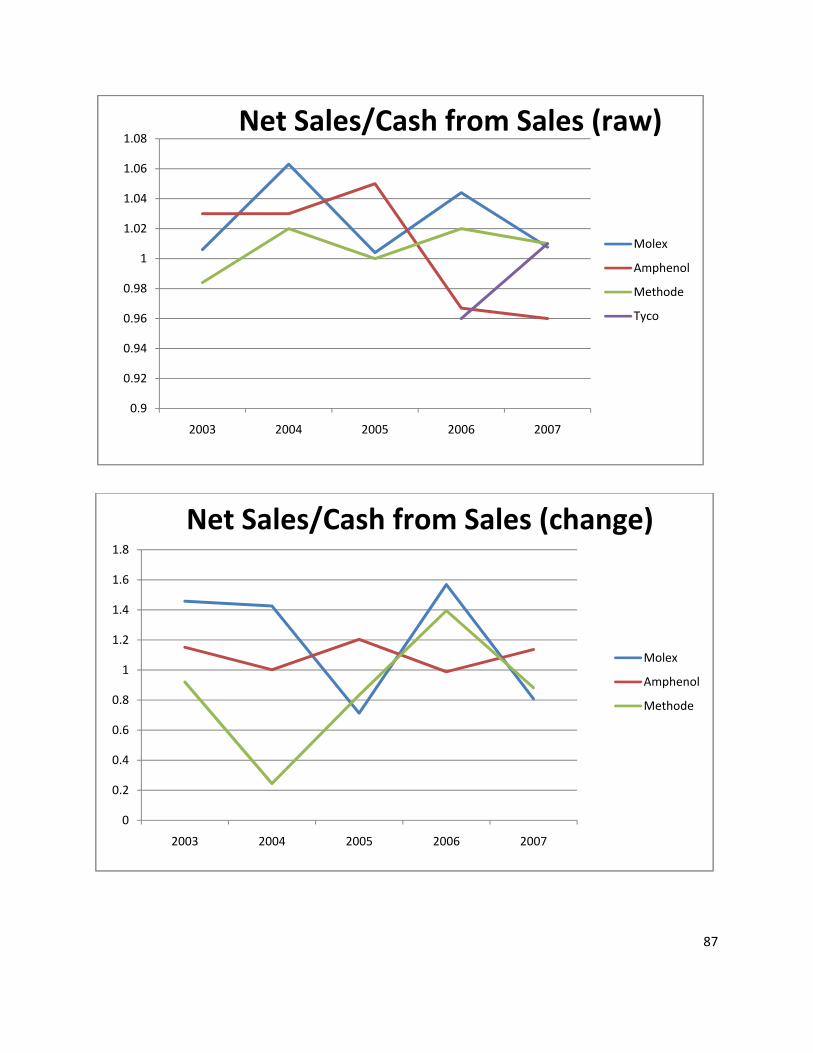
87
0.9
0.92
0.94
0.96
0.98
1
1.02
1.04
1.06
1.08
2003 2004 2005 2006 2007
Molex
Amphenol
Methode
Tyco
Net Sales/Cash from Sales (raw)
0
0.2
0.4
0.6
0.8
1
1.2
1.4
1.6
1.8
2003 2004 2005 2006 2007
Molex
Amphenol
Methode
Net Sales/Cash from Sales (change)
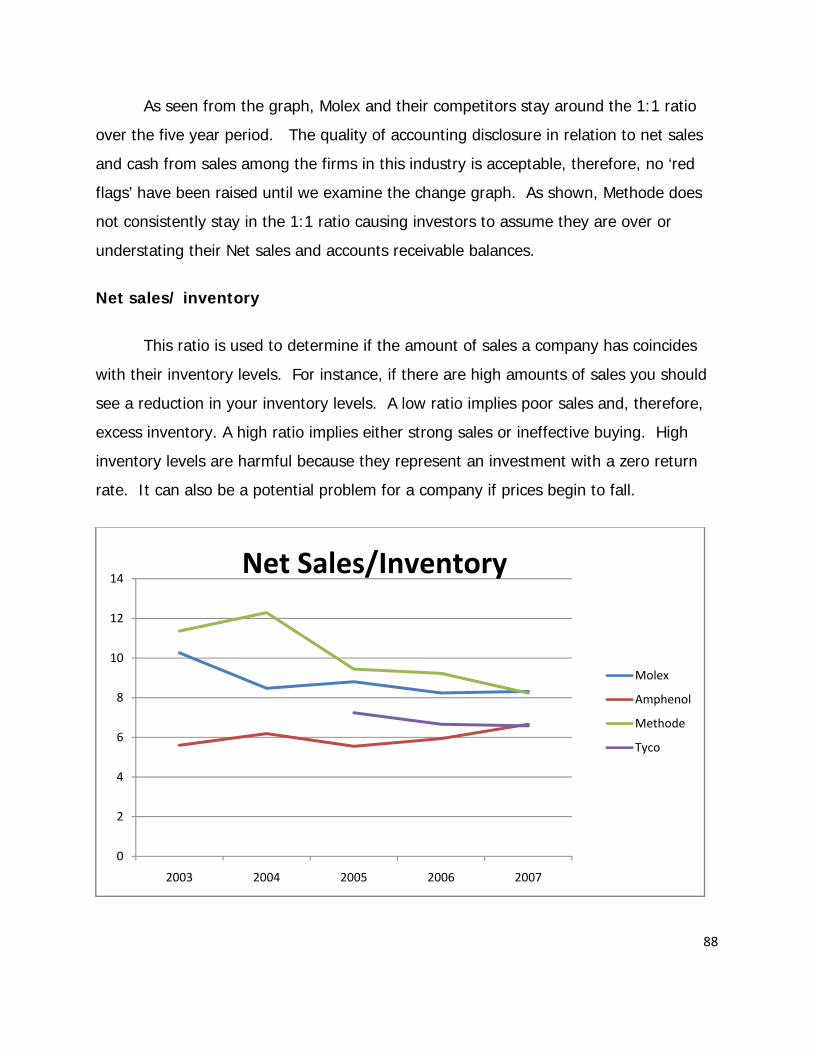
88
As seen from the graph, Molex and their competitors stay around the 1:1 ratio
over the five year period. The quality of accounting disclosure in relation to net sales
and cash from sales among the firms in this industry is acceptable, therefore, no ‘red
flags’ have been raised until we examine the change graph. As shown, Methode does
not consistently stay in the 1:1 ratio causing investors to assume they are over or
understating their Net sales and accounts receivable balances.
Net sales/ inventory
This ratio is used to determine if the amount of sales a company has coincides
with their inventory levels. For instance, if there are high amounts of sales you should
see a reduction in your inventory levels. A low ratio implies poor sales and, therefore,
excess inventory. A high ratio implies either strong sales or ineffective buying. High
inventory levels are harmful because they represent an investment with a zero return
rate. It can also be a potential problem for a company if prices begin to fall.
0
2
4
6
8
10
12
14
2003 2004 2005 2006 2007
Molex
Amphenol
Methode
Tyco
Net Sales/Inventory
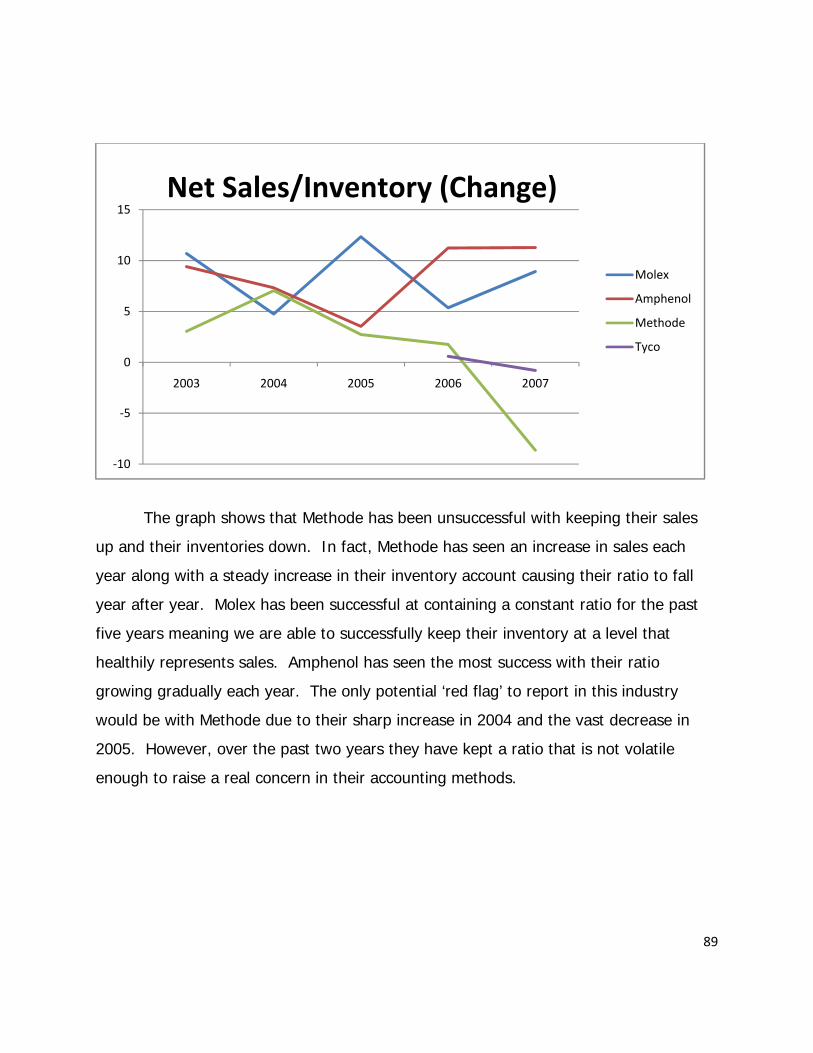
89
The graph shows that Methode has been unsuccessful with keeping their sales
up and their inventories down. In fact, Methode has seen an increase in sales each
year along with a steady increase in their inventory account causing their ratio to fall
year after year. Molex has been successful at containing a constant ratio for the past
five years meaning we are able to successfully keep their inventory at a level that
healthily represents sales. Amphenol has seen the most success with their ratio
growing gradually each year. The only potential ‘red flag’ to report in this industry
would be with Methode due to their sharp increase in 2004 and the vast decrease in
2005. However, over the past two years they have kept a ratio that is not volatile
enough to raise a real concern in their accounting methods.
‐10
‐5
0
5
10
15
2003 2004 2005 2006 2007
Molex
Amphenol
Methode
Tyco
Net Sales/Inventory (Change)
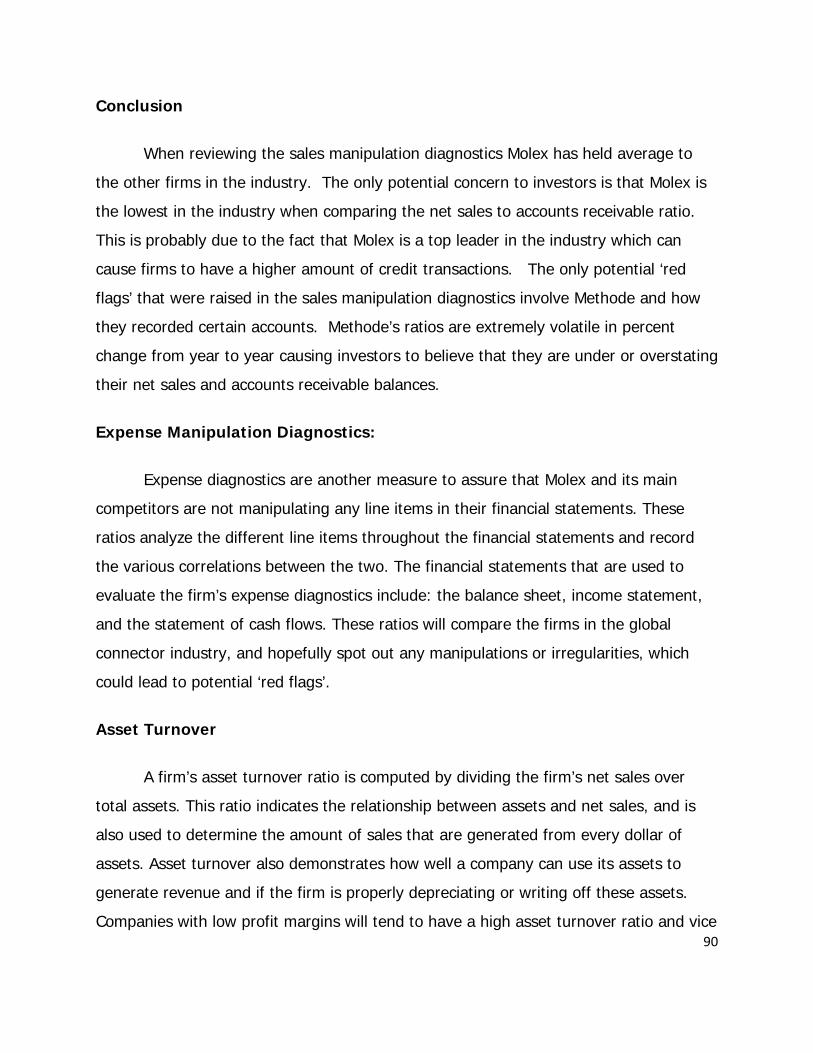
90
Conclusion
When reviewing the sales manipulation diagnostics Molex has held average to
the other firms in the industry. The only potential concern to investors is that Molex is
the lowest in the industry when comparing the net sales to accounts receivable ratio.
This is probably due to the fact that Molex is a top leader in the industry which can
cause firms to have a higher amount of credit transactions. The only potential ‘red
flags’ that were raised in the sales manipulation diagnostics involve Methode and how
they recorded certain accounts. Methode’s ratios are extremely volatile in percent
change from year to year causing investors to believe that they are under or overstating
their net sales and accounts receivable balances.
Expense Manipulation Diagnostics:
Expense diagnostics are another measure to assure that Molex and its main
competitors are not manipulating any line items in their financial statements. These
ratios analyze the different line items throughout the financial statements and record
the various correlations between the two. The financial statements that are used to
evaluate the firm’s expense diagnostics include: the balance sheet, income statement,
and the statement of cash flows. These ratios will compare the firms in the global
connector industry, and hopefully spot out any manipulations or irregularities, which
could lead to potential ‘red flags’.
Asset Turnover
A firm’s asset turnover ratio is computed by dividing the firm’s net sales over
total assets. This ratio indicates the relationship between assets and net sales, and is
also used to determine the amount of sales that are generated from every dollar of
assets. Asset turnover also demonstrates how well a company can use its assets to
generate revenue and if the firm is properly depreciating or writing off these assets.
Companies with low profit margins will tend to have a high asset turnover ratio and vice
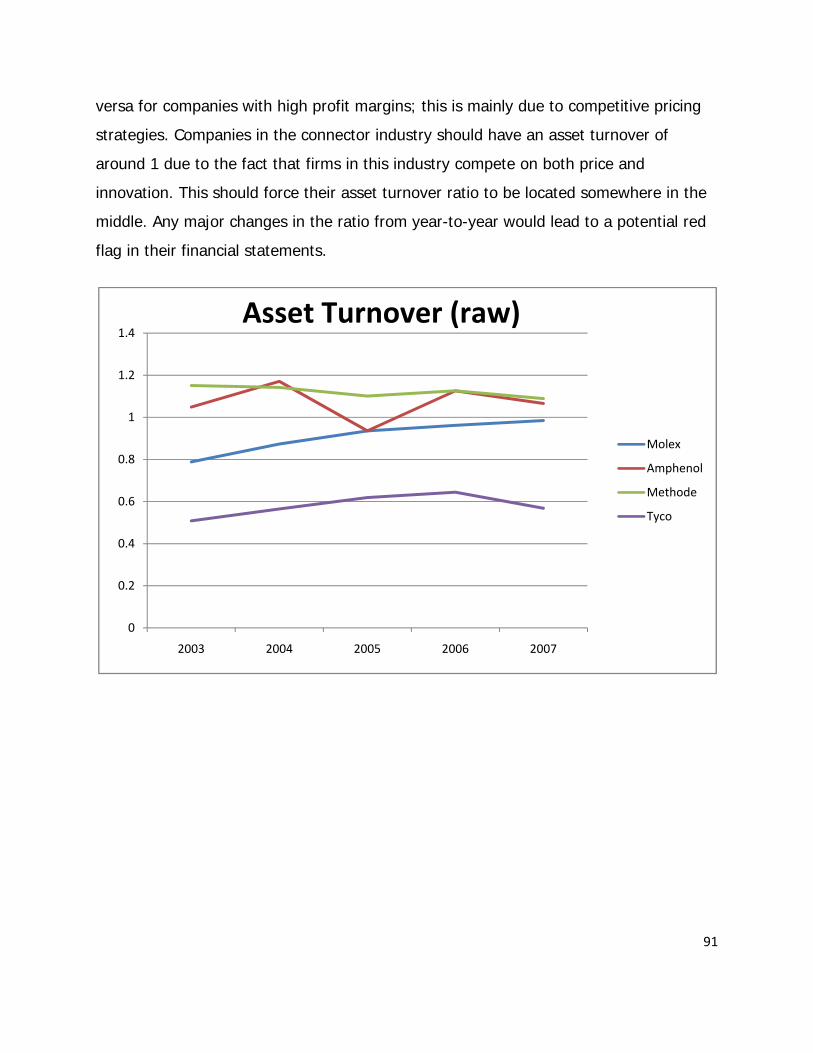
91
versa for companies with high profit margins; this is mainly due to competitive pricing
strategies. Companies in the connector industry should have an asset turnover of
around 1 due to the fact that firms in this industry compete on both price and
innovation. This should force their asset turnover ratio to be located somewhere in the
middle. Any major changes in the ratio from year-to-year would lead to a potential red
flag in their financial statements.
0
0.2
0.4
0.6
0.8
1
1.2
1.4
2003 2004 2005 2006 2007
Molex
Amphenol
Methode
Tyco
Asset Turnover (raw)

92
According to the graph, there is a moderate asset turnover ratio for the global
connector industry. This is mainly due to the two different strategies of competitive
pricing and product differentiation. However, the fact that Tyco’s ratio is so low could
indicate that they are experiencing very high profit margins because of their product
differentiation compared to the rest of the industry. This is also due to the significantly
larger amount of assets that are reported on Tyco’s balance sheet. Molex’s ratio is
steadily increasing from years 2003 to 2007, which can be explained by the large
amount of industry growth during these years. The connector industry is becoming
more competitive everyday which is driving firms to offer more competitive pricing and
in turn decreasing their profit margin.
‐3
‐2
‐1
0
1
2
3
4
2003 2004 2005 2006 2007
Molex
Amphenol
Methode
Tyco
Asset Turnover (change)
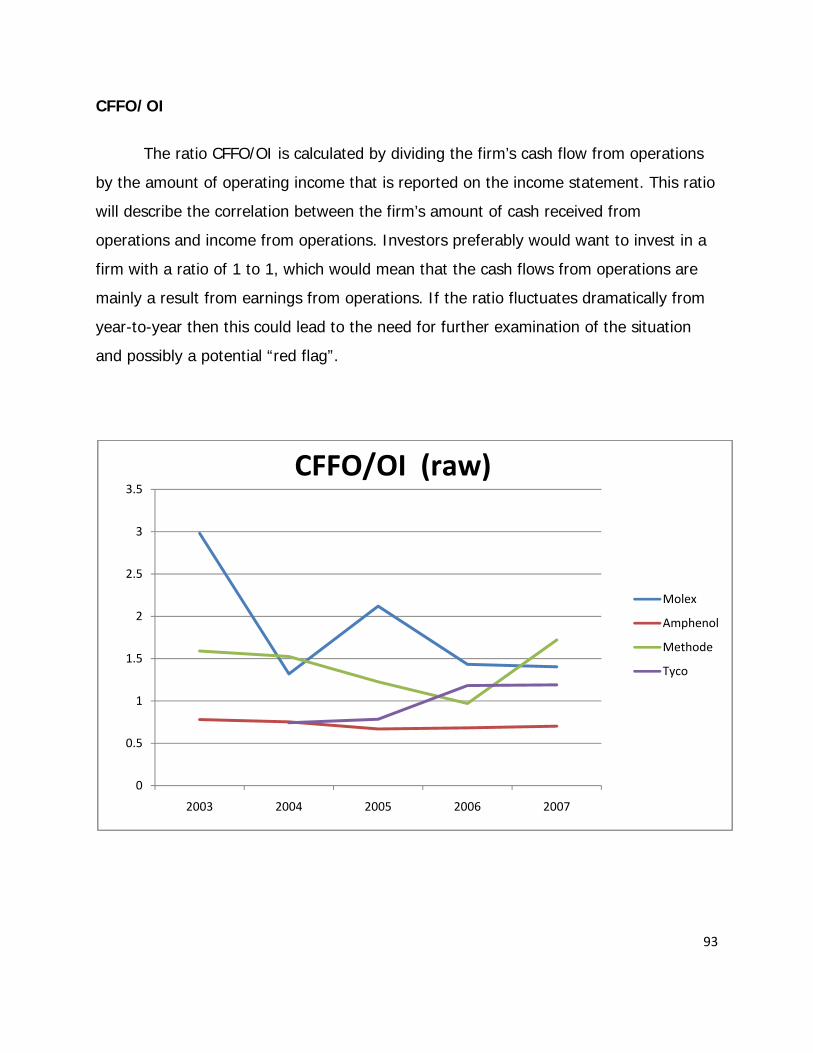
93
CFFO/OI
The ratio CFFO/OI is calculated by dividing the firm’s cash flow from operations
by the amount of operating income that is reported on the income statement. This ratio
will describe the correlation between the firm’s amount of cash received from
operations and income from operations. Investors preferably would want to invest in a
firm with a ratio of 1 to 1, which would mean that the cash flows from operations are
mainly a result from earnings from operations. If the ratio fluctuates dramatically from
year-to-year then this could lead to the need for further examination of the situation
and possibly a potential “red flag”.
0
0.5
1
1.5
2
2.5
3
3.5
2003 2004 2005 2006 2007
Molex
Amphenol
Methode
Tyco
CFFO/OI (raw)

94
According to the graphs, Amphenol has had the most consistent ratio out of its
competitors. Amphenol has seen a steady growth rate in both its cash flows from
operations and also its operating income. Methode began reverting back towards 1
between the years 2003 to 2006, but then from 2006 to 2007 they had a dramatic
increase in cash flows and a very small accompanying increase in operating income.
This led to the increase in the CFFO/OI ratio from 2006 to 2007. Molex is the only
company that raises concerns because of the dramatic drop in their ratio from 2003 to
2004. This can be described by the net loss in cash flow from operations resulting in a
decrease of 4.2%. This decrease in cash flow from operations was accompanied by a
116% increase in income from operations. So after reviewing this graph and the 10-K’s
of the various companies, there seems to be no distortions in the companies’ numbers
for cash flow from operations and operating income, leading us to raise no “red flags”
‐25
‐20
‐15
‐10
‐5
0
5
10
15
2003 2004 2005 2006 2007
Molex
Amphenol
Methode
Tyco
CFFO/OI (change)

95
CFFO/NOA
The ratio CFFO/NOA allows you to see the correlation between the firm’s cash
flow from operations and its net operating assets. A firm’s net operating assets are
fixed assets which include property, plant, and equipment or PP&E. A large CFFO/NOA
ratio indicates that the company is making more efficient use of its operating assets and
how these assets generate can inflows. A firm could record a significant increase in
cash flow from operations or a decrease in operating assets which would lead to the
ratio being manipulated in order to better portray the CFFO/NOA ratio.
0
0.2
0.4
0.6
0.8
1
1.2
1.4
2003 2004 2005 2006 2007
Molex
Amphenol
Methode
Tyco
CFFO/NOA (raw)
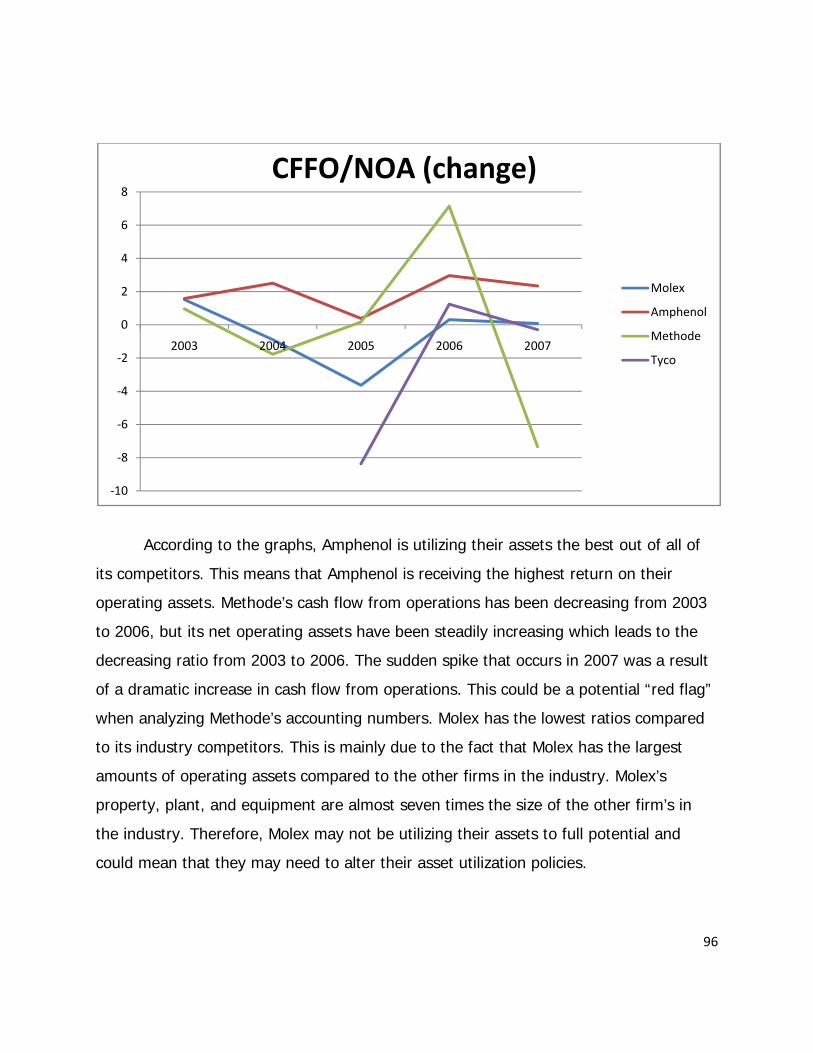
96
According to the graphs, Amphenol is utilizing their assets the best out of all of
its competitors. This means that Amphenol is receiving the highest return on their
operating assets. Methode’s cash flow from operations has been decreasing from 2003
to 2006, but its net operating assets have been steadily increasing which leads to the
decreasing ratio from 2003 to 2006. The sudden spike that occurs in 2007 was a result
of a dramatic increase in cash flow from operations. This could be a potential “red flag”
when analyzing Methode’s accounting numbers. Molex has the lowest ratios compared
to its industry competitors. This is mainly due to the fact that Molex has the largest
amounts of operating assets compared to the other firms in the industry. Molex’s
property, plant, and equipment are almost seven times the size of the other firm’s in
the industry. Therefore, Molex may not be utilizing their assets to full potential and
could mean that they may need to alter their asset utilization policies.
‐10
‐8
‐6
‐4
‐2
0
2
4
6
8
2003 2004 2005 2006 2007
Molex
Amphenol
Methode
Tyco
CFFO/NOA (change)

97
Total accruals/Total Sales
The ratio total accrual/total sales allows you to determine the correlation
between a firm’s accruals and sales. The ratio is calculated by taking a firm’s cash flow
from operations and subtracting out the net earnings of that period. Then you take the
previous amount and divide it by the total sales for that period. This ratio will allow us
to determine how well a company’s sales are derived. If the ratio is relatively higher
than 1 then we can conclude that most of the firms’ sales are accounts receivable. On
the other hand, if it is relatively lower than one then we can conclude that most sales
were made on some form other than credit accounts. The closer the firms’ ratio is to
one then the more diverse the company is between the two different payment forms.
However, as you can see below none of the firm’s are even close to one, suggesting
that the majority of their sales could be made on a non-credit basis.
0
0.02
0.04
0.06
0.08
0.1
0.12
0.14
0.16
0.18
2003 2004 2005 2006 2007
Molex
Amphenol
Methode
Tyco
Total Accruals/Total Sales (raw)
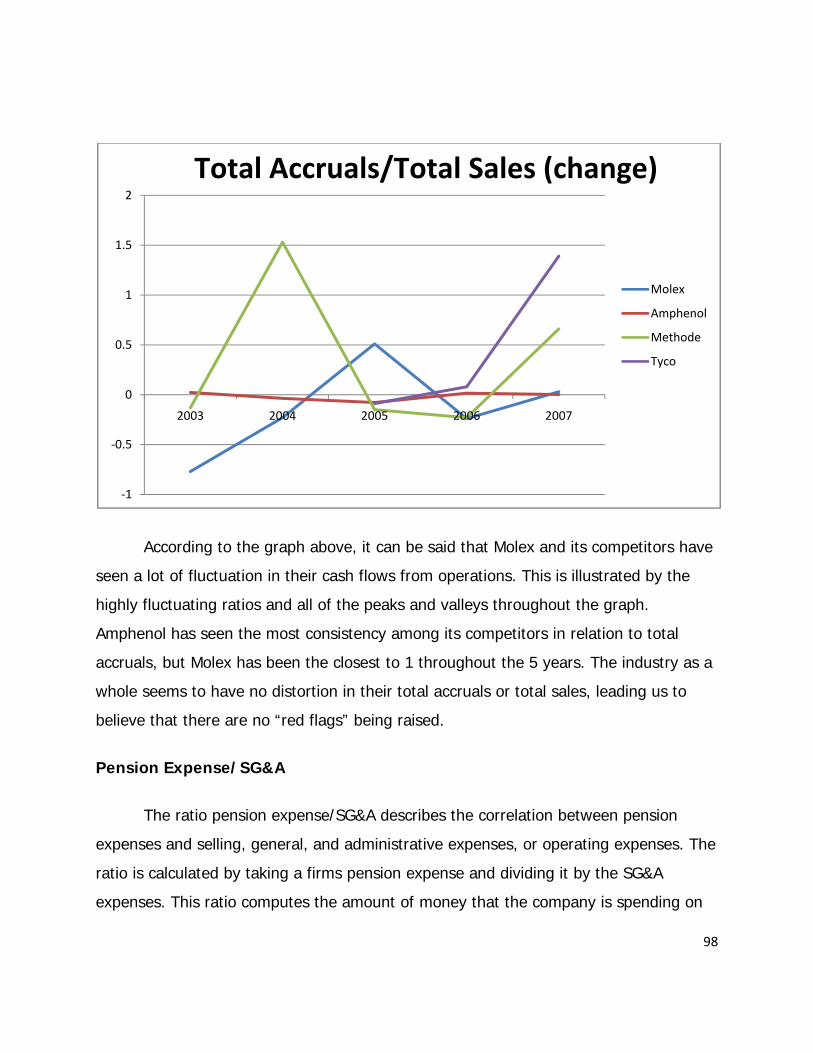
98
According to the graph above, it can be said that Molex and its competitors have
seen a lot of fluctuation in their cash flows from operations. This is illustrated by the
highly fluctuating ratios and all of the peaks and valleys throughout the graph.
Amphenol has seen the most consistency among its competitors in relation to total
accruals, but Molex has been the closest to 1 throughout the 5 years. The industry as a
whole seems to have no distortion in their total accruals or total sales, leading us to
believe that there are no “red flags” being raised.
Pension Expense/SG&A
The ratio pension expense/SG&A describes the correlation between pension
expenses and selling, general, and administrative expenses, or operating expenses. The
ratio is calculated by taking a firms pension expense and dividing it by the SG&A
expenses. This ratio computes the amount of money that the company is spending on
‐1
‐0.5
0
0.5
1
1.5
2
2003 2004 2005 2006 2007
Molex
Amphenol
Methode
Tyco
Total Accruals/Total Sales (change)
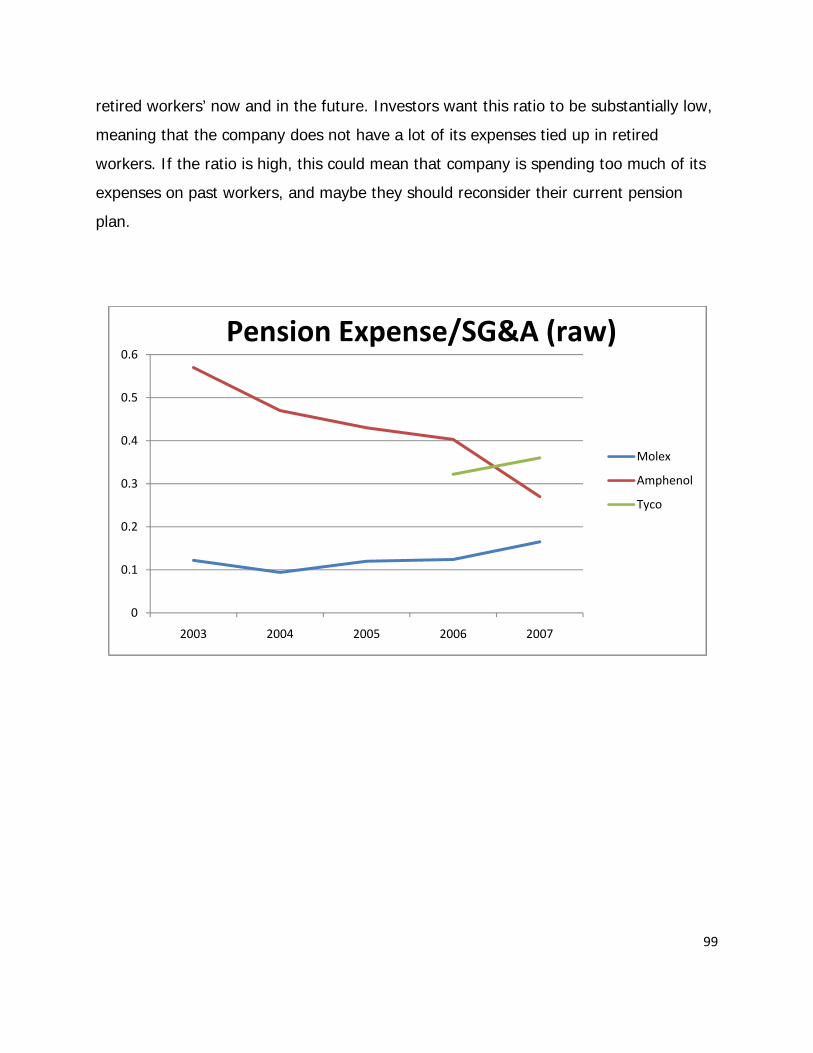
99
retired workers’ now and in the future. Investors want this ratio to be substantially low,
meaning that the company does not have a lot of its expenses tied up in retired
workers. If the ratio is high, this could mean that company is spending too much of its
expenses on past workers, and maybe they should reconsider their current pension
plan.
0
0.1
0.2
0.3
0.4
0.5
0.6
2003 2004 2005 2006 2007
Molex
Amphenol
Tyco
Pension Expense/SG&A (raw)
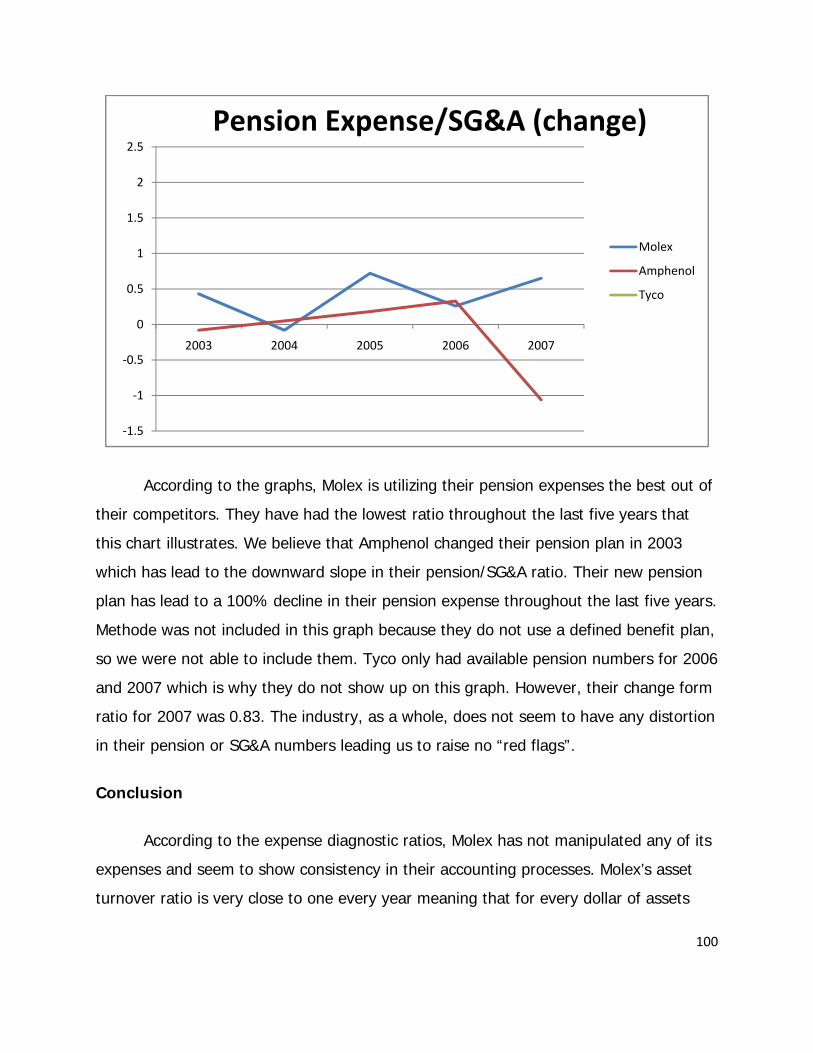
100
According to the graphs, Molex is utilizing their pension expenses the best out of
their competitors. They have had the lowest ratio throughout the last five years that
this chart illustrates. We believe that Amphenol changed their pension plan in 2003
which has lead to the downward slope in their pension/SG&A ratio. Their new pension
plan has lead to a 100% decline in their pension expense throughout the last five years.
Methode was not included in this graph because they do not use a defined benefit plan,
so we were not able to include them. Tyco only had available pension numbers for 2006
and 2007 which is why they do not show up on this graph. However, their change form
ratio for 2007 was 0.83. The industry, as a whole, does not seem to have any distortion
in their pension or SG&A numbers leading us to raise no “red flags”.
Conclusion
According to the expense diagnostic ratios, Molex has not manipulated any of its
expenses and seem to show consistency in their accounting processes. Molex’s asset
turnover ratio is very close to one every year meaning that for every dollar of assets
‐1.5
‐1
‐0.5
0
0.5
1
1.5
2
2.5
2003 2004 2005 2006 2007
Molex
Amphenol
Tyco
Pension Expense/SG&A (change)
101
they have a dollar in sales. They have maintained very consistent CFFO/OI and Pension
Expense/SG&A ratios for the last five years, leading the industry in both from 2004 to
2007. Molex lags behind according to the CFFO/NOA ratio, meaning that they might not
be utilizing their property, plant, and equipment to its full potential. Although Molex’s
numbers fluctuate from year-to-year, we did not find any manipulations in their
financials that would cause us to raise any “red flags”.
Potential Red Flags
A potential red flag is when issues arise in the financial statements that are
questionable and are unexplained. Unexplained concerns can be a sudden growth in
profit, gaps between statements, large write-offs, and other things of that nature.
These types of signs help analysts to see what they need to look into more than what
has been presented. In order to get real picture of the company an analyst has to look
at past year’s financial statements in order to see how accounts have come to be what
they are. Not all questionable items are red flags, but it is up to the analysts to
determine what is and is not. Once all the red flags have been identified then proper
measures can be taken to fix the distortions.
When reviewing Molex’s financial statements a red flag was raised in the
impairment of goodwill. The company has not reported any impairment of goodwill
since the fiscal year of 2005. When digging deeper into the issue it was discovered that
the reasoning behind this is issue is that in 2006 the acquisition of Woodhead
Industries, Inc. was completed. Molex went from impairing $22.9 million of goodwill in
2005 to zero in 2006 and on (Molex 10-k). Molex is overvaluing their new acquired
company by not impairing their goodwill. A company that does not report impairment
of goodwill ends up overstating their assets and understating their expenses in order to
portray that the company is better off than it actual is. An analyst would conclude that
Molex’s lack of impairment has distorted the numbers on the financials, so in order to
have the true value of the company goodwill must be restated.
102
When a red flag is raised it is imperative for an analysts to review the situation
thoroughly and even go to the step of restating the financial statements is it is a big
enough issue. With Molex’s goodwill a red flag was raised due to the company amount
reported each year with only having impairment one year between the fiscal years of
2002 and 2008. This problem was to the point that the net income was highly distorted
and needed to be restated. The following section shows the restated income statement
and balance sheet.
Undoing Accounting Distortion
When a company has a serious red flag raised it is crucial that an analyst gather
information and restate the financial statements to give an accurate assessment of the
company’s value. By calculating a more accurate value of a company a clearer view of
the company’s assets, earnings, expenses, and revenues can be created. With Molex
having taken a “big bath”, understating the company’s earnings to manipulate the
income statement, the past few years they have managed to make their net income
look fantastic. The reality of the company’s financial statements is shown in the
following tables.
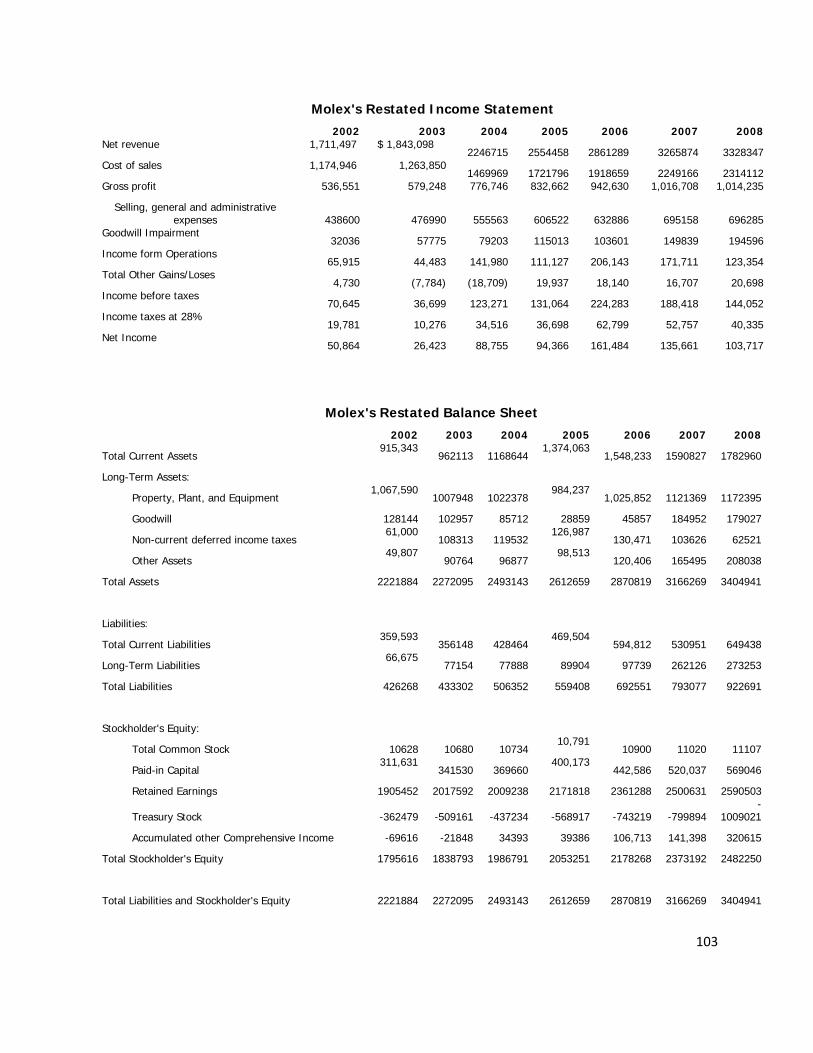
103
Molex's Restated Income Statement
2002 2003 2004 2005 2006 2007 2008 Net revenue 1,711,497 $ 1,843,098
2246715 2554458 2861289 3265874 3328347 Cost of sales 1,174,946 1,263,850
1469969 1721796 1918659 2249166 2314112 Gross profit 536,551 579,248 776,746 832,662 942,630 1,016,708 1,014,235
Selling, general and administrative expenses 438600 476990 555563 606522 632886 695158 696285
Goodwill Impairment 32036 57775 79203 115013 103601 149839 194596
Income form Operations 65,915 44,483 141,980 111,127 206,143 171,711 123,354
Total Other Gains/Loses 4,730 (7,784) (18,709) 19,937 18,140 16,707 20,698
Income before taxes 70,645 36,699 123,271 131,064 224,283 188,418 144,052
Income taxes at 28% 19,781 10,276 34,516 36,698 62,799 52,757 40,335
Net Income 50,864 26,423 88,755 94,366 161,484 135,661 103,717
Molex's Restated Balance Sheet
2002 2003 2004 2005 2006 2007 2008
Total Current Assets 915,343
962113 1168644 1,374,063
1,548,233 1590827 1782960
Long-Term Assets:
Property, Plant, and Equipment 1,067,590
1007948 1022378 984,237
1,025,852 1121369 1172395
Goodwill 128144 102957 85712 28859 45857 184952 179027
Non-current deferred income taxes 61,000
108313 119532 126,987
130,471 103626 62521
Other Assets 49,807
90764 96877 98,513
120,406 165495 208038
Total Assets 2221884 2272095 2493143 2612659 2870819 3166269 3404941
Liabilities:
Total Current Liabilities 359,593
356148 428464 469,504
594,812 530951 649438
Long-Term Liabilities 66,675
77154 77888 89904 97739 262126 273253
Total Liabilities 426268 433302 506352 559408 692551 793077 922691
Stockholder's Equity:
Total Common Stock 10628 10680 10734 10,791
10900 11020 11107
Paid-in Capital 311,631
341530 369660 400,173
442,586 520,037 569046
Retained Earnings 1905452 2017592 2009238 2171818 2361288 2500631 2590503
Treasury Stock -362479 -509161 -437234 -568917 -743219 -799894 -
1009021
Accumulated other Comprehensive Income -69616 -21848 34393 39386 106,713 141,398 320615
Total Stockholder's Equity 1795616 1838793 1986791 2053251 2178268 2373192 2482250
Total Liabilities and Stockholder's Equity 2221884 2272095 2493143 2612659 2870819 3166269 3404941

104
Goodwill
Molex’s Goodwill as a Percent of Long-Term Assets
2002 2003 2004 2005 2006 2007 2008
14.34% 14.63% 14.73% 13.29% 13.04% 26.02% 27.07%
On Molex’s financials goodwill was the asset that raised a red flag and has been
restated. The asset goodwill has been up to 27.07% of the company’s long-term assets
in the past seven years. The table below shows the exact percent, for the past seven
years, that goodwill is of long-term assets before the goodwill impairment adjusted.
Molex’s Impairment of Goodwill
2002 2003 2004 2005 2006 2007 2008
Goodwill
Before
Impairment
160,180 160732 164915 143872 149458 334791 373623
Goodwill
After
Impairment
128,144 102,957 85,712 28,859 45,857 184,952 179,027
In the process of restating the goodwill of the company it was extended back to
2002 so that the growth of the distortion can be shown. The first step to restating
goodwill is to impair the asset so that the distortion amount can come out and the
financials and from there it can be corrected. In order to calculate an accurate amount
for goodwill, an impairment of 20% was applied to the asset. The following table
shows the before and after the 20% goodwill impairment was applied.
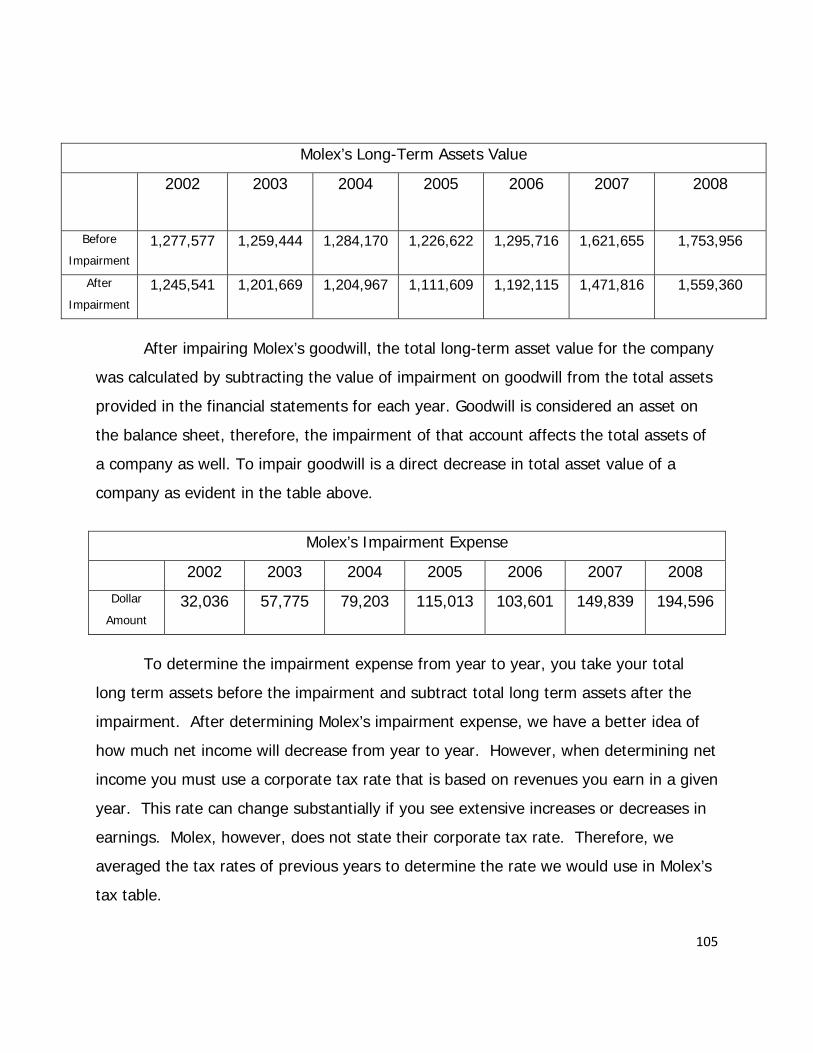
105
Molex’s Long-Term Assets Value
2002 2003 2004 2005 2006 2007 2008
Before
Impairment
1,277,577 1,259,444 1,284,170 1,226,622 1,295,716 1,621,655 1,753,956
After
Impairment
1,245,541 1,201,669 1,204,967 1,111,609 1,192,115 1,471,816 1,559,360
After impairing Molex’s goodwill, the total long-term asset value for the company
was calculated by subtracting the value of impairment on goodwill from the total assets
provided in the financial statements for each year. Goodwill is considered an asset on
the balance sheet, therefore, the impairment of that account affects the total assets of
a company as well. To impair goodwill is a direct decrease in total asset value of a
company as evident in the table above.
Molex’s Impairment Expense
2002 2003 2004 2005 2006 2007 2008
Dollar
Amount 32,036 57,775 79,203 115,013 103,601 149,839 194,596
To determine the impairment expense from year to year, you take your total
long term assets before the impairment and subtract total long term assets after the
impairment. After determining Molex’s impairment expense, we have a better idea of
how much net income will decrease from year to year. However, when determining net
income you must use a corporate tax rate that is based on revenues you earn in a given
year. This rate can change substantially if you see extensive increases or decreases in
earnings. Molex, however, does not state their corporate tax rate. Therefore, we
averaged the tax rates of previous years to determine the rate we would use in Molex’s
tax table.
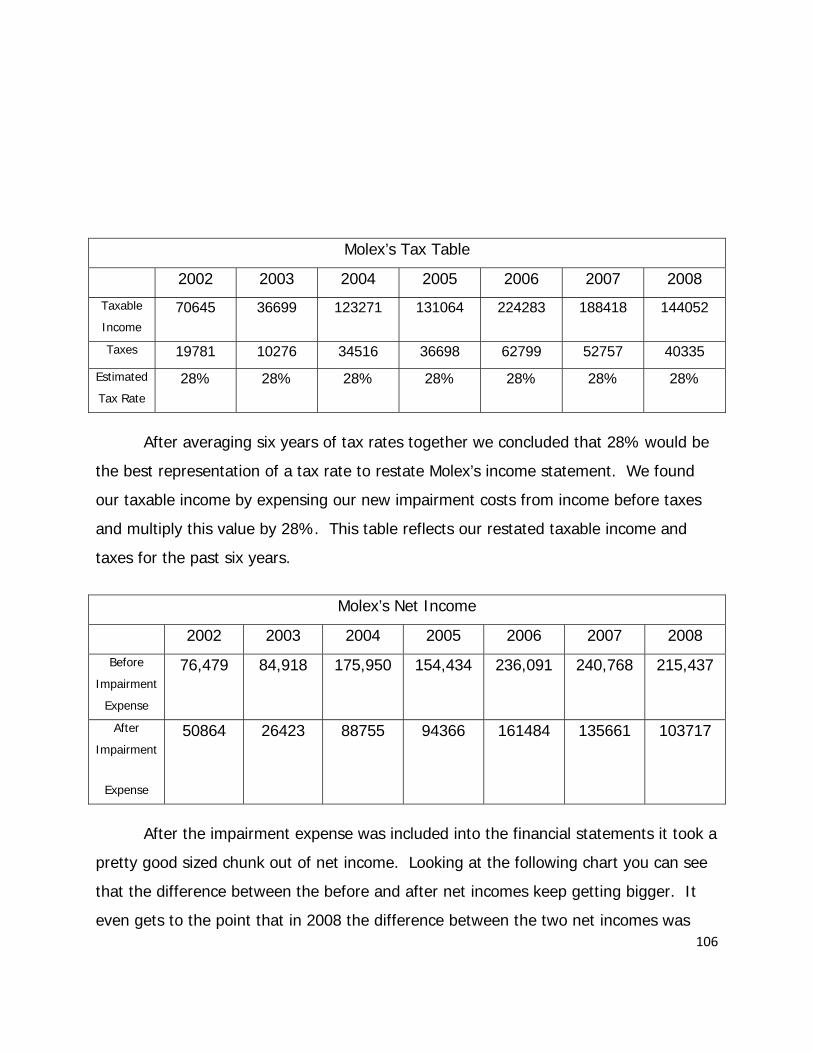
106
Molex’s Tax Table
2002 2003 2004 2005 2006 2007 2008
Taxable
Income
70645 36699 123271 131064 224283 188418 144052
Taxes 19781 10276 34516 36698 62799 52757 40335
Estimated
Tax Rate
28% 28% 28% 28% 28% 28% 28%
After averaging six years of tax rates together we concluded that 28% would be
the best representation of a tax rate to restate Molex’s income statement. We found
our taxable income by expensing our new impairment costs from income before taxes
and multiply this value by 28%. This table reflects our restated taxable income and
taxes for the past six years.
Molex’s Net Income
2002 2003 2004 2005 2006 2007 2008
Before
Impairment
Expense
76,479 84,918 175,950 154,434 236,091 240,768 215,437
After
Impairment
Expense
50864 26423 88755 94366 161484 135661 103717
After the impairment expense was included into the financial statements it took a
pretty good sized chunk out of net income. Looking at the following chart you can see
that the difference between the before and after net incomes keep getting bigger. It
even gets to the point that in 2008 the difference between the two net incomes was
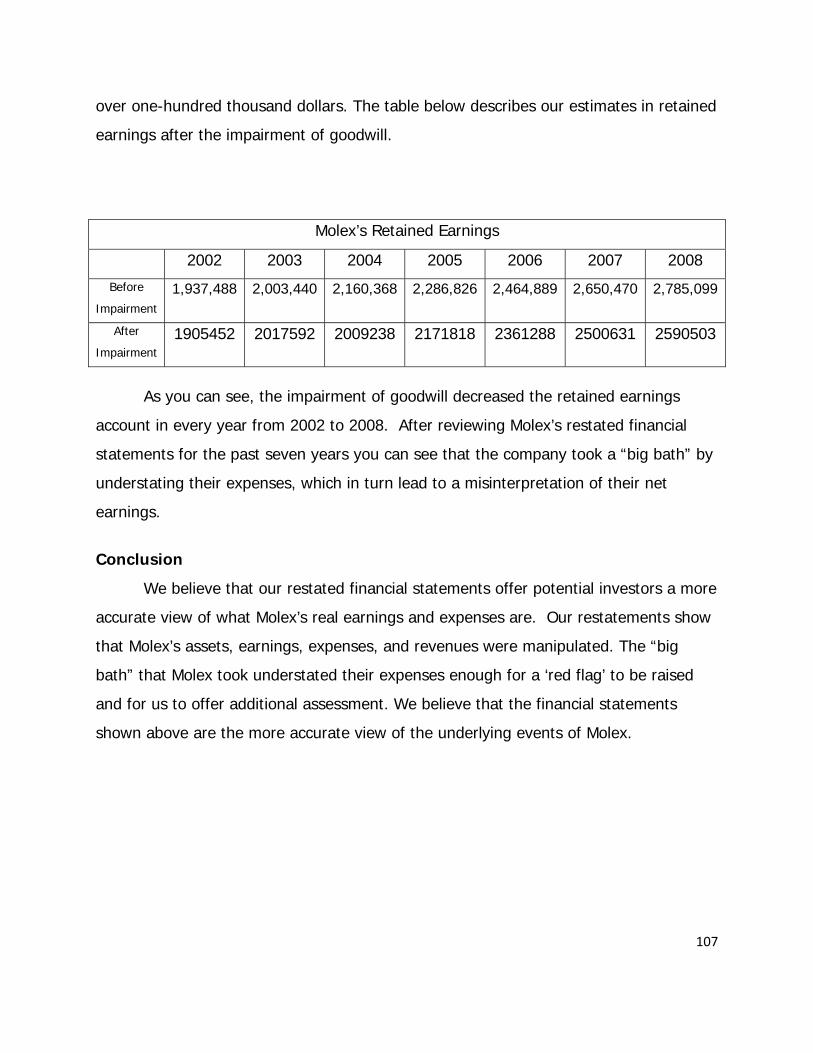
107
over one-hundred thousand dollars. The table below describes our estimates in retained
earnings after the impairment of goodwill.
Molex’s Retained Earnings
2002 2003 2004 2005 2006 2007 2008
Before
Impairment
1,937,488 2,003,440 2,160,368 2,286,826 2,464,889 2,650,470 2,785,099
After
Impairment 1905452 2017592 2009238 2171818 2361288 2500631 2590503
As you can see, the impairment of goodwill decreased the retained earnings
account in every year from 2002 to 2008. After reviewing Molex’s restated financial
statements for the past seven years you can see that the company took a “big bath” by
understating their expenses, which in turn lead to a misinterpretation of their net
earnings.
Conclusion
We believe that our restated financial statements offer potential investors a more
accurate view of what Molex’s real earnings and expenses are. Our restatements show
that Molex’s assets, earnings, expenses, and revenues were manipulated. The “big
bath” that Molex took understated their expenses enough for a ‘red flag’ to be raised
and for us to offer additional assessment. We believe that the financial statements
shown above are the more accurate view of the underlying events of Molex.
108
Financial Analysis, Forecast Financials, and Cost of Capital Estimation
To successfully evaluate a company an analyst must complete a three step
process that includes ratio analysis, the forecasting of financials, and determining the
cost of capital of the company. The calculation of ratios allows easily comparable
numbers for the analyst to use in determining industry norms and trends. The ratios will
also be utilized in the forecasting of Molex’s financial income statement, balance sheet,
and statement of cash flows. Using data from the past 6 years we will be forecasting
Molex’s financial statements out 10 years. After completing these first two steps we will
finally compute Molex’s cost of capital that will assist us in our evaluation of the
company.
Financial Analysis
Analysts, creditors and investors frequently compare the financial statements of
competitors within a certain industry. Ratios were developed to help ease the process
by producing smaller, easily comparable numbers for these analysts to utilize. The
financial ratios can help analysts evaluate an individual firm, its competitors and its
industry. Ratios were developed to measure the liquidity, profitability and capital
structure of firms. The comparable numbers derived from these ratios allow analysts,
investors and creditors seeking information to compare data over a number of years.
These ratios will allow us to compare the financial worth of Molex compared to its
competitors and its industry.
Liquidity Ratio Analysis:
The calculation of the liquidity ratios allows analysts to measure the ability of a
firm to meet its short-term financial obligations. High liquidity ratio results reflect the
ability of a firm to keep higher levels o f assets compared to its liabilities. Therefore
high liquidity ratio results illustrate to the analyst that a firm is able to meet current
obligations if needed. Liquidity ratios include the current ratio, quick ratio, accounts

109
receivable turnover, days sales outstanding, inventory turnover, days supply inventory,
and working capital turnover.
Current Ratio:
The current ratio is calculated by dividing a firm’s current assets by its current
liabilities. This ratio helps demonstrate the firm’s ability to meet its short-term
obligations with the use of its short-term assets. As stated above, the higher the ratio,
the more capable the company is in meeting its short-term liabilities. As illustrated in
the graph and table, Molex’s current ratio is significantly higher compared to its
competitors and the industry. After observing the provided information it is evident that
Molex does not maintain a constant ratio. Its ratio increased significantly in 2007
compared to previous years, and could be a result of the acquisition of Woodhead
Industries earlier this year. Molex’s competitors’ ratios fluctuate over the years, and are
also not held at a constant. In conclusion Molex would be more than able to meet
short-term obligations if needed.
0
1
2
3
4
5
6
7
2002 2003 2004 2005 2006 2007
Molex
Molex Restated
Amphenol
Methode
Tyco
Industry Avg.
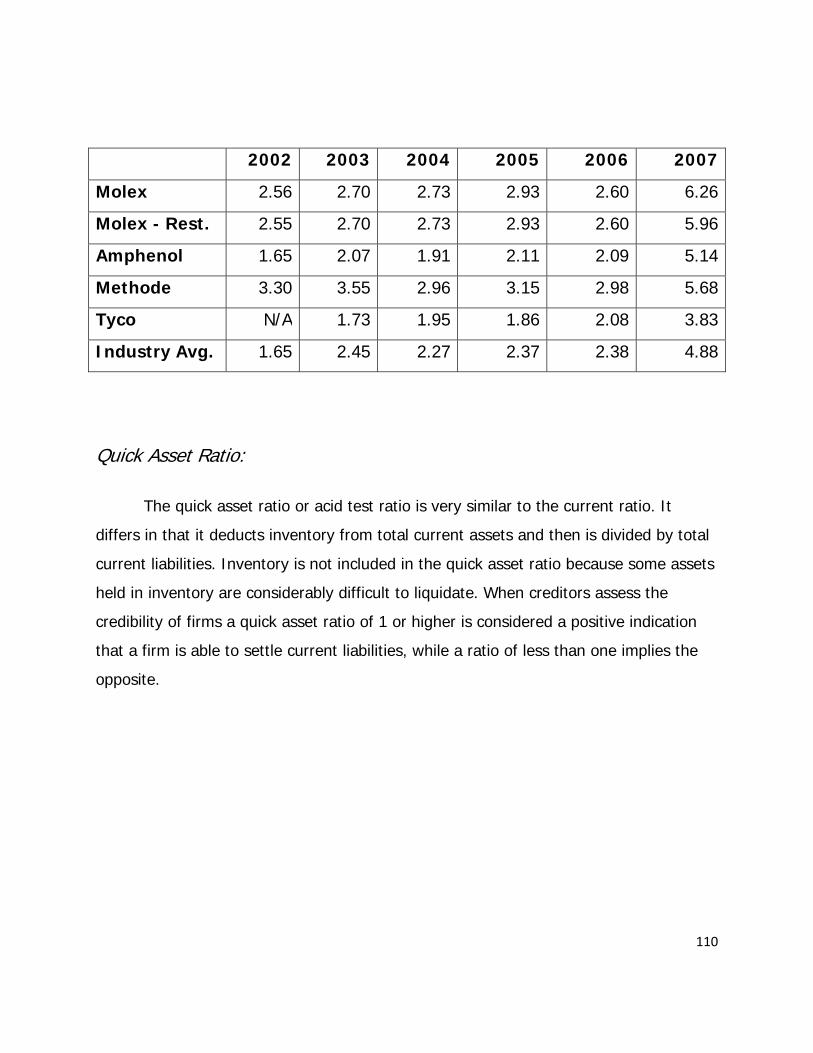
110
2002 2003 2004 2005 2006 2007
Molex 2.56 2.70 2.73 2.93 2.60 6.26
Molex - Rest. 2.55 2.70 2.73 2.93 2.60 5.96
Amphenol 1.65 2.07 1.91 2.11 2.09 5.14
Methode 3.30 3.55 2.96 3.15 2.98 5.68
Tyco N/A 1.73 1.95 1.86 2.08 3.83
Industry Avg. 1.65 2.45 2.27 2.37 2.38 4.88
Quick Asset Ratio:
The quick asset ratio or acid test ratio is very similar to the current ratio. It
differs in that it deducts inventory from total current assets and then is divided by total
current liabilities. Inventory is not included in the quick asset ratio because some assets
held in inventory are considerably difficult to liquidate. When creditors assess the
credibility of firms a quick asset ratio of 1 or higher is considered a positive indication
that a firm is able to settle current liabilities, while a ratio of less than one implies the
opposite.
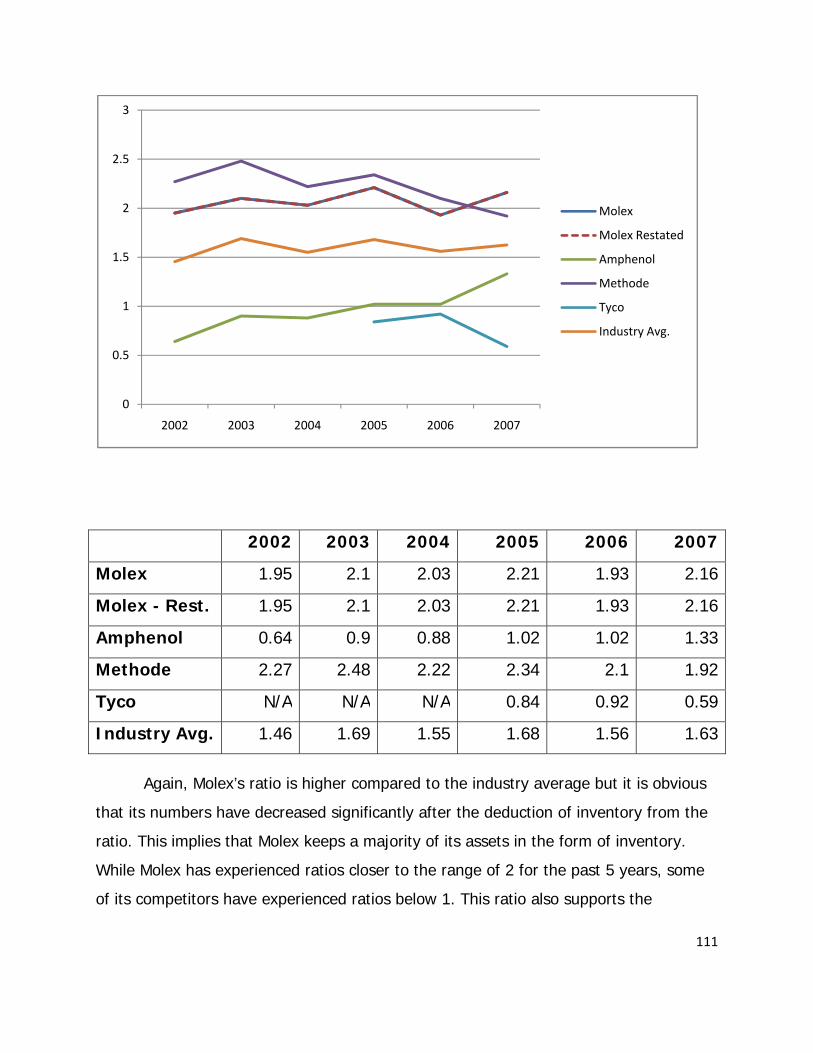
111
2002 2003 2004 2005 2006 2007
Molex 1.95 2.1 2.03 2.21 1.93 2.16
Molex - Rest. 1.95 2.1 2.03 2.21 1.93 2.16
Amphenol 0.64 0.9 0.88 1.02 1.02 1.33
Methode 2.27 2.48 2.22 2.34 2.1 1.92
Tyco N/A N/A N/A 0.84 0.92 0.59
Industry Avg. 1.46 1.69 1.55 1.68 1.56 1.63
Again, Molex’s ratio is higher compared to the industry average but it is obvious
that its numbers have decreased significantly after the deduction of inventory from the
ratio. This implies that Molex keeps a majority of its assets in the form of inventory.
While Molex has experienced ratios closer to the range of 2 for the past 5 years, some
of its competitors have experienced ratios below 1. This ratio also supports the
0
0.5
1
1.5
2
2.5
3
2002 2003 2004 2005 2006 2007
Molex
Molex Restated
Amphenol
Methode
Tyco
Industry Avg.

112
assumption that Molex would be able to meet all short-term obligations even without
the liquidation of its inventory.
Working Capital Turnover:
The working capital turnover is a calculation that helps analyze the relationship
between a firm’s assets that are used in the operations of the company and the sales
that result from the firm’s operations. The working capital turnover is calculated by
dividing a firm’s sales by its working capital. A firm’s working capital is found by
subtracting current liabilities from current assets. A high turnover is observed when a
firm is able to sell more relative to the amount needed to fund its operations.
0
1
2
3
4
5
6
7
8
2002 2003 2004 2005 2006 2007
Molex
Molex Restated
Amphenol
Methode
Tyco
Industry Avg.
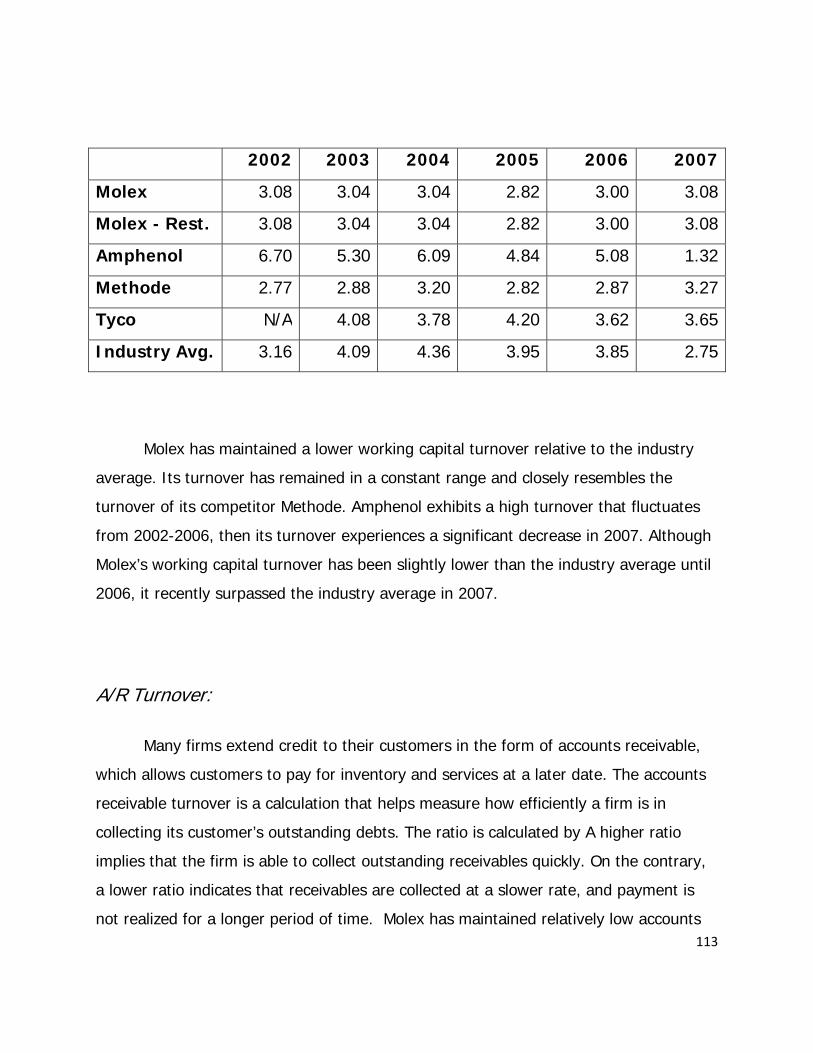
113
2002 2003 2004 2005 2006 2007
Molex 3.08 3.04 3.04 2.82 3.00 3.08
Molex - Rest. 3.08 3.04 3.04 2.82 3.00 3.08
Amphenol 6.70 5.30 6.09 4.84 5.08 1.32
Methode 2.77 2.88 3.20 2.82 2.87 3.27
Tyco N/A 4.08 3.78 4.20 3.62 3.65
Industry Avg. 3.16 4.09 4.36 3.95 3.85 2.75
Molex has maintained a lower working capital turnover relative to the industry
average. Its turnover has remained in a constant range and closely resembles the
turnover of its competitor Methode. Amphenol exhibits a high turnover that fluctuates
from 2002-2006, then its turnover experiences a significant decrease in 2007. Although
Molex’s working capital turnover has been slightly lower than the industry average until
2006, it recently surpassed the industry average in 2007.
A/R Turnover:
Many firms extend credit to their customers in the form of accounts receivable,
which allows customers to pay for inventory and services at a later date. The accounts
receivable turnover is a calculation that helps measure how efficiently a firm is in
collecting its customer’s outstanding debts. The ratio is calculated by A higher ratio
implies that the firm is able to collect outstanding receivables quickly. On the contrary,
a lower ratio indicates that receivables are collected at a slower rate, and payment is
not realized for a longer period of time. Molex has maintained relatively low accounts
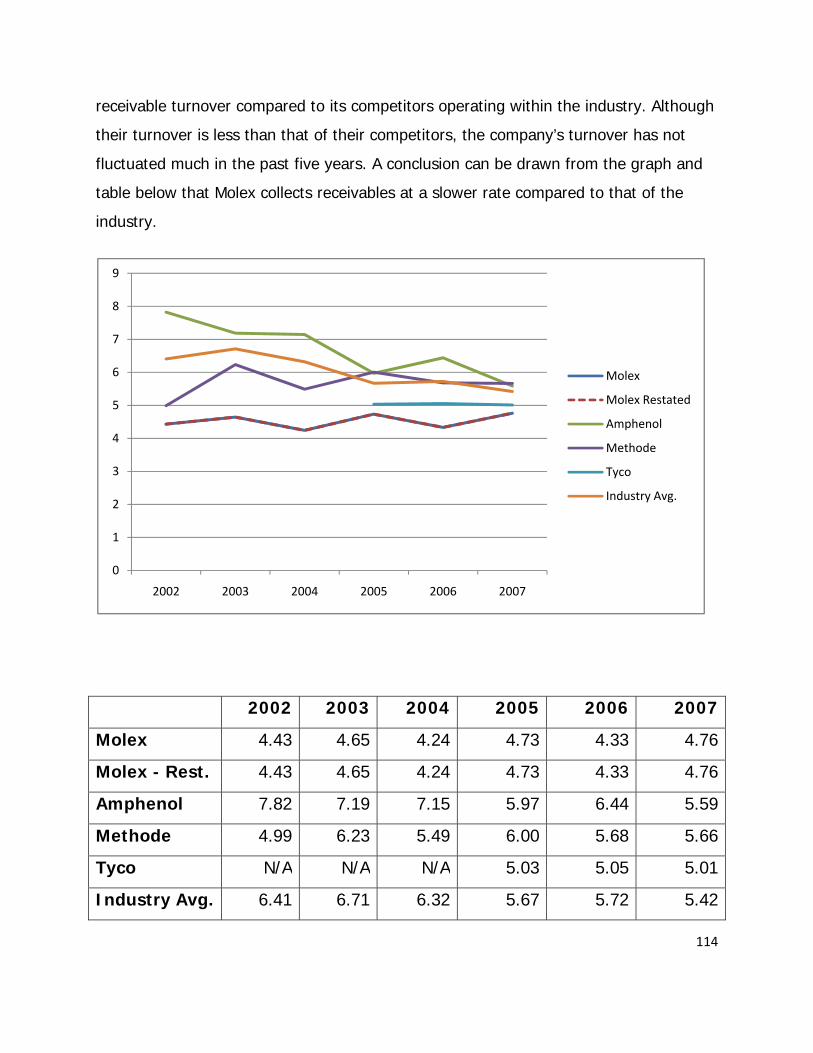
114
receivable turnover compared to its competitors operating within the industry. Although
their turnover is less than that of their competitors, the company’s turnover has not
fluctuated much in the past five years. A conclusion can be drawn from the graph and
table below that Molex collects receivables at a slower rate compared to that of the
industry.
2002 2003 2004 2005 2006 2007
Molex 4.43 4.65 4.24 4.73 4.33 4.76
Molex - Rest. 4.43 4.65 4.24 4.73 4.33 4.76
Amphenol 7.82 7.19 7.15 5.97 6.44 5.59
Methode 4.99 6.23 5.49 6.00 5.68 5.66
Tyco N/A N/A N/A 5.03 5.05 5.01
Industry Avg. 6.41 6.71 6.32 5.67 5.72 5.42
0
1
2
3
4
5
6
7
8
9
2002 2003 2004 2005 2006 2007
Molex
Molex Restated
Amphenol
Methode
Tyco
Industry Avg.
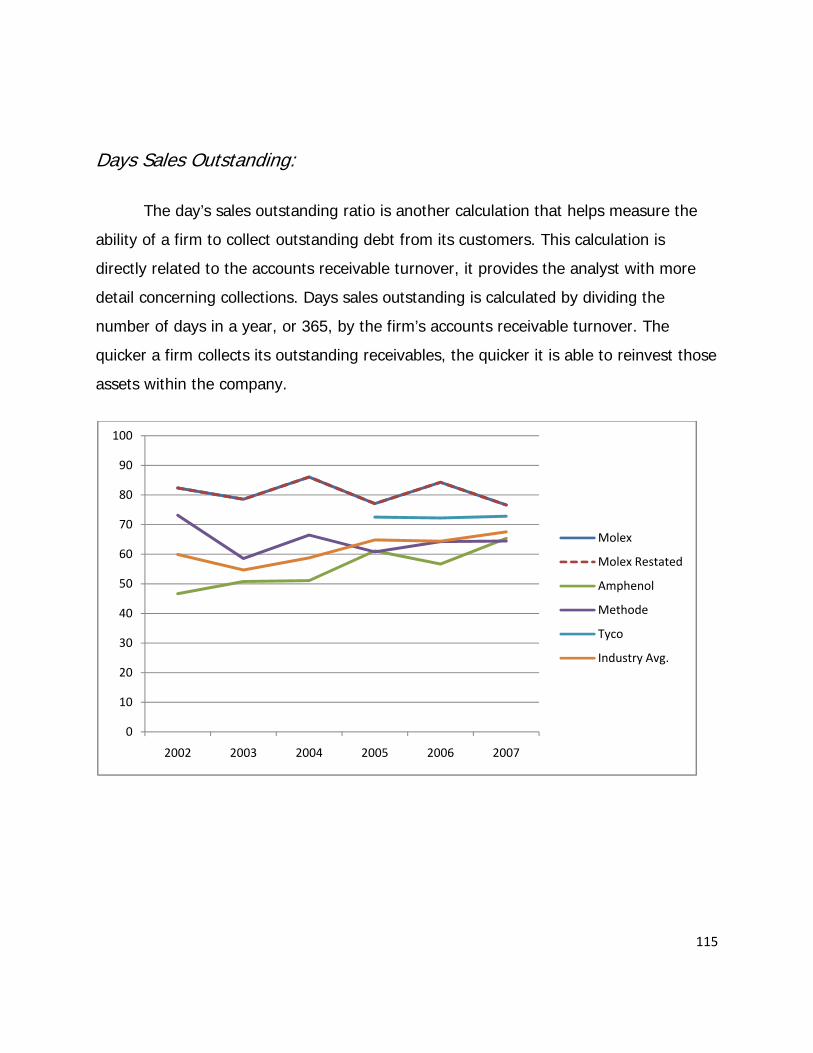
115
Days Sales Outstanding:
The day’s sales outstanding ratio is another calculation that helps measure the
ability of a firm to collect outstanding debt from its customers. This calculation is
directly related to the accounts receivable turnover, it provides the analyst with more
detail concerning collections. Days sales outstanding is calculated by dividing the
number of days in a year, or 365, by the firm’s accounts receivable turnover. The
quicker a firm collects its outstanding receivables, the quicker it is able to reinvest those
assets within the company.
0
10
20
30
40
50
60
70
80
90
100
2002 2003 2004 2005 2006 2007
Molex
Molex Restated
Amphenol
Methode
Tyco
Industry Avg.
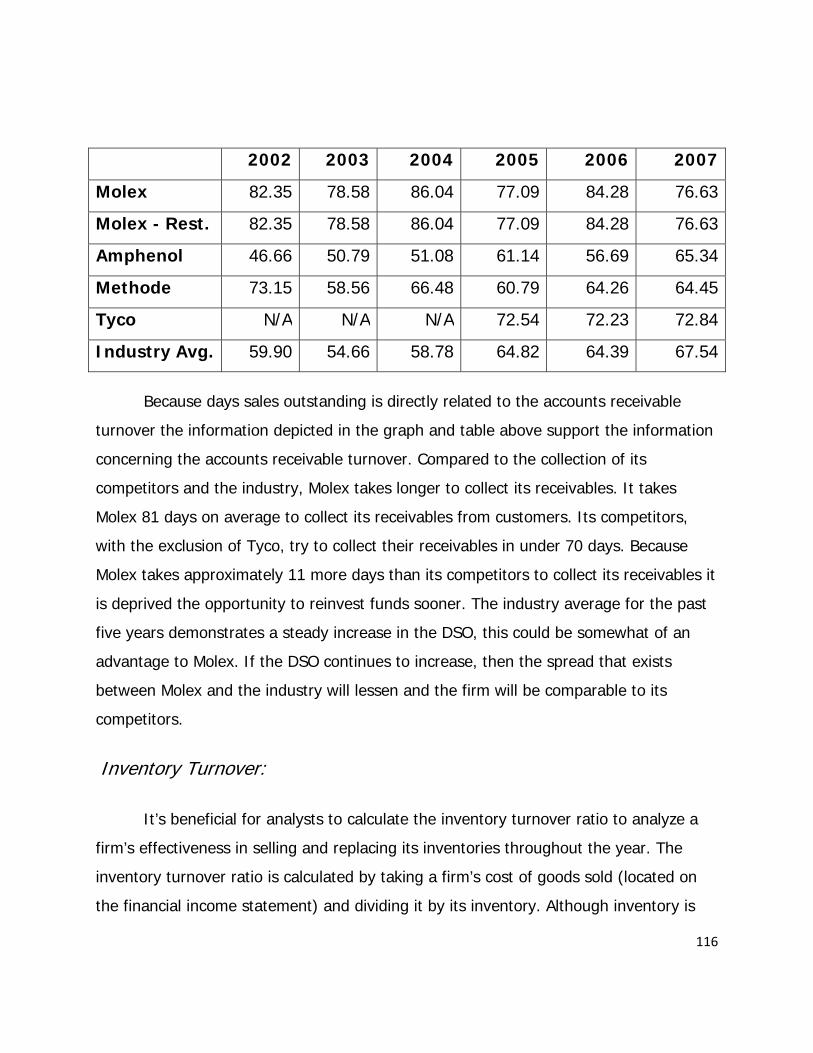
116
2002 2003 2004 2005 2006 2007
Molex 82.35 78.58 86.04 77.09 84.28 76.63
Molex - Rest. 82.35 78.58 86.04 77.09 84.28 76.63
Amphenol 46.66 50.79 51.08 61.14 56.69 65.34
Methode 73.15 58.56 66.48 60.79 64.26 64.45
Tyco N/A N/A N/A 72.54 72.23 72.84
Industry Avg. 59.90 54.66 58.78 64.82 64.39 67.54
Because days sales outstanding is directly related to the accounts receivable
turnover the information depicted in the graph and table above support the information
concerning the accounts receivable turnover. Compared to the collection of its
competitors and the industry, Molex takes longer to collect its receivables. It takes
Molex 81 days on average to collect its receivables from customers. Its competitors,
with the exclusion of Tyco, try to collect their receivables in under 70 days. Because
Molex takes approximately 11 more days than its competitors to collect its receivables it
is deprived the opportunity to reinvest funds sooner. The industry average for the past
five years demonstrates a steady increase in the DSO, this could be somewhat of an
advantage to Molex. If the DSO continues to increase, then the spread that exists
between Molex and the industry will lessen and the firm will be comparable to its
competitors.
Inventory Turnover:
It’s beneficial for analysts to calculate the inventory turnover ratio to analyze a
firm’s effectiveness in selling and replacing its inventories throughout the year. The
inventory turnover ratio is calculated by taking a firm’s cost of goods sold (located on
the financial income statement) and dividing it by its inventory. Although inventory is
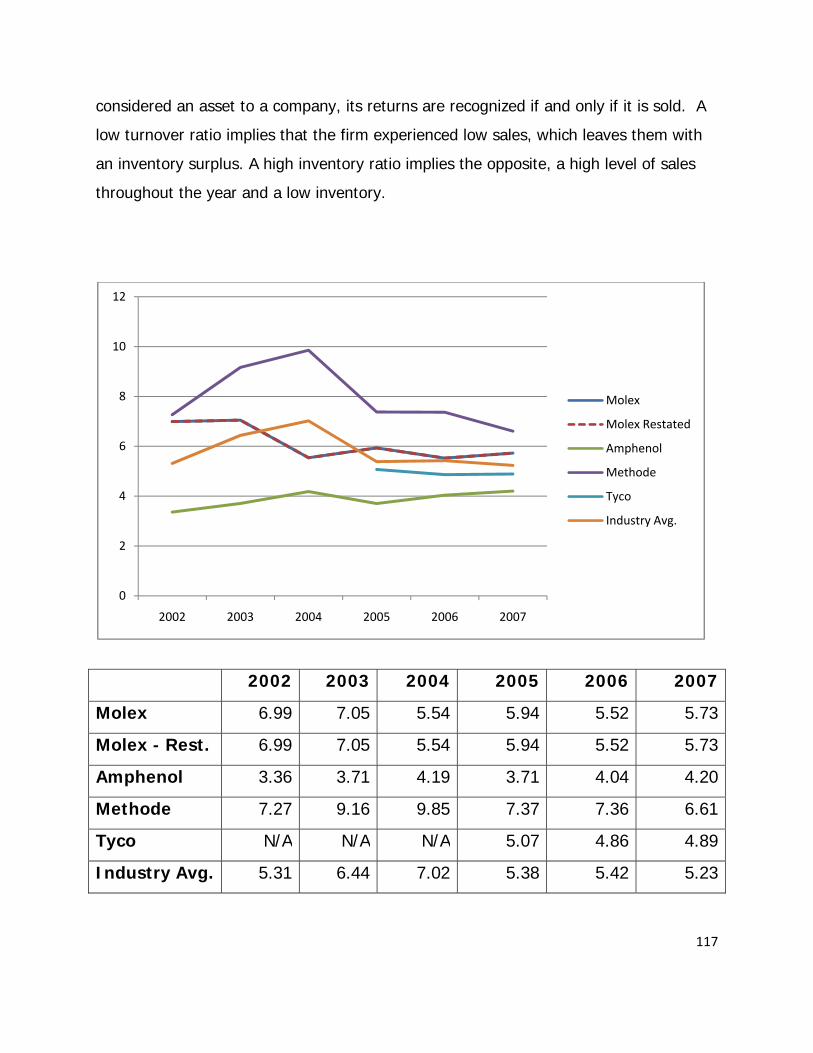
117
considered an asset to a company, its returns are recognized if and only if it is sold. A
low turnover ratio implies that the firm experienced low sales, which leaves them with
an inventory surplus. A high inventory ratio implies the opposite, a high level of sales
throughout the year and a low inventory.
2002 2003 2004 2005 2006 2007
Molex 6.99 7.05 5.54 5.94 5.52 5.73
Molex - Rest. 6.99 7.05 5.54 5.94 5.52 5.73
Amphenol 3.36 3.71 4.19 3.71 4.04 4.20
Methode 7.27 9.16 9.85 7.37 7.36 6.61
Tyco N/A N/A N/A 5.07 4.86 4.89
Industry Avg. 5.31 6.44 7.02 5.38 5.42 5.23
0
2
4
6
8
10
12
2002 2003 2004 2005 2006 2007
Molex
Molex Restated
Amphenol
Methode
Tyco
Industry Avg.

118
Molex has maintained a turnover relatively similar to the industry average, it
doesn’t have the highest or lowest compared to competitors. For the past five years
Methode has maintained the highest inventory turnover compared to its competitors
which reflects strong sales. Molex has maintained the second highest turnover ratio, its
numbers have fluctuated for the past five years. A significant decrease occurred from
2003 to 2004, which is a result in the increase of inventory. Normally evidence of
excess inventory would be considered a disadvantage, but since Molex’s ratio resembles
the industry’s it can be assumed that that the affect is minimal.
Days’ Supply in Inventory:
Like the calculation of days sales outstanding is directly related to the accounts
receivable turnover ratio, the days supply in inventory is directly related to the
inventory turnover ratio. It is calculated in much the same way, by dividing the number
of days in a year, 365, by the firm’s inventory turnover ratio. This calculation provides
the analyst with the amount of days it takes for a company to turnover its entire
inventory. The ultimate goal of a company is to sell its inventory, and therefore it is
best to have the least amount of days needed to turnover a firm’s inventory. Although
Molex’s inventory turnover closely resembled the industry average, its days supply in
inventory is on average 10-15 days less. It has taken Molex an average of 60 days to
turnover its entire inventory. It is evident that Molex takes less time to turnover its
inventory compared to Amphenol that averages 95 days to complete a full turnover of
its inventory. Methode exhibited the highest inventory turnover and therefore holds the
lowest days supply in inventory. If Molex continues to have a lower DSI relative to the
industry it can be assumed that its excess inventory poses a minimal threat regarding
competition within the industry.
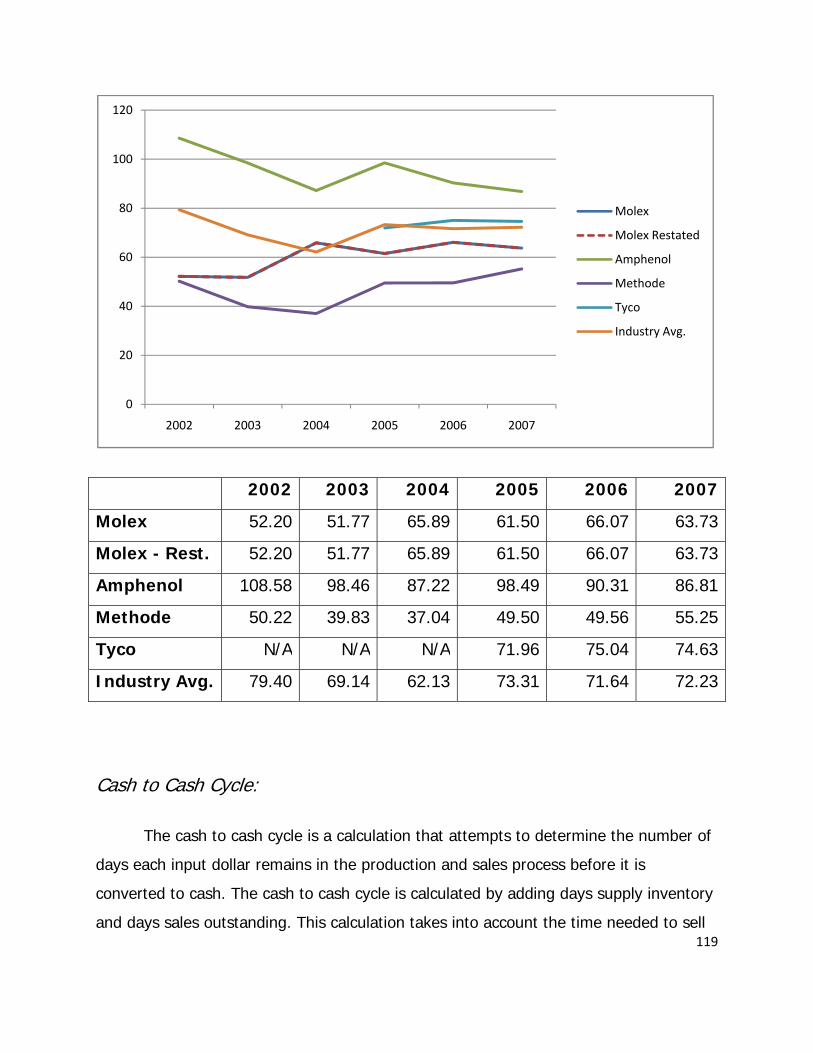
119
2002 2003 2004 2005 2006 2007
Molex 52.20 51.77 65.89 61.50 66.07 63.73
Molex - Rest. 52.20 51.77 65.89 61.50 66.07 63.73
Amphenol 108.58 98.46 87.22 98.49 90.31 86.81
Methode 50.22 39.83 37.04 49.50 49.56 55.25
Tyco N/A N/A N/A 71.96 75.04 74.63
Industry Avg. 79.40 69.14 62.13 73.31 71.64 72.23
Cash to Cash Cycle:
The cash to cash cycle is a calculation that attempts to determine the number of
days each input dollar remains in the production and sales process before it is
converted to cash. The cash to cash cycle is calculated by adding days supply inventory
and days sales outstanding. This calculation takes into account the time needed to sell
0
20
40
60
80
100
120
2002 2003 2004 2005 2006 2007
Molex
Molex Restated
Amphenol
Methode
Tyco
Industry Avg.

120
a firm’s inventory, and the time needed to collect outstanding receivables. If a firm is
able to convert its assets into cash quickly its cash to cash cycle will generally be a low
number. If a company exhibits a low cash to cash cycle they are perceived as being
more credit worthy.
2002 2003 2004 2005 2006 2007
Molex 134.6 130.3 151.9 138.6 150.3 140.1
Molex - Rest. 134.6 130.3 151.9 138.6 150.3 140.1
Amphenol 155.2 149.2 138.3 159.6 147.0 152.2
Methode 123.4 98.2 103.5 110.3 113.8 119.7
Tyco N/A N/A N/A 144.5 144.4 147.5
Industry Avg. 139.3 123.8 120.9 138.1 135.1 139.8
0
20
40
60
80
100
120
140
160
180
2002 2003 2004 2005 2006 2007
Molex
Molex Restated
Amphenol
Methode
Tyco
Industry Avg.

121
The number of days that Molex takes to convert its assets into cash has
remained closely related to the industry average, with the exclusion of 2004. In 2004
Molex’s cash to cash cycle exceeded the industry’s average by over 20 days, and then
dropped back down to relative levels in 2005. Molex’s competitor Methode has exhibited
the lowest number of days compared to its competitors and the industry average for
the past 5 years. Referring back to previous tables, we can observe that Methode
maintained a lower DSI and DSO compared to its competitors. In order for Molex to
decrease its cash to cash cycle it would have to adopt an accounts receivable collection
similar to its competitor Methode, and/or decrease the amount of days it takes to
turnover its entire inventory.
Conclusion
After calculating the various liquidity ratios, we are able to compare the liquidity
of Molex to its competitors within the industry. Molex’s current ratio is significantly
higher than its competitors and the industry. Molex’s current ratio also increased
significantly in 2007. After comparing the quick ratio of Molex and its competitors we
also see that its ratio is higher than the industry average and its competitors. We
concluded that Molex held a significant amount of inventory because its quick ratio
decreased significantly with the deduction of inventory. Molex’s low accounts receivable
turnover may indicate inefficiencies in debt collections compared to its competitors.
After examining all the liquidity ratios we can see that many of Molex’s competitors
have comparably similar ratios, while some ratios including days supply in inventory
illustrate vast differences between firms. These instances of vast differences make it
difficult to establish a trend between the competitors operating within the industry.
122
Profitability Ratio Analysis:
In this section, we will discuss Molex as well as other companies in the global
connector industry and their ability to effectively generate revenues and cover
expenses. In order to successfully analyze profitability, we will examine ratios such as
gross profit margin, operating expense ratio, net profit margin, asset turnover, return
on assets, and return on equity.
Gross Profit Margin:
Gross profit margin is calculated by taking a company’s gross profit and dividing
it by net sales. In order to determine gross profit you must take a company’s net sales
and subtract their cost of goods sold. Gross profit is used to measure if a company is
effectively generating a profit in relation to how much it costs to produce a good. Two
factors that affect gross profit margin are, “The price premium that a firm’s products or
services command in the marketplace and the efficiency of the firm’s procurement and
production process” (Palepu Healy). If gross profits are low, this usually indicates that
costs associated with making a product are high and that a company should try a more
cost effective approach to making the item or increase the selling price of the product.
A high gross profit ratio usually indicates that a company is maintaining high sales with
a healthy amount of cost of goods sold. The higher the gross profit margin the better;
this indicates that a company can successfully make profits from their sales and be able
to pay off future expenses and costs.
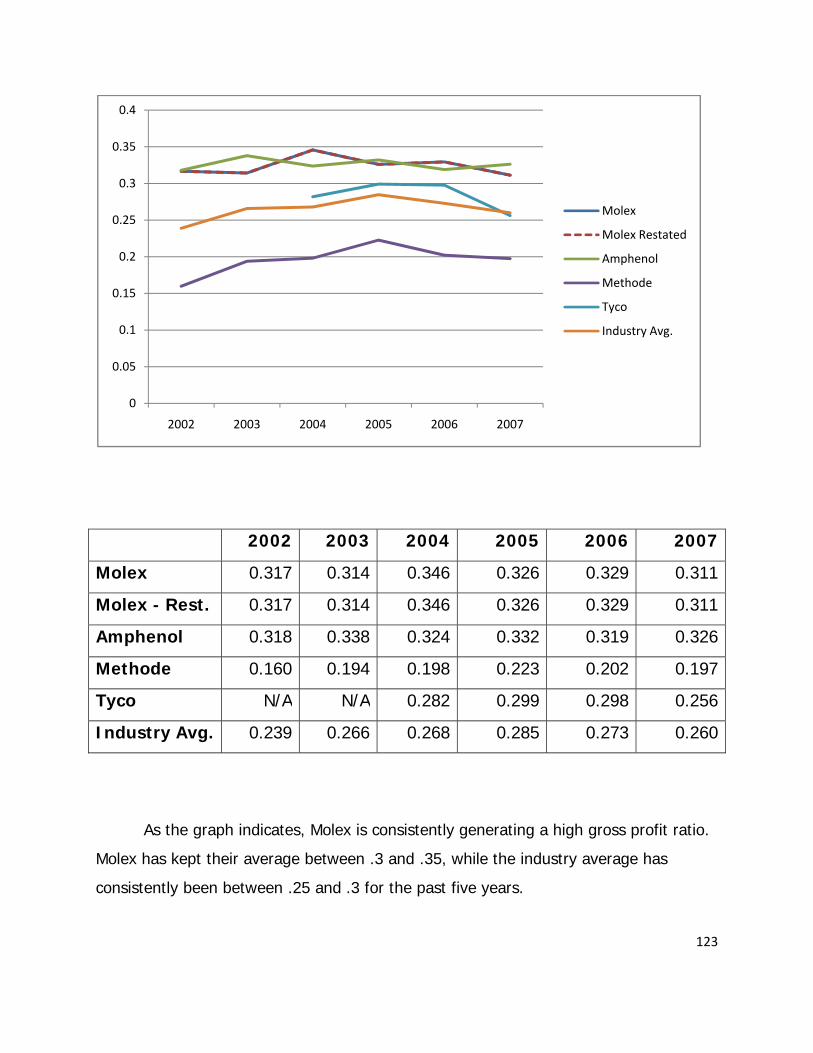
123
2002 2003 2004 2005 2006 2007
Molex 0.317 0.314 0.346 0.326 0.329 0.311
Molex - Rest. 0.317 0.314 0.346 0.326 0.329 0.311
Amphenol 0.318 0.338 0.324 0.332 0.319 0.326
Methode 0.160 0.194 0.198 0.223 0.202 0.197
Tyco N/A N/A 0.282 0.299 0.298 0.256
Industry Avg. 0.239 0.266 0.268 0.285 0.273 0.260
As the graph indicates, Molex is consistently generating a high gross profit ratio.
Molex has kept their average between .3 and .35, while the industry average has
consistently been between .25 and .3 for the past five years.
0
0.05
0.1
0.15
0.2
0.25
0.3
0.35
0.4
2002 2003 2004 2005 2006 2007
Molex
Molex Restated
Amphenol
Methode
Tyco
Industry Avg.
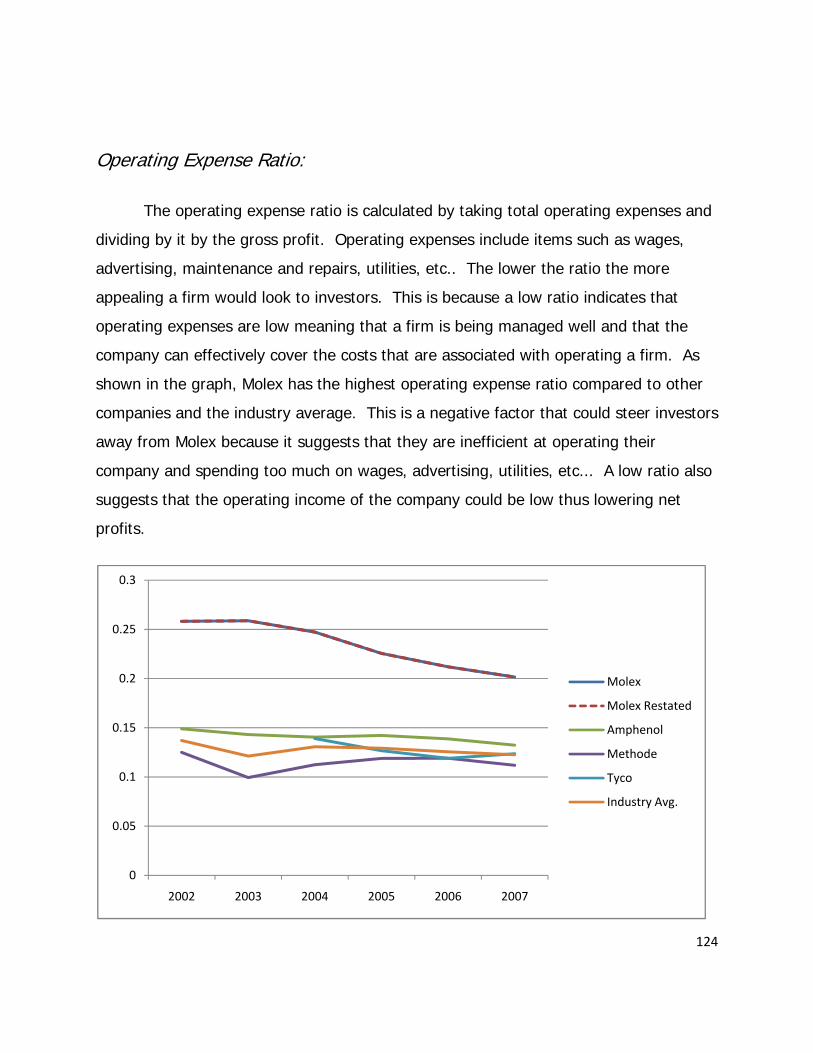
124
Operating Expense Ratio:
The operating expense ratio is calculated by taking total operating expenses and
dividing by it by the gross profit. Operating expenses include items such as wages,
advertising, maintenance and repairs, utilities, etc.. The lower the ratio the more
appealing a firm would look to investors. This is because a low ratio indicates that
operating expenses are low meaning that a firm is being managed well and that the
company can effectively cover the costs that are associated with operating a firm. As
shown in the graph, Molex has the highest operating expense ratio compared to other
companies and the industry average. This is a negative factor that could steer investors
away from Molex because it suggests that they are inefficient at operating their
company and spending too much on wages, advertising, utilities, etc... A low ratio also
suggests that the operating income of the company could be low thus lowering net
profits.
0
0.05
0.1
0.15
0.2
0.25
0.3
2002 2003 2004 2005 2006 2007
Molex
Molex Restated
Amphenol
Methode
Tyco
Industry Avg.

125
2002 2003 2004 2005 2006 2007
Molex 0.258 0.259 0.247 0.226 0.212 0.202
Molex - Rest. 0.258 0.259 0.247 0.226 0.212 0.202
Amphenol 0.149 0.143 0.140 0.142 0.139 0.132
Methode 0.125 0.099 0.112 0.119 0.119 0.112
Tyco N/A N/A 0.139 0.127 0.119 0.124
Industry Avg. 0.137 0.121 0.131 0.129 0.126 0.123
Operating Profit Margin:
The operating profit margin is calculated by taking operating income and dividing
it by net sales. This ratio reveals how efficient the company is in converting sales to
profits thus meaning the higher the profit margin the more lucrative the company.
Molex is consecutively lower than the industry average over the past five year period.
However, if you consider that Amphenol outperformed all the other companies
significantly this greatly effects the industry average therefore, in comparison to Tyco
and Methode, Molex performs pretty consistently while predominately staying in the .05
to .1 range. However, when restating Molex’s operating profit margin it is obvious that
there were some cost structure issues and that Molex might not be efficiently
controlling their cost of goods sold or the selling general and administrative expenses.

126
2002 2003 2004 2005 2006 2007
Molex 0.059 0.055 0.098 0.080 0.108 0.098
Molex - Rest. 0.039 0.024 0.063 0.044 0.072 0.053
Amphenol 0.169 0.165 0.181 0.190 0.172 0.194
Methode 0.001 0.091 0.081 0.093 0.073 0.073
Tyco N/A N/A 0.068 0.083 0.090 0.056
Industry Avg. 0.085 0.128 0.110 0.122 0.112 0.108
Net Profit Margin:
The Net Profit margin is calculated by taking net income and dividing it by net
sales. This ratio examines how much profit a firm retains after expenses in relation to
0
0.05
0.1
0.15
0.2
0.25
2002 2003 2004 2005 2006 2007
Molex
Molex Restated
Amphenol
Methode
Tyco
Industry Avg.
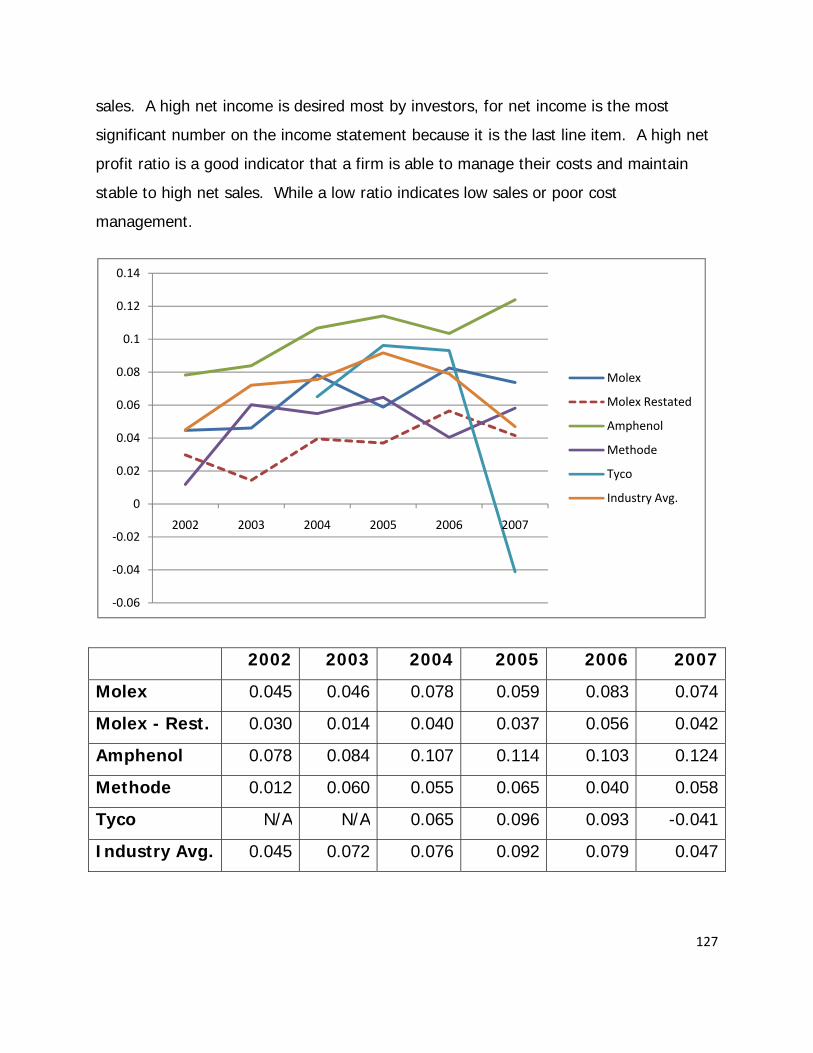
127
sales. A high net income is desired most by investors, for net income is the most
significant number on the income statement because it is the last line item. A high net
profit ratio is a good indicator that a firm is able to manage their costs and maintain
stable to high net sales. While a low ratio indicates low sales or poor cost
management.
2002 2003 2004 2005 2006 2007
Molex 0.045 0.046 0.078 0.059 0.083 0.074
Molex - Rest. 0.030 0.014 0.040 0.037 0.056 0.042
Amphenol 0.078 0.084 0.107 0.114 0.103 0.124
Methode 0.012 0.060 0.055 0.065 0.040 0.058
Tyco N/A N/A 0.065 0.096 0.093 -0.041
Industry Avg. 0.045 0.072 0.076 0.092 0.079 0.047
‐0.06
‐0.04
‐0.02
0
0.02
0.04
0.06
0.08
0.1
0.12
0.14
2002 2003 2004 2005 2006 2007
Molex
Molex Restated
Amphenol
Methode
Tyco
Industry Avg.

128
As the graph shows, the industry average indicates a steady growth from 2002
to 2005 and then a rapid decline from 2005 to 2007. This could be explained by many
reasons such as companies being unable to make high sales due to economic recession
or that companies are having a hard time managing costs. While Molex saw growth
from 2005 to 2006 and a fall in 2006 to 2007, Amphenol and Methode had the reverse
effect and experienced a decline in 2005 to 2006 and growth from 2006 to 2007, while
the leader in the industry Tyco experienced a steady decline from 2005 to 2006 and
then a rapid decline from 2006 to 2007. Tyco’s decline from 2006 to 2007 was so
significant that when observing the industry average you can tell that the slope of the
curve was also greatly affected because Amphenol, Molex, and Methode have not
experienced declines of that magnitude.
Asset Turnover:
Asset turnover is calculated by taking sales revenue of a given year and dividing
it by total assets of the previous year. This ratio examines the amount of return a
company receives in relation to the dollar amount a firm obtains in their asset accounts.
A high asset turnover is desirable because it reflects proficient assets in terms of
generating revenue for a company. Methode has been the most successful at
maintaining a steady asset turnover, while Amphenol has been consecutively above the
industry average but inconsistent at maintaining a sound growth. While Molex has
experienced the most solid growth compared to the rest of the companies in the
industry, Tyco has been the least successful at obtaining a turnover remotely close to
that of the industry average or the rest of the companies. It is important to keep in
mind that an impairment of goodwill negatively affects assets therefore, after an
impairment of goodwill the restated version of Molex’s asset turnover improved each
year. This is an excellent indicator that Molex has learned how to efficiently use assets
to generate sales.
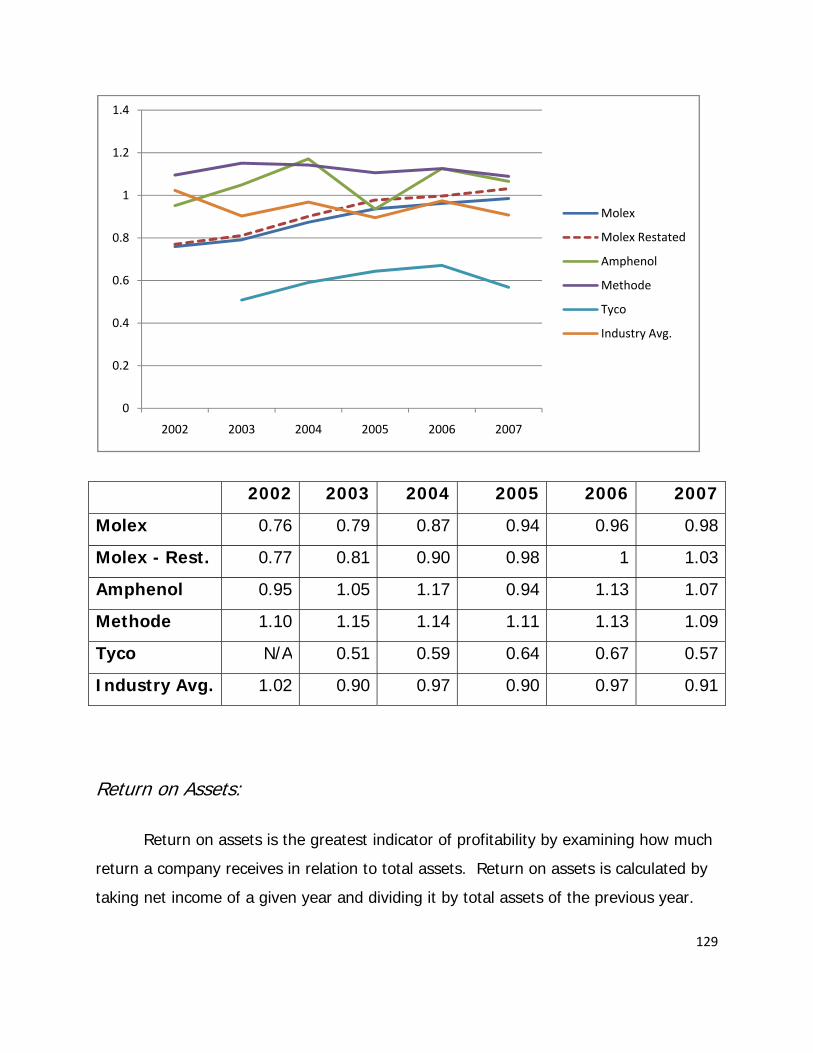
129
2002 2003 2004 2005 2006 2007
Molex 0.76 0.79 0.87 0.94 0.96 0.98
Molex - Rest. 0.77 0.81 0.90 0.98 1 1.03
Amphenol 0.95 1.05 1.17 0.94 1.13 1.07
Methode 1.10 1.15 1.14 1.11 1.13 1.09
Tyco N/A 0.51 0.59 0.64 0.67 0.57
Industry Avg. 1.02 0.90 0.97 0.90 0.97 0.91
Return on Assets:
Return on assets is the greatest indicator of profitability by examining how much
return a company receives in relation to total assets. Return on assets is calculated by
taking net income of a given year and dividing it by total assets of the previous year.
0
0.2
0.4
0.6
0.8
1
1.2
1.4
2002 2003 2004 2005 2006 2007
Molex
Molex Restated
Amphenol
Methode
Tyco
Industry Avg.

130
By using a lag method you can see how effective the previous year’s assets affected the
current year’s income. A high ratio is desirable because this reflects management’s
success in maintaining costs and utilizing assets to create income for a firm. As stated
in the graph, the global connector industry experienced significant growth from 2002 to
2005 and then a steady slow down from 2005 to 2007. Molex has seen secure growth
in the past five years and surpassed the industry average in 2006. However, after
restating the financials Molex has one of the lowest consecutive growths in the industry.
This is probably attributed to the acquisition of two new companies one in 2006 and
one in 2007 causing the impairment of goodwill to decrease net income.
2002 2003 2004 2005 2006 2007
Molex 0.035 0.038 0.076 0.058 0.087 0.081
Molex - Rest. 0.023 0.012 0.039 0.038 0.062 0.047
Amphenol 0.078 0.096 0.138 0.158 0.132 0.161
Methode 0.013 0.075 0.062 0.081 0.048 0.070
‐0.05
0
0.05
0.1
0.15
0.2
2002 2003 2004 2005 2006 2007
Molex
Molex Restated
Amphenol
Methode
Tyco
Industry Avg.

131
Tyco N/A N/A 0.040 0.061 0.065 -0.030
Industry Avg. 0.030 0.057 0.080 0.100 0.082 0.067
Return on Equity:
Return on equity is extremely similar to return on assets in the sense that ROE is
an excellent indicator of a firm’s performance. ROE provides insight as to how well
managers are using the funds invested by the firm’s shareholders to create returns
(Palepu Healy). To calculate return on equity you must take a firm’s net income in a
given year and divide it by the firm’s shareholders equity of the previous year. As the
graph indicates the industry average is downward sloping. However, if you study the
graph closely you notice that companies such as Tyco, Molex, and Methode do not
follow this industry trend. In fact it is safe to say that the industry average tends to
follow Amphenol’s movement. This could be in large part due to Amphenol’s ROE being
significantly higher than the other companies. For instance, from 2004 to 2006 the
industry average indicates a steady decline in ROE just like Amphenol, but overall
Methode, Molex, and Tyco saw a steady increase in their ROEs.
While Molex does have a lower ROE compared to the other companies, Molex
also has the most stable growth out of all the companies in the global connector
industry. Although, after restating the financials Molex’s ROE dropped but still shows a
steady growth for the five year period. The drop in ROE can be attributed to the
acquisition of two companies which caused Molex to expense goodwill therefore causing
net income to be lower each year.
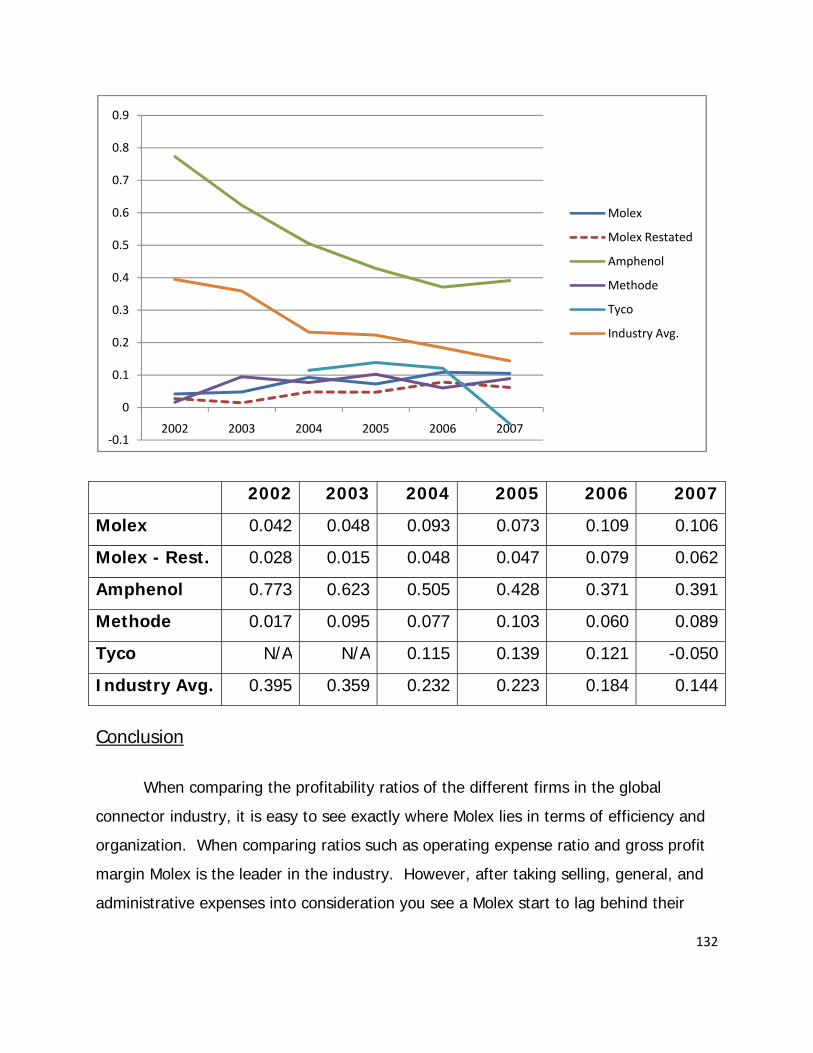
132
2002 2003 2004 2005 2006 2007
Molex 0.042 0.048 0.093 0.073 0.109 0.106
Molex - Rest. 0.028 0.015 0.048 0.047 0.079 0.062
Amphenol 0.773 0.623 0.505 0.428 0.371 0.391
Methode 0.017 0.095 0.077 0.103 0.060 0.089
Tyco N/A N/A 0.115 0.139 0.121 -0.050
Industry Avg. 0.395 0.359 0.232 0.223 0.184 0.144
Conclusion
When comparing the profitability ratios of the different firms in the global
connector industry, it is easy to see exactly where Molex lies in terms of efficiency and
organization. When comparing ratios such as operating expense ratio and gross profit
margin Molex is the leader in the industry. However, after taking selling, general, and
administrative expenses into consideration you see a Molex start to lag behind their
‐0.1
0
0.1
0.2
0.3
0.4
0.5
0.6
0.7
0.8
0.9
2002 2003 2004 2005 2006 2007
Molex
Molex Restated
Amphenol
Methode
Tyco
Industry Avg.
133
competitors for example, they are lower in their operating profit and net profit margins.
This is usually attributed to poor cost management and could possibly steer investors
away from Molex. When comparing asset turnover Molex starts out behind their
competitors but is able to maintain a solid growth therefore, surpassing the industry
average in 2006. While Molex’s ROA and ROE started off being lower than the industry
average, Molex was able to maintain a stable and increasing growth unlike a majority of
their competitors. Overall, Molex’s profitability performance is excellent but is greatly
affected by their subpar cost management as compared to their competitors.
Firm Growth Rate Ratios:
Calculating growth rate ratios of a firm can help evaluate if a firm can maintain
its future increasing profits without the need of outside financing or changing capital
structure. Using these ratios can help you compare firms of different sizes without
distortion, and distinguish trends or irregularities between the firm and the industry.
Maintaining growth rates can be difficult because if a growth rate continues to grow
rapidly with no change in liabilities it will cause the debt to equity ratio to shrink. With a
smaller debt to equity ratio and increased assets, the firms will continually improve their
credit rating and borrowing cost will go down thus causing a change in cost of capital.
If the firm borrowed money now it would be an advantage because of their lower cost
of borrowing. The firm could increase their leverage which would be beneficial if they
could earn more off of a new project financed by debt than they owe, and debt can be
a tax write-off. To keep a firms internal growth rate and sustainable growth rate
constant they must; cut dividends, increase net profit margin, and sell more without
changing the amount of assets.
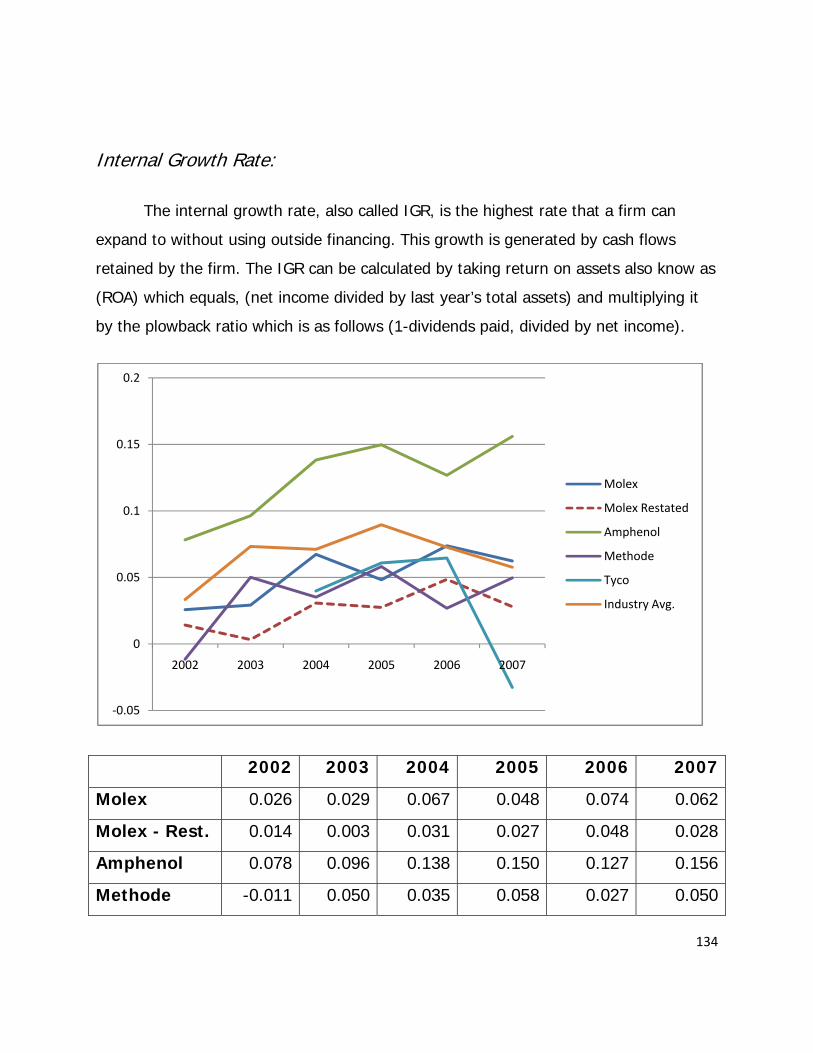
134
Internal Growth Rate:
The internal growth rate, also called IGR, is the highest rate that a firm can
expand to without using outside financing. This growth is generated by cash flows
retained by the firm. The IGR can be calculated by taking return on assets also know as
(ROA) which equals, (net income divided by last year’s total assets) and multiplying it
by the plowback ratio which is as follows (1-dividends paid, divided by net income).
2002 2003 2004 2005 2006 2007
Molex 0.026 0.029 0.067 0.048 0.074 0.062
Molex - Rest. 0.014 0.003 0.031 0.027 0.048 0.028
Amphenol 0.078 0.096 0.138 0.150 0.127 0.156
Methode -0.011 0.050 0.035 0.058 0.027 0.050
‐0.05
0
0.05
0.1
0.15
0.2
2002 2003 2004 2005 2006 2007
Molex
Molex Restated
Amphenol
Methode
Tyco
Industry Avg.

135
Tyco N/A N/A 0.040 0.061 0.065 -0.033
Industry Avg. 0.033 0.073 0.071 0.090 0.073 0.058
The graph above shows the IGR’s of Molex and its competitors. Molex is not
used in the calculation of the industry average so that comparisons can be made
between Molex and the average IGR’s of its competitors. Molex restated is consistently
lower and moves directly opposite of the industry average until mid year 2006 when
they both declined at the same pace. Amphenol has consistently been above average is
likely to continue its rapid growth in to the next few years. The Molex restated IGR is
well below average and in 2005 was 6.3% below average. This below average growth
rate shows that Molex does not have much potential for growth in the next few years
unless they can at least reach industry averages. Tyco is experiencing a very negative
growth rate which began around the time they spun off from Tyco international (Tyco
10K).
Sustainable Growth Rate:
The sustainable growth rate or (SGR) is the highest rate of growth that a firm
can sustain without increasing its financial leverage or changing its capital structure.
The SGR can be used as a benchmark to evaluate a firm’s growth rate plans. The SGR
can be calculated by taking return on equity also know as (ROE) which equals, (net
income divided by last year’s total equity) and multiplying it by the plowback ratio which
is as follows (1-dividends paid, divided by net income).
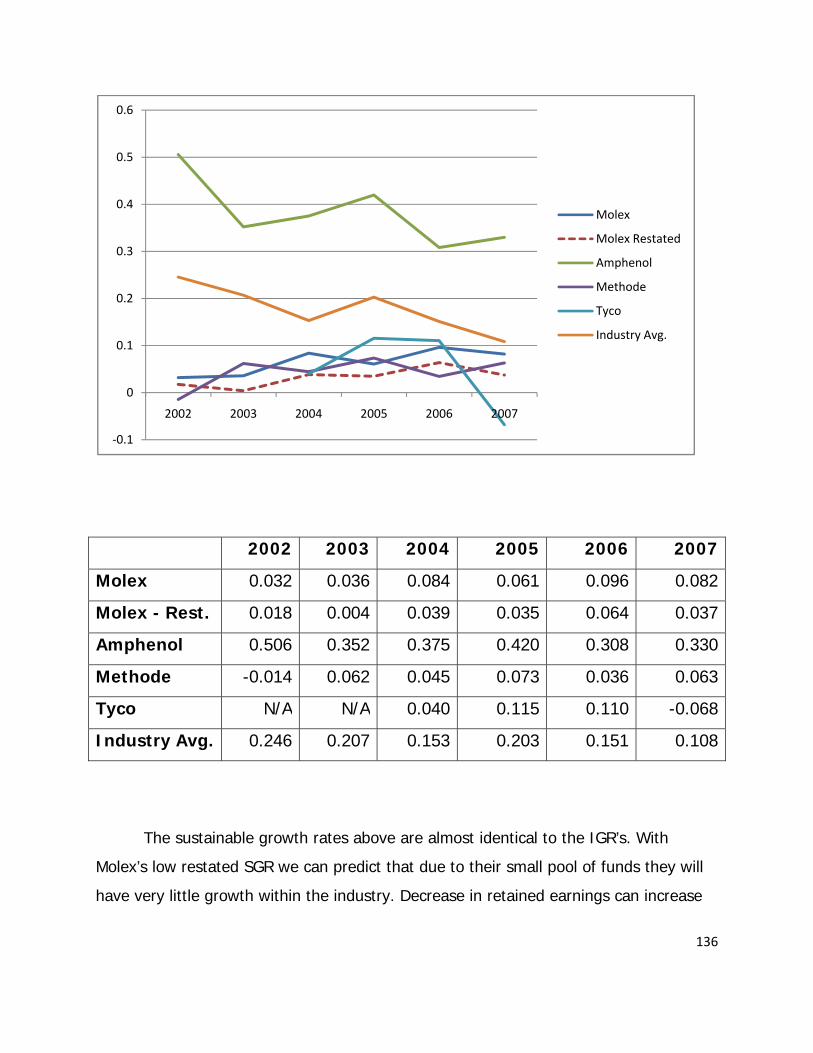
136
2002 2003 2004 2005 2006 2007
Molex 0.032 0.036 0.084 0.061 0.096 0.082
Molex - Rest. 0.018 0.004 0.039 0.035 0.064 0.037
Amphenol 0.506 0.352 0.375 0.420 0.308 0.330
Methode -0.014 0.062 0.045 0.073 0.036 0.063
Tyco N/A N/A 0.040 0.115 0.110 -0.068
Industry Avg. 0.246 0.207 0.153 0.203 0.151 0.108
The sustainable growth rates above are almost identical to the IGR’s. With
Molex’s low restated SGR we can predict that due to their small pool of funds they will
have very little growth within the industry. Decrease in retained earnings can increase
‐0.1
0
0.1
0.2
0.3
0.4
0.5
0.6
2002 2003 2004 2005 2006 2007
Molex
Molex Restated
Amphenol
Methode
Tyco
Industry Avg.

137
the cost of borrowing creating a change in the capital structure of a firm. Tyco is
Molex’s largest competitor, but because of Tyco’s negative SGR we can predict no
growth until the firm makes radical changes to their capital structure. Amphenol in 2007
with its SGR of 9.9% above the industry average will most likely continue to outperform
the industry at least for the short run.
Conclusion
Molex needs to increase retained earnings and or cut dividends so they can grow
their pool of equity which in turn will fuel future growth. Cutting dividends is not a good
sign for a firm and can scare away shareholders. If Molex does not change some of
their financial policies they will not be able to reach or beat the industry average. With
the current 2008 economy downward spiral the industry average is likely to be radically
lower in the years to come. Growth comes easy when the economy is booming but with
a worldwide recession growth will be extremely hard in some industries. Consumers will
have less money to spend on new cell phones, cars, TV’s, and other electronics which
all involve connectors. The connector industry will likely take a hard hit in a full blow
global recession. Tyco may have trouble keeping their lights on if they see negative
growth rates for too many years in a row.
Capital Structure Ratios:
Capital structure ratios are used to explain how a firm finances their assets. Does
the firm use debt or equity to fund projects and assets? Debt comes from loans or
bonds while equity is from selling shares of company stock. A firm that has little to no
equity will have a poor credit rating which means high interest rates. A firm with lots of
equity can make its payments on debt with ease. There are three capital structure
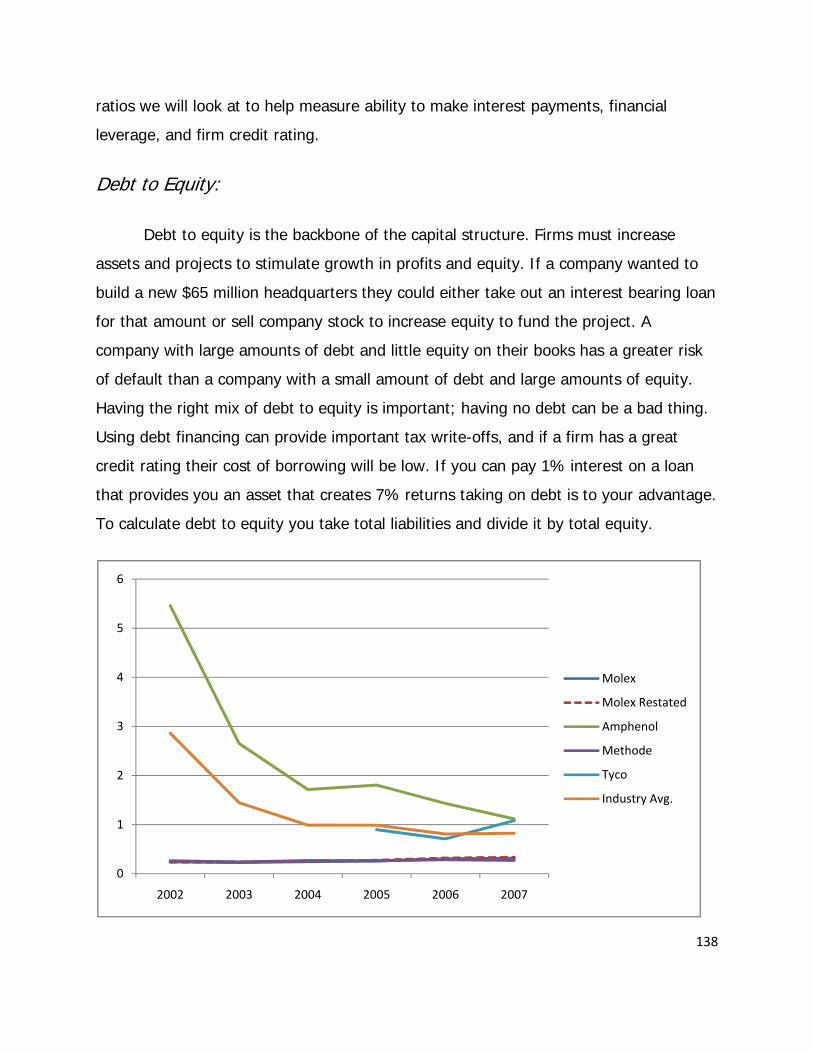
138
ratios we will look at to help measure ability to make interest payments, financial
leverage, and firm credit rating.
Debt to Equity:
Debt to equity is the backbone of the capital structure. Firms must increase
assets and projects to stimulate growth in profits and equity. If a company wanted to
build a new $65 million headquarters they could either take out an interest bearing loan
for that amount or sell company stock to increase equity to fund the project. A
company with large amounts of debt and little equity on their books has a greater risk
of default than a company with a small amount of debt and large amounts of equity.
Having the right mix of debt to equity is important; having no debt can be a bad thing.
Using debt financing can provide important tax write-offs, and if a firm has a great
credit rating their cost of borrowing will be low. If you can pay 1% interest on a loan
that provides you an asset that creates 7% returns taking on debt is to your advantage.
To calculate debt to equity you take total liabilities and divide it by total equity.
0
1
2
3
4
5
6
2002 2003 2004 2005 2006 2007
Molex
Molex Restated
Amphenol
Methode
Tyco
Industry Avg.
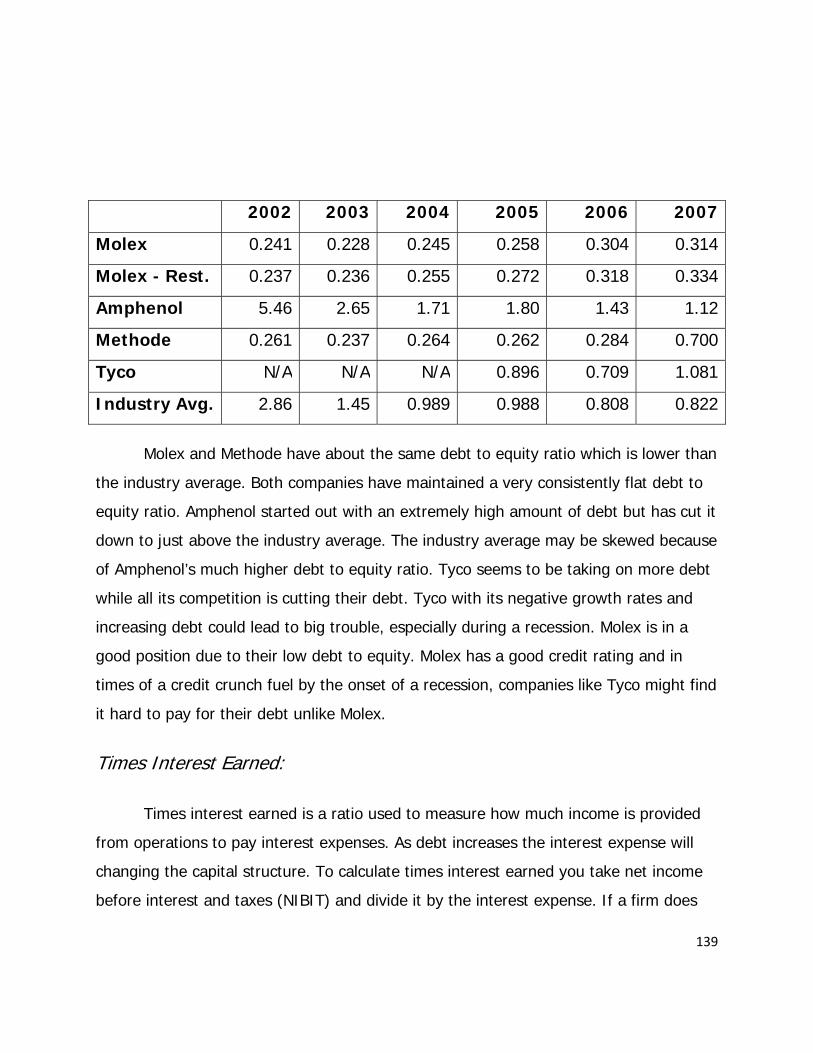
139
2002 2003 2004 2005 2006 2007
Molex 0.241 0.228 0.245 0.258 0.304 0.314
Molex - Rest. 0.237 0.236 0.255 0.272 0.318 0.334
Amphenol 5.46 2.65 1.71 1.80 1.43 1.12
Methode 0.261 0.237 0.264 0.262 0.284 0.700
Tyco N/A N/A N/A 0.896 0.709 1.081
Industry Avg. 2.86 1.45 0.989 0.988 0.808 0.822
Molex and Methode have about the same debt to equity ratio which is lower than
the industry average. Both companies have maintained a very consistently flat debt to
equity ratio. Amphenol started out with an extremely high amount of debt but has cut it
down to just above the industry average. The industry average may be skewed because
of Amphenol’s much higher debt to equity ratio. Tyco seems to be taking on more debt
while all its competition is cutting their debt. Tyco with its negative growth rates and
increasing debt could lead to big trouble, especially during a recession. Molex is in a
good position due to their low debt to equity. Molex has a good credit rating and in
times of a credit crunch fuel by the onset of a recession, companies like Tyco might find
it hard to pay for their debt unlike Molex.
Times Interest Earned:
Times interest earned is a ratio used to measure how much income is provided
from operations to pay interest expenses. As debt increases the interest expense will
changing the capital structure. To calculate times interest earned you take net income
before interest and taxes (NIBIT) and divide it by the interest expense. If a firm does
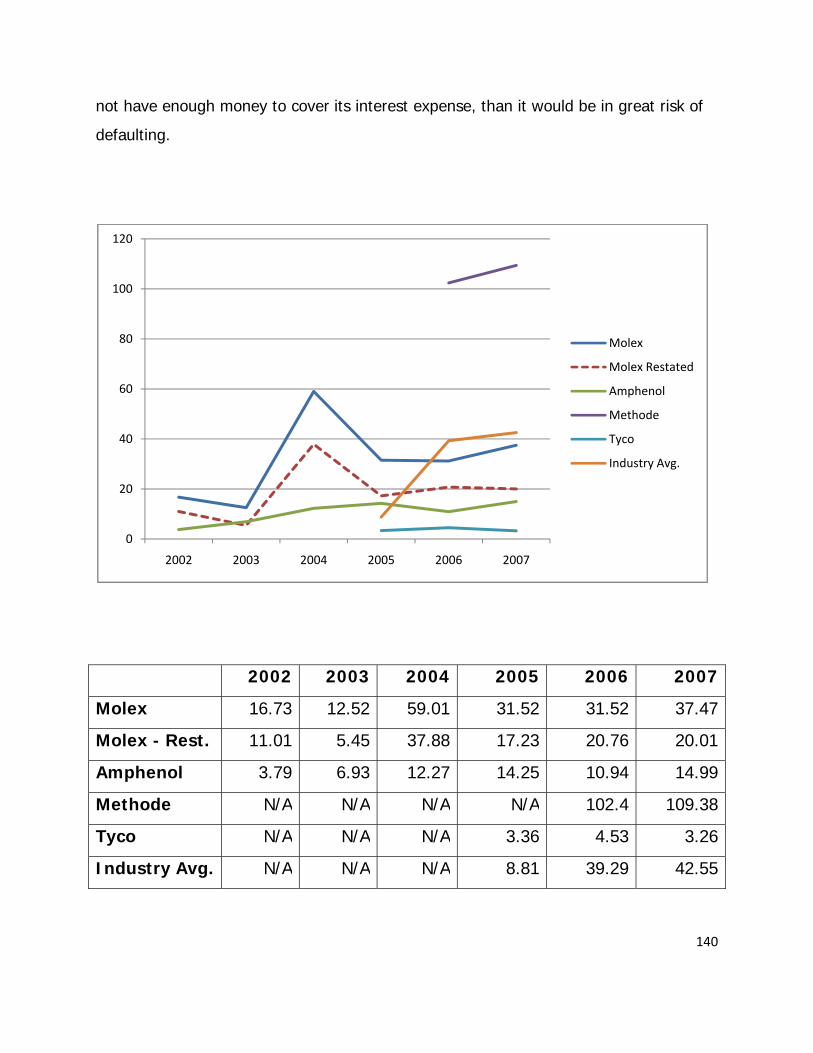
140
not have enough money to cover its interest expense, than it would be in great risk of
defaulting.
2002 2003 2004 2005 2006 2007
Molex 16.73 12.52 59.01 31.52 31.52 37.47
Molex - Rest. 11.01 5.45 37.88 17.23 20.76 20.01
Amphenol 3.79 6.93 12.27 14.25 10.94 14.99
Methode N/A N/A N/A N/A 102.4 109.38
Tyco N/A N/A N/A 3.36 4.53 3.26
Industry Avg. N/A N/A N/A 8.81 39.29 42.55
0
20
40
60
80
100
120
2002 2003 2004 2005 2006 2007
Molex
Molex Restated
Amphenol
Methode
Tyco
Industry Avg.
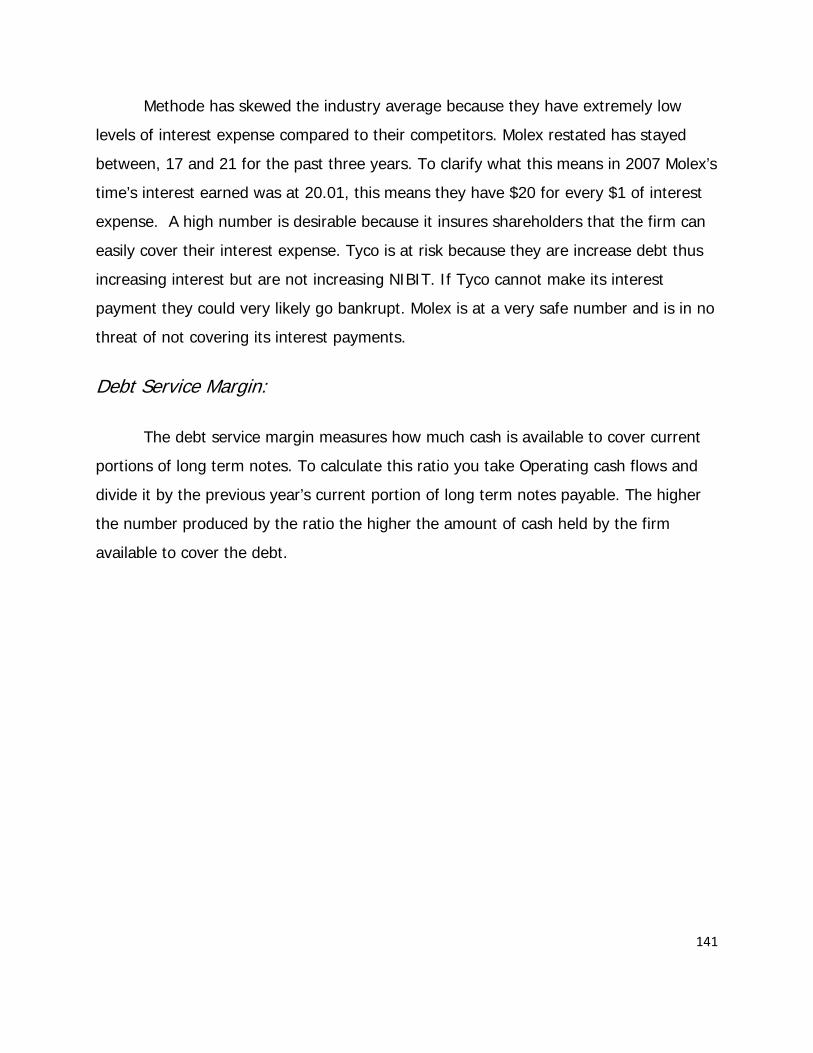
141
Methode has skewed the industry average because they have extremely low
levels of interest expense compared to their competitors. Molex restated has stayed
between, 17 and 21 for the past three years. To clarify what this means in 2007 Molex’s
time’s interest earned was at 20.01, this means they have $20 for every $1 of interest
expense. A high number is desirable because it insures shareholders that the firm can
easily cover their interest expense. Tyco is at risk because they are increase debt thus
increasing interest but are not increasing NIBIT. If Tyco cannot make its interest
payment they could very likely go bankrupt. Molex is at a very safe number and is in no
threat of not covering its interest payments.
Debt Service Margin:
The debt service margin measures how much cash is available to cover current
portions of long term notes. To calculate this ratio you take Operating cash flows and
divide it by the previous year’s current portion of long term notes payable. The higher
the number produced by the ratio the higher the amount of cash held by the firm
available to cover the debt.

142
2002 2003 2004 2005 2006 2007
Molex 22.17 18.07 20.80 43.19 62.58 3.53
Molex - Rest. 20.73 14.61 14.59 37.17 52.06 2.71
Amphenol 0.232 0.319 0.482 0.300 0.428 0.538
Methode N/A N/A N/A N/A N/A N/A
Tyco N/A N/A N/A 0.405 0.494 0.456
Industry Avg. N/A N/A N/A 0.352 0.461 0.497
Methode’s 10K did not provide any information about current portions of long
term debt due. The reason for large variations between firms might be explained by
when liabilities become due. It appears that Molex had no current portions of long term
debt due until 2007. This explains why Molex dropped from 62.58 down to 3.53 or just
below industry average. Molex appears to be able to generate more operating cash
0
10
20
30
40
50
60
70
2002 2003 2004 2005 2006 2007
Molex
Molex Restated
Amphenol
Methode
Tyco
Industry Avg.
143
flows then their competitors while have fewer amounts of current long term notes
payable.
Altman’s Z-Score:
Altman’s Z-score is a formula that uses five weighted variables to compute a
bankruptcy score (Palepu & Healy). Risk averse shareholders would want to use this
test on companies they may buy stoke in to ensure that the company is in no risk of
bankruptcy. The Z-score also can be used as a credit score indicator; it can help you
compare the credit risk among firms. If a firm has a Z-score below 1.81 then the model
strongly predicts bankruptcy. If a score is between 1.81 and 2.67 they are said to be in
a gray area. And a firm with a score above 2.67 is considered to good. The higher the
Z-score the better credit rating the firm has. A firm with a Z-score above 3.00 will have
a much lower interest rate than a firm with a 2.00. To calculate the Altman’s Z-score
use the formula below.
1.2(Net Working Capital/Total Assets)
+1.4(Retained Earnings/Total Assets)
+ 3.3(Earnings before Interest and Taxes/Total Assets)
+ 0.6(Market Value of Equity/Book Value of Liabilities)
+ 1.0(Sales/Total Assets) = Altman’s Z-Score
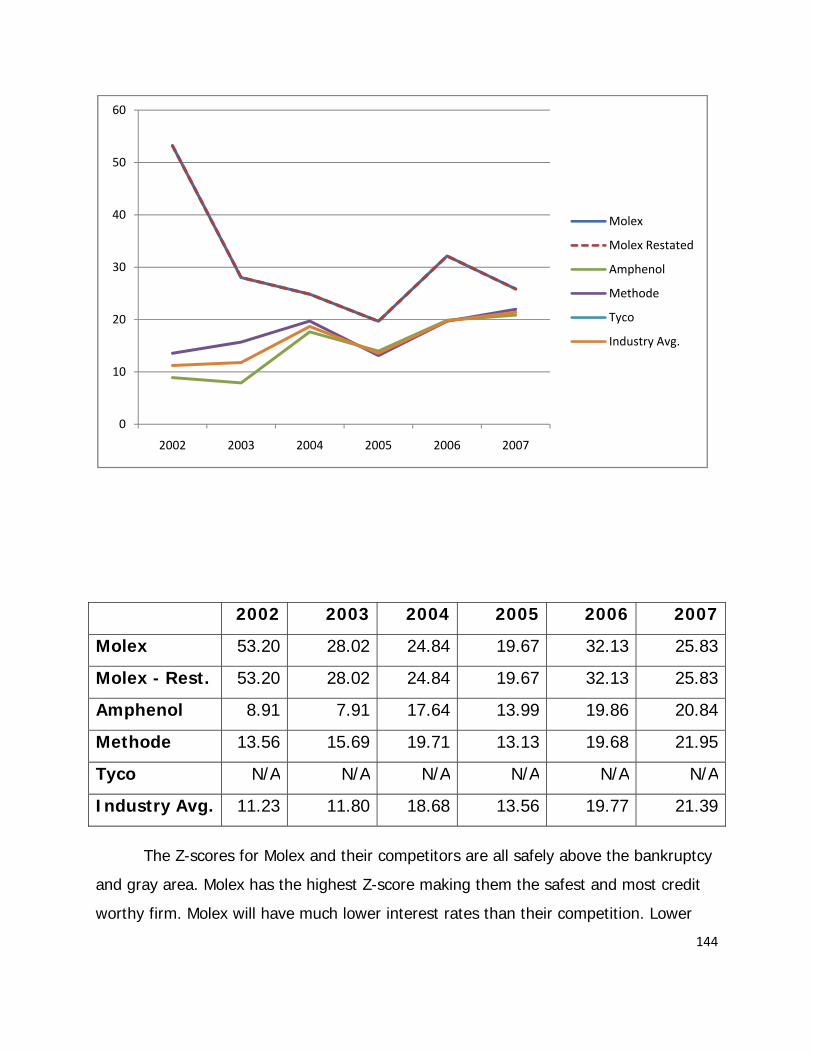
144
2002 2003 2004 2005 2006 2007
Molex 53.20 28.02 24.84 19.67 32.13 25.83
Molex - Rest. 53.20 28.02 24.84 19.67 32.13 25.83
Amphenol 8.91 7.91 17.64 13.99 19.86 20.84
Methode 13.56 15.69 19.71 13.13 19.68 21.95
Tyco N/A N/A N/A N/A N/A N/A
Industry Avg. 11.23 11.80 18.68 13.56 19.77 21.39
The Z-scores for Molex and their competitors are all safely above the bankruptcy
and gray area. Molex has the highest Z-score making them the safest and most credit
worthy firm. Molex will have much lower interest rates than their competition. Lower
0
10
20
30
40
50
60
2002 2003 2004 2005 2006 2007
Molex
Molex Restated
Amphenol
Methode
Tyco
Industry Avg.

145
interest rates will allow Molex to borrow money to finance new project for a lot less
money than Amphenol. Most firms are right at average which is still far from danger.
Conclusion
Capital structure analysis using the three ratios: debt to equity, times interest
earned, and debt service margin will give you a great view of how each firm is
structured. Starting with debt to equity, Molex has one of the industry’s lowest ratios
which is good because they have much more equity than debt. Molex’s time’s interest
earned has consistently stayed above, or right at average. Molex has always had more
than enough net income before interest and taxes to cover their interest expense. The
debt service margin has large variations caused by the periodic current long term notes
that become due. Molex experienced large declines when their debt became payable;
but they still remain above average. Molex has continually been a top performer in their
industry and will most likely continue this trend.
One more test can sum up what we have already concluded about Molex. The Z-
score show that Molex is the safest and has the best credit score in the industry. Due to
their safe rating and sound capital structure; Molex will most likely survive and
outperform the competition in this troubled global economy. Tyco is showing signs of
trouble and will most likely continue to struggle in the years to come unless they
improve upon their capital structure by decreasing debt and increasing cash inflows.
Estimating Cost of Capital
Cost of Equity:
According to investopedia.com, the cost of equity is the minimum rate of return
a firm must offer shareholders to compensate them for waiting for their returns, and for
bearing some type of risk(investopedia.com). The cost of equity is usually higher than
146
the cost of debt since it cost more to finance equity. We used the Capital Asset Pricing
Model (CAPM) to calculate Molex’s cost of equity. The cost of equity is calculated by
taking the estimated beta of the firm and multiplying it by the market risk premium and
then adding this to the risk free rate.
Cost of Equity = Beta of the firm (return of the market – risk free rate) + risk free rate
We used regression analysis to calculate the appropriate beta for Molex. A firm’s
beta measures the firm’s amount of systematic risk that can be explained by the risk of
the market, we then multiplied this beta by the market risk premium. The market risk
premium is the return for the market (S&P 500) minus the risk free rate, which we
derived from the St. Louis Federal Reserve. The current risk free rate according to the
Federal Reserve is approximately 4.02%. We believe the current market risk premium is
equal to 8%.
In order to perform the regression analysis, we took Molex’s monthly stock prices
over the last seven years, we gathered 3 month, 6 month, 2 year, 5 year, and 10 year
risk free rates, and then took an average return of the S&P 500. We then ran the
regression analysis for 24, 36, 48, 60, and 72 month investment horizons in order to
estimate the most effective beta. We broke down the regression output by looking for
the highest adjusted R^2 value. The higher the firms adjusted R^2 the higher the
explanatory power of the estimated beta. Our highest value of adjusted R^2 was
38.6%, which was presented in the 72 month holding period, and had an accompanying
beta of 1.47. After we calculated all of the variables that make up the Capital Asset
Pricing Model, we computed Molex’s cost of equity to be 15.78%. We believe that this
number is accurate because of the extremely high explanatory power that Molex has.
We also used a 95% confidence interval to derive our upper and lower bound betas of
1.90 and 1.04. We computed our upper bound cost of equity, using a 95% confidence
interval, to be 19.25% and our lower bound to be 12.30%.

147
Cost of Equity
15.78% = 1.47 (0.08) + 0.0402
Cost of Equity with 95% CI
Upper Ke: 19.25% = 1.90 (0.08) + 0.0402
Lower Ke: 12.30% = 1.04 (0.08) + 0.0402
Size adjusted
CAPM is most commonly used method to find the cost of equity, however, data
indicates the model is imperfect. Factors such as the “size effect” can affect the
amount of return an investor receives, for instance, smaller firms tend to generate
higher returns. The answer as to why the size effect can affect capital is uncertain,
although, this could be because smaller firms are riskier investments or that they are
underpriced. Thus meaning if we use returns based on firm size as an indicator of the
cost of capital, we assume that larger firms carry less risk. The best method to
estimate the cost of capital associated with the “size effect” is by adding the size
premium associated with the firm to the firm’s CAPM or more simply put, the cost of
equity = the riskless rate of return + beta risk(market risk premium) + size
premium(Palepu Healy). Based on Molex’s market value of 2.26 billion we found their
size premium to be 1.7, therefore, making our cost of equity associated with the “size
effect” 17.48%.
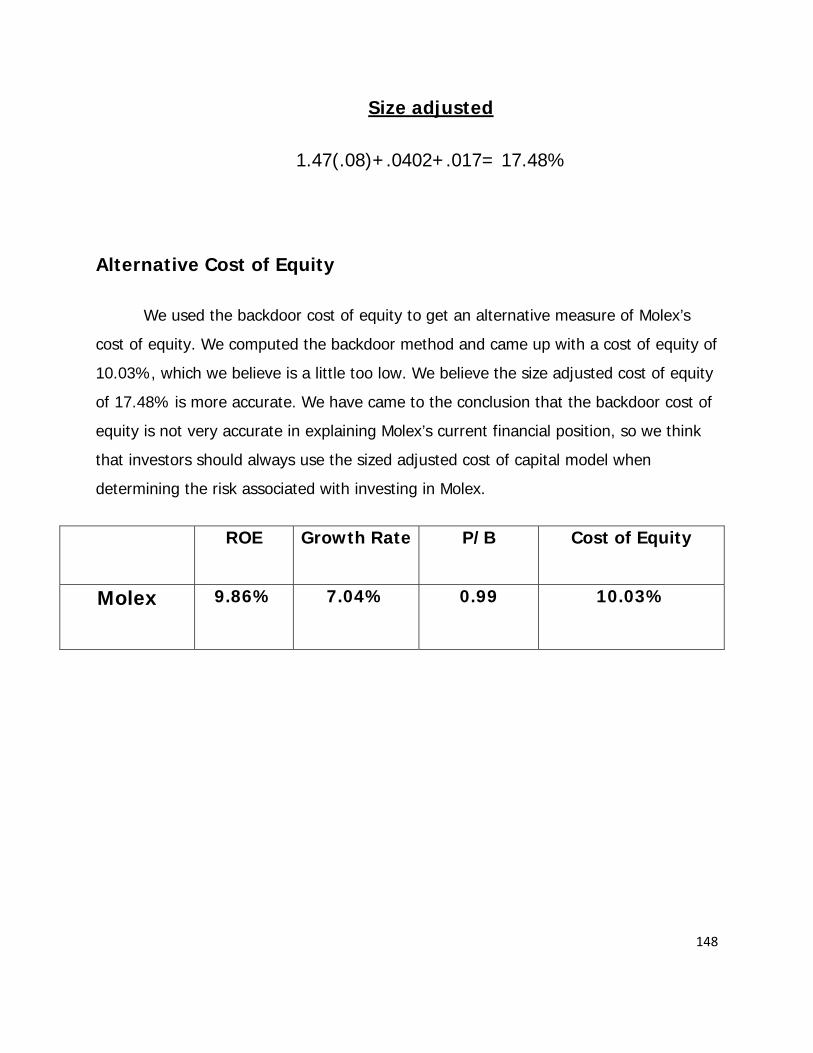
148
Size adjusted
1.47(.08)+.0402+.017= 17.48%
Alternative Cost of Equity
We used the backdoor cost of equity to get an alternative measure of Molex’s
cost of equity. We computed the backdoor method and came up with a cost of equity of
10.03%, which we believe is a little too low. We believe the size adjusted cost of equity
of 17.48% is more accurate. We have came to the conclusion that the backdoor cost of
equity is not very accurate in explaining Molex’s current financial position, so we think
that investors should always use the sized adjusted cost of capital model when
determining the risk associated with investing in Molex.
ROE Growth Rate P/B Cost of Equity
Molex 9.86% 7.04% 0.99 10.03%

149
Cost of Debt
Cost of Debt
Liabilities Debt Interest rate
Weight WACD
Short Term Loans $66, 687 1.3% .069 .09%
Accounts payable $350,413 2.13% .38 .81%
Salaries, commissions, and bonuses $74,689 2.13 .08 .17%
Other accrued expenses $84,525 2.13 .094 .2%
Income Taxes Payable $73,124 3.69% .079 .29% Other noncurrent liabilities $21,346 7.8% .023 .18%
Pensions and postretirement benefits
$105,574 6.2% .115 .71%
Long term debt $146,333 7.8% .159 1.24%
Total Liabilities 922,691 3.69%
A company’s value consists of both debt and equity, therefore it is important to
assess the costs associated with these accounts. Cost of debt is calculated as the
weighted average of a firm’s interest rates applied to its liabilities. Evaluating the cost of
debt can’t help assess a company’s riskiness compared to that of its competitors.
Although compared to cost of equity, cost of debt tends to be a lower percentage. Cost
of debt generally is lower than cost of equity because equity holders are characterized
with having a risk claimant which makes them more susceptible to risk of default.
Equity holders have uncertain returns due to the fact that they are compensated when
and only when all debt has been alleviated in the occurrence of liquidation.
150
In the above table we have presented the associated interest rates for the
liability accounts using Molex’s 10-K , and other available resources. Molex’s 10-K
disclosed the interest rates applicable for short term loans, pensions and postretirement
benefits and long term debt. The 10-K stated that long term debt varied from 1.3% to
7.8%, therefore we utilized the accounting principle of conservatism to determine the
interest rate we would apply to Molex’s long term debt (7.8%). We estimated the
interest rates for accounts payable, salaries, bonuses ,commissions and other accrued
expenses using the 3 month financial rate AA grade commercial paper from the St.
Louis Federal Reserve (2.13%). We applied the 10 year treasury yield for risk free rates
as the interest rate for income taxes payable(3.69%). We calculated the weighted
average cost of debt of the liabilities by multiplying the individual accounts debt by the
applicable interest rate and dividing that total by the sum of the firm’s total liability. We
then calculated the weight of each of the accounts debt by dividing the previously
calculated weighted average cost of debt over the assigned interest rate of each of the
accounts. After these calculations we determined Molex’s cost of debt to be 3.69%.
Weighted Average Cost of Capital (WACC)
A company is either financed by equity or debt, the weighted average cost of
capital is a weighted sum of the cost of equity and debt which helps firms determine
what interest rate is used to finance the firm. In order to find WACC you must take into
consideration WACC before and after taxes. Without tax the WACC before tax is
13.95%, whereas, if you use the effective tax rate of 36% as provided in Molex’s 10K
you find that the WACC after tax is 13.61%. Due to the acquisition of two companies in
2006 and 2007, we had to impair goodwill and restate Molex’s financials. This
negatively affected equity therefore, dropping the WACCbt to 13.7 % and WACCat to
13.38%.

151
Weighted Average Cost of Capital
Cost of debt
MVL/MVA Tax rate Cost of equity
MVE/MVA WACC
WACCbt 3.69% 25.63% 0% 17.48% 74.37% 13.95%
WACCat 3.69% 25.63% 36% 17.48% 74.37% 13.61%
WACCbt
Revised
3.69% 27.1% 0% 17.48% 72.9% 13.7%
WACCat
Revised
3.69% 27.1% 36% 17.48% 72.9% 13.38%
152
Financial Statements Forecasting
In order for a business to make more informed decisions about the future, a
company has to forecast out their financial statements. Forecasting is the method of
reviewing current and historical data in order to make educated assessments of the
company’s future trends. In order to make these evaluations, an analyst will use
trends, growth rates, averages, and ratios to calculate the future values. The following
section will include both the original and restated version of the balance sheet, income
statement, and statement and cash flows forecasted out ten years.
Income Statement:
When forecasting the financial statements the income statement is the most
important which is why an analyst starts with this statement to begin the process. The
reasoning behind this is that assumptions made in the income statement will flow into
the balance sheet as well as the statement of cash flows. Also due to the importance of
this financial statement it is imperative that it is as accurate as possible so that the
future expectations are reasonable and managers of the company can make better
decisions for the future.
The first step to take in forecasting the income statement is to look at the sales
growth rate in order to determine future sales revenue. At this point in time of the
economy we are in a recession much like the one that occurred in 2000-2001 time
frames. When deciding on a growth rate we took those years into consideration. The
2008 sales growth rate look much like the one back in the early 2000’s right before the
company was affected by the recession. By using this information we decided to use
the decline of 10% growth rate to show that the company is going to hit hard by the
recession in the same way that it was 2002. This is due to the way people are reacting
to the economic situation and losing faith in the market. We also believe that the
economy is not going to recover near as quickly as it did in the early 2000’s and the

153
company would experience another hard year in 2010 and have a declining growth of
6%. We choose 6% because it is 40% less of a hit for the company when compared to
the one for 2009. With 2008, the current year, being an election year we feel that in
2011 policies from the new president will be starting to improve the economic situation
but not quite to the extent that sales return to their normal state. This is why we gave
2011 a growth rate of 7.5%, which half of our chosen growth rate. An economy cannot
just bounce right back into a normal state after a recession, it takes time. In 2012, we
believe that the economy will have completely pulled out of the recession and the
company’s growth rate will remain at 15% for the remainder of the forecasted years.
We chose 15% because that is the approximate average growth rate for the company
when it is not in a recession.
The next thing that we forecasted was cost of goods sold. In order to create a
consistent rate to use for this entry across the board we had to find the average of the
past years cost of goods sold. All of the years had a relatively low fluctuation so we
included all of the past years in the average since there were no outliers. The average
for cost of goods sold turned out to be 67.4%. We kept the 67.4% the same because
the gross profit margin decreased in 2005 quite a bit and then very slow started to
increase again. Due to this keeping the 67.4% seemed reasonable and there was no
reason to move it up or down. Since cost of goods sold is a percentage of net sales, we
multiplied our average by the net sales of the year.
As mentioned earlier our analysis of key success factors, this industry takes on
the differentiated strategy rather than cost leadership. Due to this being the strategy of
the company, costs are not of big importance. Although the costs that a company
endures are important, they are not a top priority for the company to worry about when
forecasting.
154
The next item on the income statement to be forecasted is gross profit. As
accounting tells us, gross profit is calculated by subtracting cost of goods sold from net
sales. When looking at gross profit you can see that it is 32.6% of net sales. In
reference to the gross profit margin you can see that there are fluctuations, but overall
it remains fairly consistent. For this reason we believe that Molex should not have any
problems in the future with liquidity or with the overall profit of the company.
After gross profit the next item to be forecasted is operating income. Accounting
tells us that operating income is equal to gross profit minus selling, general, and
administrative expenses as well as other expenses and impairment. It is virtually
impossible to figure out what a company’s impairment is going to be as well as all of
the casual expenses that a company is going to experience each year. Due to this we
did not use the accounting formula. In order to be more accurate with the estimate we
used the average operating profit margin of 8.3% of total net sales. Operating income
tells what the income is before items such as interest and taxes are taken into
consideration.
The last item on the income statement to forecast is net income. Normally this
number is calculated by subtracting out interest expense and taxes from operating
income. Due to it being unreasonable to predict taxes because the tax rate can
change, we do not use this approach. The net profit margin is mostly increasing;
therefore, it can be concluded that net income is going to increase along with that of
net sales. We chose to use the growth rate of 7.18% for after the recession passes
because it is the best average from the net profit margin.

155

156
157
Restated Income Statement:
The difference between the original and the restated income statement is that
the restated includes goodwill impairment expense. Since this expense is included into
the statement the net income will be affected as well. In the original income statement
a growth rate for the years that were not in a recession used a growth rate of 7.18%,
yet in the restated income statement net income a growth rate of 4.2% is used.
Goodwill is an asset that has to be impaired and by Molex not originally taking that
expense out of net income it makes a bad impression to investors. Although goodwill
or goodwill impairment cannot reasonably be forecasted, it is still known that net
income will have this significant difference. The two different growth rates were both
configured by taking the average of past net incomes, the difference come out so
strong because of the impairment expense. If Molex were to be honest about their
expense issues like this would not arise.
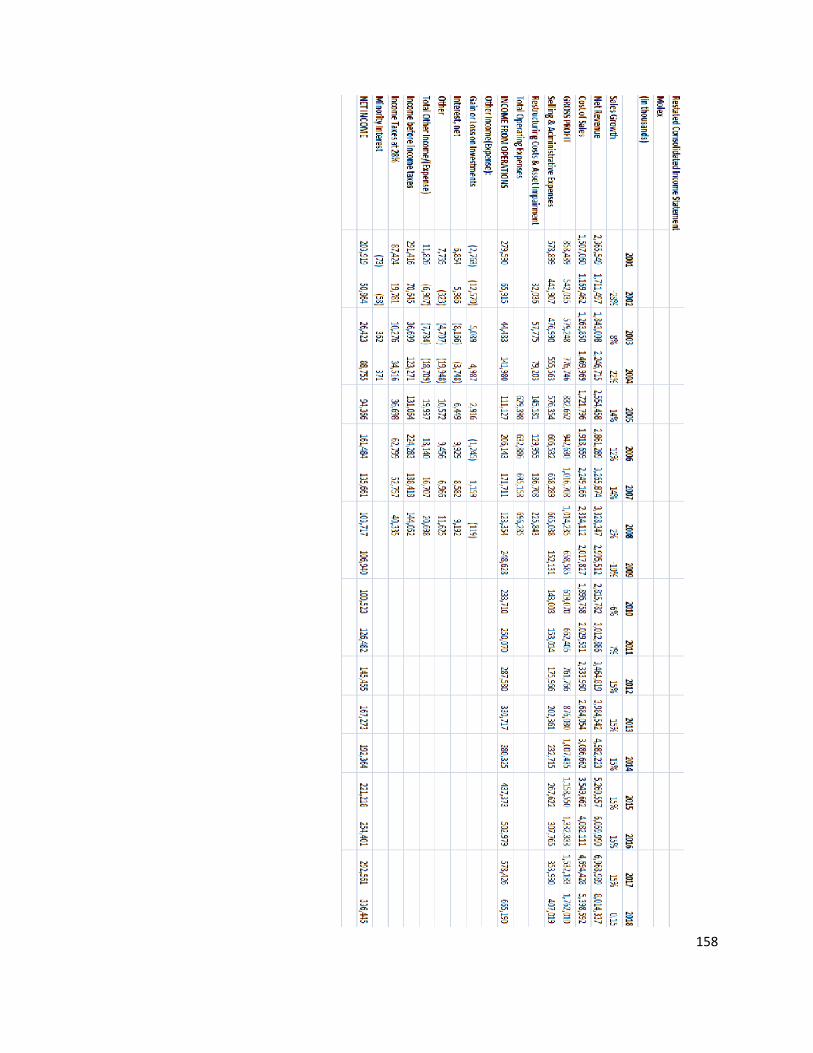
158

159

160
Balance Sheet:
The second financial statement to forecast is the balance sheet. This statement
informs an investor about the company’s assets, liabilities, and stockholder’s equity to
the extent that an investor would need to know about a company. By predicting a
company’s balance sheet a manager can have a better view of how retained earnings
are going to look in the future.
The base of the balance sheet comes from the future sales growth that was
anticipated on the income statement and to further link the two statements asset
turnover is used. By using the forecasted sales from the income statement and
combining those numbers into with the total asset turnover ratio of 1.05, the value for
future assets can be forecasted. The figure 1.05 was used for asset turnover because it
was the best fit in reference to the trend that was shown on the graph.
The next step in forecasting the balance sheet after predicting total assets is to
determine non-current assets. This is calculated by having non-current assets as a
percentage of total assets. The decided percentage of total assets as non-current
assets is 50%. In the electronics industry about half of the assets are current and half
of them are non-current which is why we are comfortable with using this percentage for
Molex. From here the current liabilities can be forecasted by using the current ratio
that was already configured and the current assets that has already been forecasted.
The current ratio that we decided to use was 2.7 because of the prior year’s ratios.
After assets and liabilities you move down to the stockholder’s equity portion of
the balance sheet. When forecasting retained earnings the following formula is used:
Retained Earnings = beginning balance retained earnings + Net Income – Dividends.
By using parts from all three of the financial statements retained earnings can be
forecasted. After retained earnings are calculated stockholder’s equity can be obtained
161
by simply adding the change in retained earnings to the previous year’s stockholder’s
equity.
After obtaining stockholder’s equity as well as total assets the last thing to
forecast is total liabilities. In order to find liabilities the common accounting equation,
assets = liabilities + equity, is used. According to accounting rules the equation for the
balance sheet has to balance or else there are serious problems. By subtracting out
current liabilities from total liabilities you get non-current liabilities to finish forecasting
the liabilities section of the balance sheet.
At this point there are still a few gaps that have to be filled in such as accounts
receivable as well as inventory. In order to find these numbers we simply used the
turnover for both of them. For accounts receivable we configured a 4.52 turnover, so
by multiplying net sales for the year by 4.52 will give you the accounts receivable
balance. The 4.52 turnover was taken from the accounts receivable turnover. To find
inventory a turnover of 5.97 was used which was taken from the inventory turnover
equation. By discovering these numbers investors will be able to have a good idea of
where the company’s balance sheets numbers will come from.
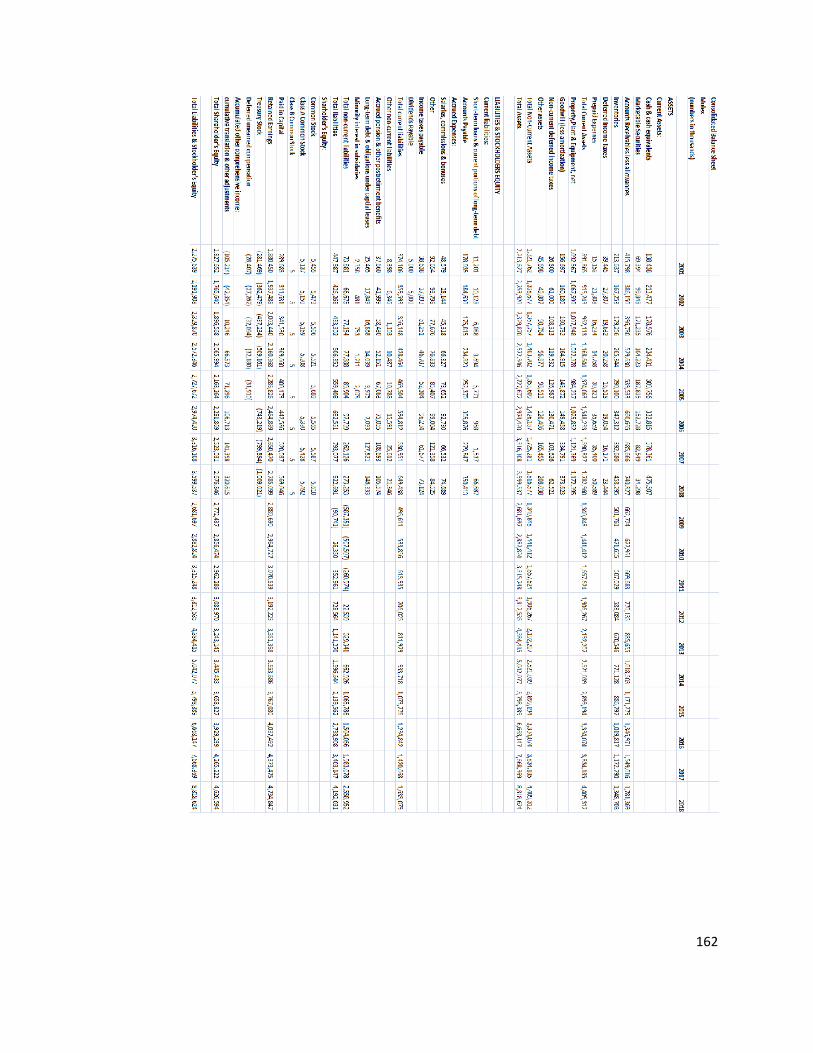
162

163

164
Restated Balance Sheet:
Due to Molex having understating their goodwill impairment, the financial
statements had to be restated so that investors could see the real status of the
company. Since goodwill is an asset the financial statement that gets affected the most
is the balance sheet. In the process of restating the financials goodwill was impaired by
20% which in-turn affects both assets and stockholder’s equity.
Given that stockholder’s equity is decreased because of the restating and net
earnings being decreased, retained earnings will also reflect this change. The total
assets turnover rate changed from 1.05 to 1.1 for the restated balance sheet. The
problem with this increase is that it decreases means that total assets is going to be
less than what the original version of the balance sheet states. Even though goodwill
was impaired it can be assumed that total assets will increase over time because of the
consistent sales growth. Since assets as a whole is decreasing non-current assets,
accounts receivable, and inventory will all use the same growth rates that were used in
the original balance sheet.
Net sales can only increase as much as inventory is increased because a
company cannot sell goods that it does not have. The goal of a company would be as
efficient as possible which would mean as inventory comes in the company wants to sell
it as soon as it can. If Molex has goods sitting on the floor for a long time then they
are losing money, and if they are selling goods before they have them problems will
come.
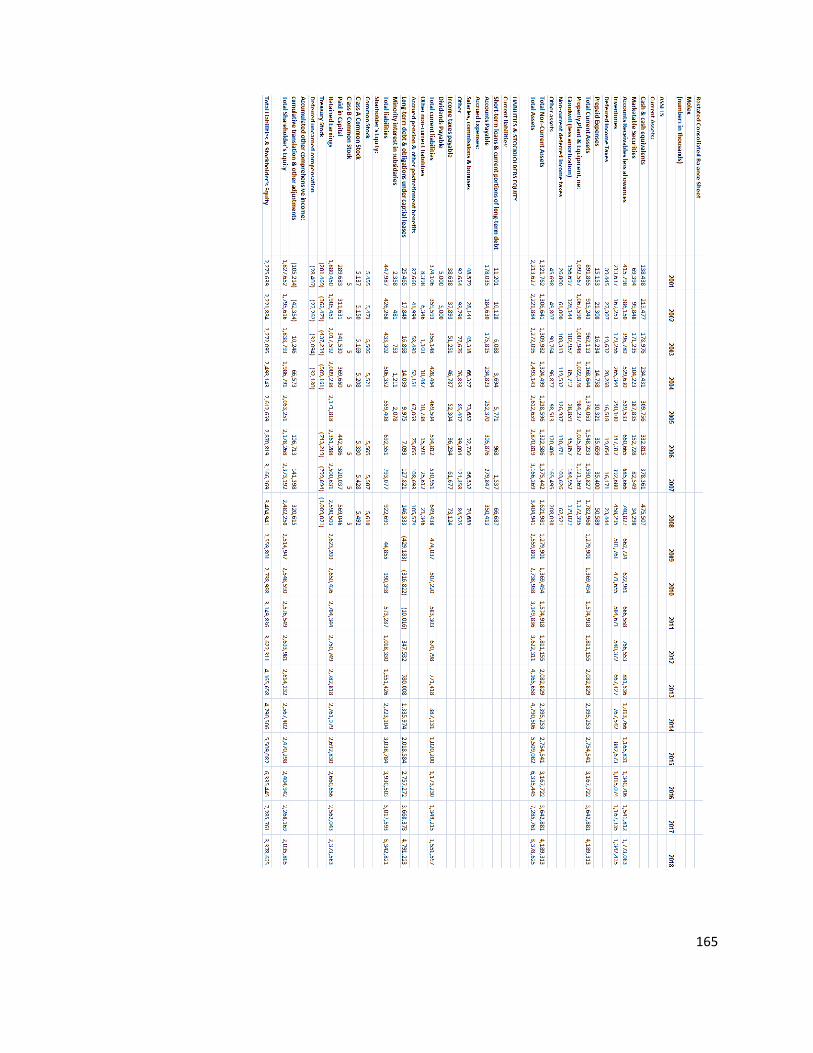
165
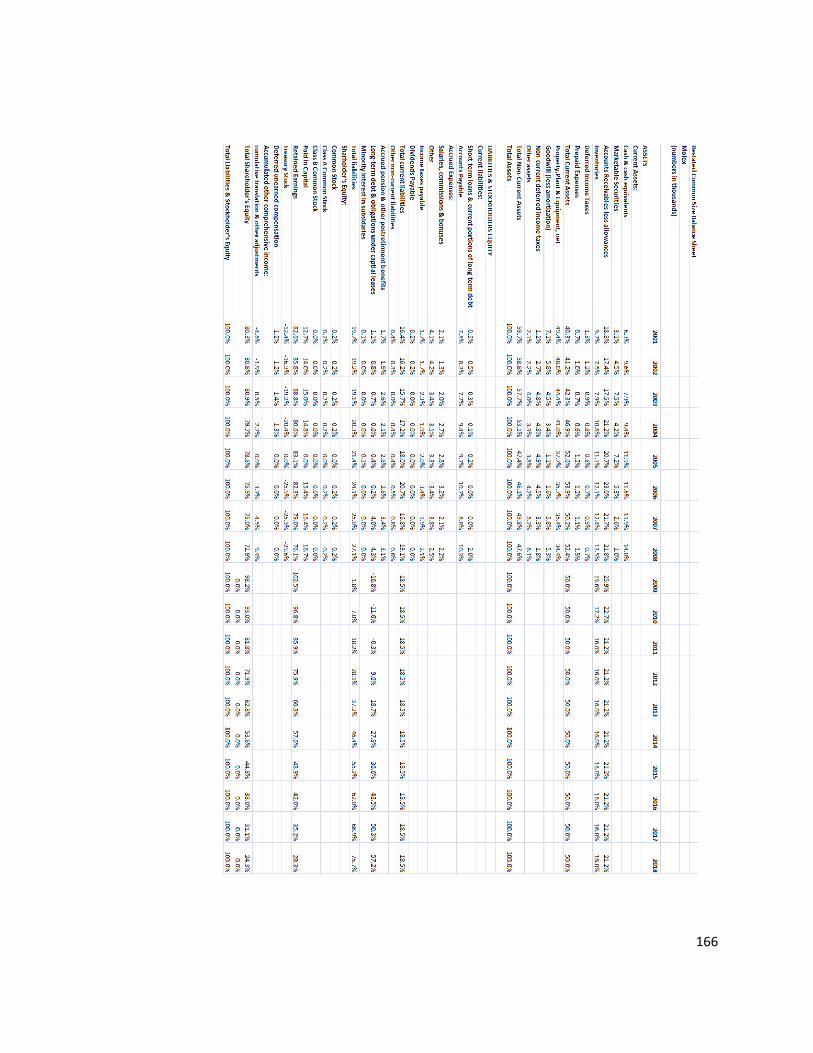
166

167
Statement of Cash Flows:
The final statement to forecast is the statement of cash flows. This statement is
forecasted last because it is the most difficult and imprecise, this holds true even when
have all of the information because the statement of cash flows does not always match
the company’s income statement and balance sheet. Despite the difficulty of this
statement it is still needs to be forecasted because of the information that it holds. The
statement tells investors the cash flow from operations, cash flow from investing, and
cash flow from financing activities. Out of all three of these components of the
statement the cash flow from operations is the most important because it tells how
efficient the firms is as well as if the firm is gather more debt or contributing to
operations for the future.
When forecasting the statement of cash flows we looked for what rate was going
to give Molex a stable guide in evaluating the growth and or decline. In finding the
cash flow from operation there are three choices which are: CFFO/Net Sales, CFFO/Net
Income, and CFFO/Operating Income. The equation that gave the best results for
Molex was CFFO/Net Sales. The equation told us that 16.5% was the rate to use in
order to calculate the growth for cash in operating activities. Net income was
calculated in the income statement so it was transferred to the statement of cash flows.
After the operating activities are calculated we moved down to the investing
activities. Since the electronics industry does not invests as quite as much as they
spend in operating activities, we felt that it was necessary to use a growth rate of 15%,
for the years not in recession, which is just below the growth rate of operating
activities. The 15% growth rate was calculated by analyzing the growth rate in non-
current assets.
The final section of the statement of cash flows is the cash flow from financing
activities. The first part of the financing activities to compute is the dividends. Looking

168
back at Molex’s dividend history we found that it increased about every three years at a
30% growth rate. We applied that same concept to the forecasting of dividends in
order to create the numbers. Due to the difficulty that the statement of cash flows
already holds, it is nearly impossible to calculate financing activities. It is an
unpredictable number to measure without having more information provided by Molex.

169
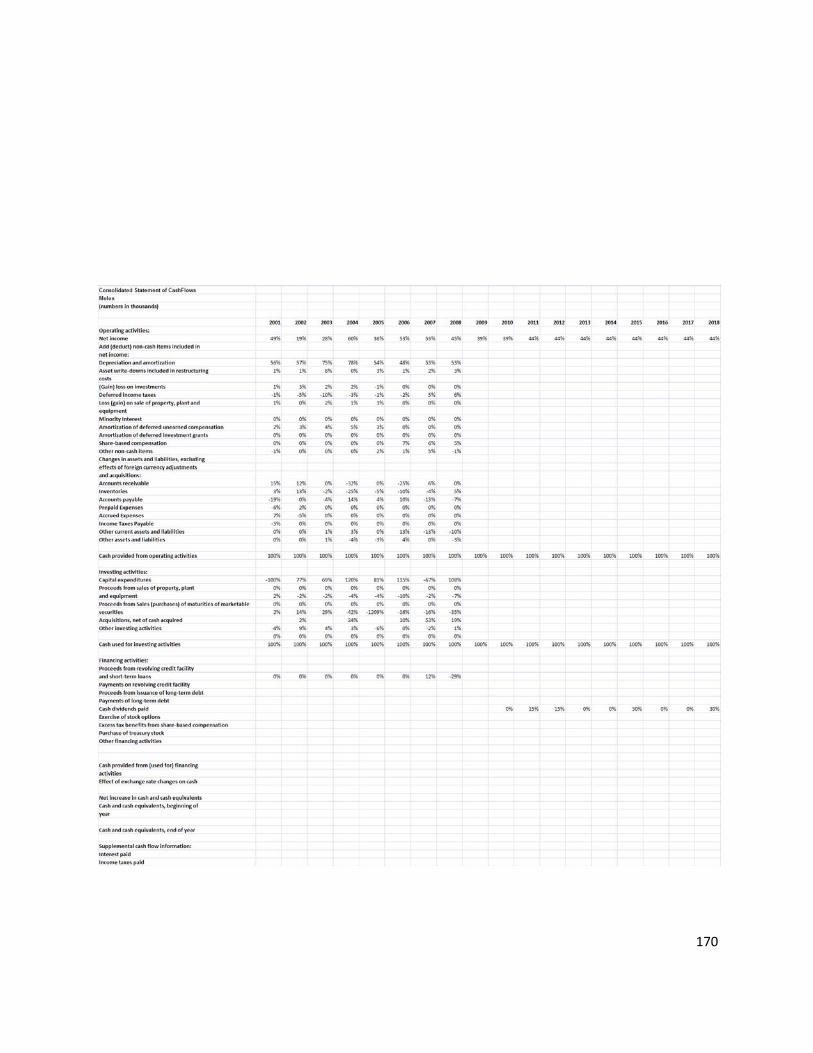
170

171
Restated Statement of Cash Flows:
The restated statement of cash flows is calculated the exact same as the original
statement of cash flow. The differences between the two are that the restated includes
the goodwill impairment which affects net income a significant amount. Since net
income is affected, that means that cash flows from operating activities is less than
what is stated on the original version of the statement. The difference between the
restated and original net incomes, after the recession in 2012, comes out to be 58%.
The difference between the two net incomes is a significant amount due to the lack of
goodwill impairment in the original financials.

172
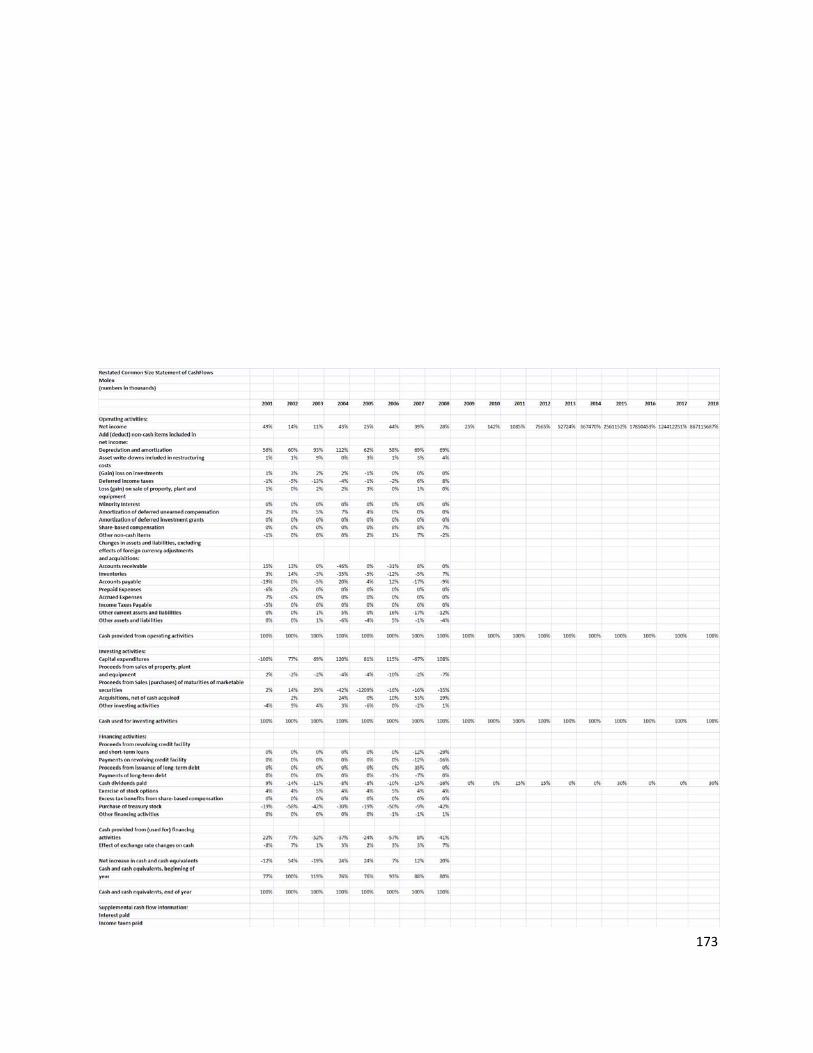
173
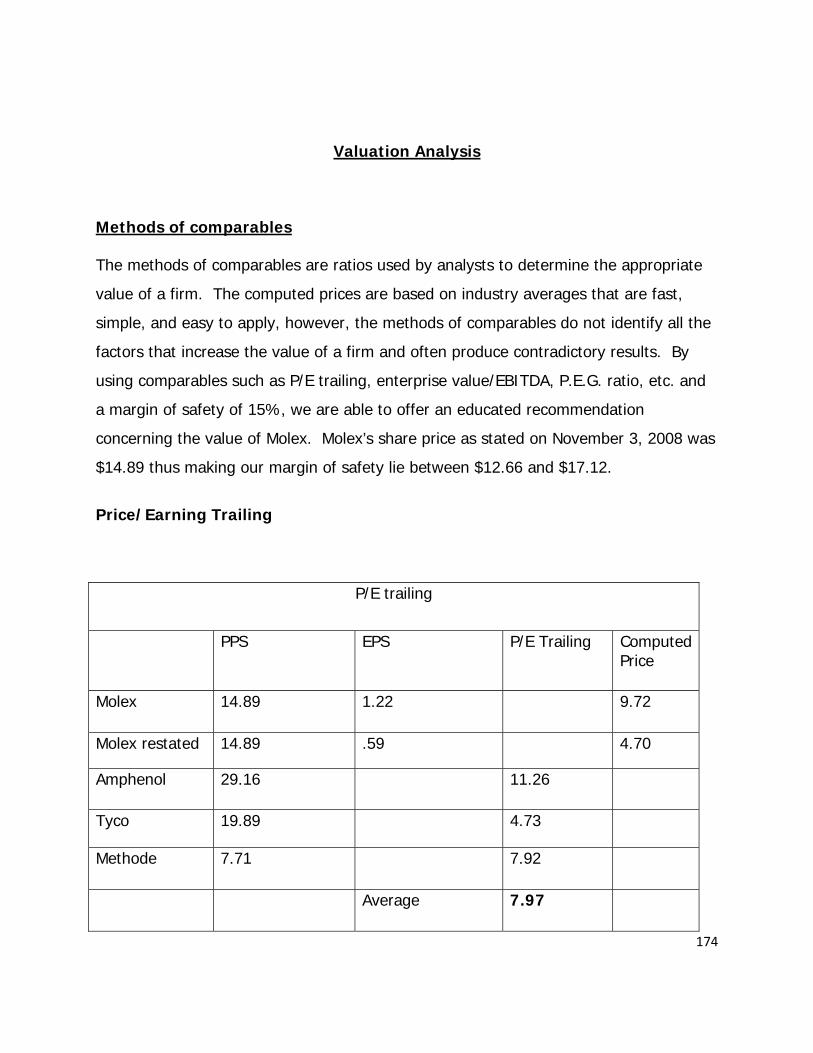
174
Valuation Analysis
Methods of comparables
The methods of comparables are ratios used by analysts to determine the appropriate
value of a firm. The computed prices are based on industry averages that are fast,
simple, and easy to apply, however, the methods of comparables do not identify all the
factors that increase the value of a firm and often produce contradictory results. By
using comparables such as P/E trailing, enterprise value/EBITDA, P.E.G. ratio, etc. and
a margin of safety of 15%, we are able to offer an educated recommendation
concerning the value of Molex. Molex’s share price as stated on November 3, 2008 was
$14.89 thus making our margin of safety lie between $12.66 and $17.12.
Price/Earning Trailing
P/E trailing
PPS EPS P/E Trailing Computed Price
Molex 14.89 1.22 9.72
Molex restated 14.89 .59 4.70
Amphenol 29.16 11.26
Tyco 19.89 4.73
Methode 7.71 7.92
Average 7.97
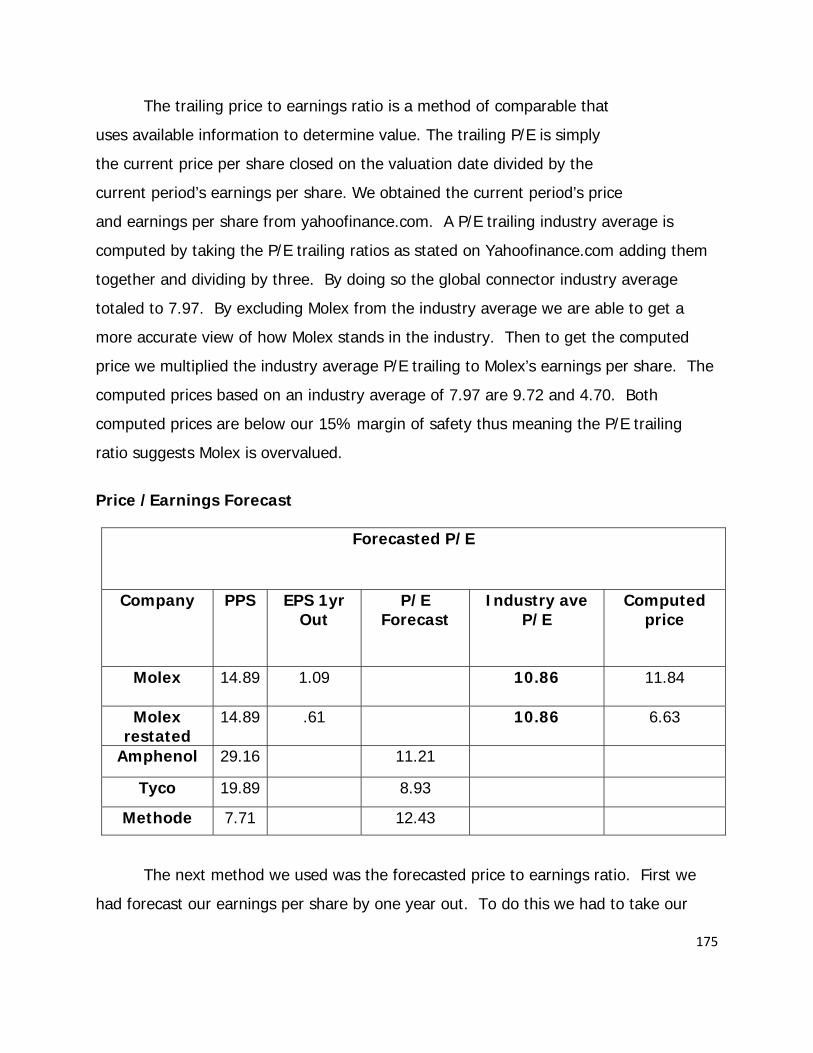
175
The trailing price to earnings ratio is a method of comparable that
uses available information to determine value. The trailing P/E is simply
the current price per share closed on the valuation date divided by the
current period’s earnings per share. We obtained the current period’s price
and earnings per share from yahoofinance.com. A P/E trailing industry average is
computed by taking the P/E trailing ratios as stated on Yahoofinance.com adding them
together and dividing by three. By doing so the global connector industry average
totaled to 7.97. By excluding Molex from the industry average we are able to get a
more accurate view of how Molex stands in the industry. Then to get the computed
price we multiplied the industry average P/E trailing to Molex’s earnings per share. The
computed prices based on an industry average of 7.97 are 9.72 and 4.70. Both
computed prices are below our 15% margin of safety thus meaning the P/E trailing
ratio suggests Molex is overvalued.
Price /Earnings Forecast
Forecasted P/E
Company PPS EPS 1yr Out
P/E Forecast
Industry ave P/E
Computed price
Molex 14.89 1.09 10.86 11.84
Molex restated
14.89 .61 10.86 6.63
Amphenol 29.16 11.21
Tyco 19.89 8.93
Methode 7.71 12.43
The next method we used was the forecasted price to earnings ratio. First we
had forecast our earnings per share by one year out. To do this we had to take our
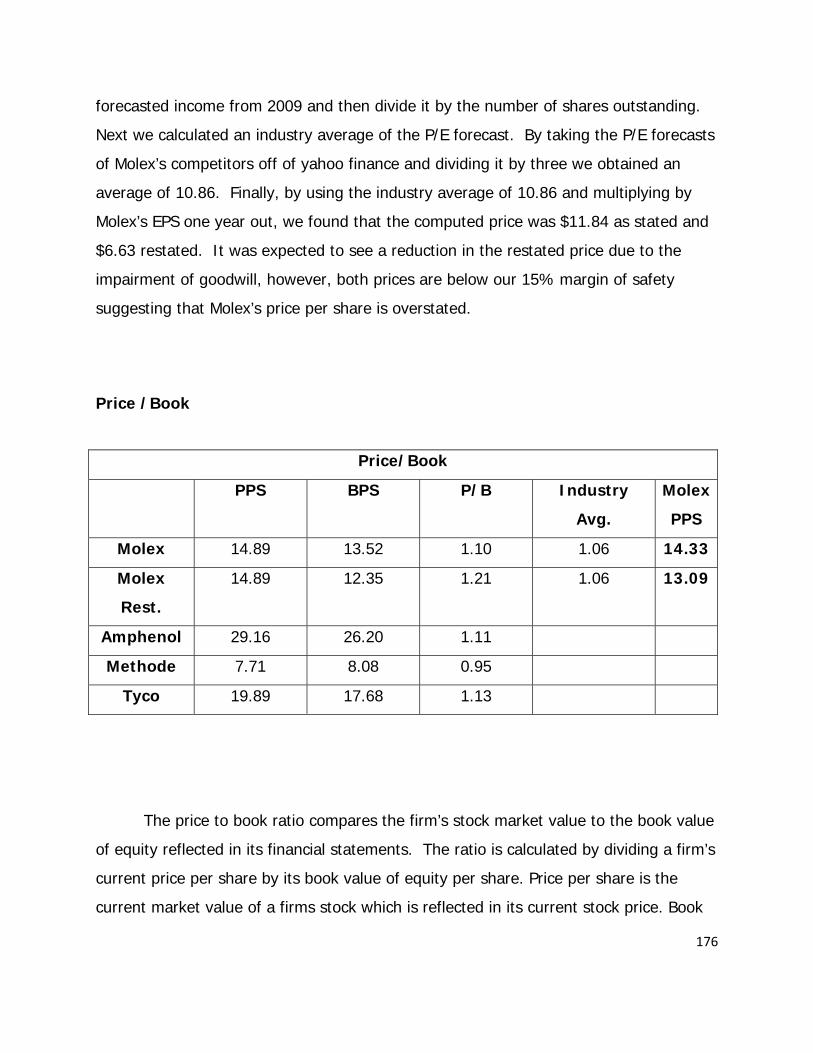
176
forecasted income from 2009 and then divide it by the number of shares outstanding.
Next we calculated an industry average of the P/E forecast. By taking the P/E forecasts
of Molex’s competitors off of yahoo finance and dividing it by three we obtained an
average of 10.86. Finally, by using the industry average of 10.86 and multiplying by
Molex’s EPS one year out, we found that the computed price was $11.84 as stated and
$6.63 restated. It was expected to see a reduction in the restated price due to the
impairment of goodwill, however, both prices are below our 15% margin of safety
suggesting that Molex’s price per share is overstated.
Price /Book
The price to book ratio compares the firm’s stock market value to the book value
of equity reflected in its financial statements. The ratio is calculated by dividing a firm’s
current price per share by its book value of equity per share. Price per share is the
current market value of a firms stock which is reflected in its current stock price. Book
Price/Book
PPS BPS P/B Industry
Avg.
Molex
PPS
Molex 14.89 13.52 1.10 1.06 14.33
Molex
Rest.
14.89 12.35 1.21 1.06 13.09
Amphenol 29.16 26.20 1.11
Methode 7.71 8.08 0.95
Tyco 19.89 17.68 1.13
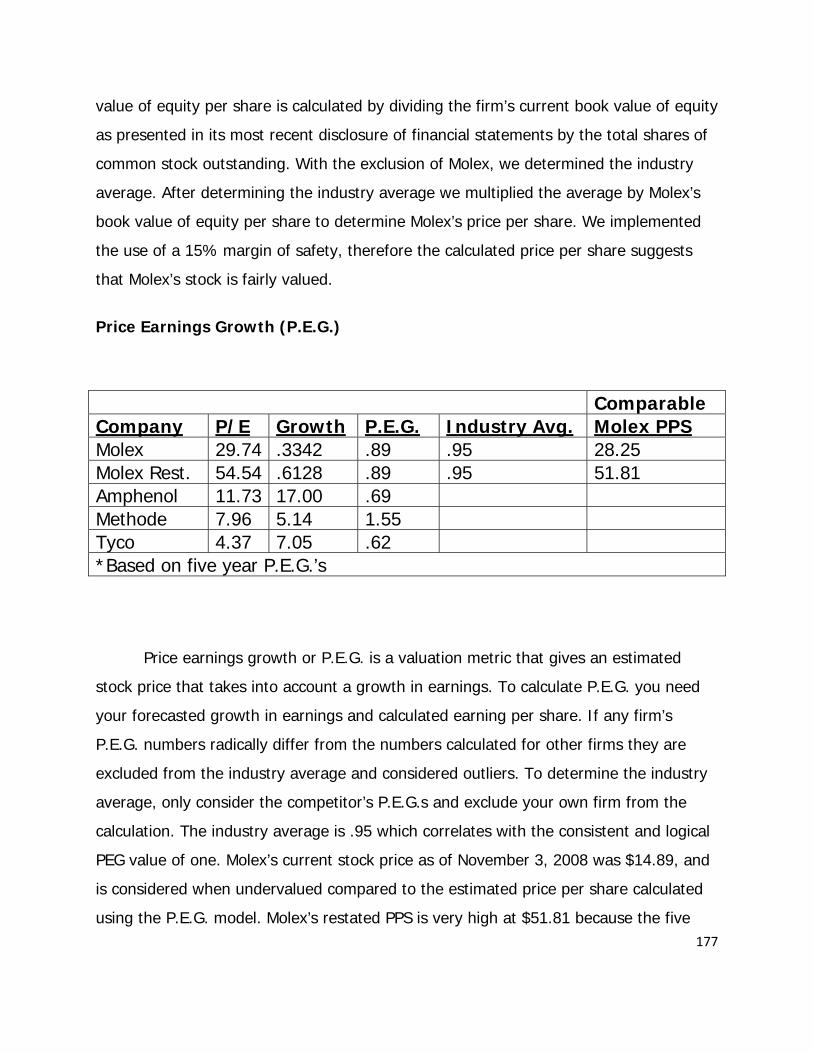
177
value of equity per share is calculated by dividing the firm’s current book value of equity
as presented in its most recent disclosure of financial statements by the total shares of
common stock outstanding. With the exclusion of Molex, we determined the industry
average. After determining the industry average we multiplied the average by Molex’s
book value of equity per share to determine Molex’s price per share. We implemented
the use of a 15% margin of safety, therefore the calculated price per share suggests
that Molex’s stock is fairly valued.
Price Earnings Growth (P.E.G.)
Comparable Company P/E Growth P.E.G. Industry Avg. Molex PPS Molex 29.74 .3342 .89 .95 28.25 Molex Rest. 54.54 .6128 .89 .95 51.81 Amphenol 11.73 17.00 .69 Methode 7.96 5.14 1.55 Tyco 4.37 7.05 .62 *Based on five year P.E.G.’s
Price earnings growth or P.E.G. is a valuation metric that gives an estimated
stock price that takes into account a growth in earnings. To calculate P.E.G. you need
your forecasted growth in earnings and calculated earning per share. If any firm’s
P.E.G. numbers radically differ from the numbers calculated for other firms they are
excluded from the industry average and considered outliers. To determine the industry
average, only consider the competitor’s P.E.G.s and exclude your own firm from the
calculation. The industry average is .95 which correlates with the consistent and logical
PEG value of one. Molex’s current stock price as of November 3, 2008 was $14.89, and
is considered when undervalued compared to the estimated price per share calculated
using the P.E.G. model. Molex’s restated PPS is very high at $51.81 because the five
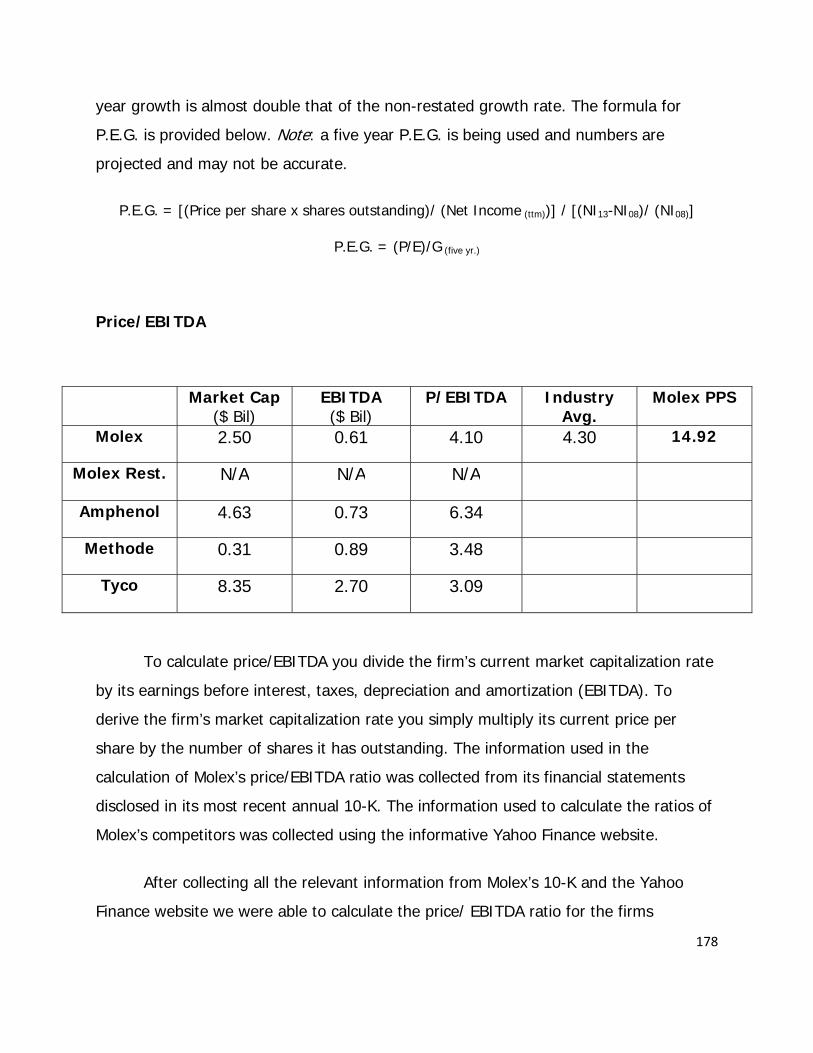
178
year growth is almost double that of the non-restated growth rate. The formula for
P.E.G. is provided below. Note: a five year P.E.G. is being used and numbers are
projected and may not be accurate.
P.E.G. = [(Price per share x shares outstanding)/ (Net Income (ttm))] / [(NI13-NI08)/ (NI08)]
P.E.G. = (P/E)/G (five yr.)
Price/EBITDA
To calculate price/EBITDA you divide the firm’s current market capitalization rate
by its earnings before interest, taxes, depreciation and amortization (EBITDA). To
derive the firm’s market capitalization rate you simply multiply its current price per
share by the number of shares it has outstanding. The information used in the
calculation of Molex’s price/EBITDA ratio was collected from its financial statements
disclosed in its most recent annual 10-K. The information used to calculate the ratios of
Molex’s competitors was collected using the informative Yahoo Finance website.
After collecting all the relevant information from Molex’s 10-K and the Yahoo
Finance website we were able to calculate the price/ EBITDA ratio for the firms
Market Cap ($ Bil)
EBITDA ($ Bil)
P/EBITDA Industry Avg.
Molex PPS
Molex 2.50 0.61 4.10 4.30 14.92
Molex Rest. N/A N/A N/A
Amphenol 4.63 0.73 6.34
Methode 0.31 0.89 3.48
Tyco 8.35 2.70 3.09

179
operating within our industry. We then calculated the industry average, excluding Molex
and multiplied that by Molex’s price per share. We converted our answer to a per share
basis by dividing our calculation by Molex’s number of shares outstanding. The ratio’s
suggested price per share for Molex is within our 15% margin of safety which implies
that the company is fairly valued.
Enterprise Value/EBITDA
EV ($ Bil) EBITDA ($ Bil) EV/EBITDA Industry Avg.
Molex PPS
Molex 2.46 0.61 4.03 4.88 16.93
Molex Rest. N/A N/A N/A
Amphenol 5.81 0.73 7.96
Methode 0.20 0.89 2.25
Tyco 12 2.70 4.44
The enterprise value / EBITDA ratio is preferred by many analysts to the price to
book ratio because this particular ratio is unaffected by a firm’s capital structure. The
components of this ratio allow analysts to compare values of a business, free from debt,
to its earnings before interest. The components within this ratio consist of the firm’s
enterprise value and its earnings before interest, taxes, depreciation and amortization.
The first step in calculating the EV/EBITDA comparable is to determine the
enterprise value of the firm. Enterprise value is derived in adding the market value of
equity and the firm’s book value of liabilities minus cash and investments. After
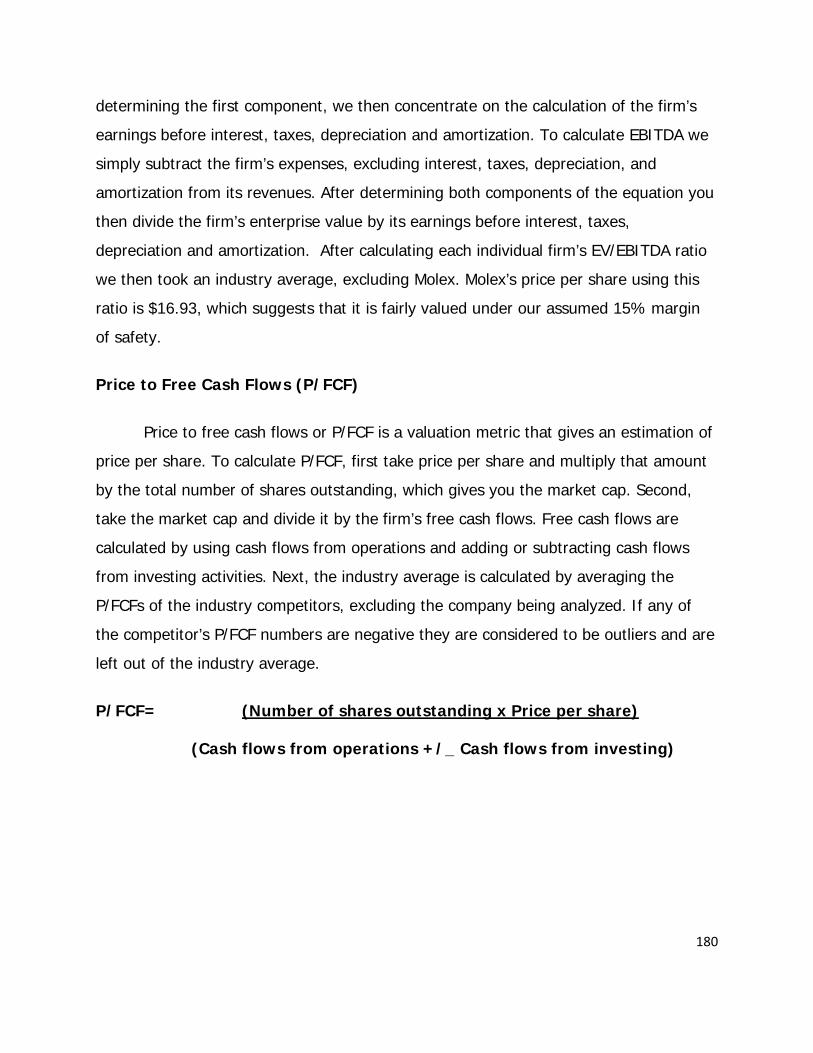
180
determining the first component, we then concentrate on the calculation of the firm’s
earnings before interest, taxes, depreciation and amortization. To calculate EBITDA we
simply subtract the firm’s expenses, excluding interest, taxes, depreciation, and
amortization from its revenues. After determining both components of the equation you
then divide the firm’s enterprise value by its earnings before interest, taxes,
depreciation and amortization. After calculating each individual firm’s EV/EBITDA ratio
we then took an industry average, excluding Molex. Molex’s price per share using this
ratio is $16.93, which suggests that it is fairly valued under our assumed 15% margin
of safety.
Price to Free Cash Flows (P/FCF)
Price to free cash flows or P/FCF is a valuation metric that gives an estimation of
price per share. To calculate P/FCF, first take price per share and multiply that amount
by the total number of shares outstanding, which gives you the market cap. Second,
take the market cap and divide it by the firm’s free cash flows. Free cash flows are
calculated by using cash flows from operations and adding or subtracting cash flows
from investing activities. Next, the industry average is calculated by averaging the
P/FCFs of the industry competitors, excluding the company being analyzed. If any of
the competitor’s P/FCF numbers are negative they are considered to be outliers and are
left out of the industry average.
P/FCF= (Number of shares outstanding x Price per share)
(Cash flows from operations +/_ Cash flows from investing)
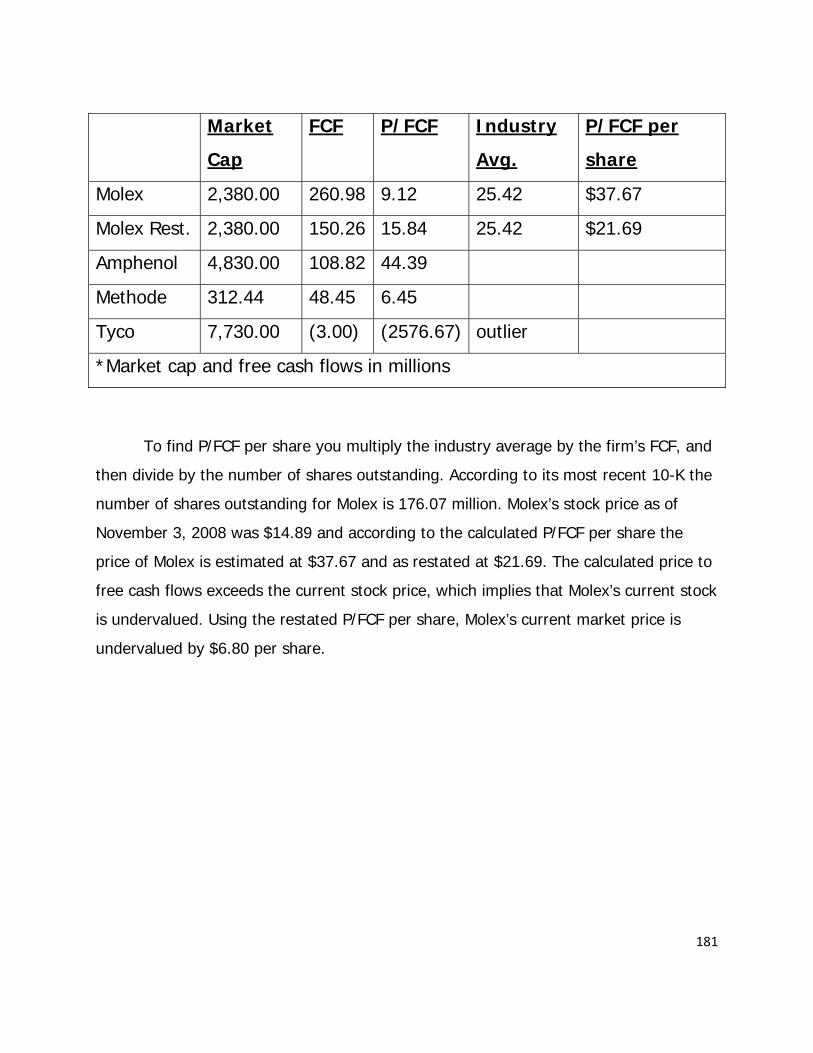
181
To find P/FCF per share you multiply the industry average by the firm’s FCF, and
then divide by the number of shares outstanding. According to its most recent 10-K the
number of shares outstanding for Molex is 176.07 million. Molex’s stock price as of
November 3, 2008 was $14.89 and according to the calculated P/FCF per share the
price of Molex is estimated at $37.67 and as restated at $21.69. The calculated price to
free cash flows exceeds the current stock price, which implies that Molex’s current stock
is undervalued. Using the restated P/FCF per share, Molex’s current market price is
undervalued by $6.80 per share.
Market
Cap
FCF P/FCF Industry
Avg.
P/FCF per
share
Molex 2,380.00 260.98 9.12 25.42 $37.67
Molex Rest. 2,380.00 150.26 15.84 25.42 $21.69
Amphenol 4,830.00 108.82 44.39
Methode 312.44 48.45 6.45
Tyco 7,730.00 (3.00) (2576.67) outlier
*Market cap and free cash flows in millions
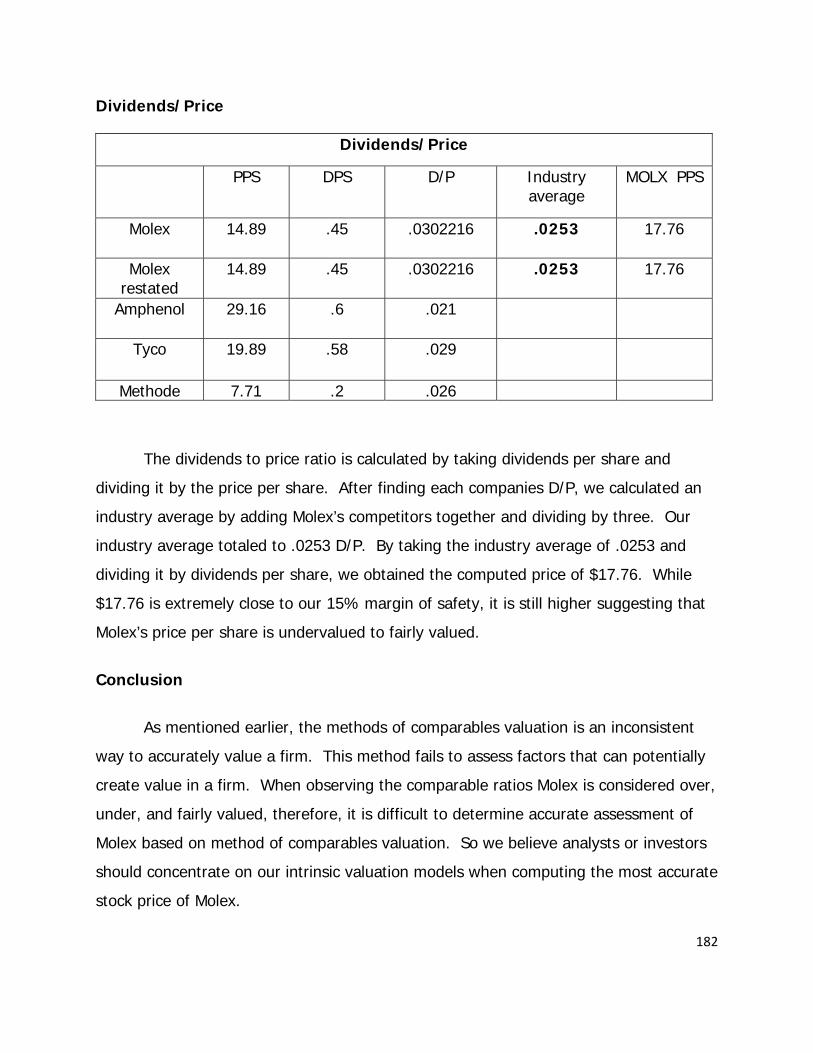
182
Dividends/Price
Dividends/Price
PPS DPS D/P Industry average
MOLX PPS
Molex 14.89 .45 .0302216 .0253 17.76
Molex restated
14.89 .45 .0302216 .0253 17.76
Amphenol 29.16 .6 .021
Tyco 19.89 .58 .029
Methode 7.71 .2 .026
The dividends to price ratio is calculated by taking dividends per share and
dividing it by the price per share. After finding each companies D/P, we calculated an
industry average by adding Molex’s competitors together and dividing by three. Our
industry average totaled to .0253 D/P. By taking the industry average of .0253 and
dividing it by dividends per share, we obtained the computed price of $17.76. While
$17.76 is extremely close to our 15% margin of safety, it is still higher suggesting that
Molex’s price per share is undervalued to fairly valued.
Conclusion
As mentioned earlier, the methods of comparables valuation is an inconsistent
way to accurately value a firm. This method fails to assess factors that can potentially
create value in a firm. When observing the comparable ratios Molex is considered over,
under, and fairly valued, therefore, it is difficult to determine accurate assessment of
Molex based on method of comparables valuation. So we believe analysts or investors
should concentrate on our intrinsic valuation models when computing the most accurate
stock price of Molex.
183
Intrinsic Valuation Models
The intrinsic valuation models offer a more accurate valuation of a firm when
compared to the method of comparables. This model offers more theory based
assumptions which enable you to compute a current stock price estimation of a firm.
The intrinsic valuations include: the dividend discount model, discounted free cash flow
model, residual income model, abnormal earnings growth model, and the long-run
residual income model. The sensitivity analysis will show us how small changes in the
cost of equity or growth rate affect the time consistent price per share. We believe that
the intrinsic valuation models will present us with an accurate overall value of Molex.
Discounted Dividend Model
The dividend discount model is a calculation of the present value of all future
dividends to be paid from a company. This model has the lowest explanatory power out
of all of the intrinsic valuation models; mainly because of the difficulty of forecasting
future dividends ten years down the road. This model has many fatal flaws that should
concern investors or analysts when using it. First, the model assumes that dividends are
going to grow at a constant rate throughout time, but even if we assume this it is still
very difficult to forecast how much a company is going to pay in dividends years and
years into the future. Another flaw of this model is that it assumes the same rate of
return throughout time, when in real life the rate of return is going to change
throughout time.
To calculate the value of Molex’s stock using the dividend discount model we took the
total dividends paid from our companies forecasted financial statements and divided
them by the number of shares outstanding. This gave us the total amount of dividends
per share. We then calculated the present value of each year’s dividend by taking the
dividend per share for that year and multiplying it by a present value factor. This gave
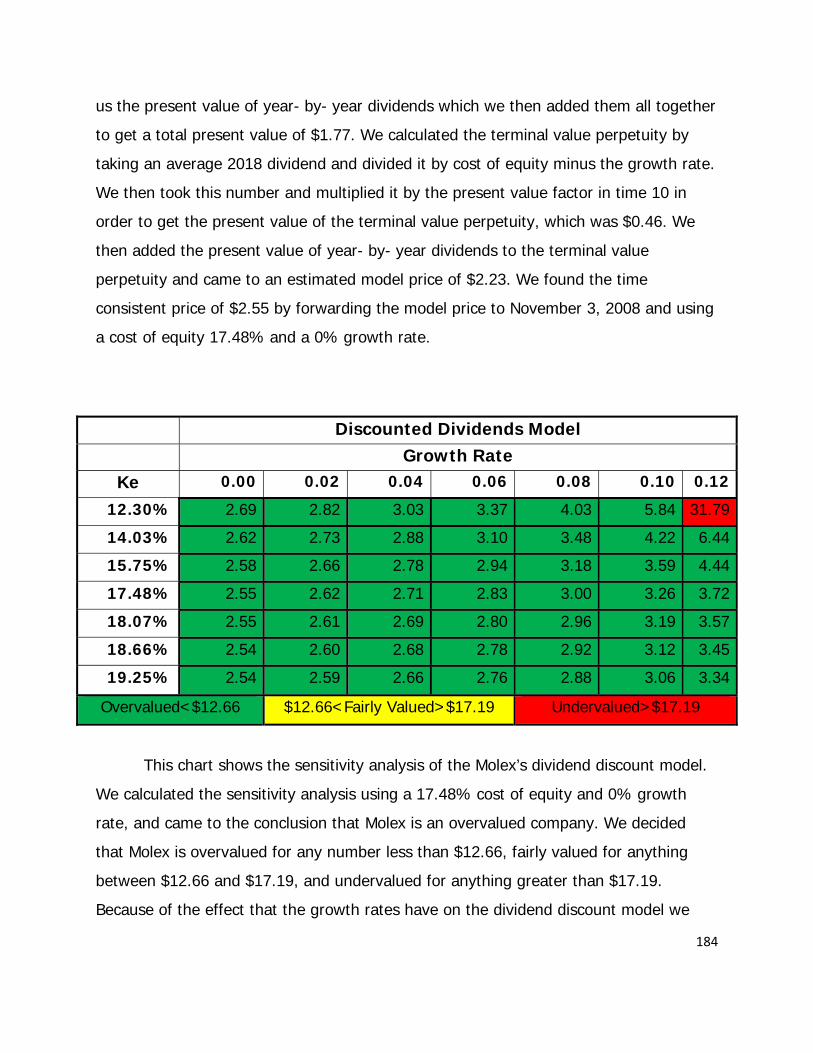
184
us the present value of year- by- year dividends which we then added them all together
to get a total present value of $1.77. We calculated the terminal value perpetuity by
taking an average 2018 dividend and divided it by cost of equity minus the growth rate.
We then took this number and multiplied it by the present value factor in time 10 in
order to get the present value of the terminal value perpetuity, which was $0.46. We
then added the present value of year- by- year dividends to the terminal value
perpetuity and came to an estimated model price of $2.23. We found the time
consistent price of $2.55 by forwarding the model price to November 3, 2008 and using
a cost of equity 17.48% and a 0% growth rate.
This chart shows the sensitivity analysis of the Molex’s dividend discount model.
We calculated the sensitivity analysis using a 17.48% cost of equity and 0% growth
rate, and came to the conclusion that Molex is an overvalued company. We decided
that Molex is overvalued for any number less than $12.66, fairly valued for anything
between $12.66 and $17.19, and undervalued for anything greater than $17.19.
Because of the effect that the growth rates have on the dividend discount model we
Discounted Dividends Model Growth Rate
Ke 0.00 0.02 0.04 0.06 0.08 0.10 0.12
12.30% 2.69 2.82 3.03 3.37 4.03 5.84 31.79
14.03% 2.62 2.73 2.88 3.10 3.48 4.22 6.44
15.75% 2.58 2.66 2.78 2.94 3.18 3.59 4.44
17.48% 2.55 2.62 2.71 2.83 3.00 3.26 3.72
18.07% 2.55 2.61 2.69 2.80 2.96 3.19 3.57
18.66% 2.54 2.60 2.68 2.78 2.92 3.12 3.45
19.25% 2.54 2.59 2.66 2.76 2.88 3.06 3.34
Overvalued<$12.66 $12.66<Fairly Valued>$17.19 Undervalued>$17.19

185
found that these number are somewhat skewed. Also, because dividends are so
sensitive to growth rates it suggests that this model is not very accurate in computing a
relevant stock price. But in the end, the dividend discount model suggests that Molex is
an overvalued company.
Discounted Free Cash Flow Model
The discounted free cash flows model is used to determine the intrinsic value of
a firm’s equity. The model uses both present values of forecasted cash flows and
present values of the continuing perpetuity. To find the present value of the perpetuity
we used the weighted average cost of capital before taxes (WACCBT ). The WACCBT is
used to avoid the double taxation of net income, because it is included in cash flows
from operations. To find the present value of forecasted cash flows take cash flows
from operations (CFFO) minus cash flows from investments (CFFI) for time zero
through time ten. The numbers calculated above must now be multiplied by their
individual present value factor. The present value factor gives you the value of equity
from time zero through time ten and is calculated using the following formula = 1/
[(1+WACCBT) ^n]. Then you must add all the year by year cash flows and the present
value of the terminal perpetuity. The perpetuity starts in year 2019, so it we must
discount it back to time zero dollars. Take the total present value of the year by year
cash flows and add the free cash flow perpetuity to get the market value of assets as of
December 31, 2008. To find the market value of equity take the market value of assets
and subtract book value of debt and preferred stock. Finally take market value of equity
and divide it by the total number of shares outstanding to get price per share as of
Dec.31, 2008.
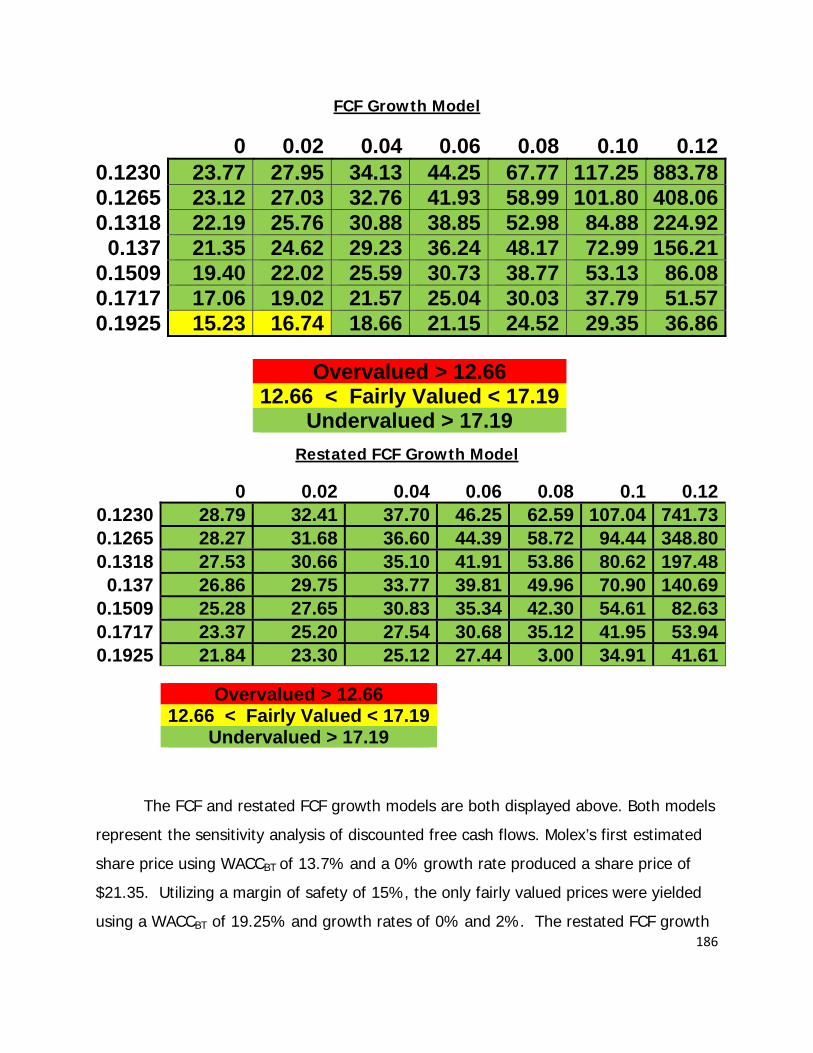
186
FCF Growth Model
0 0.02 0.04 0.06 0.08 0.10 0.120.1230 23.77 27.95 34.13 44.25 67.77 117.25 883.780.1265 23.12 27.03 32.76 41.93 58.99 101.80 408.060.1318 22.19 25.76 30.88 38.85 52.98 84.88 224.92
0.137 21.35 24.62 29.23 36.24 48.17 72.99 156.210.1509 19.40 22.02 25.59 30.73 38.77 53.13 86.080.1717 17.06 19.02 21.57 25.04 30.03 37.79 51.570.1925 15.23 16.74 18.66 21.15 24.52 29.35 36.86
Overvalued > 12.66 12.66 < Fairly Valued < 17.19
Undervalued > 17.19 Restated FCF Growth Model
0 0.02 0.04 0.06 0.08 0.1 0.120.1230 28.79 32.41 37.70 46.25 62.59 107.04 741.730.1265 28.27 31.68 36.60 44.39 58.72 94.44 348.800.1318 27.53 30.66 35.10 41.91 53.86 80.62 197.48
0.137 26.86 29.75 33.77 39.81 49.96 70.90 140.690.1509 25.28 27.65 30.83 35.34 42.30 54.61 82.630.1717 23.37 25.20 27.54 30.68 35.12 41.95 53.940.1925 21.84 23.30 25.12 27.44 3.00 34.91 41.61
Overvalued > 12.66 12.66 < Fairly Valued < 17.19
Undervalued > 17.19
The FCF and restated FCF growth models are both displayed above. Both models
represent the sensitivity analysis of discounted free cash flows. Molex’s first estimated
share price using WACCBT of 13.7% and a 0% growth rate produced a share price of
$21.35. Utilizing a margin of safety of 15%, the only fairly valued prices were yielded
using a WACCBT of 19.25% and growth rates of 0% and 2%. The restated FCF growth
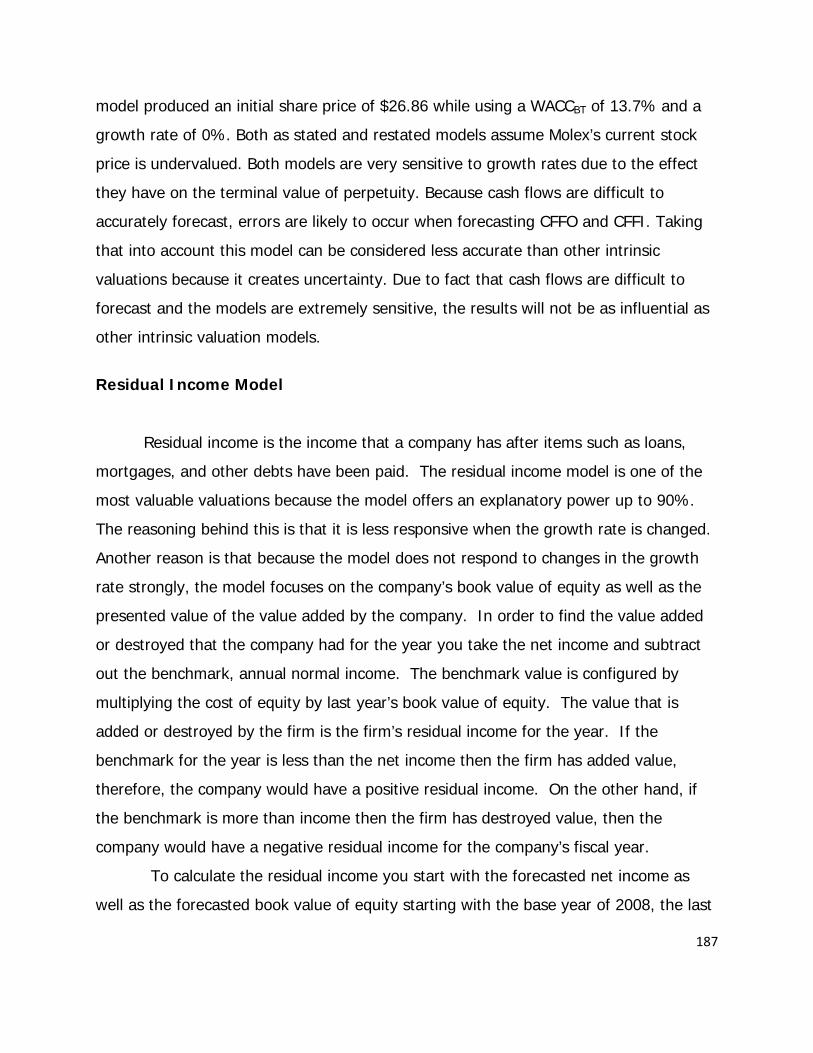
187
model produced an initial share price of $26.86 while using a WACCBT of 13.7% and a
growth rate of 0%. Both as stated and restated models assume Molex’s current stock
price is undervalued. Both models are very sensitive to growth rates due to the effect
they have on the terminal value of perpetuity. Because cash flows are difficult to
accurately forecast, errors are likely to occur when forecasting CFFO and CFFI. Taking
that into account this model can be considered less accurate than other intrinsic
valuations because it creates uncertainty. Due to fact that cash flows are difficult to
forecast and the models are extremely sensitive, the results will not be as influential as
other intrinsic valuation models.
Residual Income Model
Residual income is the income that a company has after items such as loans,
mortgages, and other debts have been paid. The residual income model is one of the
most valuable valuations because the model offers an explanatory power up to 90%.
The reasoning behind this is that it is less responsive when the growth rate is changed.
Another reason is that because the model does not respond to changes in the growth
rate strongly, the model focuses on the company’s book value of equity as well as the
presented value of the value added by the company. In order to find the value added
or destroyed that the company had for the year you take the net income and subtract
out the benchmark, annual normal income. The benchmark value is configured by
multiplying the cost of equity by last year’s book value of equity. The value that is
added or destroyed by the firm is the firm’s residual income for the year. If the
benchmark for the year is less than the net income then the firm has added value,
therefore, the company would have a positive residual income. On the other hand, if
the benchmark is more than income then the firm has destroyed value, then the
company would have a negative residual income for the company’s fiscal year.
To calculate the residual income you start with the forecasted net income as
well as the forecasted book value of equity starting with the base year of 2008, the last

188
year given in Molex’s 10-k. The book value of equity is determined by taking the book
value of equity of the past year plus the net income for the current year and then
subtracting out the forecasted dividends for the year. The next step to the residual
income model is to configure the benchmark, also known as the annual normal income.
The benchmark is calculated by multiplying the book value of equity of the previous
year by the cost of equity, Ke, which in Molex’s case is 15.78%. From here you subtract
out the benchmark value from the net income for the year in order to find the firm’s
residual income. After all of these values have been calculated it is time to put them all
into the current year’s dollars. This can be done by taking the residual income and
multiplying it by the present value factor for the year which is one plus the cost of
equity raised to the time period, (1+Ke)t. This number gives the year by year present
value of residual income.
The next number to calculate is the terminal value of the perpetuity. To order
estimate the perpetuity year’s, 2019, residual income by making it nine-two percent of
the last year’s, 2018, residual income and then divide that number by the result of cost
of equity minus the growth rate. The reason for this rate is that the book value of
equity is increasing about eight percent which means that the residual income is going
to decrease at the same rate. The reasoning behind the negative growth rate is
because the equilibrium theory states that residual income over a lengthy period of time
regresses back to zero.
To get the new market value of equity you add the book value of equity, the
total present value of year by year residual income, and the terminal value perpetuity.
From this point you divide by the number of shares outstanding, for Molex is 176,070
thousand, to get the estimated price per share which comes out to be $21.31. These
numbers are all according to the rules of the residual income model. To find the time
consistent price we divided the estimated price per share by (1+Ke)(10/12). The time
uses only ten months out of the year since the observed price is taken at November 3,
2008. From this point the time consistent price can be compared to the observed

189
model price of $14.89. For Molex, we decided to use a 15% margin of acceptance
which means that anything in-between 12.66 and 17.12 is fairly valued.
Sensitivity Analysis Residual Income Model Growth Rate
Ke -10% -20% -30% -40% -50% -60% -70%9.48% 15.71 13.33 11.89 10.86 10.07 9.42 8.88
11.48% 15.20 13.56 12.41 11.53 10.81 10.20 9.6713.48% 14.75 13.65 12.75 12.00 11.34 10.77 10.2715.48% 14.34 13.64 12.95 12.30 11.72 11.19 10.7117.48% 13.94 13.56 13.03 12.49 11.96 11.47 11.02
Over Valued < 12.66 12.66 < Fairly Valued <17.19
Under Valued > 17.19
Restated Sensitivity Analysis Residual Income Model Growth Rate
Ke -10% -20% -30% -40% -50% -60% -70%9.48% 11.60 11.20 10.66 10.13 9.65 9.20 8.80
11.48% 14.11 13.07 12.21 11.49 10.86 10.31 9.8213.48% 16.09 14.60 13.49 12.61 11.87 11.23 10.6815.48% 17.66 15.85 14.56 13.54 12.71 12.00 11.3917.48% 18.92 16.88 15.44 14.32 13.41 12.64 11.99
Over Valued < 12.66 12.66 < Fairly Valued < 17.19
Under Valued > 17.19
The charts above show the sensitivity analysis for both the original and restated
residual income growth model. By looking at the model we discovered that Molex is for
the mostly overvalued, somewhat fairly valued, and slightly undervalued. In the two

190
different models we noticed that the restated version is quite similar to the original
except for a slight shift up so that a couple of the boxes are undervalued.
Abnormal Earnings Growth Model
Abnormal earnings growth model is based off of information strictly from the
financial statements. In order to determine AEG there are several factors in which we
calculated first, for instance dividend reinvestment, cumulative dividend income, and
normal earnings. In order to calculate dividend reinvestment (DRIP), we multiplied the
cost of equity by dividends of the previous year. DRIP is based on the speculation that
investors will reinvest their cash dividends in a company’s stock with a return based on
the cost of equity. The cumulative dividend income is calculated by taking forecasted
earnings and adding it to the DRIP. Finally, Normal earnings are calculated by taking
net income of the previous year and multiplying it by one plus the cost of equity. After
obtaining the normal earnings and cumulative dividend income, A.E.G. can be
computed. By simply subtracting normal earnings from cumulative dividend income we
calculated Molex’s A.E.G. for each year. To ensure that our A.E.G. was accurate we
used the residual income as a check figure. By subtracting A.E.G. from our residual
income we received zeros for every year this insures our A.E.G. is correct.
Next we found the present value factor. The PV factor is calculated by
discounting back each year to 2009 by our cost of equity or by simply using the formula
1/(1+Ke)t. After calculating the PV factor, we multiplied the A.E.G of each year by the
PV factor of each year to determine the present value of A.E.G.. Finally, we computed
the total present value of A.E.G. by adding all the sums of the present values of A.E.G..
The next step to abnormal earnings growth model is to calculate the present value of
the terminal value perpetuity. To calculate the terminal value of perpetuity we took the
AEG of 2018 and multiplied it by a -1.5% growth rate. Then we took that number and
multiplied it by the present value factor of 2018 and discounted it back to time zero.

191
Subsequently, by adding Molex’s net income, total present value of A.E.G., and the
present value of the terminal value, we found our total average net income of the
perpetuity.
After computing the average net income we were able to find the EPS of the
perpetuity. By dividing the total average net income of the perpetuity by the total
shares outstanding of 176,070,000, we calculated the earnings per share of the
perpetuity to be 1.64 as stated and 1.43 restated. Next we calculated the intrinsic
value per share by dividing the EPS of the perpetuity by the cost of equity and found
that to be 9.38 as stated and 8.16 restated. After finding the intrinsic value we put our
values on a time consistent basis. To do this we took our intrinsic value per share price
times one plus the cost of equity to the 10/12 power.
Sensitivity Analysis AEG Model Growth Rate
Ke -10% -20% -30% -40% -50% -60% -70% 9.48% 27.38 25.24 24.19 23.56 23.14 22.85 22.62 11.48% 19.45 18.35 17.79 17.44 17.21 17.04 16.91 13.48% 14.51 13.95 13.64 13.45 13.32 13.48 13.15 15.48% 11.27 10.98 10.82 10.71 10.64 10.59 10.55 17.48% 9.03 8.89 8.81 8.76 8.72 8.69 8.67
Over Valued < 12.66 12.66 < Fairly Valued < 17.19
Under Valued > 17.19
Restated Sensitivity Analysis AEG Model Growth Rate
Ke -10% -20% -30% -40% -50% -60% -70% 9.48% 18.81 17.24 16.46 16.00 15.69 15.47 15.31 11.48% 13.85 12.97 12.51 12.24 12.05 11.91 11.81 13.48% 10.70 10.19 9.91 9.74 9.62 9.54 9.47 15.48% 8.58 8.28 8.11 8.00 7.92 7.87 7.83 17.48% 7.09 6.91 6.80 6.73 6.68 6.65 6.62
Over Valued < 12.66 12.66 < Fairly Valued < 17.19
Under Valued > 17.19

192
When reflecting on our sensitivity analysis our findings show that our company is
overvalued when the cost of equity increases and undervalued when the cost of equity
decreases. However, when observing the restated sensitivity analysis, Molex is
overvalued until the cost of equity is 11.48% and the growth rate is -20%. By using
negative growth rates we are able to drive earnings back to equilibrium and ensure that
Molex will provide return based on capital in the future.
Long Run Residual Income
The long-run residual income model is created by using the forecasted net
income and book value of equity. By using the formula net income of this year dividend
by the book value of equity from the past year the return on equity can be found.
From here we found the average return on equity as well as the average growth rate
for the return on equity. After we did the calculations we estimated our return on
equity average to be 9.86%.
2009 2010 2011 2012 2013 2014 2015 2016 2017 2018 Avg.
ROE 7.19% 6.53% 7.61% 8.44% 9.32% 10.19% 11.03% 11.95% 12.79% 13.55% 9.86%
Once the average growth rate and the average return on equity have been calculated
then the market value of equity can be computed. In order to find the market value of
equity we used our Ke of 17.48%, average ROE of 9.86%, growth rate of 7.51%, and
book value of equity of 2,676,846. From here we insert the numbers into the equation:
ROE Restated
2009 2010 2011 2012 2013 2014 2015 2016 2017 2018 Avg.
4.31% 4.00% 4.96% 5.65% 6.42% 7.36% 8.62% 10.30% 12.17% 14.83% 7.86%
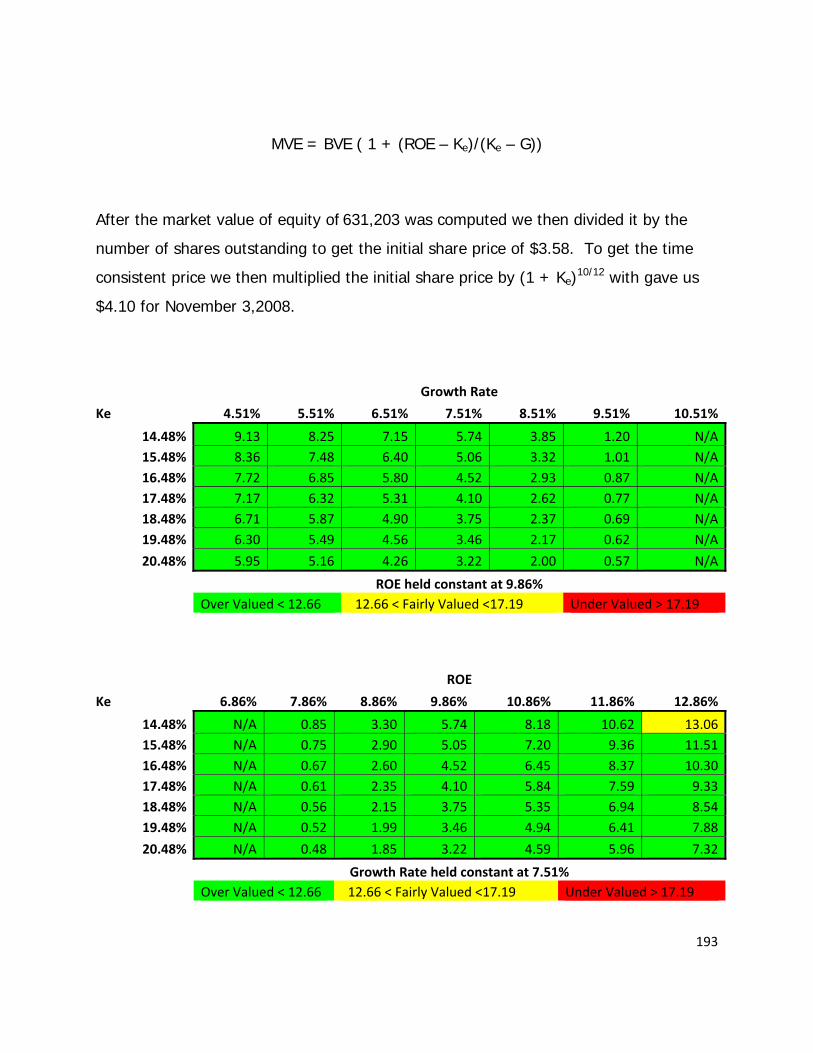
193
MVE = BVE ( 1 + (ROE – Ke)/(Ke – G))
After the market value of equity of 631,203 was computed we then divided it by the
number of shares outstanding to get the initial share price of $3.58. To get the time
consistent price we then multiplied the initial share price by (1 + Ke)10/12 with gave us
$4.10 for November 3,2008.
Growth Rate
Ke 4.51% 5.51% 6.51% 7.51% 8.51% 9.51% 10.51%
14.48% 9.13 8.25 7.15 5.74 3.85 1.20 N/A15.48% 8.36 7.48 6.40 5.06 3.32 1.01 N/A16.48% 7.72 6.85 5.80 4.52 2.93 0.87 N/A17.48% 7.17 6.32 5.31 4.10 2.62 0.77 N/A18.48% 6.71 5.87 4.90 3.75 2.37 0.69 N/A19.48% 6.30 5.49 4.56 3.46 2.17 0.62 N/A
20.48% 5.95 5.16 4.26 3.22 2.00 0.57 N/A
ROE held constant at 9.86% Over Valued < 12.66 12.66 < Fairly Valued <17.19 Under Valued > 17.19
ROE
Ke 6.86% 7.86% 8.86% 9.86% 10.86% 11.86% 12.86%
14.48% N/A 0.85 3.30 5.74 8.18 10.62 13.0615.48% N/A 0.75 2.90 5.05 7.20 9.36 11.5116.48% N/A 0.67 2.60 4.52 6.45 8.37 10.3017.48% N/A 0.61 2.35 4.10 5.84 7.59 9.3318.48% N/A 0.56 2.15 3.75 5.35 6.94 8.5419.48% N/A 0.52 1.99 3.46 4.94 6.41 7.88
20.48% N/A 0.48 1.85 3.22 4.59 5.96 7.32
Growth Rate held constant at 7.51% Over Valued < 12.66 12.66 < Fairly Valued <17.19 Under Valued > 17.19

194
ROE
Growth 6.86% 7.86% 8.86% 9.86% 10.86% 11.86% 12.86%
4.51% 3.15 4.49 5.83 7.17 8.51 9.85 11.195.51% 1.96 3.41 4.87 6.32 7.77 9.22 10.686.51% 0.55 2.14 3.72 5.31 6.89 8.48 10.067.51% N/A 0.61 2.35 4.10 5.84 7.59 9.338.51% N/A N/A 0.68 2.62 4.56 6.49 8.439.51% N/A N/A N/A 0.76 2.95 5.13 7.31
10.51% N/A N/A N/A N/A 0.87 3.37 5.86
Ke held constant at 17.48% Over Valued < 12.66 12.66 < Fairly Valued <17.19 Under Valued > 17.19
Revised Growth Rate
Ke 14.87% 15.87% 16.87% 17.87% 18.87% 19.87% 20.87%
14.48% 283.63 90.93 59.49 46.59 39.58 35.16 32.1315.48% N/A 326.45 103.03 66.57 51.62 43.48 38.3716.48% N/A N/A 369.85 115.29 73.75 56.72 47.4417.48% N/A N/A N/A 413.84 127.71 81.02 61.8818.48% N/A N/A N/A N/A 458.41 140.30 88.3919.48% N/A N/A N/A N/A N/A 503.56 153.05
20.48% N/A N/A N/A N/A N/A N/A 549.29
ROE held constant at 9.86% Over Valued < 12.66 12.66 < Fairly Valued <17.19 Under Valued > 17.19
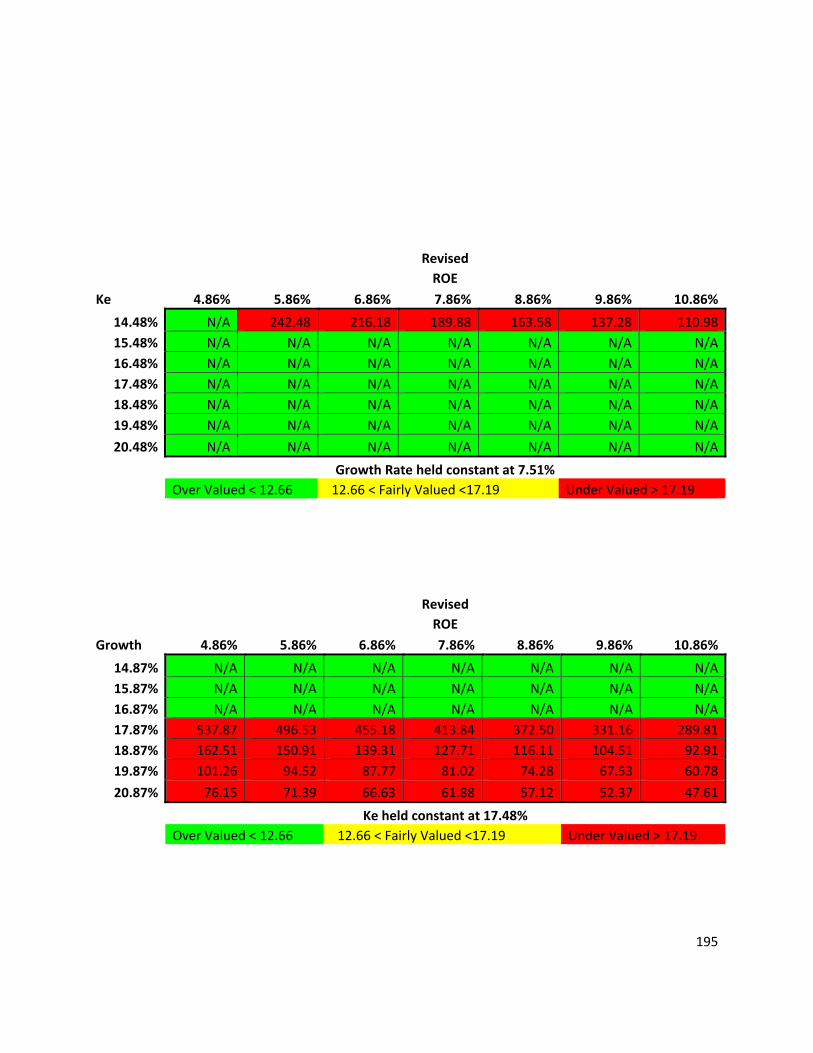
195
Revised ROE
Ke 4.86% 5.86% 6.86% 7.86% 8.86% 9.86% 10.86%
14.48% N/A 242.48 216.18 189.88 163.58 137.28 110.9815.48% N/A N/A N/A N/A N/A N/A N/A16.48% N/A N/A N/A N/A N/A N/A N/A17.48% N/A N/A N/A N/A N/A N/A N/A18.48% N/A N/A N/A N/A N/A N/A N/A19.48% N/A N/A N/A N/A N/A N/A N/A
20.48% N/A N/A N/A N/A N/A N/A N/A
Growth Rate held constant at 7.51% Over Valued < 12.66 12.66 < Fairly Valued <17.19 Under Valued > 17.19
Revised ROE
Growth 4.86% 5.86% 6.86% 7.86% 8.86% 9.86% 10.86%
14.87% N/A N/A N/A N/A N/A N/A N/A15.87% N/A N/A N/A N/A N/A N/A N/A16.87% N/A N/A N/A N/A N/A N/A N/A17.87% 537.87 496.53 455.18 413.84 372.50 331.16 289.8118.87% 162.51 150.91 139.31 127.71 116.11 104.51 92.9119.87% 101.26 94.52 87.77 81.02 74.28 67.53 60.78
20.87% 76.15 71.39 66.63 61.88 57.12 52.37 47.61
Ke held constant at 17.48% Over Valued < 12.66 12.66 < Fairly Valued <17.19 Under Valued > 17.19
196
The charts shown above contain the sensitivity analysis for the model long-run
residual income for both the original and restated versions. The inputs that change in
the models were the average return on equity, the estimated growth rate, and the cost
of capital. The sensitivity analysis with a 15% margin of safety shows that Molex is
overvalued which is consistent with the previous models.
Analyst Recommendation
After reviewing all of the financial statements and all of the facts, we have come
to the conclusion that Molex is an overvalued company. This ending comes from
reviewing how Molex is compared to their competitors, model valuations, accounting
policies, and the financial analysis. The models are all based on a 15% margin of
safety. Despite the model abnormal earnings growth which does not completely agree
with this conclusion we still feel that this is the right value for the firm. Both the
discounted dividends as well as the discounted free cash flows models strongly reflect
that Molex is overvalued. Even though the discounted dividend model does not have a
very strong explanatory power, it points so strongly towards the company being
overvalued that we kept its results in mind.
The residual income model mostly points to the direction of the company being
overvalued and slightly to being fairly valued. Since this model has a high explanatory
power we strongly looked into the results for the bases of our decision. Since Molex
has a significant portion of assets attributed to goodwill and the company needing to be
restated because of a lack of goodwill impairment, we looked at the restated version of
residual income to also help in the decision process. When looking at the restated
version we saw that the model still sides with the company being overvalued more than
it being fairly valued. Even though there was a slight shift between the models, it was
not significant enough to move our decision towards being fairly-valued.
197
The long run residual income and the abnormal earnings growth models are
other models that also lean towards Molex being overvalued. We used our Ke of
17.48%, growth rate of 15.08% as our average future earnings growth rate, and an
ROE of 9.86% to generate these models. With this information the long run residual
income is amongst the other models in suggesting that the company is overvalued.
The abnormal earnings growth model is pretty in between all three of the options. For
this model it is not until you look at the restated version due to see the strong reference
to the company being overvalued. Due to the impact that goodwill impairment has on
net income the model has quite a change after the impairment.
We feel that Molex is an overvalued company, at least at this point in time.
However, we feel that in the future the company will have the opportunity to raise the
value of their firm so that they will not be looked at as being so overvalued. As long as
the Molex can pull strong through the recession we feel that they will increase the value
of the firm. As for the time being, we would recommend to investors to sell their stock
in the company.

198
APPENDICES
Sales Manipulation Diagnostics
Net Sales/Accounts Receivables (RAW) 2003 2004 2005 2006 2007
Molex 4.64 4.25 4.73 4.33 4.76 Amphenol 7.19 7.15 5.97 6.43 5.59
Tyco Electronics
5.03 5.05 5.01
Methode 6.23 5.49 5.98 5.68 5.66
Net Sales/Accounts Receivables(CHANGE) 2003 2004 2005 2006 2007
Molex 12.07 3.08 30.84 2.53 16.18 Amphenol 4.30 6.98 3.13 8.19 2.99
Tyco Electronics
5.77 4.6
Methode -7.46 -0.589 99.88 3.39 5.41
Net Sales/Cash from Sales (RAW) 2003 2004 2005 2006 2007
Molex 1.01 1.06 1.00 1.04 1.01 Amphenol 1.03 1.03 1.05 0.97 0.96
Tyco Electronics
0.96 1.01
Methode 0.98 1.02 1.00 1.02 1.01
Net Sales/Cash from Sales(CHANGE) 2003 2004 2005 2006 2007
Molex 1.46 1.43 0.713 1.57 0.81 Amphenol 1.15 1.0015 1.20 0.99 1.13 Methode 0.92 0.24 0.83 1.40 0.88
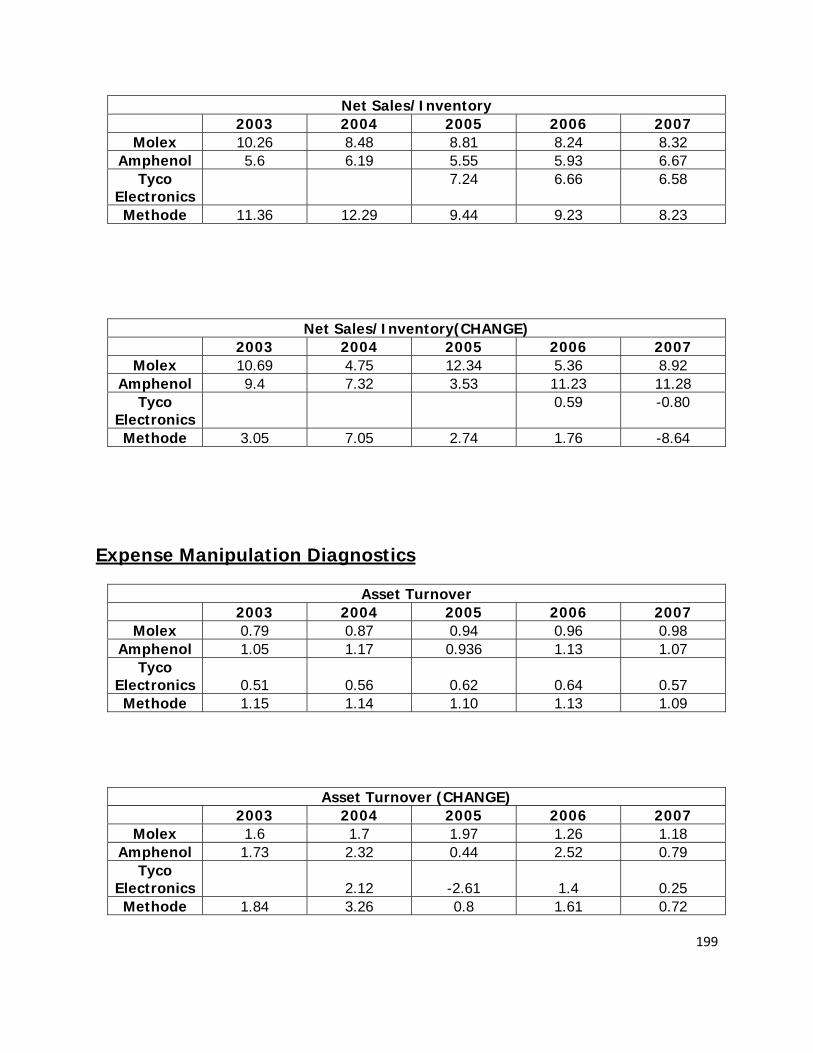
199
Net Sales/Inventory 2003 2004 2005 2006 2007
Molex 10.26 8.48 8.81 8.24 8.32 Amphenol 5.6 6.19 5.55 5.93 6.67
Tyco Electronics
7.24 6.66 6.58
Methode 11.36 12.29 9.44 9.23 8.23
Net Sales/Inventory(CHANGE) 2003 2004 2005 2006 2007
Molex 10.69 4.75 12.34 5.36 8.92 Amphenol 9.4 7.32 3.53 11.23 11.28
Tyco Electronics
0.59 -0.80
Methode 3.05 7.05 2.74 1.76 -8.64
Expense Manipulation Diagnostics
Asset Turnover 2003 2004 2005 2006 2007
Molex 0.79 0.87 0.94 0.96 0.98 Amphenol 1.05 1.17 0.936 1.13 1.07
Tyco Electronics 0.51 0.56 0.62 0.64 0.57 Methode 1.15 1.14 1.10 1.13 1.09
Asset Turnover (CHANGE) 2003 2004 2005 2006 2007
Molex 1.6 1.7 1.97 1.26 1.18 Amphenol 1.73 2.32 0.44 2.52 0.79
Tyco Electronics
2.12 -2.61 1.4 0.25
Methode 1.84 3.26 0.8 1.61 0.72
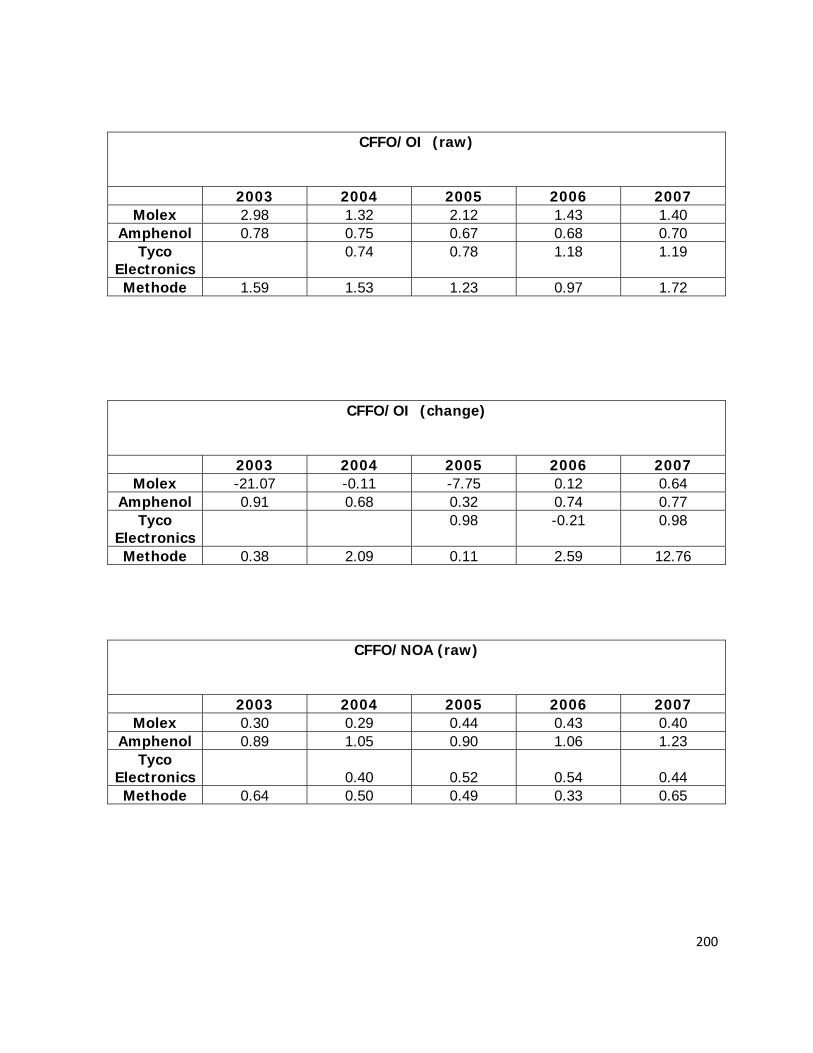
200
CFFO/OI (raw)
2003 2004 2005 2006 2007
Molex 2.98 1.32 2.12 1.43 1.40 Amphenol 0.78 0.75 0.67 0.68 0.70
Tyco Electronics
0.74 0.78 1.18 1.19
Methode 1.59 1.53 1.23 0.97 1.72
CFFO/OI (change)
2003 2004 2005 2006 2007
Molex -21.07 -0.11 -7.75 0.12 0.64 Amphenol 0.91 0.68 0.32 0.74 0.77
Tyco Electronics
0.98 -0.21 0.98
Methode 0.38 2.09 0.11 2.59 12.76
CFFO/NOA (raw)
2003 2004 2005 2006 2007
Molex 0.30 0.29 0.44 0.43 0.40 Amphenol 0.89 1.05 0.90 1.06 1.23
Tyco Electronics
0.40 0.52 0.54 0.44
Methode 0.64 0.50 0.49 0.33 0.65
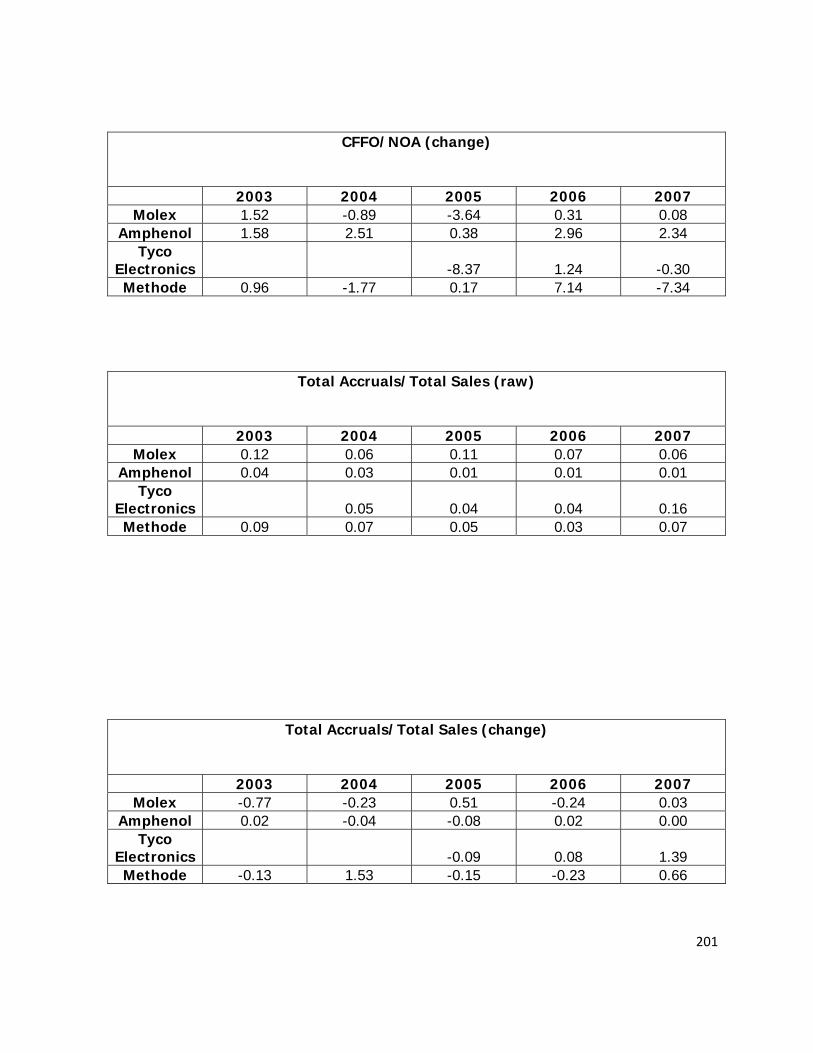
201
CFFO/NOA (change)
2003 2004 2005 2006 2007
Molex 1.52 -0.89 -3.64 0.31 0.08 Amphenol 1.58 2.51 0.38 2.96 2.34
Tyco Electronics
-8.37 1.24 -0.30
Methode 0.96 -1.77 0.17 7.14 -7.34
Total Accruals/Total Sales (raw)
2003 2004 2005 2006 2007
Molex 0.12 0.06 0.11 0.07 0.06 Amphenol 0.04 0.03 0.01 0.01 0.01
Tyco Electronics
0.05 0.04 0.04 0.16
Methode 0.09 0.07 0.05 0.03 0.07
Total Accruals/Total Sales (change)
2003 2004 2005 2006 2007
Molex -0.77 -0.23 0.51 -0.24 0.03 Amphenol 0.02 -0.04 -0.08 0.02 0.00
Tyco Electronics
-0.09 0.08 1.39
Methode -0.13 1.53 -0.15 -0.23 0.66

202
Pension Expense/SG&A (raw)
2003 2004 2005 2006 2007
Molex 0.12 0.09 0.12 0.12 0.17 Amphenol 0.57 0.47 0.43 0.40 0.27
Tyco Electronics
0.32 0.36
Pension Expense/SG&A (change)
2003 2004 2005 2006 2007
Molex 0.43 -0.08 0.72 0.26 0.65 Amphenol -0.08 0.05 0.18 0.33 -1.06
Tyco Electronics
0.83
Liquidity Ratios
Current Ratio
2002 2003 2004 2005 2006 2007
Molex 2.56 2.70 2.73 2.93 2.60 6.26
Molex - Rest. 2.55 2.70 2.73 2.93 2.60 5.96
Amphenol 1.65 2.07 1.91 2.11 2.09 5.14
Methode 3.30 3.55 2.96 3.15 2.98 5.68
Tyco N/A 1.73 1.95 1.86 2.08 3.83
Industry Avg.
1.65 2.45 2.27 2.37 2.38 4.88
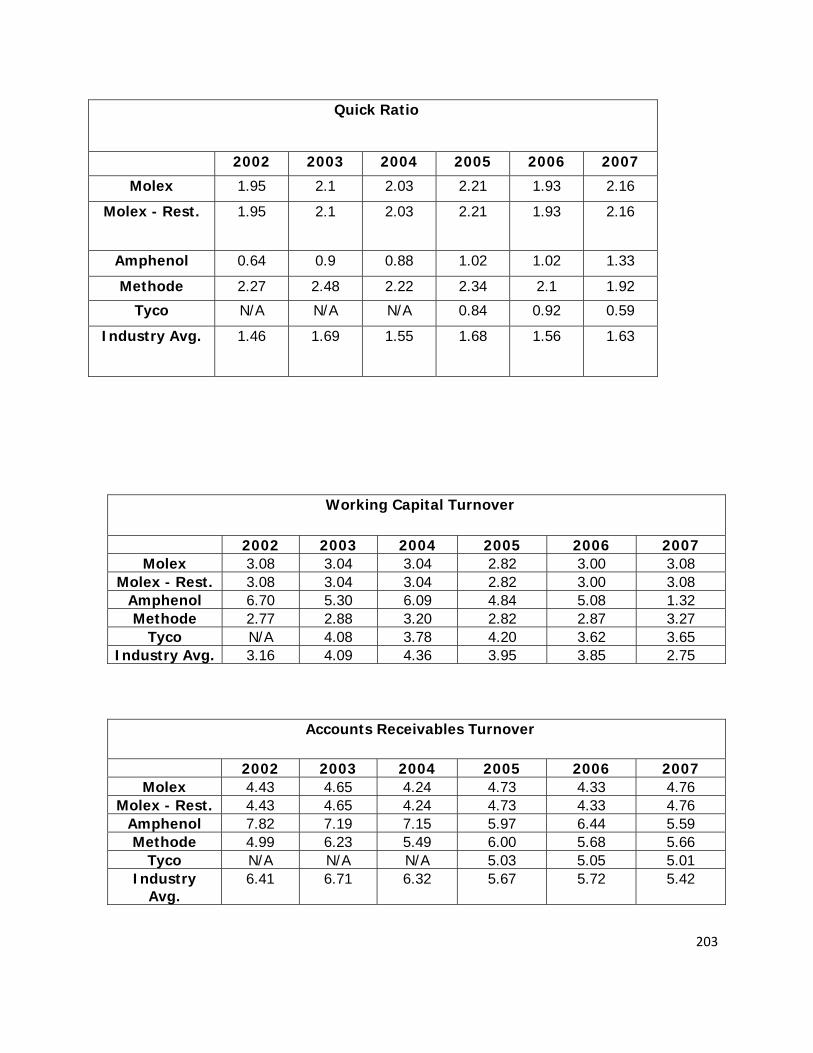
203
Working Capital Turnover
2002 2003 2004 2005 2006 2007 Molex 3.08 3.04 3.04 2.82 3.00 3.08
Molex - Rest. 3.08 3.04 3.04 2.82 3.00 3.08 Amphenol 6.70 5.30 6.09 4.84 5.08 1.32 Methode 2.77 2.88 3.20 2.82 2.87 3.27
Tyco N/A 4.08 3.78 4.20 3.62 3.65 Industry Avg. 3.16 4.09 4.36 3.95 3.85 2.75
Accounts Receivables Turnover
2002 2003 2004 2005 2006 2007 Molex 4.43 4.65 4.24 4.73 4.33 4.76
Molex - Rest. 4.43 4.65 4.24 4.73 4.33 4.76 Amphenol 7.82 7.19 7.15 5.97 6.44 5.59 Methode 4.99 6.23 5.49 6.00 5.68 5.66
Tyco N/A N/A N/A 5.03 5.05 5.01 Industry
Avg. 6.41 6.71 6.32 5.67 5.72 5.42
Quick Ratio
2002 2003 2004 2005 2006 2007
Molex 1.95 2.1 2.03 2.21 1.93 2.16
Molex - Rest. 1.95 2.1 2.03 2.21 1.93 2.16
Amphenol 0.64 0.9 0.88 1.02 1.02 1.33
Methode 2.27 2.48 2.22 2.34 2.1 1.92
Tyco N/A N/A N/A 0.84 0.92 0.59
Industry Avg. 1.46 1.69 1.55 1.68 1.56 1.63
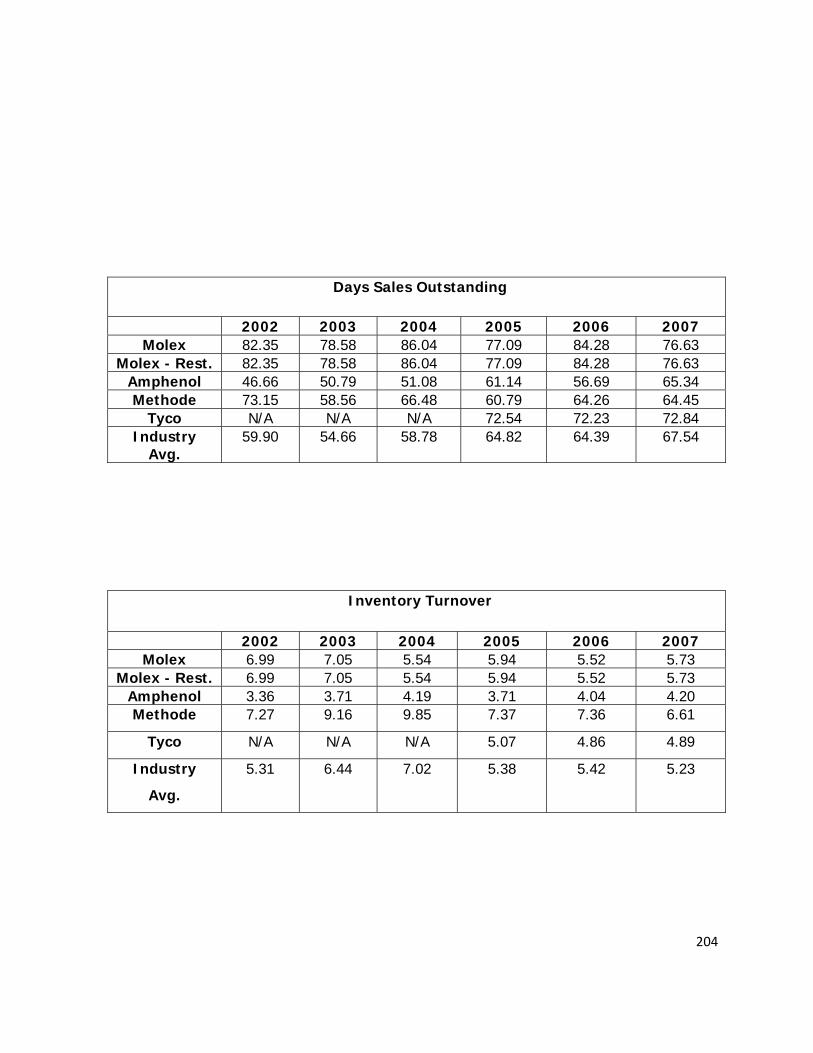
204
Days Sales Outstanding
2002 2003 2004 2005 2006 2007 Molex 82.35 78.58 86.04 77.09 84.28 76.63
Molex - Rest. 82.35 78.58 86.04 77.09 84.28 76.63 Amphenol 46.66 50.79 51.08 61.14 56.69 65.34 Methode 73.15 58.56 66.48 60.79 64.26 64.45
Tyco N/A N/A N/A 72.54 72.23 72.84 Industry
Avg. 59.90 54.66 58.78 64.82 64.39 67.54
Inventory Turnover
2002 2003 2004 2005 2006 2007 Molex 6.99 7.05 5.54 5.94 5.52 5.73
Molex - Rest. 6.99 7.05 5.54 5.94 5.52 5.73 Amphenol 3.36 3.71 4.19 3.71 4.04 4.20 Methode 7.27 9.16 9.85 7.37 7.36 6.61
Tyco N/A N/A N/A 5.07 4.86 4.89
Industry
Avg.
5.31 6.44 7.02 5.38 5.42 5.23

205
Days Supply in Inventory
2002 2003 2004 2005 2006 2007 Molex 52.20 51.77 65.89 61.50 66.07 63.73
Molex - Rest. 52.20 51.77 65.89 61.50 66.07 63.73 Amphenol 108.58 98.46 87.22 98.49 90.31 86.81 Methode 50.22 39.83 37.04 49.50 49.56 55.25
Tyco N/A N/A N/A 71.96 75.04 74.63 Industry
Avg. 79.40 69.14 62.13 73.31 71.64 72.23
Cash to Cash Cycle
2002 2003 2004 2005 2006 2007 Molex 134.6 130.3 151.9 138.6 150.3 140.1
Molex - Rest. 134.6 130.3 151.9 138.6 150.3 140.1 Amphenol 155.2 149.2 138.3 159.6 147.0 152.2 Methode 123.4 98.2 103.5 110.3 113.8 119.7
Tyco N/A N/A N/A 144.5 144.4 147.5 Industry
Avg. 139.3 123.8 120.9 138.1 135.1 139.8
Profitability Ratios
Gross Profit Ratio
2002 2003 2004 2005 2006 2007 Molex 0.317 0.314 0.346 0.326 0.329 0.311
Molex - Rest. 0.317 0.314 0.346 0.326 0.329 0.311 Amphenol 0.318 0.338 0.324 0.332 0.319 0.326 Methode 0.160 0.194 0.198 0.223 0.202 0.197
Tyco N/A N/A 0.282 0.299 0.298 0.256 Industry
Avg. 0.239 0.266 0.268 0.285 0.273 0.260
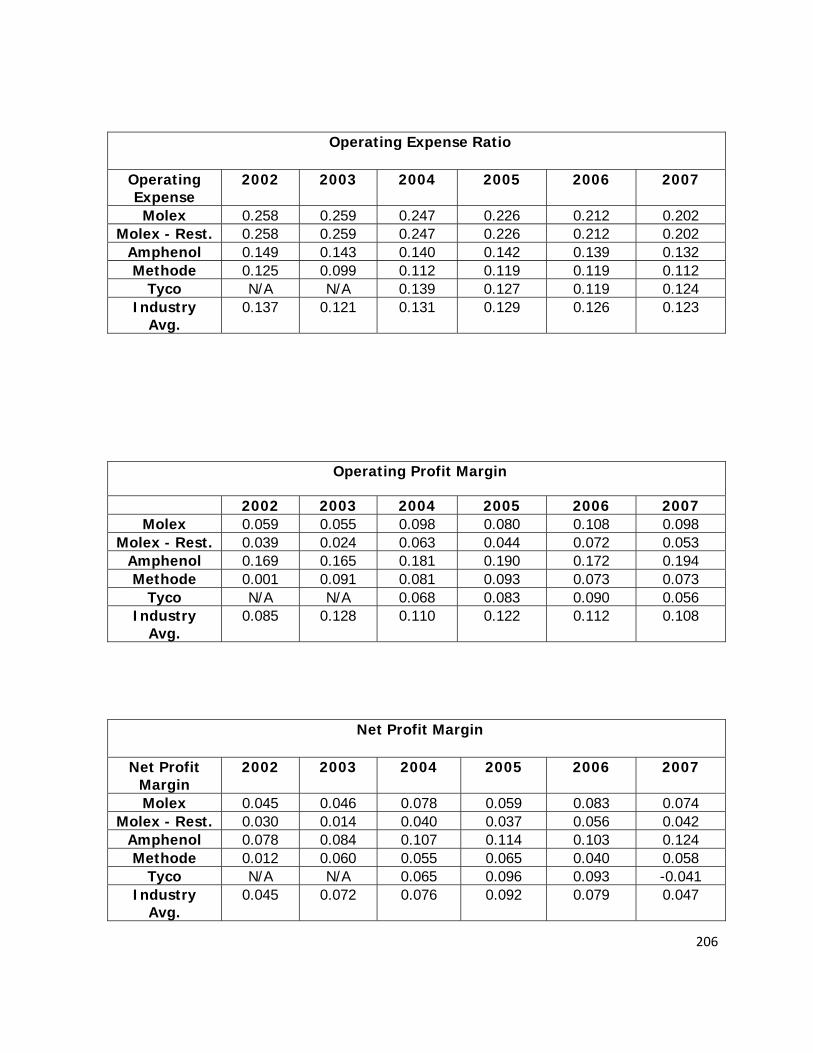
206
Operating Expense Ratio
Operating Expense
2002 2003 2004 2005 2006 2007
Molex 0.258 0.259 0.247 0.226 0.212 0.202 Molex - Rest. 0.258 0.259 0.247 0.226 0.212 0.202
Amphenol 0.149 0.143 0.140 0.142 0.139 0.132 Methode 0.125 0.099 0.112 0.119 0.119 0.112
Tyco N/A N/A 0.139 0.127 0.119 0.124 Industry
Avg. 0.137 0.121 0.131 0.129 0.126 0.123
Operating Profit Margin
2002 2003 2004 2005 2006 2007 Molex 0.059 0.055 0.098 0.080 0.108 0.098
Molex - Rest. 0.039 0.024 0.063 0.044 0.072 0.053 Amphenol 0.169 0.165 0.181 0.190 0.172 0.194 Methode 0.001 0.091 0.081 0.093 0.073 0.073
Tyco N/A N/A 0.068 0.083 0.090 0.056 Industry
Avg. 0.085 0.128 0.110 0.122 0.112 0.108
Net Profit Margin
Net Profit Margin
2002 2003 2004 2005 2006 2007
Molex 0.045 0.046 0.078 0.059 0.083 0.074 Molex - Rest. 0.030 0.014 0.040 0.037 0.056 0.042
Amphenol 0.078 0.084 0.107 0.114 0.103 0.124 Methode 0.012 0.060 0.055 0.065 0.040 0.058
Tyco N/A N/A 0.065 0.096 0.093 -0.041 Industry
Avg. 0.045 0.072 0.076 0.092 0.079 0.047

207
Asset Turnover
Asset
turnover
2002 2003 2004 2005 2006 2007
Molex 0.76 0.79 0.87 0.94 0.96 0.98
Molex - Rest. 0.77 0.81 0.90 0.98 1 1.03
Amphenol 0.95 1.05 1.17 0.94 1.13 1.07
Methode 1.10 1.15 1.14 1.11 1.13 1.09
Tyco N/A 0.51 0.59 0.64 0.67 0.57
Industry
Avg.
1.02 0.90 0.97 0.90 0.97 0.91
Return on Assets
2002 2003 2004 2005 2006 2007
Molex 0.035 0.038 0.076 0.058 0.087 0.081
Molex - Rest. 0.023 0.012 0.039 0.038 0.062 0.047
Amphenol 0.078 0.096 0.138 0.158 0.132 0.161
Methode 0.013 0.075 0.062 0.081 0.048 0.070
Tyco N/A N/A 0.040 0.061 0.065 -0.030
Industry
Avg.
0.030 0.057 0.080 0.100 0.082 0.067
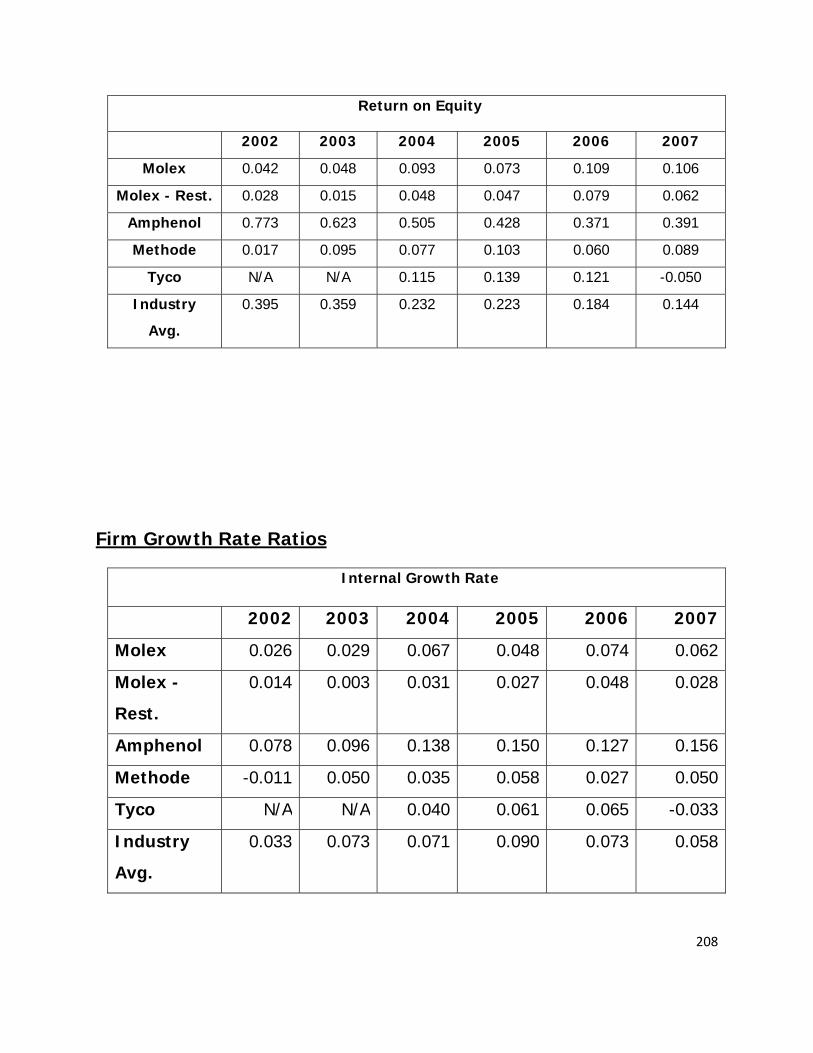
208
Return on Equity
2002 2003 2004 2005 2006 2007
Molex 0.042 0.048 0.093 0.073 0.109 0.106
Molex - Rest. 0.028 0.015 0.048 0.047 0.079 0.062
Amphenol 0.773 0.623 0.505 0.428 0.371 0.391
Methode 0.017 0.095 0.077 0.103 0.060 0.089
Tyco N/A N/A 0.115 0.139 0.121 -0.050
Industry
Avg.
0.395 0.359 0.232 0.223 0.184 0.144
Firm Growth Rate Ratios
Internal Growth Rate
2002 2003 2004 2005 2006 2007
Molex 0.026 0.029 0.067 0.048 0.074 0.062
Molex -
Rest.
0.014 0.003 0.031 0.027 0.048 0.028
Amphenol 0.078 0.096 0.138 0.150 0.127 0.156
Methode -0.011 0.050 0.035 0.058 0.027 0.050
Tyco N/A N/A 0.040 0.061 0.065 -0.033
Industry
Avg.
0.033 0.073 0.071 0.090 0.073 0.058
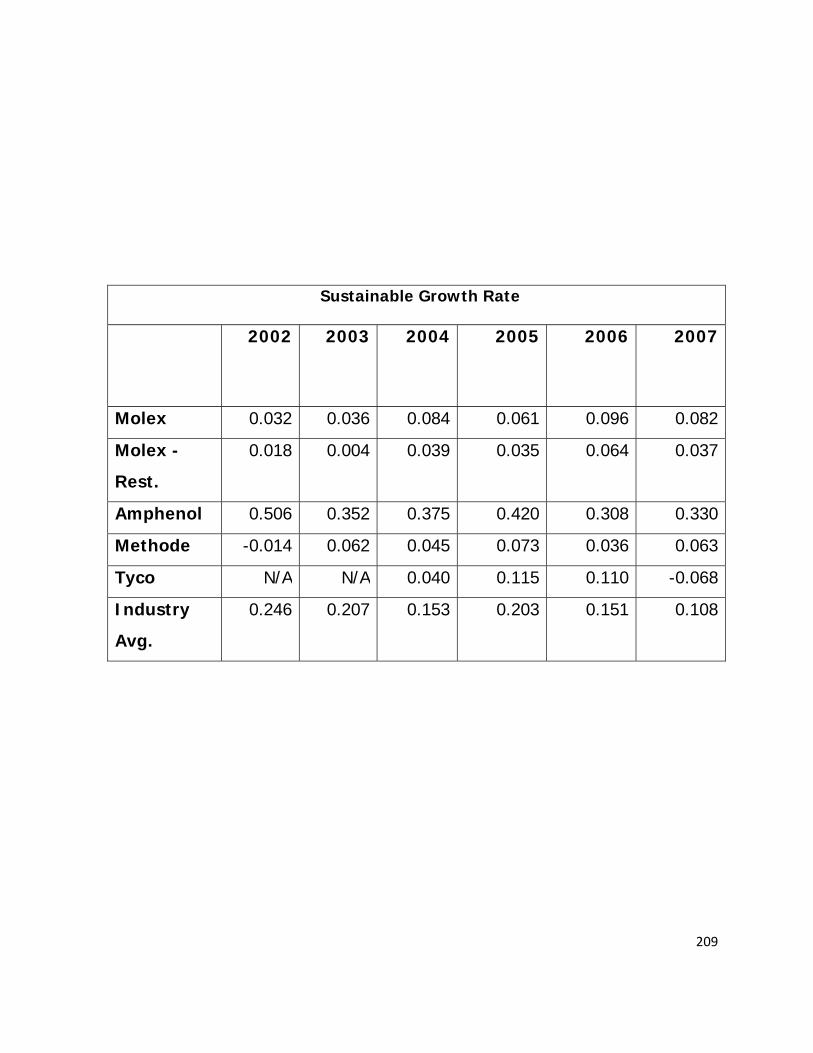
209
Sustainable Growth Rate
2002 2003 2004 2005 2006 2007
Molex 0.032 0.036 0.084 0.061 0.096 0.082
Molex -
Rest.
0.018 0.004 0.039 0.035 0.064 0.037
Amphenol 0.506 0.352 0.375 0.420 0.308 0.330
Methode -0.014 0.062 0.045 0.073 0.036 0.063
Tyco N/A N/A 0.040 0.115 0.110 -0.068
Industry
Avg.
0.246 0.207 0.153 0.203 0.151 0.108
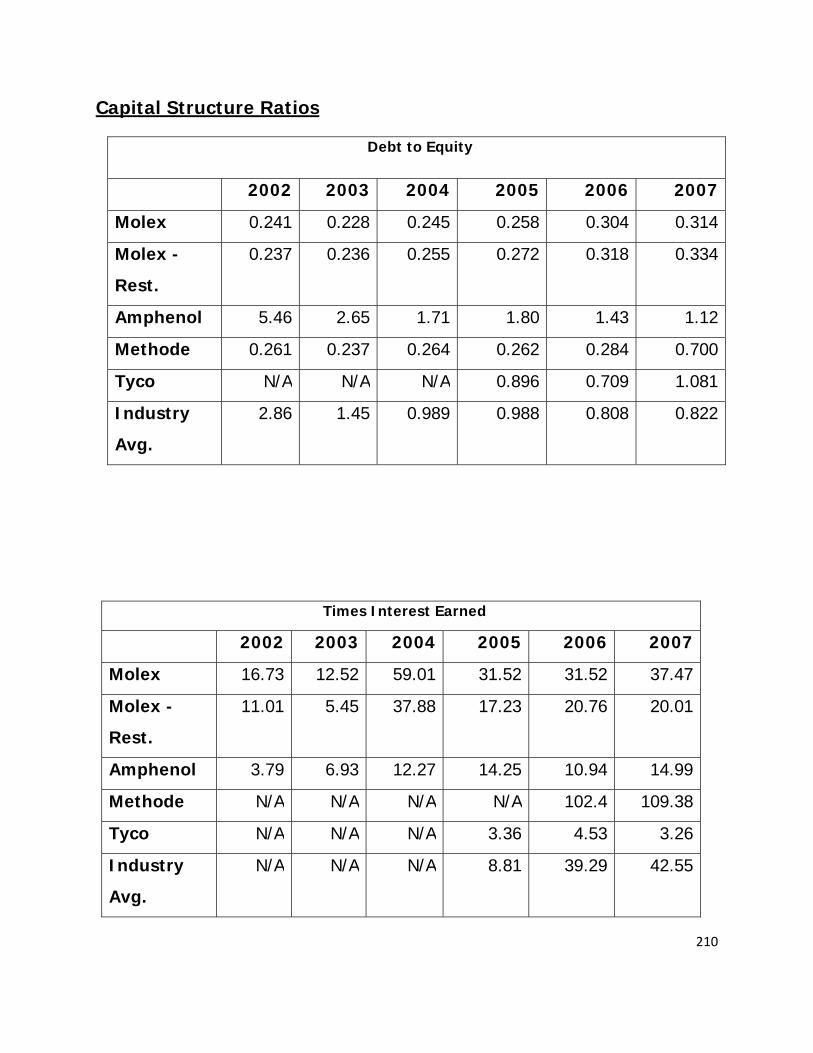
210
Capital Structure Ratios
Debt to Equity
2002 2003 2004 2005 2006 2007
Molex 0.241 0.228 0.245 0.258 0.304 0.314
Molex -
Rest.
0.237 0.236 0.255 0.272 0.318 0.334
Amphenol 5.46 2.65 1.71 1.80 1.43 1.12
Methode 0.261 0.237 0.264 0.262 0.284 0.700
Tyco N/A N/A N/A 0.896 0.709 1.081
Industry
Avg.
2.86 1.45 0.989 0.988 0.808 0.822
Times Interest Earned
2002 2003 2004 2005 2006 2007
Molex 16.73 12.52 59.01 31.52 31.52 37.47
Molex -
Rest.
11.01 5.45 37.88 17.23 20.76 20.01
Amphenol 3.79 6.93 12.27 14.25 10.94 14.99
Methode N/A N/A N/A N/A 102.4 109.38
Tyco N/A N/A N/A 3.36 4.53 3.26
Industry
Avg.
N/A N/A N/A 8.81 39.29 42.55
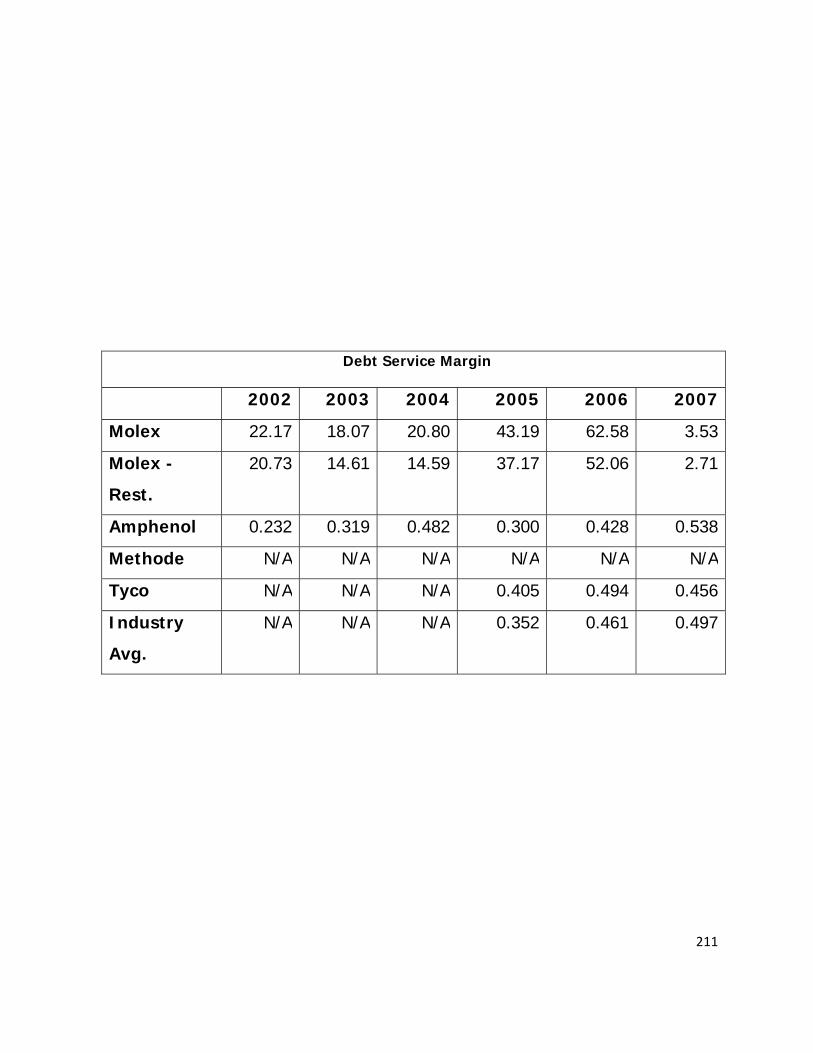
211
Debt Service Margin
2002 2003 2004 2005 2006 2007
Molex 22.17 18.07 20.80 43.19 62.58 3.53
Molex -
Rest.
20.73 14.61 14.59 37.17 52.06 2.71
Amphenol 0.232 0.319 0.482 0.300 0.428 0.538
Methode N/A N/A N/A N/A N/A N/A
Tyco N/A N/A N/A 0.405 0.494 0.456
Industry
Avg.
N/A N/A N/A 0.352 0.461 0.497
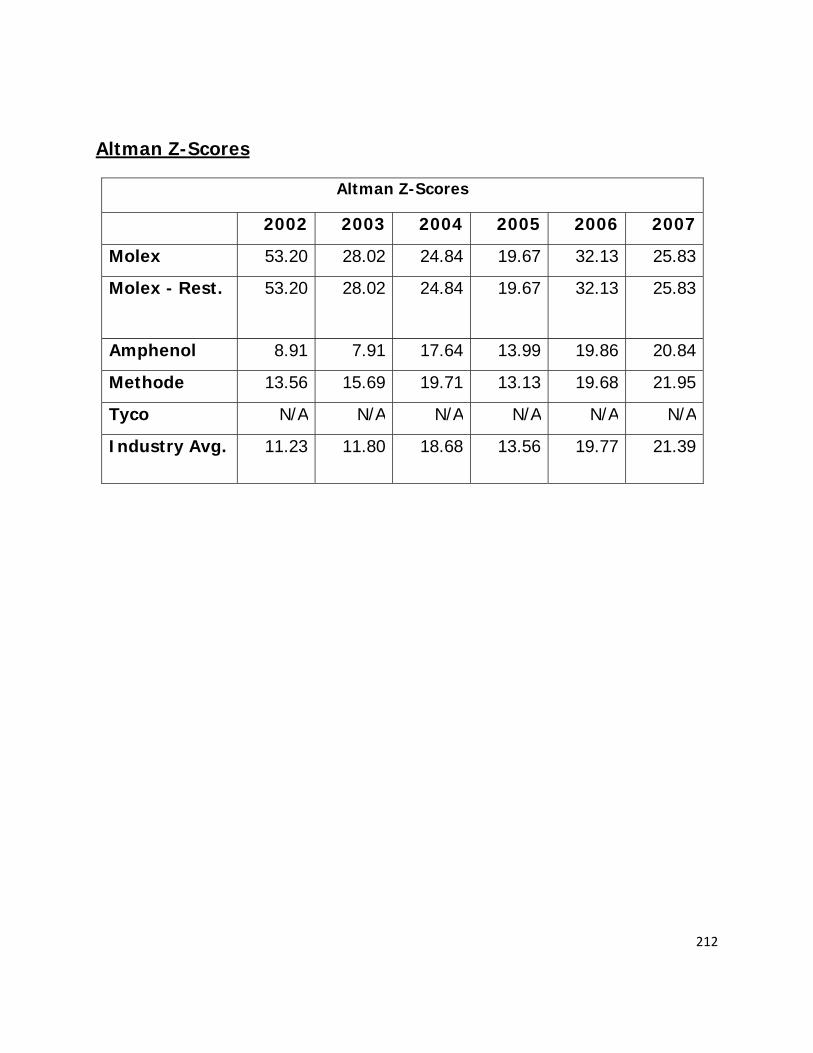
212
Altman Z-Scores
Altman Z-Scores
2002 2003 2004 2005 2006 2007
Molex 53.20 28.02 24.84 19.67 32.13 25.83
Molex - Rest. 53.20 28.02 24.84 19.67 32.13 25.83
Amphenol 8.91 7.91 17.64 13.99 19.86 20.84
Methode 13.56 15.69 19.71 13.13 19.68 21.95
Tyco N/A N/A N/A N/A N/A N/A
Industry Avg. 11.23 11.80 18.68 13.56 19.77 21.39

213
Cost of Debt
Cost of Debt
Liabilities Debt Interest rate
Weight WACD
Short Term Loans $66, 687 1.3% .069 .09%
Accounts payable $350,413 2.13% .38 .81%
Salaries, commissions, and bonuses
$74,689 2.13 .08 .17%
Other accrued expenses $84,525 2.13 .094 .2%
Income Taxes Payable $73,124 3.69% .079 .29% Other noncurrent liabilities $21,346 7.8% .023 .18%
Pensions and postretirement benefits
$105,574 6.2% .115 .71%
Long term debt $146,333 7.8% .159 1.24%
Total Liabilities 922,691 3.69%
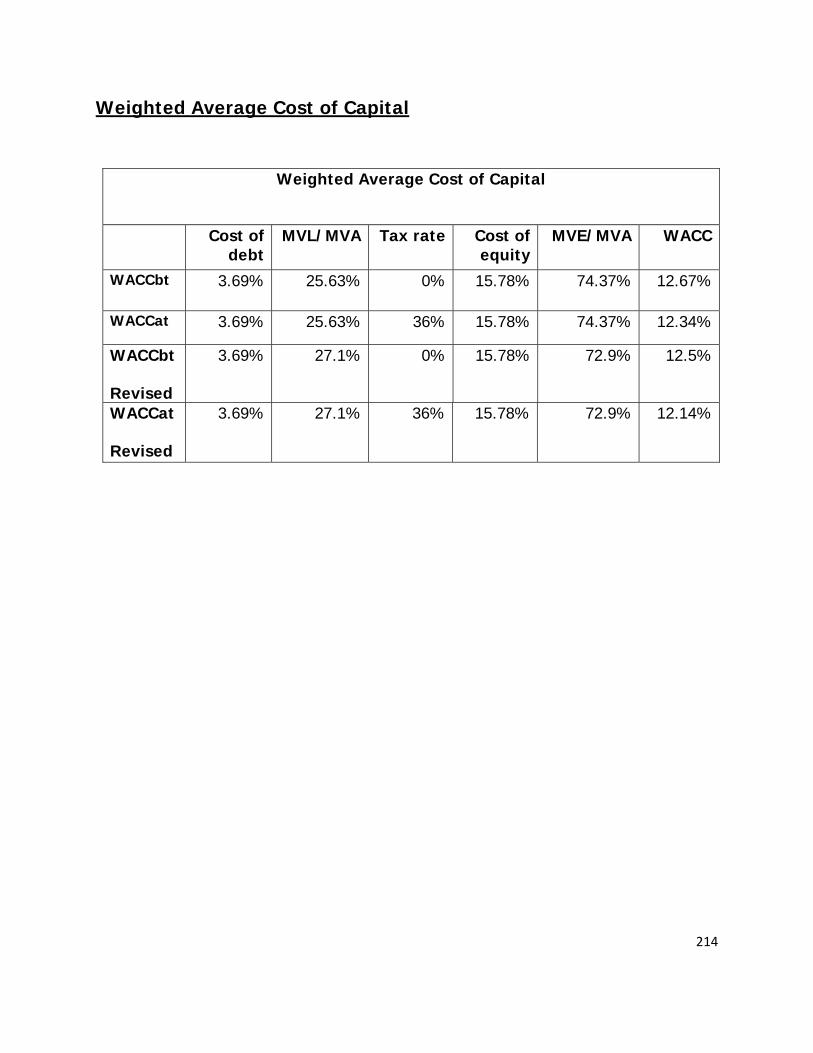
214
Weighted Average Cost of Capital
Weighted Average Cost of Capital
Cost of debt
MVL/MVA Tax rate Cost of equity
MVE/MVA WACC
WACCbt 3.69% 25.63% 0% 15.78% 74.37% 12.67%
WACCat 3.69% 25.63% 36% 15.78% 74.37% 12.34%
WACCbt
Revised
3.69% 27.1% 0% 15.78% 72.9% 12.5%
WACCat
Revised
3.69% 27.1% 36% 15.78% 72.9% 12.14%
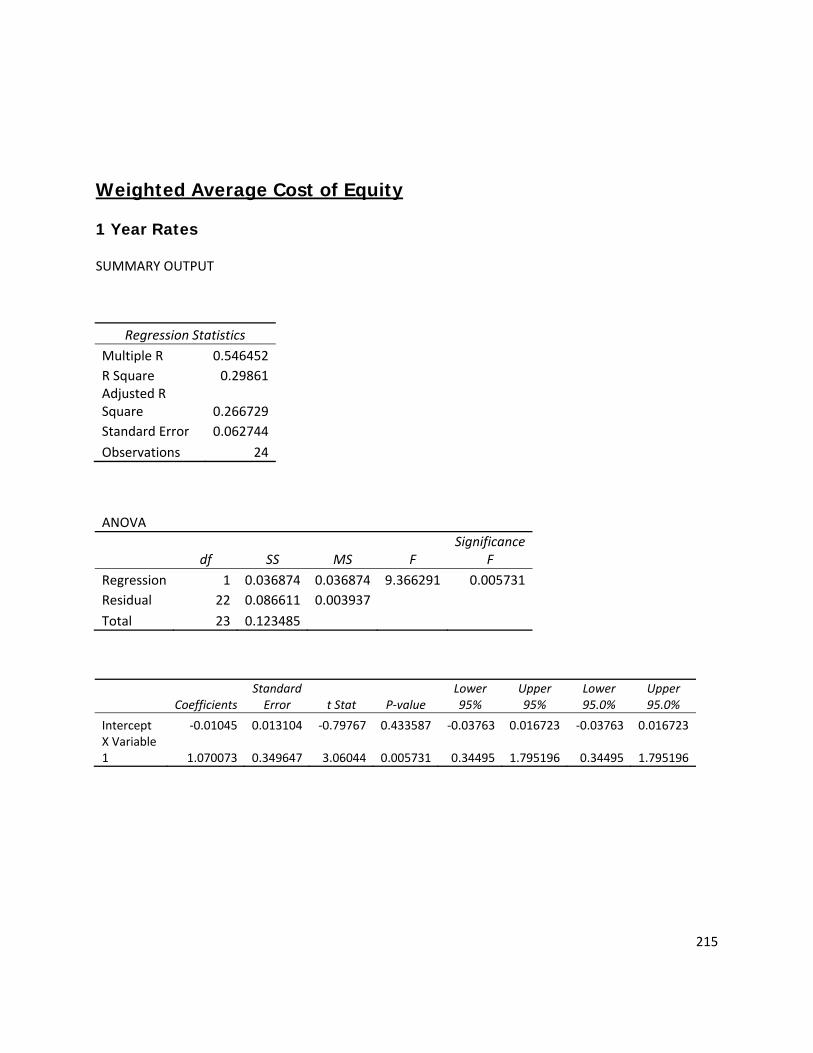
215
Weighted Average Cost of Equity
1 Year Rates
SUMMARY OUTPUT
Regression Statistics Multiple R 0.546452 R Square 0.29861 Adjusted R Square 0.266729 Standard Error 0.062744
Observations 24
ANOVA
df SS MS F Significance
F Regression 1 0.036874 0.036874 9.366291 0.005731Residual 22 0.086611 0.003937Total 23 0.123485
Coefficients Standard Error t Stat P‐value
Lower 95%
Upper 95%
Lower 95.0%
Upper 95.0%
Intercept ‐0.01045 0.013104 ‐0.79767 0.433587 ‐0.03763 0.016723 ‐0.03763 0.016723 X Variable 1 1.070073 0.349647 3.06044 0.005731 0.34495 1.795196 0.34495 1.795196
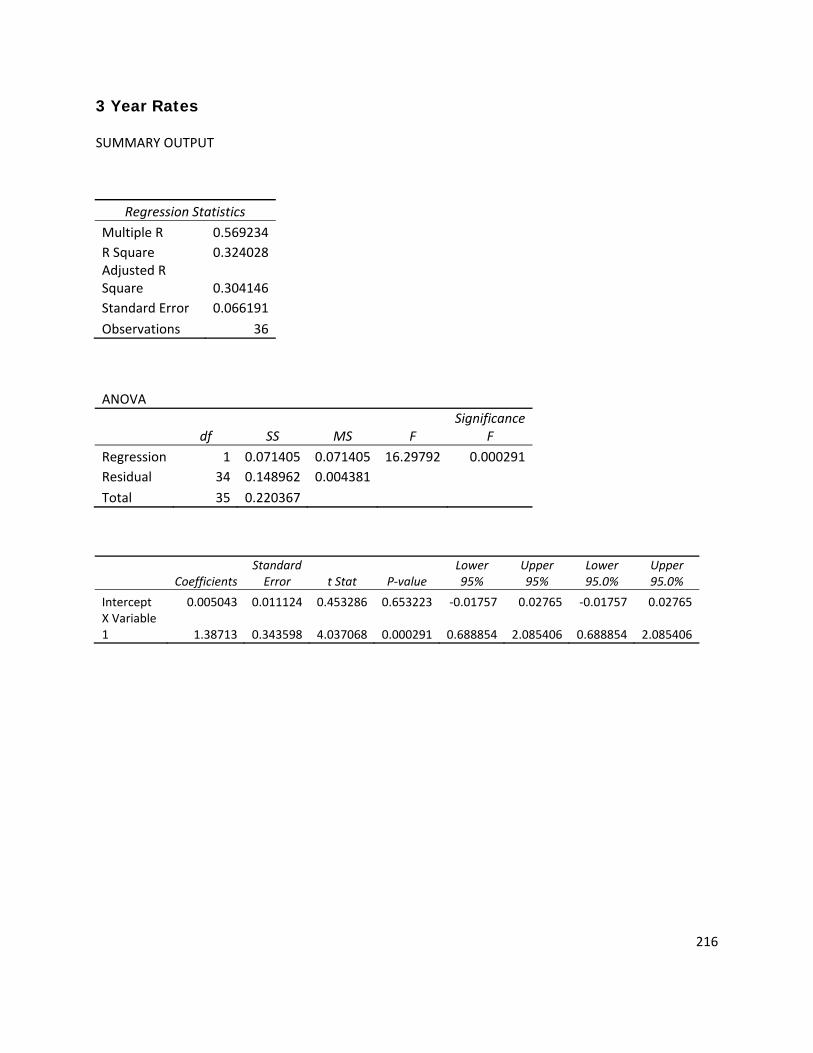
216
3 Year Rates
SUMMARY OUTPUT
Regression Statistics Multiple R 0.569234 R Square 0.324028 Adjusted R Square 0.304146 Standard Error 0.066191
Observations 36
ANOVA
df SS MS F Significance
F Regression 1 0.071405 0.071405 16.29792 0.000291Residual 34 0.148962 0.004381Total 35 0.220367
Coefficients Standard Error t Stat P‐value
Lower 95%
Upper 95%
Lower 95.0%
Upper 95.0%
Intercept 0.005043 0.011124 0.453286 0.653223 ‐0.01757 0.02765 ‐0.01757 0.02765 X Variable 1 1.38713 0.343598 4.037068 0.000291 0.688854 2.085406 0.688854 2.085406

217
4 Year Rates
SUMMARY OUTPUT
ANOVA
df SS MS F Significance
F Regression 1 0.068909 0.068909 16.06237 0.000222Residual 46 0.197343 0.00429
Total 47 0.266252
Coefficients Standard Error t Stat P‐value
Lower 95%
Upper 95%
Lower 95.0%
Upper 95.0%
Intercept ‐0.00026 0.009467 ‐0.02793 0.97784 ‐0.01932 0.018792 ‐0.01932 0.018792 X Variable 1 1.249458 0.311757 4.007789 0.000222 0.621923 1.876993 0.621923 1.876993
Regression Statistics Multiple R 0.508734 R Square 0.25881 Adjusted R Square 0.242697 Standard Error 0.065499
Observations 48

218
5 Year Rates
SUMMARY OUTPUT
Regression Statistics Multiple R 0.547158 R Square 0.299382 Adjusted R Square 0.287302 Standard Error 0.061555
Observations 60
ANOVA
df SS MS F Significance
F Regression 1 0.093907 0.093907 24.78405 6.08E‐06 Residual 58 0.219762 0.003789
Total 59 0.313669
Coefficients Standard Error t Stat P‐value
Lower 95%
Upper 95%
Lower 95.0%
Upper 95.0%
Intercept ‐0.0012917 0.0079478 ‐0.162523 0.871459 ‐
0.0172008 0.0146175 ‐
0.0172008 0.0146175
X Variable 1 1.3378974 0.2687427 4.9783581 6.076E‐06 0.7999504 1.8758443 0.7999504 1.8758443

219
6 Year Rates
SUMMARY OUTPUT
Regression Statistics Multiple R 0.628169449 R Square 0.394596857
Adjusted R Square 0.38594824 Standard Error 0.060282106 Observations 72
ANOVA
df SS MS F Significance
F Regression 1 0.165799731 0.165799731 45.625432 3.48745E‐09Residual 70 0.25437526 0.003633932
Total 71 0.420174991
Coefficients Standard Error t Stat P‐value
Intercept ‐0.0018941 0.007138232 ‐
0.265345952 0.79152284 X Variable 1 1.469410734 0.217540295 6.754660021 3.48745E‐09
Lower 95% Upper 95%
Lower 95.0%
Upper 95.0%
‐0.01613085 0.0123427 ‐
0.0161309 0.012343 1.035540302 1.9032812 1.0355403 1.903281

220
Methods of Comparables
Price/Earning Trailing
Price /Earnings Forecast
Forecasted P/E
Company PPS EPS 1yr Out
P/E Forecast
Industry avg P/E
Computed price
Molex 14.89 1.09 10.86 11.84
Molex restated
14.89 .61 10.86 6.63
Amphenol 29.16 11.21 Tyco 19.89 8.93
Methode 7.71 12.43
P/E trailing PPS EPS P/E Trailing Computed
Price
Molex 14.89 1.22 9.72
Molex restated
14.89 .59 4.70
Amphenol 29.16 11.26
Tyco 19.89 4.73
Methode 7.71 7.92
Average 7.97
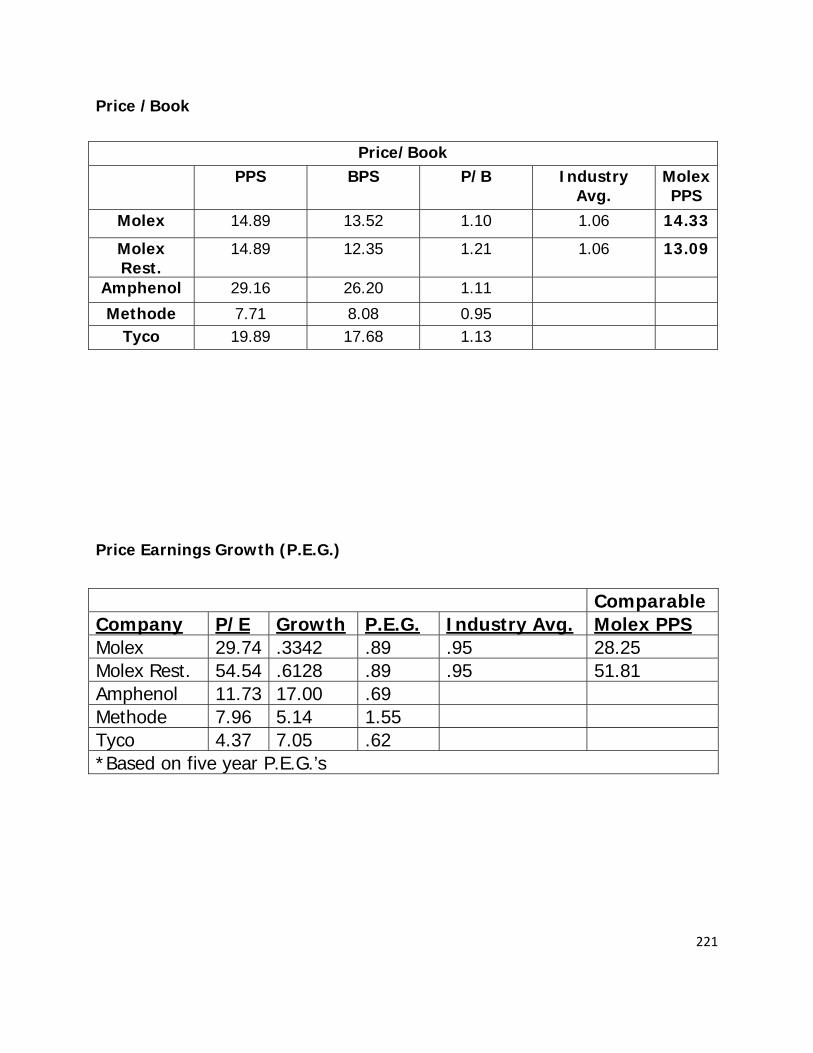
221
Price /Book
Price Earnings Growth (P.E.G.)
Price/Book PPS BPS P/B Industry
Avg. Molex PPS
Molex 14.89 13.52 1.10 1.06 14.33
Molex Rest.
14.89 12.35 1.21 1.06 13.09
Amphenol 29.16 26.20 1.11
Methode 7.71 8.08 0.95 Tyco 19.89 17.68 1.13
ComparableCompany P/E Growth P.E.G. Industry Avg. Molex PPS Molex 29.74 .3342 .89 .95 28.25 Molex Rest. 54.54 .6128 .89 .95 51.81 Amphenol 11.73 17.00 .69 Methode 7.96 5.14 1.55 Tyco 4.37 7.05 .62 *Based on five year P.E.G.’s
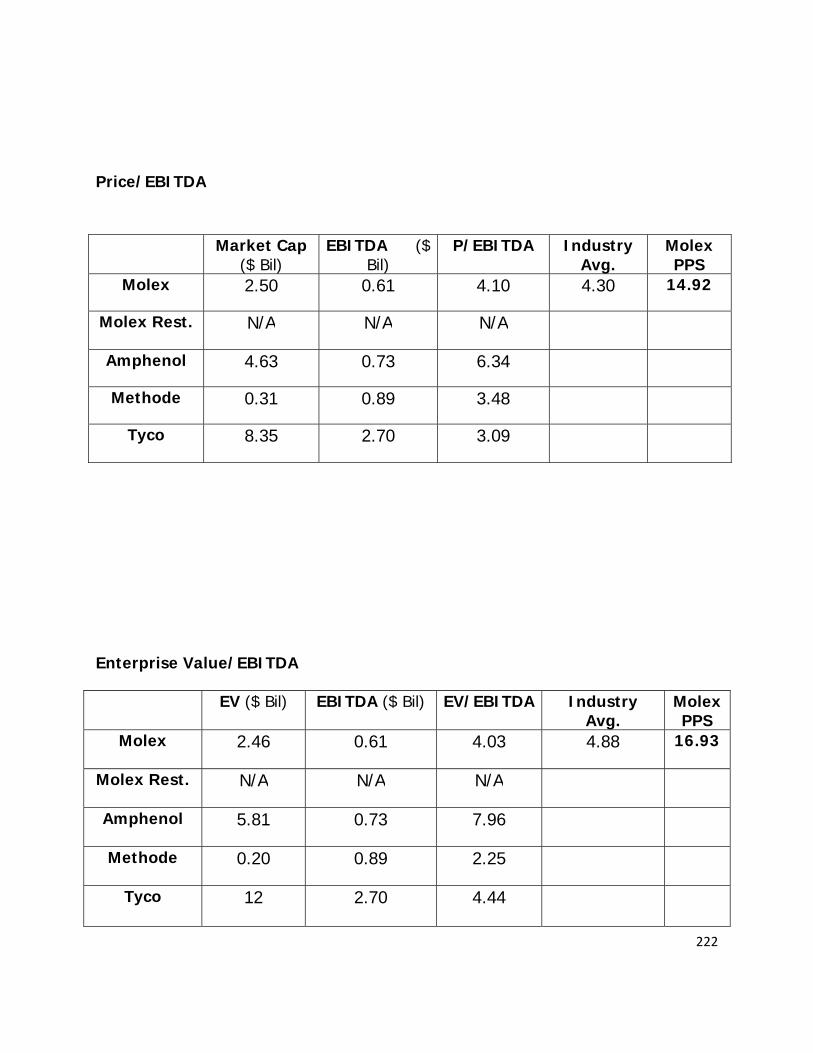
222
Price/EBITDA
Enterprise Value/EBITDA
EV ($ Bil) EBITDA ($ Bil) EV/EBITDA Industry Avg.
Molex PPS
Molex 2.46 0.61 4.03 4.88 16.93
Molex Rest. N/A N/A N/A
Amphenol 5.81 0.73 7.96
Methode 0.20 0.89 2.25
Tyco 12 2.70 4.44
Market Cap ($ Bil)
EBITDA ($ Bil)
P/EBITDA Industry Avg.
Molex PPS
Molex 2.50 0.61 4.10 4.30 14.92
Molex Rest. N/A N/A N/A
Amphenol 4.63 0.73 6.34
Methode 0.31 0.89 3.48
Tyco 8.35 2.70 3.09
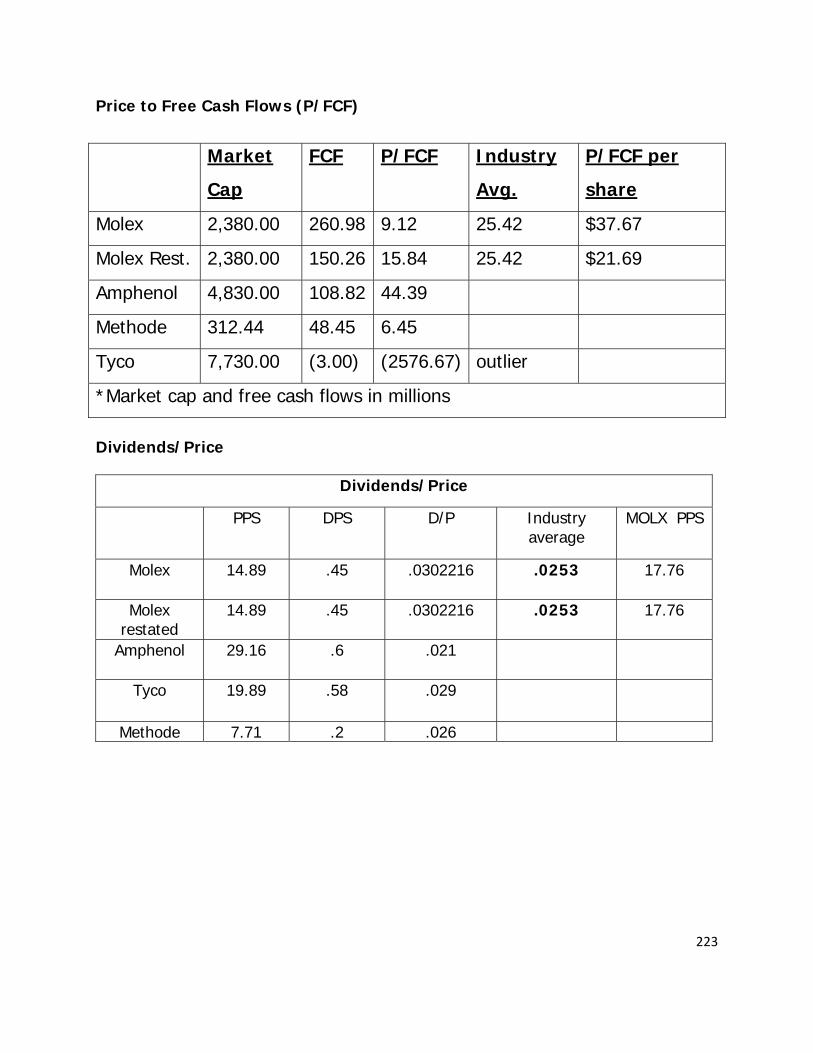
223
Price to Free Cash Flows (P/FCF)
Market
Cap
FCF P/FCF Industry
Avg.
P/FCF per
share
Molex 2,380.00 260.98 9.12 25.42 $37.67
Molex Rest. 2,380.00 150.26 15.84 25.42 $21.69
Amphenol 4,830.00 108.82 44.39
Methode 312.44 48.45 6.45
Tyco 7,730.00 (3.00) (2576.67) outlier
*Market cap and free cash flows in millions
Dividends/Price
Dividends/Price
PPS DPS D/P Industry average
MOLX PPS
Molex 14.89 .45 .0302216 .0253 17.76
Molex restated
14.89 .45 .0302216 .0253 17.76
Amphenol 29.16 .6 .021
Tyco 19.89 .58 .029
Methode 7.71 .2 .026
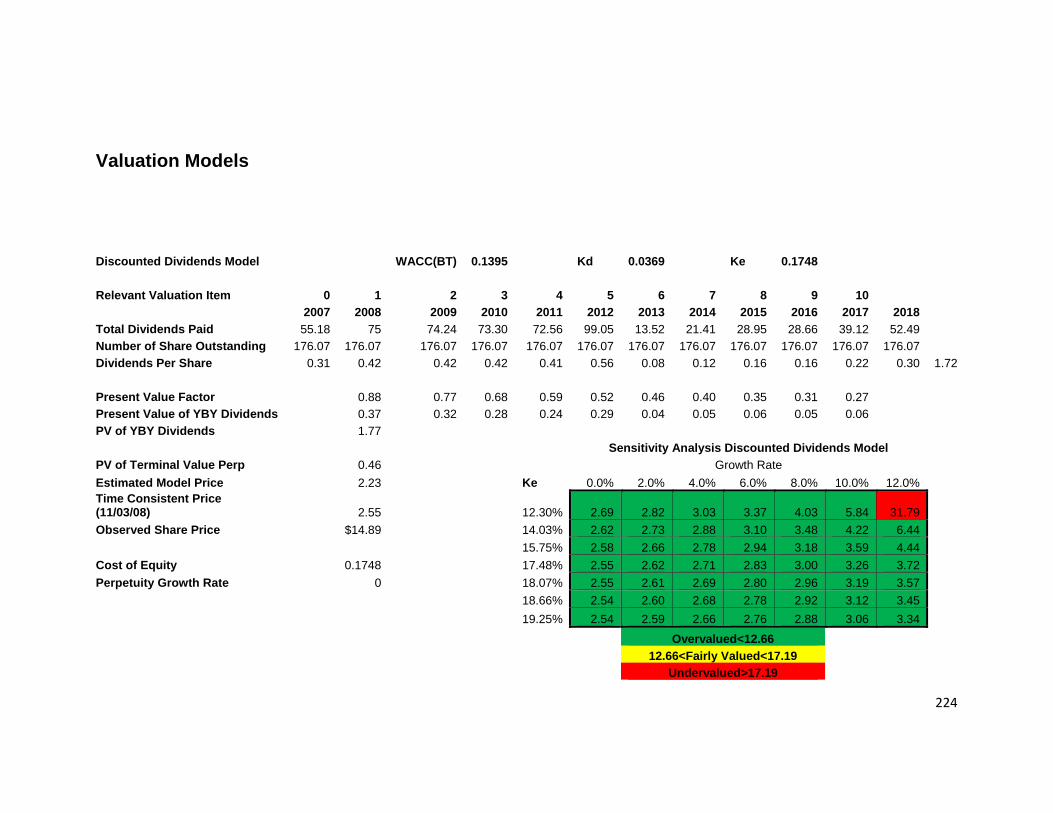
224
Valuation Models
Discounted Dividends Model
WACC(BT) 0.1395 Kd 0.0369 Ke 0.1748
Relevant Valuation Item 0 1 2 3 4 5 6 7 8 9 10 2007 2008 2009 2010 2011 2012 2013 2014 2015 2016 2017 2018
Total Dividends Paid 55.18 75 74.24 73.30 72.56 99.05 13.52 21.41 28.95 28.66 39.12 52.49 Number of Share Outstanding 176.07 176.07 176.07 176.07 176.07 176.07 176.07 176.07 176.07 176.07 176.07 176.07 Dividends Per Share 0.31 0.42 0.42 0.42 0.41 0.56 0.08 0.12 0.16 0.16 0.22 0.30 1.72
Present Value Factor 0.88 0.77 0.68 0.59 0.52 0.46 0.40 0.35 0.31 0.27 Present Value of YBY Dividends 0.37 0.32 0.28 0.24 0.29 0.04 0.05 0.06 0.05 0.06 PV of YBY Dividends 1.77
Sensitivity Analysis Discounted Dividends Model PV of Terminal Value Perp 0.46 Growth Rate Estimated Model Price 2.23 Ke 0.0% 2.0% 4.0% 6.0% 8.0% 10.0% 12.0% Time Consistent Price (11/03/08) 2.55 12.30% 2.69 2.82 3.03 3.37 4.03 5.84 31.79Observed Share Price $14.89 14.03% 2.62 2.73 2.88 3.10 3.48 4.22 6.44
15.75% 2.58 2.66 2.78 2.94 3.18 3.59 4.44Cost of Equity 0.1748 17.48% 2.55 2.62 2.71 2.83 3.00 3.26 3.72Perpetuity Growth Rate 0 18.07% 2.55 2.61 2.69 2.80 2.96 3.19 3.57
18.66% 2.54 2.60 2.68 2.78 2.92 3.12 3.4519.25% 2.54 2.59 2.66 2.76 2.88 3.06 3.34
Overvalued<12.66 12.66<Fairly Valued<17.19
Undervalued>17.19
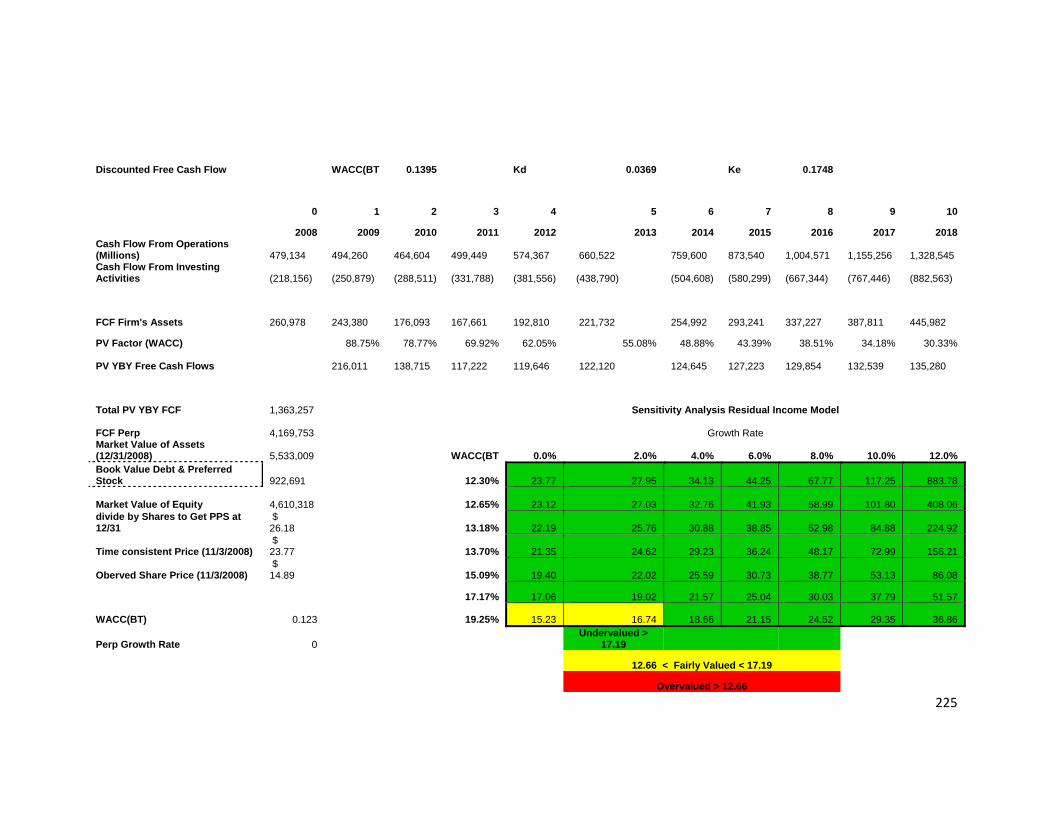
225
Discounted Free Cash Flow WACC(BT 0.1395 Kd 0.0369 Ke 0.1748
0 1 2 3 4 5 6 7 8 9 10
2008 2009 2010 2011 2012 2013 2014 2015 2016 2017 2018 Cash Flow From Operations (Millions)
479,134
494,260
464,604
499,449
574,367 660,522
759,600
873,540
1,004,571
1,155,256
1,328,545
Cash Flow From Investing Activities
(218,156)
(250,879)
(288,511)
(331,788)
(381,556) (438,790)
(504,608)
(580,299)
(667,344)
(767,446)
(882,563)
FCF Firm's Assets 260,978
243,380
176,093
167,661
192,810 221,732
254,992
293,241
337,227
387,811
445,982
PV Factor (WACC) 88.75% 78.77% 69.92% 62.05% 55.08% 48.88% 43.39% 38.51% 34.18% 30.33%
PV YBY Free Cash Flows 216,011
138,715
117,222
119,646 122,120
124,645
127,223
129,854
132,539
135,280
Total PV YBY FCF 1,363,257 Sensitivity Analysis Residual Income Model
FCF Perp 4,169,753 Growth Rate
Market Value of Assets (12/31/2008)
5,533,009 WACC(BT 0.0% 2.0% 4.0% 6.0% 8.0% 10.0% 12.0%
Book Value Debt & Preferred Stock
922,691 12.30% 23.77 27.95 34.13 44.25 67.77 117.25 883.78
Market Value of Equity 4,610,318 12.65% 23.12 27.03 32.76 41.93 58.99 101.80 408.06
divide by Shares to Get PPS at 12/31
$ 26.18 13.18% 22.19 25.76 30.88 38.85 52.98 84.88 224.92
Time consistent Price (11/3/2008) $ 23.77 13.70% 21.35 24.62 29.23 36.24 48.17 72.99 156.21
Oberved Share Price (11/3/2008) $ 14.89 15.09% 19.40 22.02 25.59 30.73 38.77 53.13 86.08
17.17% 17.06 19.02 21.57 25.04 30.03 37.79 51.57
WACC(BT) 0.123 19.25% 15.23 16.74 18.66 21.15 24.52 29.35 36.86
Perp Growth Rate 0 Undervalued >
17.19
12.66 < Fairly Valued < 17.19
Overvalued > 12.66

226
Restated
Discounted Free Cash Flow WACC(BT) 0.137 Kd 0.0369 Ke 0.1748
0 1 2 3 4 5 6 7 8 9 10 2008 2009 2010 2011 2012 2013 2014 2015 2016 2017 2018
Cash Flow From Operations (Millions) 367,414 329,506 309,736 331,417 381,130 438,300 504,045 579,651 666,599 766,589 881,577 Cash Flow From Investing Activities
(218,156) 342,080
(89,593)
(205,424)
(236,238)
(271,673)
(312,424)
(359,288)
(413,181)
(475,158)
(546,432)
FCF Firm's Assets 149,258 671,587 220,143 125,993 144,892 166,626 191,620 220,363 253,418 291,430 335,145 PV Factor (WACC) 88.75% 78.77% 69.92% 62.05% 55.08% 48.88% 43.39% 38.51% 34.18% 30.33% PV YBY Free Cash Flows 596,065 173,416 88,089 89,911 91,770 93,668 95,605 97,582 99,600 101,660
Total PV YBY FCF 1,527,367 Restated Sensitivity Analysis Discounted Free Cash Flow Model FCF Perp 2,813,261 Growth
Market Value of Assets (12/31/87) 4,340,628 WACC(BT) 0.0% 2.0% 4.0% 6.0% 8.0% 10.0% 12.0%
Book Value Debt & Preferred Stock 922,691 0.1230 28.79 32.41 37.70 46.25 62.59 107.04 741.73 Market Value of Equity 5,263,319 0.1265 28.27 31.68 36.60 44.39 58.72 94.44 348.80 divide by Shares to Get PPS at 12/31 $ 29.89 0.1318 27.53 30.66 35.10 41.91 53.86 80.62 197.48 Time consistent Price (11/3/08) $ 26.86 0.137 26.86 29.75 33.77 39.81 49.96 70.90 140.69 Oberved Share Price (11/1/08) $ 14.89 0.1509 25.28 27.65 30.83 35.34 42.30 54.61 82.63
0.1717 23.37 25.20 27.54 30.68 35.12 41.95 53.94
WACC(BT) 0.137 0.1925 21.84 23.30 25.12 27.44 30.54 34.91 41.61
Perp Growth Rate 0 Overvalued > 12.66
12.66 < Fairly Valued < 17.19
Undervalued > 17.19

227
Residual Income
0 1 2 3 4 5 6 7 8 9 10
2008 2009 2010 2011 2012 2013 2014 2015 2016 2017 2018
Net Income (Thousands) 215,437
192,569
181,015
217,336
249,937
287,427
330,541
380,122
437,141
502,712
578,118
Total Dividends (Thousands) (74,598)
(96,977)
(96,977)
(111,524)
(128,253)
(128,253)
(128,253)
(166,728)
(166,728)
(166,728)
(216,747)
Book Value Equity (Thousands)
2,676,846
2,772,437
2,856,474
2,962,286
3,083,970
3,243,145
3,445,433
3,658,827
3,929,239
4,265,222
4,626,594
Percent Change in RI 0.10
(0.07)
(0.05)
(0.06)
(0.06)
(0.06)
(0.09)
(0.09)
(0.09)
Annual Normal Income (Benchmark)
467,913
484,622
499,312
517,808
539,078
566,902
602,262
639,563
686,831
745,561
Annual Residual Income (275,344)
(303,608)
(281,976)
(267,871)
(251,651)
(236,361)
(222,140)
(202,422)
(184,119)
(167,443)
pv factor 0.85
0.72
0.62
0.52
0.45
0.38
0.32
0.28
0.23
0.20
YBY PV RI (234,375)
(219,981)
(173,908)
(140,627)
(112,455)
(89,907)
(71,925)
(55,789)
(43,194)
(33,437)
Book Value Equity (Thousands)
2,676,846 Sensitivity Analysis Residual Income Model
Total PV of YBY RI (1,175,598 Growth Rate
Terminal Value Perpetuity (881,276) Ke -10% -20% -30% -40% -50% -60% -70%
MVE 12/31/87 2,971,167 9.48% 15.71 13.33 11.89 10.86 10.07 9.42 8.88
divide by shares 16.87 11.48% 15.20 13.56 12.41 11.53 10.81 10.20 9.67
Model Price on 11/03/2008 14.89 13.48% 14.75 13.65 12.75 12.00 11.34 10.77 10.27
time consistent Price 13.68 15.48% 14.34 13.64 12.95 12.30 11.72 11.19 10.71
17.48% 13.94 13.56 13.03 12.49 11.96 11.47 11.02 Observed Share Price 11/03/2008 Over Valued < 12.66
Initial Cost of Equity (Ke) 17.48% 12.66 < Fairly Valued <17.19
Perpetuity Growth Rate (g) 0% Under Valued > 17.19
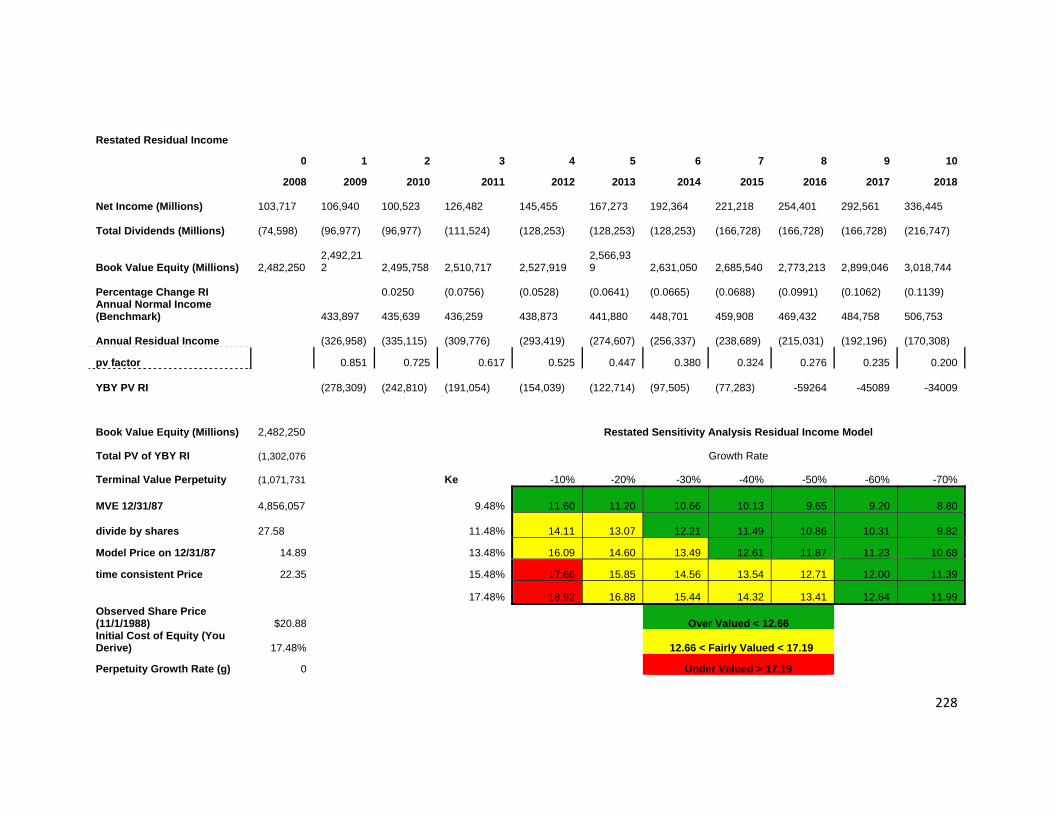
228
Restated Residual Income
0 1 2 3 4 5 6 7 8 9 10
2008 2009 2010 2011 2012 2013 2014 2015 2016 2017 2018
Net Income (Millions) 103,717
106,940
100,523
126,482
145,455
167,273
192,364
221,218
254,401
292,561
336,445
Total Dividends (Millions) (74,598)
(96,977)
(96,977)
(111,524)
(128,253)
(128,253)
(128,253)
(166,728)
(166,728)
(166,728)
(216,747)
Book Value Equity (Millions) 2,482,250
2,492,212
2,495,758
2,510,717
2,527,919
2,566,939
2,631,050
2,685,540
2,773,213
2,899,046
3,018,744
Percentage Change RI 0.0250
(0.0756)
(0.0528)
(0.0641)
(0.0665)
(0.0688)
(0.0991)
(0.1062)
(0.1139)
Annual Normal Income (Benchmark)
433,897
435,639
436,259
438,873
441,880
448,701
459,908
469,432
484,758
506,753
Annual Residual Income (326,958)
(335,115)
(309,776)
(293,419)
(274,607)
(256,337)
(238,689)
(215,031)
(192,196)
(170,308)
pv factor 0.851 0.725 0.617 0.525 0.447 0.380 0.324 0.276 0.235 0.200
YBY PV RI (278,309)
(242,810)
(191,054)
(154,039)
(122,714)
(97,505)
(77,283) -59264 -45089 -34009
Book Value Equity (Millions) 2,482,250 Restated Sensitivity Analysis Residual Income Model
Total PV of YBY RI (1,302,076 Growth Rate
Terminal Value Perpetuity (1,071,731 Ke -10% -20% -30% -40% -50% -60% -70%
MVE 12/31/87 4,856,057 9.48% 11.60 11.20 10.66 10.13 9.65 9.20 8.80
divide by shares 27.58 11.48% 14.11 13.07 12.21 11.49 10.86 10.31 9.82
Model Price on 12/31/87 14.89 13.48% 16.09 14.60 13.49 12.61 11.87 11.23 10.68
time consistent Price 22.35 15.48% 17.66 15.85 14.56 13.54 12.71 12.00 11.39
17.48% 18.92 16.88 15.44 14.32 13.41 12.64 11.99 Observed Share Price (11/1/1988) $20.88 Over Valued < 12.66 Initial Cost of Equity (You Derive) 17.48% 12.66 < Fairly Valued < 17.19
Perpetuity Growth Rate (g) 0 Under Valued > 17.19
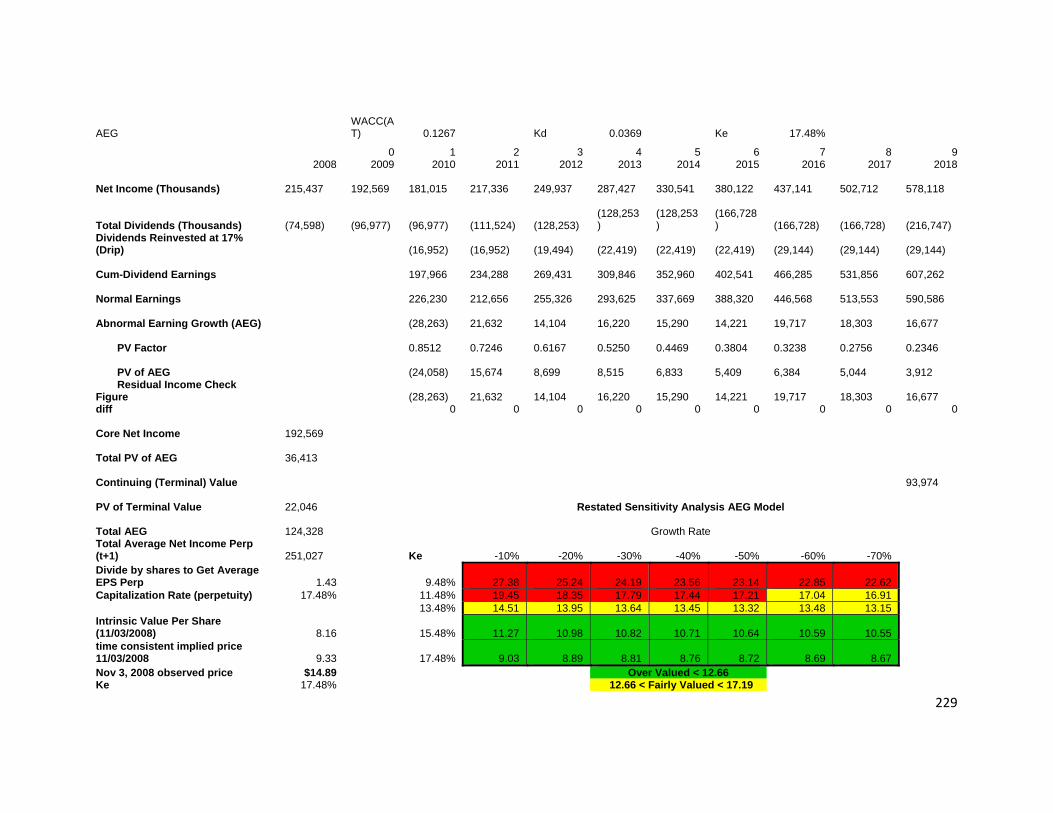
229
AEG WACC(AT) 0.1267 Kd 0.0369 Ke 17.48%
0 1 2 3 4 5 6 7 8 9 2008 2009 2010 2011 2012 2013 2014 2015 2016 2017 2018
Net Income (Thousands) 215,437
192,569
181,015
217,336
249,937
287,427
330,541
380,122
437,141
502,712
578,118
Total Dividends (Thousands) (74,598)
(96,977)
(96,977)
(111,524)
(128,253)
(128,253)
(128,253)
(166,728)
(166,728)
(166,728)
(216,747)
Dividends Reinvested at 17% (Drip)
(16,952)
(16,952)
(19,494)
(22,419)
(22,419)
(22,419)
(29,144)
(29,144)
(29,144)
Cum-Dividend Earnings 197,966
234,288
269,431
309,846
352,960
402,541
466,285
531,856
607,262
Normal Earnings 226,230
212,656
255,326
293,625
337,669
388,320
446,568
513,553
590,586
Abnormal Earning Growth (AEG) (28,263)
21,632
14,104
16,220
15,290
14,221
19,717
18,303
16,677
PV Factor 0.8512
0.7246
0.6167
0.5250
0.4469
0.3804
0.3238
0.2756
0.2346
PV of AEG (24,058)
15,674
8,699
8,515
6,833
5,409
6,384
5,044
3,912
Residual Income Check Figure
(28,263)
21,632
14,104
16,220
15,290
14,221
19,717
18,303
16,677
diff 0 0 0 0 0 0 0 0 0
Core Net Income 192,569
Total PV of AEG 36,413
Continuing (Terminal) Value 93,974
PV of Terminal Value 22,046 Restated Sensitivity Analysis AEG Model
Total AEG 124,328 Growth Rate
Total Average Net Income Perp (t+1)
251,027 Ke -10% -20% -30% -40% -50% -60% -70%
Divide by shares to Get Average EPS Perp 1.43 9.48% 27.38 25.24 24.19 23.56 23.14 22.85 22.62 Capitalization Rate (perpetuity) 17.48% 11.48% 19.45 18.35 17.79 17.44 17.21 17.04 16.91
13.48% 14.51 13.95 13.64 13.45 13.32 13.48 13.15 Intrinsic Value Per Share (11/03/2008) 8.16 15.48% 11.27 10.98 10.82 10.71 10.64 10.59 10.55 time consistent implied price 11/03/2008 9.33 17.48% 9.03 8.89 8.81 8.76 8.72 8.69 8.67 Nov 3, 2008 observed price $14.89 Over Valued < 12.66 Ke 17.48% 12.66 < Fairly Valued < 17.19

230
WACC(AT) 0.1267 Kd 0.0369 Ke 0.1748
Restated AEG 0 1 2 3 4 5 6 7 8 9
2008 2009 2010 2011 2012 2013 2014 2015 2016 2017 2018
Net Income (Thousands) 103717.4
4 106,940
100,523
126,482
145,455
167,273
192,364
221,218
254,401
292,561
336,445
Total Dividends (Thousands) -74598 (96,977)
(96,977)
(111,524)
(128,253)
(128,253)
(128,253)
(166,728)
(166,728)
(166,728)
(216,747)
Dividends Reinvested at 17% (Drip)
(13,040)
(16,952)
(16,952)
(19,494)
(22,419)
(22,419)
(22,419)
(29,144)
(29,144)
(29,144)
Cum-Dividend Earnings 119,980
117,475
143,434
164,949
189,691
214,782
243,637
283,545
321,705
365,590
Normal Earnings 121,847
125,633
118,095
148,591
170,880
196,512
225,989
259,887
298,870
343,701
Abnormal Earning Growth (AEG) (1,868)
(8,158)
25,339
16,358
18,811
18,270
17,648
23,658
22,835
21,889
PV Factor 85.12% 72.46% 61.67% 52.50% 44.69% 38.04% 32.38% 27.56% 23.46%
PV of AEG (6,944)
18,360
10,089
9,876
8,164
6,713
7,660
6,293
5,135
Residual Income Check Figure
(8,158)
25,339
16,358
18,811
18,270
17,648
23,658
22,835
21,889
Difference 0 0 0 0 0 0 0 0 0
Core Net Income 106,940
Total PV of AEG 65,345
Continuing (Terminal) Value Restated Sensitivity Analysis AEG Model 123,984
PV of Terminal Value 29,086
Growth Rate
Total AEG 154,782 Ke -10% -20% -30% -40% -50% -60% -70%
Total Average Net Income Perp (t+1)
201,372 9.48% 18.81 17.24 16.46 16.00 15.69 15.47 15.31
Divide by shares to Get Average EPS Perp 1.14 11.48% 13.85 12.97 12.51 12.24 12.05 11.91 11.81 Capitalization Rate (perpetuity) 17.48% 13.48% 10.70 10.19 9.91 9.74 9.62 9.54 9.47
15.48% 8.58 8.28 8.11 8.00 7.92 7.87 7.83 Intrinsic Value Per Share (11/03/2008) 6.54 17.48% 7.09 6.91 6.80 6.73 6.68 6.65 6.62
g 0 Under Valued > 17.19
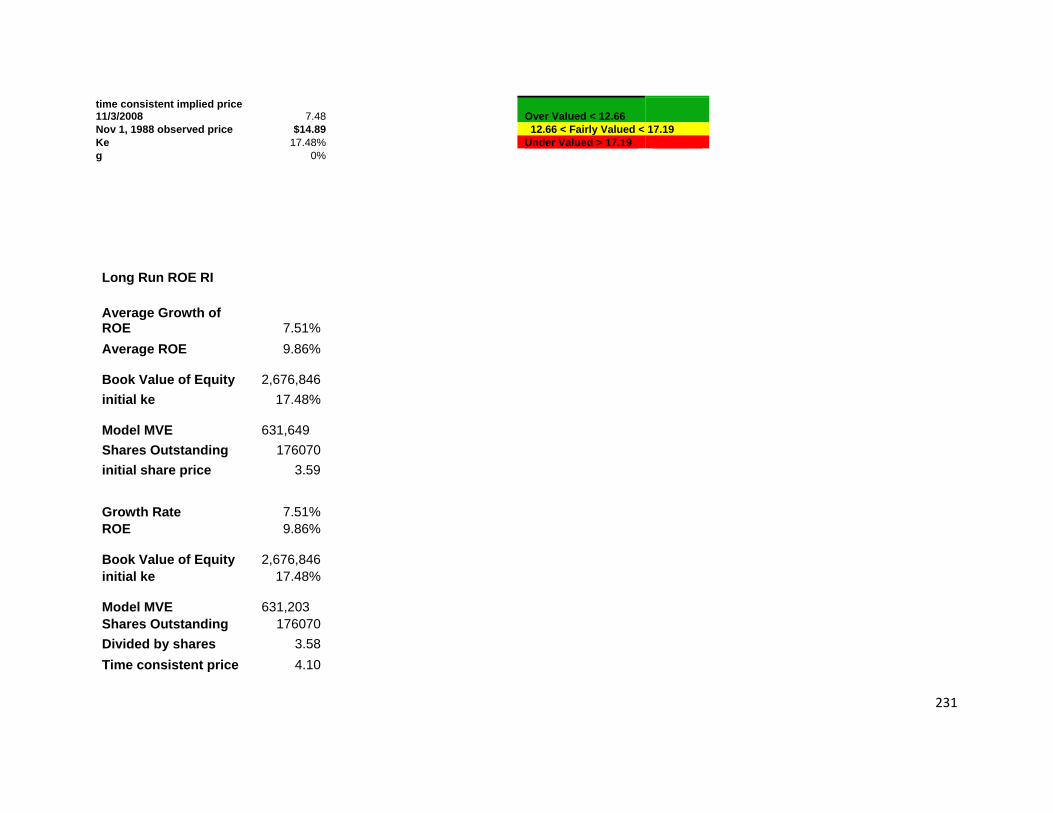
231
time consistent implied price 11/3/2008 7.48 Over Valued < 12.66 Nov 1, 1988 observed price $14.89 12.66 < Fairly Valued < 17.19 Ke 17.48% Under Valued > 17.19 g 0%
Long Run ROE RI
Average Growth of ROE 7.51% Average ROE 9.86%
Book Value of Equity 2,676,846
initial ke 17.48%
Model MVE 631,649
Shares Outstanding 176070 initial share price 3.59
Growth Rate 7.51% ROE 9.86%
Book Value of Equity 2,676,846
initial ke 17.48%
Model MVE 631,203
Shares Outstanding 176070 Divided by shares 3.58 Time consistent price 4.10

232
Growth Rate
Ke 4.51% 5.51% 6.51% 7.51% 8.51% 9.51% 10.51%
14.48% 9.13 8.25 7.15 5.74 3.85 1.20 N/A15.48% 8.36 7.48 6.40 5.06 3.32 1.01 N/A16.48% 7.72 6.85 5.80 4.52 2.93 0.87 N/A17.48% 7.17 6.32 5.31 4.10 2.62 0.77 N/A18.48% 6.71 5.87 4.90 3.75 2.37 0.69 N/A19.48% 6.30 5.49 4.56 3.46 2.17 0.62 N/A20.48% 5.95 5.16 4.26 3.22 2.00 0.57 N/A
ROE held constant at 9.86% Over Valued < 12.66
12.66 < Fairly Valued <17.19
Under Valued > 17.19
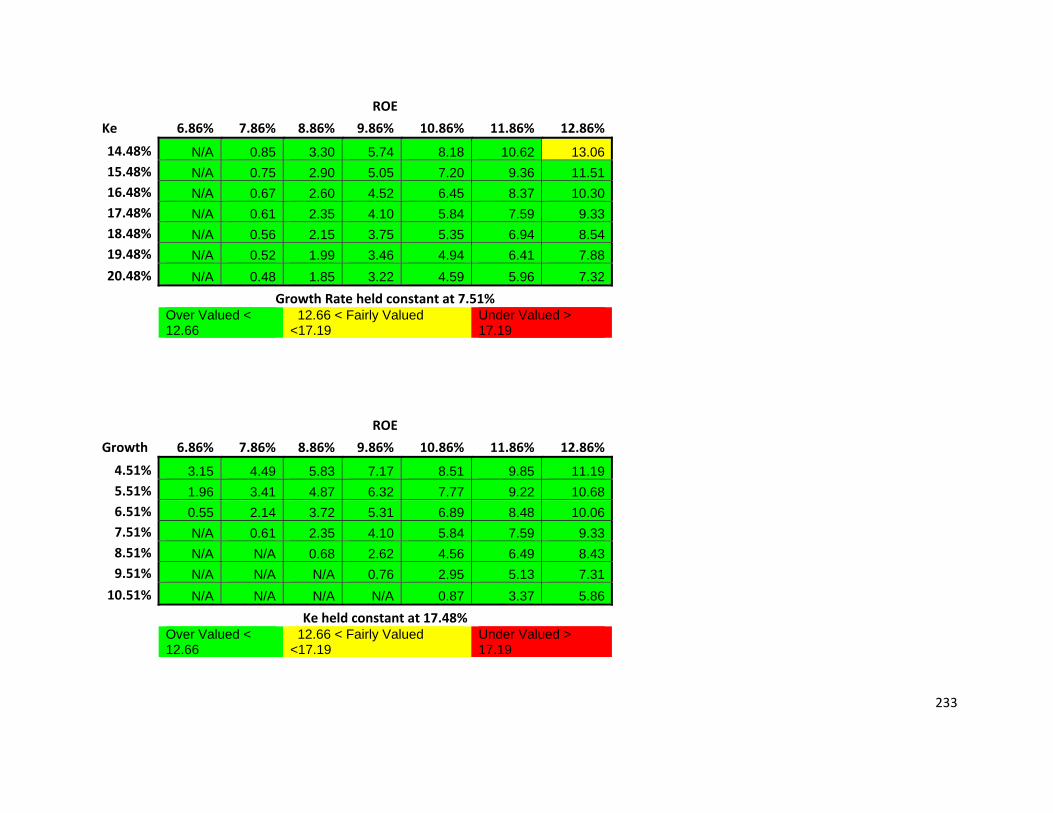
233
ROE
Ke 6.86% 7.86% 8.86% 9.86% 10.86% 11.86% 12.86%
14.48% N/A 0.85 3.30 5.74 8.18 10.62 13.0615.48% N/A 0.75 2.90 5.05 7.20 9.36 11.5116.48% N/A 0.67 2.60 4.52 6.45 8.37 10.3017.48% N/A 0.61 2.35 4.10 5.84 7.59 9.3318.48% N/A 0.56 2.15 3.75 5.35 6.94 8.5419.48% N/A 0.52 1.99 3.46 4.94 6.41 7.8820.48% N/A 0.48 1.85 3.22 4.59 5.96 7.32
Growth Rate held constant at 7.51% Over Valued < 12.66
12.66 < Fairly Valued <17.19
Under Valued > 17.19
ROE
Growth 6.86% 7.86% 8.86% 9.86% 10.86% 11.86% 12.86%
4.51% 3.15 4.49 5.83 7.17 8.51 9.85 11.195.51% 1.96 3.41 4.87 6.32 7.77 9.22 10.686.51% 0.55 2.14 3.72 5.31 6.89 8.48 10.067.51% N/A 0.61 2.35 4.10 5.84 7.59 9.338.51% N/A N/A 0.68 2.62 4.56 6.49 8.439.51% N/A N/A N/A 0.76 2.95 5.13 7.31
10.51% N/A N/A N/A N/A 0.87 3.37 5.86Ke held constant at 17.48%
Over Valued < 12.66
12.66 < Fairly Valued <17.19
Under Valued > 17.19
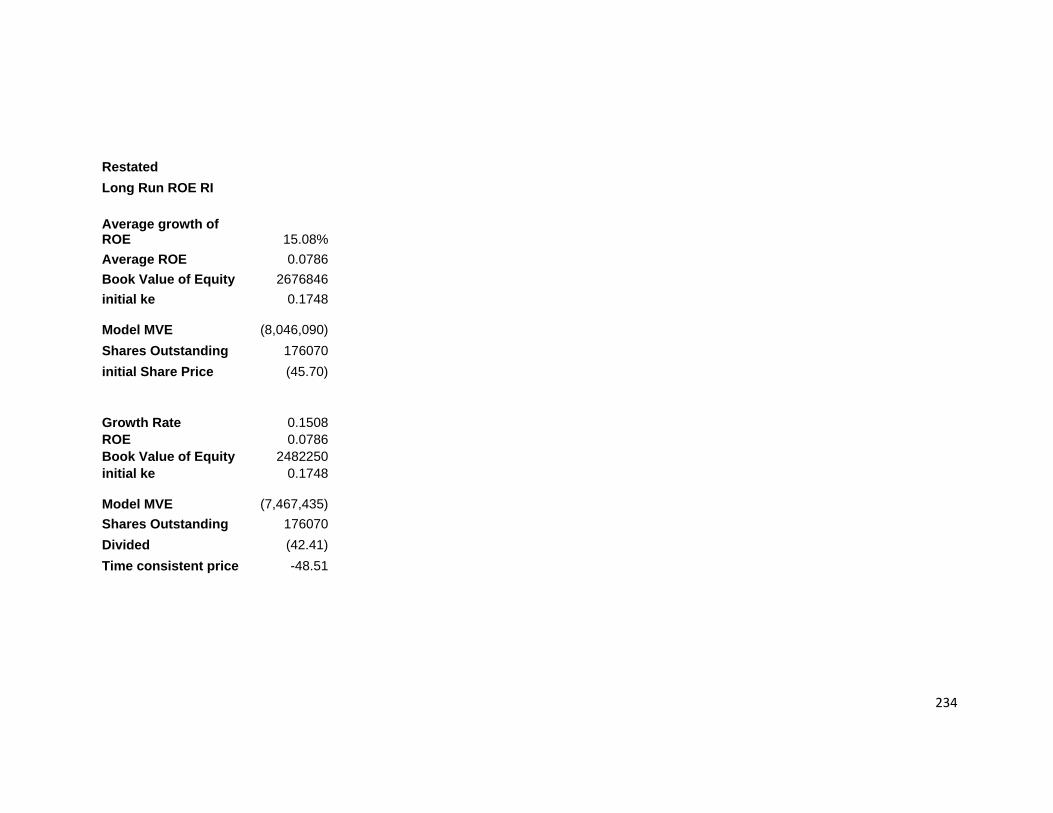
234
Restated Long Run ROE RI
Average growth of ROE 15.08%Average ROE 0.0786Book Value of Equity 2676846initial ke 0.1748
Model MVE (8,046,090)
Shares Outstanding 176070initial Share Price (45.70)
Growth Rate 0.1508ROE 0.0786Book Value of Equity 2482250initial ke 0.1748
Model MVE (7,467,435)
Shares Outstanding 176070Divided (42.41)Time consistent price -48.51

235
Revised Growth Rate
Ke 14.87% 15.87% 16.87% 17.87% 18.87% 19.87% 20.87%
14.48% 283.63 90.93 59.49 46.59 39.58 35.16 32.1315.48% N/A 326.45 103.03 66.57 51.62 43.48 38.3716.48% N/A N/A 369.85 115.29 73.75 56.72 47.4417.48% N/A N/A N/A 413.84 127.71 81.02 61.8818.48% N/A N/A N/A N/A 458.41 140.30 88.3919.48% N/A N/A N/A N/A N/A 503.56 153.0520.48% N/A N/A N/A N/A N/A N/A 549.29
ROE held constant at 9.86% Over Valued < 12.66
12.66 < Fairly Valued <17.19
Under Valued > 17.19
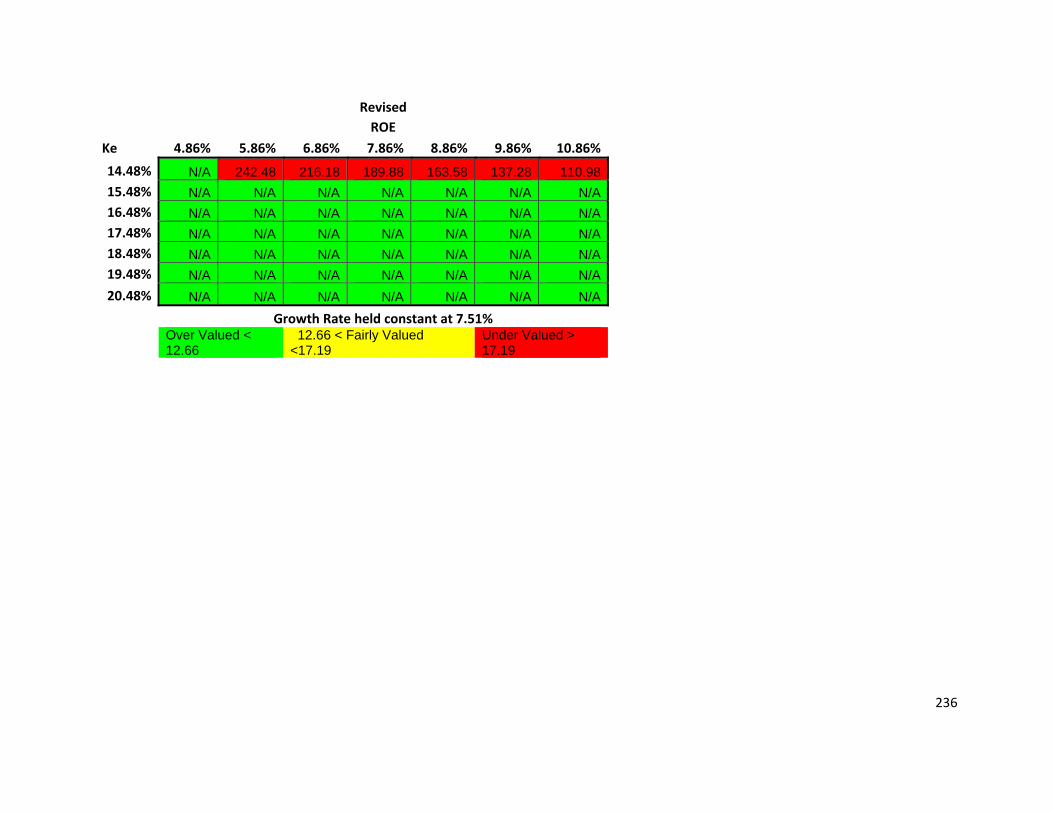
236
Revised ROE
Ke 4.86% 5.86% 6.86% 7.86% 8.86% 9.86% 10.86%
14.48% N/A 242.48 216.18 189.88 163.58 137.28 110.9815.48% N/A N/A N/A N/A N/A N/A N/A16.48% N/A N/A N/A N/A N/A N/A N/A17.48% N/A N/A N/A N/A N/A N/A N/A18.48% N/A N/A N/A N/A N/A N/A N/A19.48% N/A N/A N/A N/A N/A N/A N/A20.48% N/A N/A N/A N/A N/A N/A N/A
Growth Rate held constant at 7.51% Over Valued < 12.66
12.66 < Fairly Valued <17.19
Under Valued > 17.19
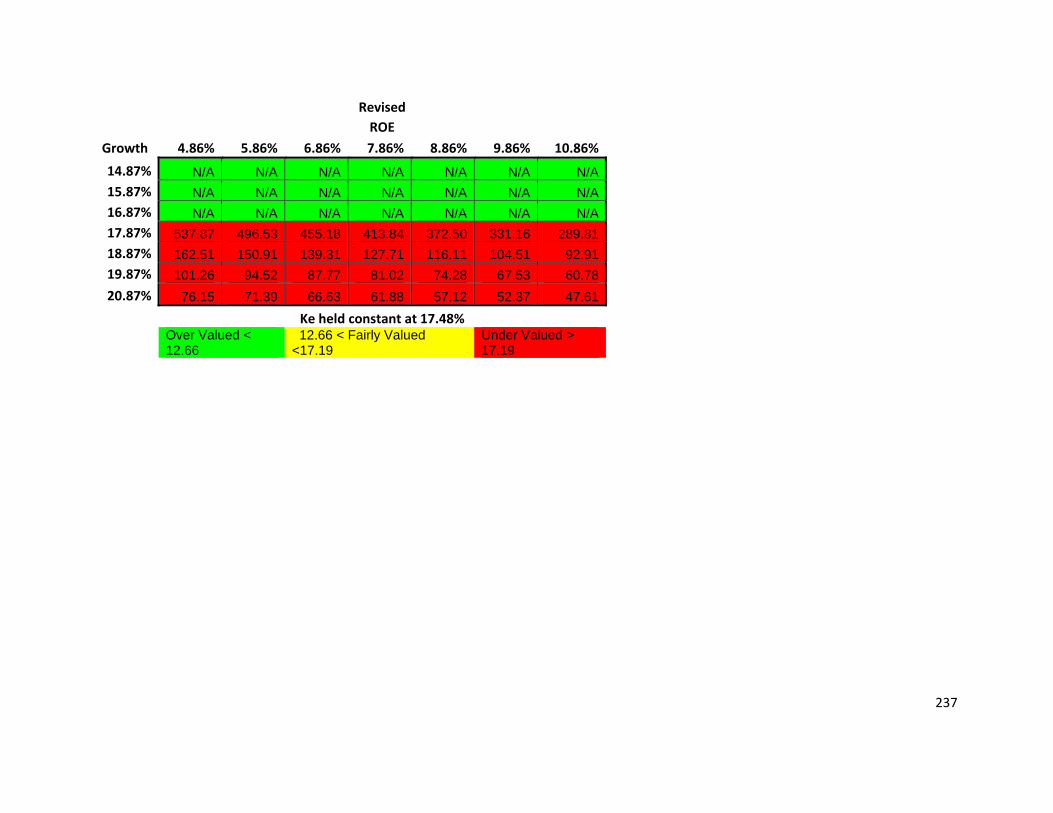
237
Revised ROE
Growth 4.86% 5.86% 6.86% 7.86% 8.86% 9.86% 10.86%
14.87% N/A N/A N/A N/A N/A N/A N/A15.87% N/A N/A N/A N/A N/A N/A N/A16.87% N/A N/A N/A N/A N/A N/A N/A17.87% 537.87 496.53 455.18 413.84 372.50 331.16 289.8118.87% 162.51 150.91 139.31 127.71 116.11 104.51 92.9119.87% 101.26 94.52 87.77 81.02 74.28 67.53 60.7820.87% 76.15 71.39 66.63 61.88 57.12 52.37 47.61
Ke held constant at 17.48% Over Valued < 12.66
12.66 < Fairly Valued <17.19
Under Valued > 17.19
238
Works Cited
Clark, Don. "Intel's New Chip Gets Strong Reviews." 15 Sept. 2008. Wall Street Journal.
15 Sept. 2008
<http://online.wsj.com/article/sb122150144796537293.html?mod=wsjcrmain>.
Curtin, Terrence R. "10K." Tyco Electronics. 14 Dec. 2007. 7 Sept. 2008
<http://investors.tycoelectronics.com/phoenix.zhtml?c=209396&p=irol-
sectext&text=ahr0cdovl2njym4umtbrd2l6yxjklmnvbs94bwwvzmlsaw5nlnhtbd9yzxbvpxrl
bmsmaxbhz2
"Economies of Scale." Answers.com. 12 Sept. 2008
<http://www.answers./economies%20of%20scale>.
"Economies of Scale." Economies of Scale. Ivestopedia: A Forbes Digital Company. 11 Sept.
2008 <http://www.investopedia.com/terms/e/economiesofscale.asp>.
Hofstrand, Don. "Barriers to Entry and Exit." Agricultureal marketing resource center. Mar.
2007. Iowa State university. 12 Sept. 2008
<http://www.agmrc.org/agmrc/business/gettingstarted/barrierstoentryandexit.htm>.

239
Johnson, David J. "10K." Molex.com. 6 Aug. 2008. 4 Sept. 2008
<http://ccbn.tenkwizard.com/filing.php?ipage=5813703&rid=12doc=1&total=&attach=
on&tk=molx&ck=0000067472&ck2=67472&fc=000000&bk=ffffff&sc=on&tc=cccccc&tc
1=ffffff&tc2=ffffff&lk=0000ff&al=ff0000&vl=800080&sd=20060915&ed=20080916>.
Koman, Douglas A., and Donald W. Duda. "10K." Methode.com. 17 July 2008. 7 Sept. 2008
<http://www.edgarexplorer.com/efx_dll/edgarpro.dll?fetchfilinghtml1?sessionid=xtlewc
behmyux9v&id=6047687>.
Loeffler, Martin H. "10k." Amphenol.com. 26 Feb. 2008. 7 Sept. 2008
<http://www.sec.gov/archives/edgar/data/820313/000110465908012896/a08-
2409_110k.htm>.
Palepu, Krishna G., and Paul M. Healy. Business Analysis & Valuation. 4th ed. Mason, OH:
Thomson, 2008. 1-1+.
Reuters, Thomson. "Commodities and Futures overview." 12 Sept. 2008. 12 Sept. 2008
<http://online.wsj.com/mdc/public/page/mdc_commodities.html?mod=2_0030>.
Scheck, Justin. "Dell plans to Sell Factories In Effort to Cut Cost." 5 Sept. 2008. 14 Sept. 2008
<http://online.wsj.com/article/sb122058183649202581.html?mod=sphere_ts&mod=sp
here...>.

240
Scocco, Daniel. "Competitive Advantage: Economies of Learning." Weblog post. Competitive
Advantage: Economies of Learning. 22 Feb. 2007. 13 Sept. 2008
<http://innovationzen.com/blog/2007/02/22/competitive-advantage-economies-of-
learning>.
Scocco, Daniel. "Competitive Advantage: Economies of Scale." Weblog post. Competitive
Advantage: Economies of Scale. 6 Feb. 2007. 13 Feb. 2008
<http://innovationzen.com/blog/2007/02/06/competitive-advantage-economies-of-
scale>.
Shwiff, Kathy. "Tyco Electronics To Close 3 Europe Plants, Take $115M Charge." WSJ.com. 4
Sept. 2008. Wall Street Journal. 14 Sept. 2008 <http://online.wsj.com/article/bt-co-
20080904-711858.html?mod=wsjcrmain>
Spors, Kelly. "The Small-Business Advantage: Customer Service." 3 Sept. 2008. Wall Street
Journal. 15 Sept. 2008 <http://blogs.wsj.com/independentstreet/2008/09/03/the-small-
business-advantage-customer-service/>.
"Switching Barriers." Wikipedia: The free encyclopedia. 11 Sept. 2008
<http://en.wikipedia.org/wiki/switching_costs>.

241
TAKAHASHI, YOSHIO. "Mitsubishi, Mazda Raise Prices in Japan." 15 Sept. 2008. 15 Sept. 2008
<http://online.wsj.com/article/sb122142903593433797.html?mod=autoschannelmain_r
elatedstories>.
"What is RoHS?" HOME: What is RoHS? 2007. 14 Sept. 2008
<http://http://www.rohs.gov.uk/>.
"Alphabetical company index A-Z". Electronic- OEMS. 21 Nov. 2008
<www.electronic-oems.com>.
"How are plastics made?". Webster’s New Universal Unabridged Dictionary. 11 Nov. 2008 <http://www.reachoutmichigan.org/funexperiments/quick/plastic.html>.
"U.S. Copper Fabricatior Database". Copper. org. 24 Nov. 2008 <http://www.copper.org/homepage.html>.
Curtin, Terrence R. "10K." Tyco Electronics. 14 Dec. 2007. 7 Sept. 2008
<http://investors.tycoelectronics.com/phoenix.zhtml?c=209396&p=irol-
sectext&text=ahr0cdovl2njym4umtbrd2l6yxjklmnvbs94bwwvzmlsaw5nlnhtbd9yzxbvpxrl
bmsmaxbhz2
"H." Effect on New Goodwill Accounting on Financial Statements. 29 Sept. 2008
<http://www.nysscpa.org/cpajournal/2004/1004/essentials/p30.htm>.
242
Johnson, David J. "10K." Molex.com. 6 Aug. 2008. 4 Sept. 2008
<http://ccbn.tenkwizard.com/filing.php?ipage=5813703&rid=12doc=1&total=&attach=
on&tk=molx&ck=0000067472&ck2=67472&fc=000000&bk=ffffff&sc=on&tc=cccccc&tc
1=ffffff&tc2=ffffff&lk=0000ff&al=ff0000&vl=800080&sd=20060915&ed=20080916>.
Koman, Douglas A., and Donald W. Duda. "10K." Methode.com. 17 July 2008. 7 Sept. 2008
<http://www.edgarexplorer.com/efx_dll/edgarpro.dll?fetchfilinghtml1?sessionid=xtlewc
behmyux9v&id=6047687>.
Loeffler, Martin H. "10k." Amphenol.com. 26 Feb. 2008. 7 Sept. 2008
<http://www.sec.gov/archives/edgar/data/820313/000110465908012896/a08-
2409_110k.htm>.
Palepu, Krishna G., and Paul M. Healy. Business Analysis & Valuation. 4th ed. Mason, OH:
Thomson, 2008. 1-1+.
Pensions. 29 Sept. 2008 <http://retireplan.about.com/cs/retirment/a/aa_defined_a5.htm>.

243
Curtin, Terrence R. "10K." Tyco Electronics. 14 Dec. 2007. 7 Sept. 2008
<http://investors.tycoelectronics.com/phoenix.zhtml?c=209396&p=irol-
sectext&text=ahr0cdovl2njym4umtbrd2l6yxjklmnvbs94bwwvzmlsaw5nlnhtbd9yzxbvpxrl
bmsmaxbhz2
www.investopedia.com
Johnson, David J. "10K." Molex.com. 6 Aug. 2008. 4 Sept. 2008
<http://ccbn.tenkwizard.com/filing.php?ipage=5813703&rid=12doc=1&total=&attach=
on&tk=molx&ck=0000067472&ck2=67472&fc=000000&bk=ffffff&sc=on&tc=cccccc&tc
1=ffffff&tc2=ffffff&lk=0000ff&al=ff0000&vl=800080&sd=20060915&ed=20080916>.
Koman, Douglas A., and Donald W. Duda. "10K." Methode.com. 17 July 2008. 7 Sept. 2008
<http://www.edgarexplorer.com/efx_dll/edgarpro.dll?fetchfilinghtml1?sessionid=xtlewc
behmyux9v&id=6047687>.
Loeffler, Martin H. "10k." Amphenol.com. 26 Feb. 2008. 7 Sept. 2008
<http://www.sec.gov/archives/edgar/data/820313/000110465908012896/a08-
2409_110k.htm>.

244
Palepu, Krishna G., and Paul M. Healy. Business Analysis & Valuation. 4th ed. Mason, OH:
Thomson, 2008. 1-1+.


