Modelling water wave overwash of a thin oating plate · into the ice-covered ocean (e.g. Doble &...
12
Modelling water wave overwash of a thin floating plate D. M. Skene 1 , L. G. Bennetts 1 , M. H. Meylan 2 , A. Toffoli 3 1 School of Mathematical Sciences, University of Adelaide, Adelaide 5005, Australia 2 School of Mathematical and Physical Sciences, University of Newcastle, Callaghan 2308, Australia 3 Centre for Ocean Engineering Science and Technology, Swinburne University of Technology, Melbourne 3122, Australia September 10, 2015 Abstract A theoretical model of water wave overwash of a thin floating plate is proposed. The nonlinear shallow water equations are used to model the overwash, and the linear potential-flow/thin-plate model to force it. Model predictions are compared to overwash depths measured during a series of laboratory wave basin experiments. The model is shown to be accurate for incident waves of low steepness or short length. 1 Introduction Thin floating plates are conventionally used to model sea ice floes in theoretical models of ocean surface wave propagation through the ice-covered ocean (see the review of Squire, 2007). The models are now being integrated into large-scale, numerical, ice/ocean models to predict wave penetration distances into the ice-covered ocean (e.g. Doble & Bidlot, 2013) and concomitant wave-induced breakup of the ice cover (e.g. Dumont et al., 2011). A theoretical model of a water wave interacting with a solitary plate is the kernel of the wave-ice models. The incident wave and plate lengths are comparable, i.e. the wave and plate motions are strongly coupled. Potential-flow theory models water motions, and, typically, Kirchhoff-Love theory models the plate motions. The model incorporates the plate’s elastic response via its Young’s modulus. Thus, it extends classic models of wave-body interactions, for example, models of ship hydrodynamics. Moreover, it is customarily assumed that wave amplitudes are sufficiently small to employ linear theory. Meylan & Squire (1994) developed the first solution method for the full-linear problem in two spatial dimensions. Bennetts & Williams (2010), amongst others, developed a solution method for the extended three-dimensional problem. Laboratory experimental validation of the solitary plate model is a relatively recent development. Montiel et al. (2013a ,b ) used a series of wave tank experiments on polyvinyl chloride (pvc) plastic disks with regular incident waves of low steepness to validate the linear model. However, they installed vertical barriers around the edges of the disk to prevent the waves overwashing them, and hence maintain consistency with the theoretical model. Overwash refers to water running over the top of the plate, forced by the surrounding wave motion. It occurs for moderate incident amplitudes, due to the small freeboard of the thin plate. It is a highly nonlinear phenomenon, and is not included in the handful of existing nonlinear theoretical models (e.g. Papathanasiou et al., 2015). Overwash is related to green water, i.e. water loads on ship decks and other offshore structures, forced by large storm waves. Mizoguchi (1989) first proposed a theoretical model of green water, based on the shallow-water dam-break model. Buchner & Cozijn (1997) and Greco (2001), amongst others, have since significantly developed and validated green water models. However, overwash distinguishes 1
Transcript of Modelling water wave overwash of a thin oating plate · into the ice-covered ocean (e.g. Doble &...

Modelling water wave overwash of a thin floating plate
D. M. Skene1, L. G. Bennetts1, M. H. Meylan2, A. Toffoli31School of Mathematical Sciences, University of Adelaide, Adelaide 5005, Australia
2School of Mathematical and Physical Sciences, University of Newcastle, Callaghan 2308, Australia3Centre for Ocean Engineering Science and Technology, Swinburne University of Technology, Melbourne 3122, Australia
September 10, 2015
Abstract
A theoretical model of water wave overwash of a thin floating plate is proposed. The nonlinearshallow water equations are used to model the overwash, and the linear potential-flow/thin-platemodel to force it. Model predictions are compared to overwash depths measured during a series oflaboratory wave basin experiments. The model is shown to be accurate for incident waves of lowsteepness or short length.
1 Introduction
Thin floating plates are conventionally used to model sea ice floes in theoretical models of ocean surfacewave propagation through the ice-covered ocean (see the review of Squire, 2007). The models are nowbeing integrated into large-scale, numerical, ice/ocean models to predict wave penetration distancesinto the ice-covered ocean (e.g. Doble & Bidlot, 2013) and concomitant wave-induced breakup of theice cover (e.g. Dumont et al., 2011).
A theoretical model of a water wave interacting with a solitary plate is the kernel of the wave-icemodels. The incident wave and plate lengths are comparable, i.e. the wave and plate motions arestrongly coupled. Potential-flow theory models water motions, and, typically, Kirchhoff-Love theorymodels the plate motions. The model incorporates the plate’s elastic response via its Young’s modulus.Thus, it extends classic models of wave-body interactions, for example, models of ship hydrodynamics.
Moreover, it is customarily assumed that wave amplitudes are sufficiently small to employ lineartheory. Meylan & Squire (1994) developed the first solution method for the full-linear problem in twospatial dimensions. Bennetts & Williams (2010), amongst others, developed a solution method for theextended three-dimensional problem.
Laboratory experimental validation of the solitary plate model is a relatively recent development.Montiel et al. (2013a,b) used a series of wave tank experiments on polyvinyl chloride (pvc) plasticdisks with regular incident waves of low steepness to validate the linear model. However, they installedvertical barriers around the edges of the disk to prevent the waves overwashing them, and hencemaintain consistency with the theoretical model.
Overwash refers to water running over the top of the plate, forced by the surrounding wave motion.It occurs for moderate incident amplitudes, due to the small freeboard of the thin plate. It is a highlynonlinear phenomenon, and is not included in the handful of existing nonlinear theoretical models(e.g. Papathanasiou et al., 2015).
Overwash is related to green water, i.e. water loads on ship decks and other offshore structures,forced by large storm waves. Mizoguchi (1989) first proposed a theoretical model of green water, basedon the shallow-water dam-break model. Buchner & Cozijn (1997) and Greco (2001), amongst others,have since significantly developed and validated green water models. However, overwash distinguishes
1
itself from green water by (i) occuring for moderate incident wave amplitudes, and (ii) being semi-continuously forced, as opposed to the ‘first event’ nature of green water.
In an investigation closely related to the present one, Meylan et al. (2015) validated the linearmodel predictions of plate motions using experiments on solitary plates without edge barriers. Theyused square plates made of pvc and a denser and more rigid polypropylene (pp) plastic. Theyshowed that the linear model is accurate for a range of incident wave lengths and steepnesses, evenin cases where strong overwash occurred. Bennetts et al. (2015) analysed the wave fields transmittedby the plates during the experiments. They showed that as the incident wave steepness increases thetransmitted wave becomes irregular and the proportion of wave energy transmitted decreases. Theynoted that the steeper incident waves concomitantly produced strong overwash.
Bennetts & Williams (2015) validated two theoretical models of wave transmission by multiple thinplates, using wave basin experiments on 40 to 80 wooden disks. They noted a correlation betweenstrong overwash and a reduction in the proportion of wave energy transmitted by the disks, and hencea loss of model accuracy.
The works cited above used the experimental measurements to assess model accuracy at basinscale. A Froude scaling, with a specified geometric scaling factor, is typically used to interpret themeasurements at field scale. In particular, density does not change from basin to field scales. Thepp plastic used by Meylan et al. (2015) has a density that closely matches measured values for seaice, and its freeboard is therefore representative of the freeboard of natural ice floes. Pvc has a lowerdensity than sea ice and, thus, its freeboard is greater than that of ice floes. The elastic modulus mustbe multiplied by the geometric scaling factor to obtain the equivalent field value. Plastic plates aregenerally more rigid than ice floes at field scale, although the more compliant pvc is representative ofice floes up to geometrical scaling factors of approximately 20.
Here, a theoretical model of overwash is proposed. Following green water models, the nonlinearshallow water equations model the overwash. The surrounding water and plate motions predicted bythe linear model force the overwash, with no back coupling from the overwash to the surroundingwater or plate motions. This model assumption is motivated by the findings of Meylan et al. (2015).A dataset from the same experimental campaign used by Meylan et al. (2015) is used to validate theoverwash model. The dataset derives from tests using the same plates and range of incident wavelengths and steepnesses. However, overwash depths, rather than the motions of the plates, weremeasured.
2 Wave basin experiments
Experiments were conducted in the wave basin facility of the Coastal Ocean and Sediment Transport(coast) Laboratory, Plymouth University, U.K. The basin is 10 m wide, 15.5 m long and filled withfresh water of density ρ ≈ 1000 kg m−3 and H = 0.5 m depth. Figure 1 shows a schematic plan viewof the basin. At the right-hand end of the basin a piston controlled wave maker is used to generateincident waves and absorb a proportion of the waves reflected back to it. A beach at the left-handend of the basin absorbs the majority of the wave energy that reaches it. A reflection analysis wasconducted at the centre of the basin prior to the full tests. It showed the combination of the beachand absorption by the wave maker resulted in reflected wave energy contributing less than 1% to theoverall wave energy.
For each test, a solitary thin floating plastic plate was deployed in the basin. All plates used weresquare with side lengths 2L = 1 m. They were loosely tethered at their corners to the basin floor. Thetether had a natural period greater than 20 s, which is over an order of magnitude greater than theperiod of the incident waves used. It allowed the plates to surge back and forth at the period of theincident waves but restricted drift down the basin.
Both pp and pvc plastics were used. The pp had a manufacturer specified density ρp = 905 kg m−3
and elastic modulus E = 1600 MPa. The pvc had manufacturer specified density ρp = 500 kg m−3
2

Figure 1: Plan view of experimental set-up (not to scale)
Figure 2: Schematic of overwash model (not to scale)
and elastic modulus E = 750 MPa. Following Montiel et al. (2013a,b) and Meylan et al. (2015) areduced value of E = 500 MPa is used to model the pvc plates. Three thicknesses were tested foreach plastic: h = 5 mm, 10 mm, 19 mm (pvc only) and 20 mm (pp only).
Regular incident waves with periods T = 0.6 s, 0.8 s, and 1.0 s were used. The correspondingwavelengths are λ = 0.56 m, 1.00 m and 1.51 m, respectively. Incident wave amplitudes A were chosento provide steepnesses kA = 0.04, 0.08, 0.1, and 0.15. The wave number k = 2π/λ is the positivereal root of the dispersion relation k tanh(kH) = ω2/g, where ω = 2π/T is angular frequency andg ≈ 9.81 m s−2 is gravitational acceleration.
A small wave probe and a high-definition video camera recorded the overwash. The camera pro-vided a qualitative assessment of the overwash. The probe was positioned at the geometric centre ofeach plate’s upper surface. It recorded time series of overwash depth at 120 Hz frequency, for 300 sfollowing activation of the wave maker, which ran for over 300 s. The series were analysed for thesecond 150 s, as a conservative measure to cut off initial transients.
The probe detected overwash in 58 of the 72 tests conducted. The mean overwash depth was1.77 mm over the 58 tests where overwash occurred. The maximum depth recorded was 9.95 mm.Bores were a prominent feature in the overwash. The largest bores were generated at the plates’leading edges. The bores became turbulent and sometimes broke in deep overwash. The electronicsupplementary material (esm) shows two movies of overwash during tests in which the mean depthwas 0.81 mm and 2.75 mm, respectively.
3
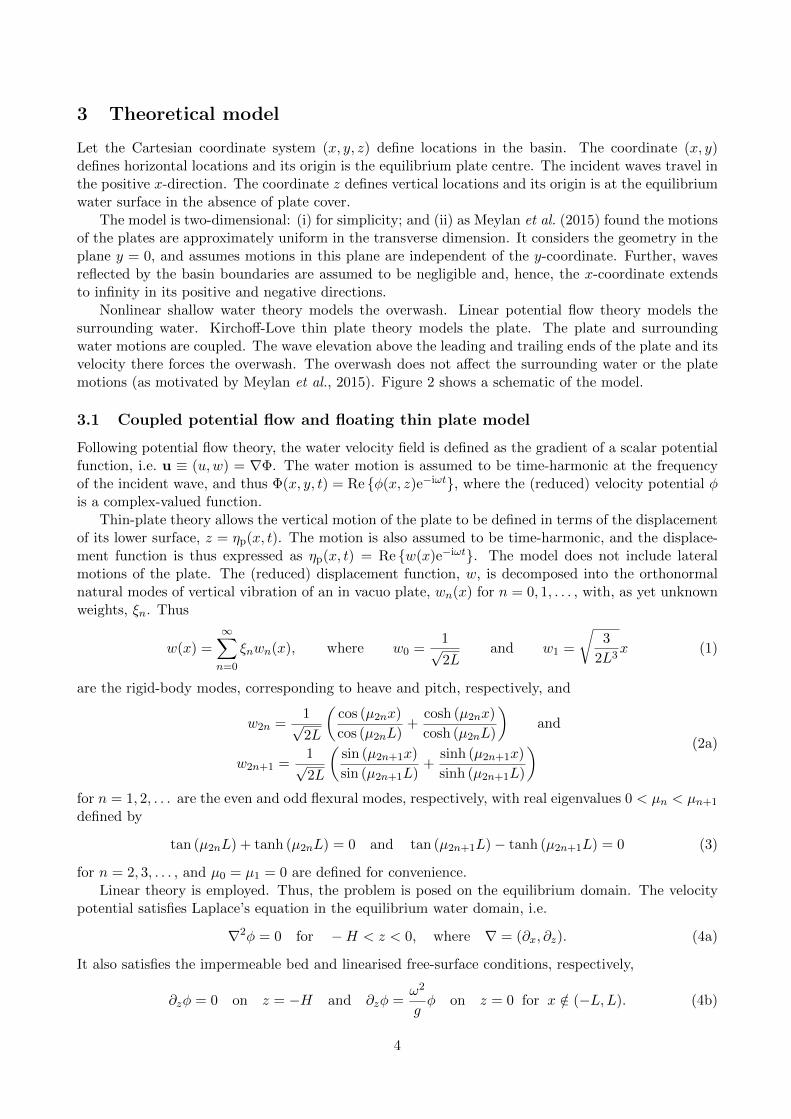
3 Theoretical model
Let the Cartesian coordinate system (x, y, z) define locations in the basin. The coordinate (x, y)defines horizontal locations and its origin is the equilibrium plate centre. The incident waves travel inthe positive x-direction. The coordinate z defines vertical locations and its origin is at the equilibriumwater surface in the absence of plate cover.
The model is two-dimensional: (i) for simplicity; and (ii) as Meylan et al. (2015) found the motionsof the plates are approximately uniform in the transverse dimension. It considers the geometry in theplane y = 0, and assumes motions in this plane are independent of the y-coordinate. Further, wavesreflected by the basin boundaries are assumed to be negligible and, hence, the x-coordinate extendsto infinity in its positive and negative directions.
Nonlinear shallow water theory models the overwash. Linear potential flow theory models thesurrounding water. Kirchoff-Love thin plate theory models the plate. The plate and surroundingwater motions are coupled. The wave elevation above the leading and trailing ends of the plate and itsvelocity there forces the overwash. The overwash does not affect the surrounding water or the platemotions (as motivated by Meylan et al., 2015). Figure 2 shows a schematic of the model.
3.1 Coupled potential flow and floating thin plate model
Following potential flow theory, the water velocity field is defined as the gradient of a scalar potentialfunction, i.e. u ≡ (u,w) = ∇Φ. The water motion is assumed to be time-harmonic at the frequencyof the incident wave, and thus Φ(x, y, t) = Re {φ(x, z)e−iωt}, where the (reduced) velocity potential φis a complex-valued function.
Thin-plate theory allows the vertical motion of the plate to be defined in terms of the displacementof its lower surface, z = ηp(x, t). The motion is also assumed to be time-harmonic, and the displace-ment function is thus expressed as ηp(x, t) = Re {w(x)e−iωt}. The model does not include lateralmotions of the plate. The (reduced) displacement function, w, is decomposed into the orthonormalnatural modes of vertical vibration of an in vacuo plate, wn(x) for n = 0, 1, . . . , with, as yet unknownweights, ξn. Thus
w(x) =
∞∑n=0
ξnwn(x), where w0 =1√2L
and w1 =
√3
2L3x (1)
are the rigid-body modes, corresponding to heave and pitch, respectively, and
w2n =1√2L
(cos (µ2nx)
cos (µ2nL)+
cosh (µ2nx)
cosh (µ2nL)
)and
w2n+1 =1√2L
(sin (µ2n+1x)
sin (µ2n+1L)+
sinh (µ2n+1x)
sinh (µ2n+1L)
) (2a)
for n = 1, 2, . . . are the even and odd flexural modes, respectively, with real eigenvalues 0 < µn < µn+1
defined by
tan (µ2nL) + tanh (µ2nL) = 0 and tan (µ2n+1L)− tanh (µ2n+1L) = 0 (3)
for n = 2, 3, . . . , and µ0 = µ1 = 0 are defined for convenience.Linear theory is employed. Thus, the problem is posed on the equilibrium domain. The velocity
potential satisfies Laplace’s equation in the equilibrium water domain, i.e.
∇2φ = 0 for −H < z < 0, where ∇ = (∂x, ∂z). (4a)
It also satisfies the impermeable bed and linearised free-surface conditions, respectively,
∂zφ = 0 on z = −H and ∂zφ =ω2
gφ on z = 0 for x /∈ (−L,L). (4b)
4

In the far-field the velocity potential satisfies the radiation conditions
φ ∼ g
iω
(Aeikx +Re−ikx
) cosh k(z + h)
cosh(kh)as x→ −∞, (4c)
and φ ∼ gT eikx cosh k(z + h)
iω cosh (kh)as x→∞, (4d)
where R and T are, as yet unknown, complex-valued reflection and transmission amplitudes, respec-tively.
The velocity potential and displacement function are coupled at their equilibrium interface viakinematic and dynamic conditions. The kinematic condition equates the vertical velocity of the waterparticles at the water surface to the vertical velocity of the corresponding points of the plate. Thedynamic condition uses Kirchoff-Love thin-plate theory, and considers the vertical motions of the plateto be forced by the pressure differential between its upper and lower surfaces. The conditions assumethe lower surface of the plate remains in contact with the water at all points and at all times duringits motion. They are, respectively,
∂zφ = −iω
∞∑n=0
ξnwn and iωφ =
∞∑n=0
{1 + βµ4n − ω2γ
}ξnwn (4e)
on z = 0 for x ∈ (−L,L). Here, β = Eh3/{12(1− ν2)ρg} and γ = ρph/ρg are scaled flexural rigidityand mass of the plate, respectively, where ν = 0.4 and ν = 0.3 are representative values of Poisson’sratio for pp and pvc, respectively. Coupling conditions (4e) use the frequently used zero-draughtapproximation (e.g. Meylan & Squire, 1994). Note that the Archimedean draught is used in § 3.3 tocouple the surrounding water to the overwash.
The potential is expressed as the sum of scattering and radiation components, i.e.
φ = φS − iω
∞∑n=0
ξnφRn . (5)
The scattering potential φS satisfies the problem in which the plate is held in place, i.e. equations(4a–b) and the first component of equation (4e) with ξn = 0 set for all n. The radiation potentialφRj satisfies the problem in which the plate is forced to oscillate with unit amplitude in mode j inthe absence of incident forcing, i.e. equations (4a–b) and the first component of equation (4e) withξn = δnj and A = 0 set.
The component potentials are calculated using the free surface Green’s function, G(x−x0, z). It isthe solution of the governing equations, forced at the point x = x0 on the free surface in the absenceof plate cover and incident wave forcing, i.e.
∇2G = 0 for −H < z < 0, ∂zG = 0 on z = −H, (6a)
∂zG− ω2G/g = δ(x− x0) on z = 0, (6b)
and the radiation condition that G represents outgoing waves in the far-field. Meylan & Squire (1994),for example, provide an explicit expression for a more general version of the Green’s function. Green’stheorem generates the integral equations
φS(x, 0) =gAeikx
iω− ω2
g
∫ L
−LG(x− x0, 0)φS(x0, 0) dx0, and (7a)
φRn (x, 0) = −∫ L
−LG(x− x0, 0)
(ω2
gφRn (x0)− wn(x0)
)dx0 for n = 0, 1, . . . (7b)
5

for x ∈ (−L,L). The potentials are calculated numerically on the wetted surface of the plate, as thesolutions of (7a–b). The radiation potentials, φRn , are calculated for n = 0, . . . , N , where N is finiteand sufficiently large that the truncated version of (5) accurately approximates the full-linear solution.
Applying the second component of (4e) to the truncated potential and taking inner-products withrespect to wj for j = 0, . . . , N , results in the system(
K + C− ω2M− ω2A(ω)− iωB(ω))ξ = f(ω). (8)
Here, K, C and M are diagonal stiffness, hydrostatic-restoring and mass matrices, respectively, Aand B are added mass and damping matrices, respectively, f is the forcing vector, and ξ is a vectorcontaining the modal weights. Their entries are defined as
Kjj = βµ4j−1, Cjj = 1 and Mjj = γ for j = 1, . . . , N + 1, (9a)
ω2Aij + iωBij =ω2
g
∫ L
−LφRj−1(x, 0)wi−1(x) dx for i, j = 1, . . . , N + 1, (9b)
fj =iω
g
∫ L
−LφS(x, 0)wj−1(x) dx and ξj = ξj−1 for j = 1, . . . , N + 1. (9c)
System (5) is solved for the vector of modal weights, ξ. The reflection and transmission amplitudesare subsequently calculated as R = AI+ and T = A(1 + I−), where
I± =−i cosh2 (kH)
cosh (kH) sinh (kH) + kH
∫ L
−Le±ikx
(ω2
gφ(x, 0)− ∂zφ(x, 0)
)dx. (10)
3.2 Nonlinear shallow water equations
It is assumed that (i) the vertical length scale of the overwash is much smaller than its horizontal lengthscale, (ii) the water particles’ vertical accelerations are much smaller than gravitational accelerationand, thus, the water pressure is approximately hydrostatic, and (iii) the plate pitches at a smallangle only. The assumptions are consistent with experimental observations. Assumption (ii) impliesthat the force of the plate’s motion on the overwash is negligible in comparison to gravitationalforce. Assumption (iii) implies that the gravitational force acts approximately perpendicularly tothe plate’s upper surface. Further, turbulence and wave breaking are neglected as a simplifyingassumption. Therefore, the nonlinear shallow water equations model the overwash, i.e. the hyperbolicpartial differential system
∂tq + ∂xf(q) = 0 for x ∈ (−L,L), (11)
where q = [q, qu]T and f(q) =
[qu, qu2 +
1
2gq2]T.
Here u(x, t) is its depth averaged horizontal velocity and q(x, t) is the overwash depth, which is definedas the height of the surface elevation above the plate’s upper surface.
The numerical scheme outlined by Kurganov & Tadmor (2000) is used to approximate spatialderivatives in system (11). It is a second-order accurate finite volume method. It is able to capturebores which generate as discontinuities in the solution. In this numerical scheme, horizontal space isdiscretised into M+1 uniformly spaced cells centred at the points {x0 = −L, x1 = −L+∆x,. . . ,xM =L}, and the notation qj(t) ≡ q(xj , t) is employed. The spatial derivative in (11) is approximated as
∂xf(qj(t)) ≈ −L (qj(t)) =Bj+ 1
2(t)−Bj− 1
2(t)
∆x, (12)
6

where Bj± 12
are fluxes on the jth cell’s left (-) and right (+) boundaries, defined via
Bj+ 12(t) =
a+j+ 1
2
f(q−j+ 1
2
)− a−j+ 1
2
f(q+j+ 1
2
) + a+j+ 1
2
a−j+ 1
2
(q+j+ 1
2
− q+j+ 1
2
)a+j+ 1
2
− a−j+ 1
2
, (13)
where a±j+ 1
2
= ±max
{±κ±(q−
j+ 12
),±κ±(q+j+ 1
2
), 0
}and κ±(q) = u±√gq, (14)
i.e. κ±(q) are the largest (+) and smallest (-) eigenvalues of the Jacobian of f(q).The minmod limiter presented in Kurganov & Tadmor (2000) is used to prevent unnatural oscil-
lations occurring either side of a shock, where
minmod {•1, •2, . . . } =
{minj{•j} if •j > 0 for all j,
maxj{•j} if •j < 0 for all j,(15)
and zero otherwise. It determines
qx,j+ 12
= minmod
{θqj+1 − qj
∆x,qj+1 − qj−1
2∆x, θ
qj − qj−1∆x
}, (16)
where θ = 1.5, which, in turn, determines the half-space values
q+j+ 1
2
= qj+1 −1
2qx,j+ 1
2and q−
j+ 12
= qj +1
2qx,j+ 1
2(17)
used in equations (13) and (14).The total variation diminishing Runge-Kutta 2 scheme is used to time step. It suppresses unnatural
extrema as the solution evolves. The scheme is expressed as
2qj (t+ ∆t) = 2qj(t) + ∆tL(qj(t)) + ∆tL(qj(t) + ∆tL(qj(t))
)(18)
where ∆t > 0 is a time step satisfying the cfl condition (Gottlieb & Shu, 1998).
3.3 Forcing the shallow water equations
The coupled potential-flow/thin-plate model provides steady forcing for the shallow water equations.It defines two conditions at each end of the interval occupied by the shallow water. This is a sufficientnumber of boundary conditions for the shallow-water equations. It allows for bores to be generatedat the ends of the plate and also permits water to enter and exit the interval.
The overwash depth at the interface with the surrounding water is equated to the height of thefree surface elevation, η(x, t) = ρ∂tΦ(x, 0, t)/g, above the upper surface of the plate. It is set to zeroif the height is negative. Thus,
q(±L, t) = max {η(±L, t)− ηp(±L, t) + C, 0} , where C = h(1− ρp / ρ) (19)
is the plate’s equilibrium freeboard, which is calculated via Archimedes’ principle. Numerical testsshowed evanescent wave motions have minor impact on the results presented in § 4. Thus, the freesurface elevations are approximated as
η(−L, t) ≈ Re{(Ae−ikL +ReikL
)e−iωt
}and η(L, t) ≈ Re
{T eikL−iωt
}. (20)
7

Figure 3: Left-hand panels show variation from mean of overwash depth signal measured duringexperiments (dashed red curves) and predicted by theoretical model (solid blue) from an arbitraryinitial time. Right-hand panels compare snapshots of model simulations with photos of correspondingexperiments. Red arrows highlight locations of corresponding bores. Note that, in the simulationsnapshots, the vertical and horizontal lengths are on different scales. Top panels are results for 10 mmthick pvc plate forced by waves of steepness kA = 0.10 and length λ = 1.00 m. Bottom panels areresults for 20 mm thick pp plate forced by waves of steepness kA = 0.08 and length λ = 0.56 m.
Similarly, the horizontal velocity of the overwash at the interface with the surrounding water isequated to the horizontal velocity of the free surface water particles adjacent to the plate edges,U(x, t) = ∂xΦ(x, 0, t). It is set to zero if the free surface is not above the plate’s ends. Thus
u(±L, t) =
{U(±L, t) if η(±L, t) ≥ −ηp(±L, t) + C,
0 otherwise.(21)
Initially, the shallow water is set to a uniform depth of q = 1µm and to be stationary, i.e. u = 0.For a prescribed incident wave and plate, the shallow water equations are run to a quasi-steady state,i.e. until the overwash depth profile is approximately time-harmonic. For the results shown in § 4,this occurred after approximately 40 wave periods.
4 Results
The model accurately predicts the presence of overwash at the centre of the plate for the 58 testconditions the gauge detected it in the experiments. It predicts overwash for four of the 14 testconditions in which overwash was not detected in the experiments.
Figure 3 shows example qualitative comparisons of overwash predicted by the model and recordedduring the experiments. The example tests are for a 10 mm thick pvc plate forced by waves of
8

Figure 4: Overwash mean depth and standard deviation at the centre of each pvc plate’s uppersurface. Blue circles denote theoretical model predictions. Red squares denote values extracted fromexperimental data.
steepness kA = 0.10 and length λ = 1.00 m (top panels), and a 20 mm thick pp plate forced by wavesof steepness kA = 0.08 and length λ = 0.56 m (bottom).
The left-hand panels show the variation of overwash depth about its mean depth at the plate’scentre. Bores are evident in the signals. The model predicts the shape and amplitude of the boresaccurately, although it is unable to capture the rounded peaks in the experimental signal. Small boresgenerated at the sides of the pvc plate cause the shoulders in its experimental signal.
The right-hand panels show snapshots of the overwash profile predicted by the model and photosfrom the corresponding tests. Note that the direction of the incident wave has been reversed in themodel to match the experiments, and that, in the simulation snapshots, the horizontal and verticallengths are on different scales. Red arrows indicate the location of corresponding bores in the modeland experiments. They show that the model predicts the distance between successive bores accurately.The esm provides movie comparisons for the two tests. They emphasise that the model predicts thebore velocities accurately.
Overwash is quantified in terms of the mean and standard deviation of the depth signal at the centreof the plate. Figure 4 compares the model predictions of these quantities with the values extractedfrom the experimental measurements. The data are separated into different incident wavelengths andpresented as functions of incident steepness. Results are shown for the pvc plate tests only, as thebehaviours are indicative of those for the pp plate tests, which are contained in the esm.
The mean depth and standard deviation increase as the incident steepness increases. Further, forthe two thicker plates, h = 10 mm and 19 mm, the depth and deviation tend to increase as incidentwavelength increases. Model predictions (not shown) indicate that overwash dies out as the incidentwavelength increases beyond the values tested here.
The model predicts the depth and deviation accurately for the smallest incident wavelength, λ =0.56 m, except for the test using the thinnest plate and steepest incident wave, h = 5 mm and kA =0.15. Neglecting this isolated case, the mean error is 0.16 mm for the depth and 0.04 mm for thedeviation. Further, the model is accurate for the intermediate wavelength, λ = 1.00 m, and the twothicker plates, with the exception of the steepest incident wave for the 10 mm thick plate. For the
9

Figure 5: As in figure 3 for a 19 mm thick pvc plate forced by waves of steepness kA = 0.15 andlength λ = 1.56 m.
thinnest plate, the model is accurate only for the least steep incident wave.The model increasingly over predicts the depth and deviation as the incident wave becomes steeper
and longer, i.e. the overwash becomes deeper and more variable. The over prediction is significantin some of the tests using the longest incident wavelength, λ = 1.56 m. For example, for the longestwavelength, the mean error is 2.44 mm for the depth and 0.19 mm for the deviation.
Figure 5 shows a qualitative model-experiment comparison, which is typical of the regime wherethe model over predicts the depth and deviation. The esm contains the corresponding movies. Thephoto shows large and turbulent bores in the experiments, which are generated at the trailing endof the plate as well as at the leading end. The photo shows an instant when the bores collided,which caused them to break. The model snapshot shows it predicts bores are generated at both plateends. However, it shows the shallow water equations permit the bores to pass through one another(the mound approximately one-third of the plate length in from the left-hand end). Turbulence andbreaking lead to the significant differences in the depth variations shown in the left-hand panel. Notethe variation conceals the 6.64 mm difference in the mean depths for this test.
5 Conclusions
A theoretical model of overwash of a thin floating plate, forced by regular incident waves, has beenpresented. It extends the linear potential-flow/thin-plate model of coupled wave and plate motions,which neglects overwash, using the nonlinear shallow water equations to model the overwash. It wasvalidated via laboratory experimental measurements of the overwash depth on thin floating plasticplates.
The model was shown to predict qualitative and quantitative overwash properties accurately forshallow overwash, which generally occurs for incident waves with relatively short lengths or low steep-nesses. This implies that, in this regime, the linear potential-flow/thin-plate model accurately predictsoverwash forcing and the shallow water equations accurately model the overwash. Further, the modelwas shown to over predict the overwash depth and deviation increasingly, as the overwash becomesdeeper, i.e. the incident wave becomes longer or steeper. This was shown to coincide with the exper-imental regime in which large turbulent bores are generated at both the plates’ leading and trailingends and break when they collide. This implies a turbulent version of the shallow water equations willimprove model accuracy for long, steep incident waves.
The model, or an extended version of it, has the potential to act as the basis of a model ofthe impact of overwash on wave transmission, as observed in laboratory experiments by Bennetts &Williams (2015) and Bennetts et al. (2015). This model, in turn, has the potential to predict the
10

amplitude dependence of the attenuation rate of ocean waves in the ice-covered ocean with respect todistance travelled, which was shown by Meylan et al. (2015) using in-situ measurements of wave activ-ity. However, as noted in § 1, the laboratory experiments only validate the model for plates that haverigidities representative of sea ice floes at field scale up to limited geometric length scales. Moreover,the turbulence observed in the overwash during the experiments implies that the Reynolds numberis an important quantity to evaluate the overwash properties at field scale. As the Reynolds numberscales with the characteristic length to the power three-halves, the onset of turbulence is expected forrelatively shallower overwash.
Plymouth University funded the experiments. Peter Arber, Claudio Cavaliere and Alberto Al-berello helped conduct the experiments. An Australian Postgraduate Award funds a PhD scholar-ship for DMS. The Australian Research Council funds an early-career researcher fellowship for LGB(DE130101571). The Australian Antarctic Science Program funds LGB and DMS (Project 4123). TheU.S. Office of Naval Research supports MHM (Grant N00014-13-1-0290).
References
Bennetts, L. G., Alberello, A., Meylan, M. H. Cavaliere, C. Babanin, A. & Toffoli,A. 2015 An idealised experimental model of ocean surface wave transmission by an ice floe. OceanModel. doi:10.1016/j.ocemod.2015.03.001.
Bennetts, L. G. & Williams, T. D. 2010 Wave scattering by ice floes and polynyas of arbitraryshape. J. Fluid Mech. 662, 5–35.
Bennetts, L. G. & Williams, T. D. 2015 Water wave transmission by an array of floating disks.Proc. R. Soc. Lond. A 471 (2014069).
Buchner, B. & Cozijn, J. L. 1997 An investigation into the numerical simulation of green water. InProc. Int. Conference on the Behaviour of Offshore Structures, vol. 2, pp. 113–125. Delft: ElsevierScience.
Doble, M. J. & Bidlot, J.-R. 2013 Wavebuoy measurements at the Antarctic sea ice edge comparedwith an enhanced ECMWF WAM: progress towards global waves-in-ice modeling. Ocean Model. 70,166–173.
Dumont, D., Kohout, A. L. & Bertino, L. 2011 A wave-based model for the marginal ice zoneincluding a floe breaking parameterization. J. Geophys. Res. 116 (C04001).
Gottlieb, S. & Shu, C. W. 1998 Total variation diminishing Runge-Kutta schemes. Math. Comp.67 (221), 73–85.
Greco, M. 2001 A two-dimensional study of green-water loading. PhD thesis, Norwegian Universityof Science and Technology.
Kurganov, A. & Tadmor, E. 2000 New high-resolution central schemes for nonlinear conservationlaws and convection–diffusion equations. J. Comput. Phys. 160 (1), 241–282.
Meylan, M. H., Bennetts, L. G., Alberello, A., Cavaliere, C. & Toffoli, A. 2015 Exper-imental and theoretical models of wave-induced flexure of a sea ice floe. Phys. Fluids 27, 041704.
Meylan, M. H., Bennetts, L. G. & Kohout, A. L. 2014 In-situ measurements and analysis ofocean waves in the Antarctic marginal ice zone. Geophys. Res. Lett. 41(14), 5046–5051.
11

Meylan, M. H. & Squire, V. A. 1994 The response of ice floes to ocean waves. J. Geophys. Res.99 (C1), 891–900.
Mizoguchi, S. 1989 Analysis of shipping water with the experiments and the numerical calculations.J. Soc. Nat. Nav. Archit. Jpn. 27, 83–91.
Montiel, F., Bonnefoy, F., Ferrant, P., Bennetts, L. G., Squire, V. A. & Marsault, P.2013a Hydroelastic response of floating elastic disks to regular waves. Part 1: Wave tank experi-ments. J. Fluid Mech. 723, 604–628.
Montiel, F., Bennetts, L. G., Squire, V. A., Bonnefoy, F. & Ferrant, P. 2013b Hydroelas-tic response of floating elastic disks to regular waves. Part 2: Modal analysis. J. Fluid Mech. 723,629–652.
Papathanasiou, T. K., Karperaki, A., Theotokoglou, E. E. & Belibassakis, K. A. 2015A higher order FEM for time-domain hydroelastic analysis of large floating bodies in an inhomo-geneous shallow water environment. Proc. R. Soc. Lond. A 471 (2173).
Squire, V. A. 2007 Of ocean waves and sea-ice revisited. Cold Reg. Sci. Technol. 49, 110–133.
12