
Numerical Simulation of Wave Loads on Static Offshore Structures
Upload
nguyenhuongCategory
view
223download
2
ECN-C–04-042
Wave loads on offshorewind turbines
Feasibility study using results of waveexperiments executed by Electricité de
France (EDF)
J.M. Peeringa
April 2004

Wave loads on offshore wind turbines
AcknowledgementThe research described in this report is partly funded by Novem b.v., project number 2020-02-13-20-010 as part of the program ‘Duurzame Energie in Nederland’ of the Ministry ofEconomic Affairs.
The ECN contribution to this project is partly funded by the ECN ‘samenwerkingsfinanciering’program (project 7.4185).
Electicité de France (EDF) is thanked for providing ECN the results of the wave experiment.
Peter Eecen is thanked for checking the report.
AbstractElectricité de France (EDF) has performed an experimental study on the wave loading on acylindrical pile for offshore wind turbines in shallow water depths. A report with the results ofthe experimental study has been provided to ECN.
The aim of the feasibility study is to investigate whether the results of the wave experiment canbe used for further research and contribute to the implementation of 6000 MW in the DutchExclusive Economic Zone by the year 2020.
The study is divided in three parts:
• a literature survey
• a visit to the hydraulic laboratory
• an analysis of the experimental results
The results of the experimental study at EDF are analyzed. The conditions of the wave exper-iments are compared with conditions in the Dutch Exclusive Economic Zone and correspondwell. Wave breaking statistics in the southern North Sea are discussed. Breaking waves arenegligible for water depths greater than 20 m.
EDF also performed a numerical study on the wave loads. The wave loads are calculatedaccording to different wave theories using the Morison equation. EDF compared the measuredwave loads with the calculated wave loads. For non-breaking waves, which are expected inDutch offshore wind farms, the wave loads can be calculated using the stream function wavetheory. For breaking waves and post breaking waves the wave loads are underestimated usinglinear wave theory and stream function theory.
ii ECN-C–04-042

CONTENTS
NOTATIONS v
SUMMARY vii
1 INTRODUCTION 1
2 LITERATURE SURVEY 3
2.1 Introduction . . . . . . . . . . . . . . . . . . . . . . . . . . . . . . . . . . . .3
2.2 Wave flume . . . . . . . . . . . . . . . . . . . . . . . . . . . . . . . . . . . .3
2.3 Scaling . . . . . . . . . . . . . . . . . . . . . . . . . . . . . . . . . . . . . .4
2.4 Experimental set-up . . . . . . . . . . . . . . . . . . . . . . . . . . . . . . . .4
2.4.1 Wave height and wave kinematics . . . . . . . . . . . . . . . . . . . .5
2.4.2 Wave loads and structural dynamics . . . . . . . . . . . . . . . . . . .6
2.5 Analysis of test results . . . . . . . . . . . . . . . . . . . . . . . . . . . . . .6
3 VISIT WAVE EXPERIMENTS 9
3.1 Presentations . . . . . . . . . . . . . . . . . . . . . . . . . . . . . . . . . . .9
3.2 Demonstration of wave experiments . . . . . . . . . . . . . . . . . . . . . . .10
4 ANALYSIS OF WAVE EXPERIMENT AT EDF 13
4.1 Introduction . . . . . . . . . . . . . . . . . . . . . . . . . . . . . . . . . . . .13
4.2 Wave experiment at EDF . . . . . . . . . . . . . . . . . . . . . . . . . . . . .13
4.3 Environmental conditions of Dutch Exclusive Economic Zone . . . . . . . . .15
4.4 EDF wave experiments and future research . . . . . . . . . . . . . . . . . . .18
5 CONCLUSIONS AND RECOMMENDATIONS 21
REFERENCES 23
ECN-C–04-042 iii

Wave loads on offshore wind turbines
iv ECN-C–04-042

NOTATIONS
αi scale factor for different dimensions iCd drag coefficientCm inertia coefficientd water depth [m]D diameter [m]E modulus of elasticity (Young’s modulus) [N/m2]H wave height of regular wave [m]Hm0 significant wave height [m]I moment of inertia (second moment of area) [m4]F wave force [N ]Fr Froude numberg acceleration [m/s2]KC Keulegan Carpenter numberλ wave length [m]L length [m]ν kinematic viscosity [m2s]ρ density [kg/m3]t time [s]T wave period of regular wave [s]Tp wave peak period [s]Tm0 zero up crossing wave period [s]U fluid velocity [m/s]
ECN-C–04-042 v

vi ECN-C–04-042

SUMMARY
In North West Europe offshore wind energy is seen as an important source of renewable energy.The target of the Dutch government is to have 6000 MW of offshore wind turbines installed inthe Dutch Exclusive Economic Zone by the year 2020. Moving offshore means that the windturbine will experience additional loading due to waves, current or ice. Compared to otherfixed offshore structures wind turbines are more dynamic.
At this moment much research in ongoing on the hydrodynamic loading on a wind turbine andhow it should be calculated. Hydrodynamic knowledge is available from offshore engineeringfor the oil and gas industry and coastal engineering for shore protection. The offshore windturbine is located in water depth between deep water offshore and the shallow water depth ofthe coastal area. In this project, supported by Novem, the knowledge within ECN and EDF iscombined to adapt the hydrodynamic load model to offshore wind energy.
Electricité de France (EDF) has performed an experimental study of the wave loading on acylindrical pile. This pile is representative for offshore wind turbines in intermediate and shal-low water depths. A report [12] with the results of the experimental study has been sent toECN.
The aim of the feasibility study is to investigate whether the results of this wave experimentcan be used for further research and can contribute to the implementation of 6000 MW in theDutch Exclusive Economic Zone by the year 2020.
A literature survey was carried out to gain insight in the way wave experiments are performed.Emphasize was on experiments with wave loading on a cylinder. Literature has been usedabout the wave flume, scaling laws, the experimental set-up and the analysis of the results.
In April 2003 ECN visited EDF R&D National Hydraulics and Environment Laboratory. Vis-iting the hydraulic laboratory is the best way to see how the experiments are executed. Alsothe visual observations give additional information besides the time series and the report. Ademonstration of the wave experiments was given. The demonstration in the laboratory gave agood impression of the wave experiments.
The results of the experimental study at EDF are analyzed. The conditions of the wave exper-iments are compared with wave conditions in the Dutch part of the North Sea. Wave breakingstatistics in the southern North Sea are discussed. EDF also performed a numerical study on thewave loads. The wave loads are calculated according to different wave theories using Morisonequation. The calculated wave loads are compared with the measurements.
Based on the analysis of the wave experiments at EDF the following can be concluded:
• The wave conditions in the wave experiment correspond with the conditions in the DutchExclusive Economic Zone.
• Using the Morison equation and the stream function wave model an acceptable predic-tion of the wave loads can be made for non-breaking waves.
• For post-breaking and breaking waves the Morison equation and the stream functionwave underestimate the wave loads.
• For the water depths considered in the wave experiment the linear regular Airy wave isinsufficient.
• Wave breaking due to shallow water in the southern North Sea is negligible for waterdepth greater than 20 m. For the typical wave climate in this region most wave breakingtakes place in depths less than 10 m.
ECN-C–04-042 vii

Wave loads on offshore wind turbines
• ECN uses the stream function wave together with the Morison equation for extreme waveconditions (Eecen [4]). For wind farms in the Dutch Exclusive Economic Zone with awater depth of about 20 m this is justified.
• For impact loads due to breaking waves more advanced models are available like theBoussinesq wave model (Madsen [13]) and the wave impact load model of Wienke [19].
The data of the experiment is already used by EDF for comparison between the measured andcalculated wave loads. No further analysis of the data is recommended.
In case new wave experiments are considered, other subjects are recommended for investiga-tion, for instance:
• elastic modeling of the wind turbine support structure
• random (non-linear) waves
• wave-current interaction
viii ECN-C–04-042

1 INTRODUCTION
In North West Europe offshore wind energy is seen as an important source of renewable energy.The target of the Dutch government is to have 6000 MW of offshore wind turbines installed inthe Dutch Exclusive Economic Zone by the year 2020. The offshore wind turbine is a dynamicsystem influenced by the hydrodynamic loading of waves and current.
At the moment much research is ongoing on the hydrodynamic loading on a wind turbine andhow it should be calculated is a research topic. Hydrodynamic knowledge is available fromoffshore engineering for the oil and gas industry and coastal engineering for shore protection.The offshore wind turbine is located in water depth between deep water offshore and the shal-low water depth of the coastal area. In this project, supported by Novem, the knowledge withinECN and EDF is combined to adapt the hydrodynamic load model to offshore wind energy.
Electricité de France (EDF) has performed an experimental study of the wave loading on acylindrical pile. This pile is representative for offshore wind turbines in intermediate and shal-low water depths. A report [12] with the results of the experimental study has been sent toECN.
The aim of the feasibility study is to investigate whether the results of this wave experimentcan be used for further research and can contribute to the implementation of 6000 MW in theDutch Exclusive Economic Zone by the year 2020.
First a literature survey was carried out to gain insight in the way wave experiments are per-formed. Emphasize was on experiments with wave loading on a cylinder. The survey is pre-sented in chapter 2.
In April 2003 ECN visited EDF R&D National Hydraulics and Environment Laboratory. Ademonstration of the wave experiments was given. The demonstration in the laboratory gave agood impression of the wave experiments. The travel report is included in chapter 3.
In chapter 4 the results of the experimental study at EDF are analyzed. The conditions of thewave experiments are compared with wave conditions in the Dutch part of the North Sea. Wavebreaking statistics in the southern North Sea are discussed. EDF also performed a numericalstudy on the wave loads. The wave loads are calculated according to different wave theoriesusing Morison equation. The calculated wave loads are compared with the measurements.
Conclusions and recommendations are given in chapter 5.
ECN-C–04-042 1

2 ECN-C–04-042

2 LITERATURE SURVEY
2.1 Introduction
A literature survey about wave experiments has been carried out. First the wave flume will bedescribed. In a wave experiment the full scale situation is modeled. Scaling laws are appliedin order to have similarity in behaviour of the full scale prototype and the physical model. Thescaling laws will be discussed. The design of the test set-up depends on the issues to be studiedwith the wave experiment. In this case focus is on wave loads on cylinders. Finally the waythe results of the experiments are analyzed is discussed.
2.2 Wave flume
In hydraulic laboratories it is possible to investigate waves and wave load characteristics incontrolled conditions. The wave experiments are executed in wave flumes. A wave flume isan elongated rectangular basin. The wave maker is on one side and a beach is on the otherside to absorb the wave energy, see figure 1. A general description of a wave flume and waveexperiments can be found in reference books like Sorensen [17].
wave maker� -
wave direction-
cylinder@@R
absorption beach@@R
Figure 1: General set-up of wave flume
In a wave flume regular, bi chromatic and random wave can be generated. There are differentwave makers available. Most wave makers consist of a hydraulic device which drives thepiston and the wave flap. The wave flap displaces the water. The vertical wave flap can bemove forwards and backwards in horizontal direction and generate waves. Another possibilityis to connect the wave flap to the bottom of the flume with a hinge. The piston rotates the waveflap around the hinge. Also combinations of the two are possible, see figure 2.
piston flap
Figure 2: Different types of wave generators
To avoid reflection of the waves in the wave flume the waves are absorbed on a beach at theend of the wave flume. The beach has a flat slope of pea gravel. Another way is to detect thereflection and compensate the reflected wave using the wave maker.
ECN-C–04-042 3
Wave loads on offshore wind turbines
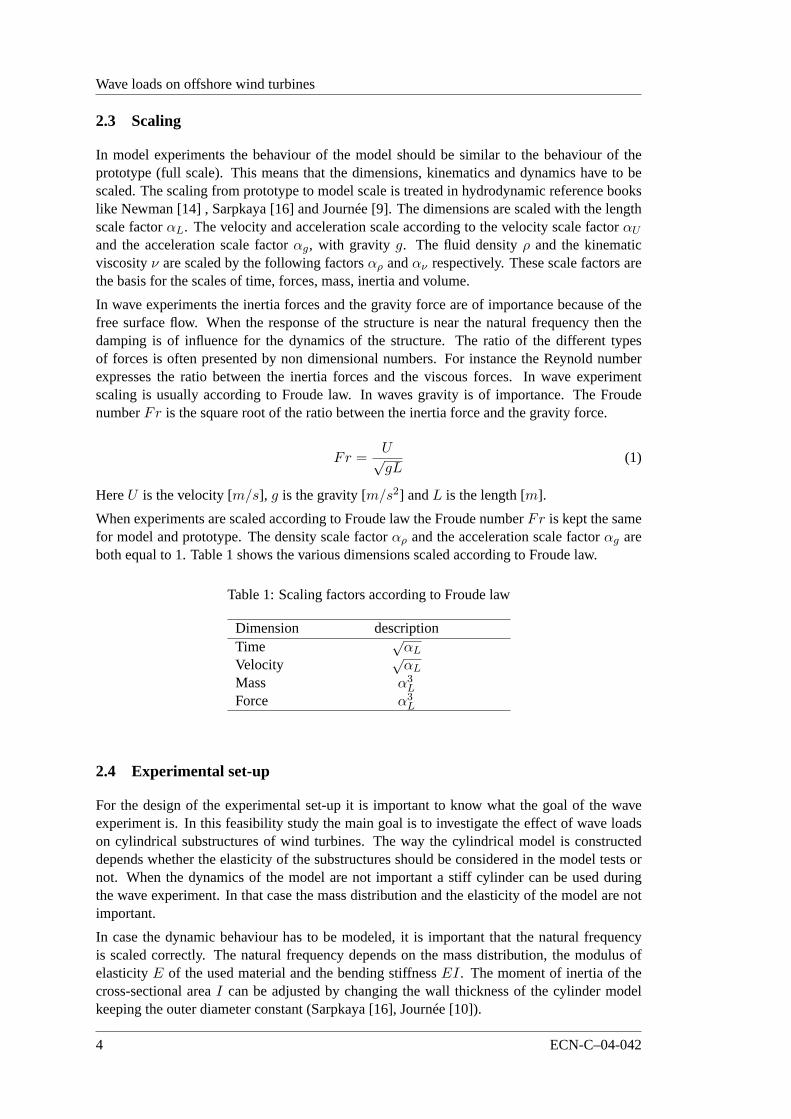
2.3 Scaling
In model experiments the behaviour of the model should be similar to the behaviour of theprototype (full scale). This means that the dimensions, kinematics and dynamics have to bescaled. The scaling from prototype to model scale is treated in hydrodynamic reference bookslike Newman [14] , Sarpkaya [16] and Journée [9]. The dimensions are scaled with the lengthscale factorαL. The velocity and acceleration scale according to the velocity scale factorαU
and the acceleration scale factorαg, with gravity g. The fluid densityρ and the kinematicviscosityν are scaled by the following factorsαρ andαν respectively. These scale factors arethe basis for the scales of time, forces, mass, inertia and volume.
In wave experiments the inertia forces and the gravity force are of importance because of thefree surface flow. When the response of the structure is near the natural frequency then thedamping is of influence for the dynamics of the structure. The ratio of the different typesof forces is often presented by non dimensional numbers. For instance the Reynold numberexpresses the ratio between the inertia forces and the viscous forces. In wave experimentscaling is usually according to Froude law. In waves gravity is of importance. The FroudenumberFr is the square root of the ratio between the inertia force and the gravity force.
Fr =U√gL
(1)
HereU is the velocity [m/s], g is the gravity [m/s2] andL is the length [m].
When experiments are scaled according to Froude law the Froude numberFr is kept the samefor model and prototype. The density scale factorαρ and the acceleration scale factorαg areboth equal to 1. Table 1 shows the various dimensions scaled according to Froude law.
Table 1: Scaling factors according to Froude law
Dimension descriptionTime
√αL
Velocity√
αL
Mass α3L
Force α3L
2.4 Experimental set-up
For the design of the experimental set-up it is important to know what the goal of the waveexperiment is. In this feasibility study the main goal is to investigate the effect of wave loadson cylindrical substructures of wind turbines. The way the cylindrical model is constructeddepends whether the elasticity of the substructures should be considered in the model tests ornot. When the dynamics of the model are not important a stiff cylinder can be used duringthe wave experiment. In that case the mass distribution and the elasticity of the model are notimportant.
In case the dynamic behaviour has to be modeled, it is important that the natural frequencyis scaled correctly. The natural frequency depends on the mass distribution, the modulus ofelasticityE of the used material and the bending stiffnessEI. The moment of inertia of thecross-sectional areaI can be adjusted by changing the wall thickness of the cylinder modelkeeping the outer diameter constant (Sarpkaya [16], Journée [10]).
4 ECN-C–04-042

2 LITERATURE SURVEY
During the wave experiment certain types of behaviour are investigated. Therefore measure-ments have to be performed. Not only the signals from the measurement devices are of interestalso visual observations can be useful for the interpretation of certain behaviour, for instancewave run-up and breaking waves at the location of the cylinder.
For wave experiments where the waves and the wave loads on a vertical cylinder are subject ofinvestigation, often the following characteristics can be measured:
• wave height
• wave kinematics
• wave loads on cylinder
• displacements and acceleration of elastic cylinder
2.4.1 Wave height and wave kinematics
The wave height, rapid changes in water levels, are measured with so called wave probes. Awave probe consists of a pair of stainless steel wires. When the wave prove is submerged acurrent will flow between the probe wires. The current is proportional to the depth of immer-sion. One or more wave probes are located in front of the cylinder in order to measure theundisturbed wave profile. Also a wave probe is located next to the cylinder, so the wave heightat the cylinder can be measured.
To validate wave theories and investigate phase differences between the wave loads and wavekinematics it is necessary to measure the velocity of the water particles. In literature there aredifferent measuring devices found to measure the velocity of the water particles.
• Laser Doppler velocity meter (Vugts [18])
• Acoustic Doppler velocity (Kriebel [11])
• Electromagnetic flow meters (Davies [1])
• Particle Image Velocity (PIV) (Jensen [8])
For the use of the Laser Doppler and Acoustic Doppler velocity meter seeding particles areadded to the water of the wave flume. Light or sound are transmitted to the flow. The reflectionof the light or sound by the seeding particles is received. Next the velocity of the water particlescan be determined from the Doppler shift.
When the electromagnetic flow meter is used, the velocity of the flow is measured by generatinga magnetic field in the the fluid. The voltage developed across the electrodes by the magneticfield is measured. The voltage is proportional to the velocity of the fluid.
Another method to measure the velocity in a fluid is the Particle Image Velocity (PIV) method.Again particles are added to the fluid. A target area in the fluid is illuminated twice with aknown time step. At each light pulse an image of the particles in the target area is made. Bycomparing two successive images the displacement of each particle can be determined. Withthe known time step this means that the velocity is known.
ECN-C–04-042 5

Wave loads on offshore wind turbines
2.4.2 Wave loads and structural dynamics
The wave loads on the vertical cylinder are measured with force transducers. Force transducersare based on strain-gauge measurement of shear forces and bending moments. For a verticalcylinder this means that inside the cylinder there is a frame with the force transducers. Thisinner frame is connected to the wave flume. The outer cylinder is fixed to the inner frame. Thewave loads on the outer cylinder are now transfered to the inner frame. In figure 3 a possibleconstruction is given. See also Huseby [7]
force transducer������
force transducerHHHHHY
Figure 3: Test set-up of vertical cylinder
When the model is elastic and the structural dynamics is of importance the displacements of thevertical cylinder can be measured by mounting accelerometers on the cylinder. Gründlehner [6]used soft spring displacement gauges to measure the horizontal displacement of a jack-up.
2.5 Analysis of test results
Keeping the goal of the wave experiments in mind the results of the model tests are analyzed.In case of a wind turbine substructure modeled by a vertical cylinder the (breaking) wave andthe corresponding wave load are of interest. By visual observation it is possible to identifywhether the wave is post-breaking, breaking or non-breaking. By analyzing the signals of thewave elevation and the wave kinematics it is possible to find the wave theory which modelsthe wave the best. This wave model can be used as input for the numerical wave load model to
6 ECN-C–04-042

2 LITERATURE SURVEY
compare the calculated and measured wave loads.
A vertical cylinder representing a wind turbine substructure can be considered to be a slenderstructure for the waves that are investigated. The definition of a slender cylinder is a cylinderwith a diameterD relatively small compared to the wave lengthλ. Thediffraction parameterD/λ for a slender cylinder has a value less then 0.2 (Sarpkaya [16]). In offshore practice thewave loads on a slender body are approximated using Morison’s equation. In equation 2F isthe force per unit length experienced by the cylinder. In the Morison’s equation the wave forceconsists of a part due to the drag and an inertia part. In the equation this is expressed by theintroduction of a drag coefficientCd and an inertia coefficientCm.
F =12Cd|U |U + Cmρ
πD2
4dU
dt(2)
WhereU is the undisturbed fluid velocity,dUdt the acceleration of the fluid,ρ the water density
andD the diameter of the cylinder.
The results of the wave experiment can be used for verification of numerical wave load modelsor for an estimation of the drag and inertia coefficient in Morison’s equation. Differences be-tween the results of the wave experiment are caused by the differences in the wave kinematics,the Morison equation and the damping in the case of a dynamic structure. In Gründlehner [6]first the measured wave kinematics are compared with kinematics of different wave models.The wave kinematics are measured at the location of the jack-up, but without the jack-up in themodel basin. This gives the undisturbed wave kinematics as input for the Morison equation.After a proper wave theory has been selected the wave loads can be calculated and comparedwith the wave load measurements. The drag and inertia coefficients are selected for instancebased on offshore standards, literature or wave experiments. When structural dynamics are in-cluded in the wave experiment, then the damping is of real importance to have the same loadsmeasured and calculated. A good estimate of the total damping is vital. The total dampingconsist of damping by wave radiation, viscous fluid damping, structural damping.
To estimate the drag and inertia coefficient in equation 2 measurements of the water particlevelocity and acceleration should be available. In text books like Sarpkaya [16], Journée [9] andDean [3] many methods are given all resulting in differentCd andCm values. It is impossibleto determine exact values for the coefficients. A tolerance of several percents is the best onecan expect (Journée [9]). In Dean [3] two methods for determining drag and inertia coefficientsare mentioned. The problem is that Morison’s equation is one equation withCd andCm as twounknown parameters.
The first method is to solve Morison’s equation when the velocity or the acceleration of thefluid is zero. In case the velocity is zero the inertia coefficientCm can be determined. Whenthe acceleration is zero the drag coefficientCd can be estimated. Disadvantage of the methodis that only small a amount of the available data is used. Also the method is sensitive to errorsin the velocity resulting in a significant phase shift (Journée [9]). The second method is basedon the least square method. Here the mean squared errorε2 between the measured and thecomputed forces is minimized with respect to the unknownCd andCm. The computed andmeasured force data is divided in groups with approximately the same Reynolds number inorder to account for the Reynolds dependency.
ECN-C–04-042 7

8 ECN-C–04-042

3 VISIT WAVE EXPERIMENTS
On April the 28th 2003 Leo Machielse and Johan Peeringa visited EDF R&D at Paris (Chatou).Aim of the visit was to get an impression of the facility and the way the experiments areexecuted.
The morning program was split in two parts. In the first part EDF gave two presentations.Next there was a visit to the wave flume, where a demonstration of the wave experiments waspresented.
3.1 Presentations
The subject of the first presentation was wave modeling at EDF and the wave experiment.Marilyne Luck gave the presentation. First the different flow regimes and the validity of theMorison equation are discussed. When the Morison equation is applied the wave kinematicsand the hydrodynamic coefficientsCd andCm are of importance. Note that the coherencebetween the hydrodynamics and wave kinematics should be respected. Different modelingstrategies are discussed depending on the level of wave information and on the level of bottominformation.
Two wave models are presented. First there is the wave description based on the stream func-tion method (Dean [2]). This wave theory is applied for flat bottoms and without wave break-ing. When there is a sloping bottom and wave breaking occurs another wave model is used,based on the non-linear Boussinesq equation, with surf-breaking dissipation included for thespilling case.
Two approaches are given to include the impact load due to breaking in the design:
• Addition of a term in the Morison equation
• Usual use of Morison equation, but using the ’exact’ wave kinematics in the breakingzone
Further research perspectives according to EDF are:
1. Shallow water effects
• Asymmetry of waves (elevation, velocity, . . . )
• Breaking waves (impact forces, . . . )
• Wave-current interaction
• Scouring risks (bottom protections, . . . )
2. Improvement/modification of existing models
• Extension of Morison approach
• Hydrodynamics: non-linear wave modeling
• Experimental data on hydrodynamic coefficients
3. Validation on experimental studies
ECN-C–04-042 9

Wave loads on offshore wind turbines
Non-linear waves, breaking waves and wave load calculations receive a lot of attention in theoffshore wind research community. At the moment scour seems to be a cost issue. Shouldscour protection be applied or not? The decision to apply scour protection or not should beaccounted for in the design of the wind turbine. Wave-current interaction is not a research issuein the offshore wind, but should be considered in the design. See the paper of Peters [15] aboutthe fatigue loading on the Europlatform approximately 60 km offshore Hoek van Holland, atthe entrance of the Rotterdam harbour channel, in 32 m water depth. The occurrence of tidalcurrent simultaneously with sea waves has a significant influence on the fatigue life of theplatform.
The second presentation was about load calculations. Clément Buvat gave the presentation.EDF has done some load calculations on a wind turbine with a lattice support structure. Thenon-linear waves were modeled using the program Streamfm. The program Streamfm uses thestream function wave model. The finite element model of the lattice tower was modeled inEDF’s open-source code Aster. For the turbine a simple aerodynamic model was used.
3.2 Demonstration of wave experiments
The objective of the experiments is to study wave loading on offshore piles in shallow water(10-20 m). Both non-breaking and breaking cases will be studied. In the first test program forregular waves the following parameters will be changed:
• bottom slope (2)
• water depth at pile location (4)
• wave periods (3)
• wave heights (4)
The values of the parameters are presented in paragraph 4.2.
The dimensions of the flume tank are LxBxH = 72 x 1.5 x 1.2 m. In the wave flume a currentand a wave can be generated. A wave maker of the piston type generates the waves. Bycirculating the water in one of the directions a current can be generated.
For the model tests a scale of 1/25 is used. The scaling is done according Froude law. Thediameter of the cylinder now corresponds to a real diameter of 5 m, which is typical for offshorefoundations of wind turbines. At the location of the cylinder the bottom of the wave flume hasa slope. In the test set-up the cylinder consists of an inner cylinder, which is attached to thetop and the bottom. The outer cylinder is connected to the inner cylinder by force transducersat the rear with respect to the wave direction. The outer cylinder is free at the top and at thebottom (2 mm ).
Wave probes measure the wave profile and the wave run-up at the cylinder. For the waveelevation at the cylinder a wave probe is attached at the front of the cylinder. To measure thewave profile (asymmetric form of the crest) several wave probes are located along the slopeand the wave flume.
A demonstration of the wave experiment was arranged for the visit to the wave flume. Theconditions of these experiments were as follows (regular waves):
• sloping bottom of 5 degree,
10 ECN-C–04-042

3 VISIT WAVE EXPERIMENTS
Figure 4: Test set-up (source: EDF presentation by Marilyne Luck)
• water depth of 15 m at the location of the cylinder (= 60 cm on model scale) and 25 moffshore,
• wave periods of 9 s and 12 s (corresponding to 1.8 s and 2.4 s on model scale),
• offshore wave heights from 5 to 10 m (corresponding to 20 to 40 cm on model scale).
ECN-C–04-042 11

12 ECN-C–04-042

4 ANALYSIS OF WAVE EXPERIMENT AT EDF
4.1 Introduction
In this section the results of the wave experiment at EDF are analyzed. Aim of the feasibil-ity study is to investigate whether the results of the wave experiment can be used for furtherresearch and contribute to the implementation of 6000 MW in the Dutch Exclusive EconomicZone by the year 2020.
First the wave experiments are discussed. For the sea defense works of the Netherlands thereis monitoring network on the Dutch part of the North Sea. The conditions during the waveexperiments are compared with the environmental conditions at the survey location IJmuidenmunitiestortplaats. The survey location IJmuiden munitiestortplaats is one of the locations inthe monitoring network. The position of IJmuiden munitiestortplaats is near the planned Dutchoffshore wind farms Q7 and the Near shore Windpark (NSW).
Finally the results of the wave experiments and the relation with the Dutch situation is dis-cussed.
4.2 Wave experiment at EDF
In this section the test set-up used by EDF is described briefly. The National Hydraulic andEnvironment Laboratory (LNHE) has a wave flume with the following dimensions:
Length 72 mWidth 1.5 mDepth 1.5 m
With the wave maker of the piston type both regular and random waves can be generated. Thewave maker is computer controlled and has an active wave absorption system. In the flume atthe opposite site of the wave maker there is a wave absorption beach. Tests are performed fortwo bottom slopes120 (5 %) and 1
40 (2.5 %). The bottom slopes are made of concrete.
Wave loads are measured on a stiff cylinder. The cylinder is located on the sloped bottom0.40 m above the flat bottom. The horizontal forces and overturning moments on the cylinderare measured on the cylinder with two force-sensors. The free surface elevation is measuredusing wave probes. Wave probes are located along the wave flume. There are 3 probes in theoffshore part to determine the incident wave, 7 probes along the slope and 1 on the cylinder.Visual observations are used to locate the position of the breaking point of the wave.
In Luck [12] the numerical values of the wave conditions are presented by the parameters ofthe incoming offshore waves. Information about the waves properties near the cylinder areshown in the figures. In table 2 the wave conditions at the cylinder are given for the varioustest conditions. The ranges are an estimation derived from the figures. For one test conditionthe water depth at the cylinder was 5 m. The wave conditions at the cylinder for this waterdepth are not presented in the figures.
During the experiment regular waves are generated. Due to the bottom slope the waves aretransformed. Before the test results are analyzed the mean free surface elevation signals andthe mean force signals are generated. Individual waves are identified by a zero up crossingmethod. Five consecutive waves are used to generate the mean wave and the associated meanforce. The results in the EDF report are based on the mean signals over five waves.
The wave force regime is determined. In Sarpkaya [16] the wave force regime is characterizedby a so called diffraction parameter and the Keulegan Carpenter (KC) number. The body size
ECN-C–04-042 13
Wave loads on offshore wind turbines
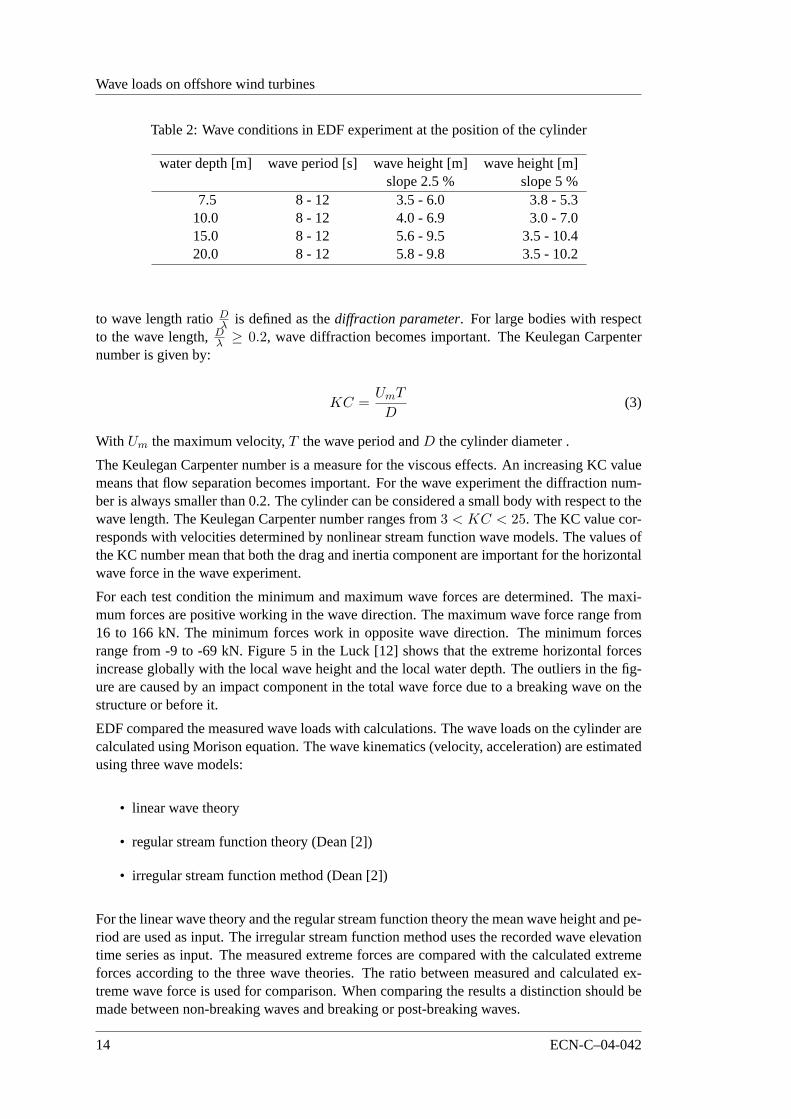
Table 2: Wave conditions in EDF experiment at the position of the cylinder
water depth [m] wave period [s] wave height [m] wave height [m]slope 2.5 % slope 5 %
7.5 8 - 12 3.5 - 6.0 3.8 - 5.310.0 8 - 12 4.0 - 6.9 3.0 - 7.015.0 8 - 12 5.6 - 9.5 3.5 - 10.420.0 8 - 12 5.8 - 9.8 3.5 - 10.2
to wave length ratioDλ is defined as thediffraction parameter. For large bodies with respectto the wave length,Dλ ≥ 0.2, wave diffraction becomes important. The Keulegan Carpenternumber is given by:
KC =UmT
D(3)
With Um the maximum velocity,T the wave period andD the cylinder diameter .
The Keulegan Carpenter number is a measure for the viscous effects. An increasing KC valuemeans that flow separation becomes important. For the wave experiment the diffraction num-ber is always smaller than 0.2. The cylinder can be considered a small body with respect to thewave length. The Keulegan Carpenter number ranges from3 < KC < 25. The KC value cor-responds with velocities determined by nonlinear stream function wave models. The values ofthe KC number mean that both the drag and inertia component are important for the horizontalwave force in the wave experiment.
For each test condition the minimum and maximum wave forces are determined. The maxi-mum forces are positive working in the wave direction. The maximum wave force range from16 to 166 kN. The minimum forces work in opposite wave direction. The minimum forcesrange from -9 to -69 kN. Figure 5 in the Luck [12] shows that the extreme horizontal forcesincrease globally with the local wave height and the local water depth. The outliers in the fig-ure are caused by an impact component in the total wave force due to a breaking wave on thestructure or before it.
EDF compared the measured wave loads with calculations. The wave loads on the cylinder arecalculated using Morison equation. The wave kinematics (velocity, acceleration) are estimatedusing three wave models:
• linear wave theory
• regular stream function theory (Dean [2])
• irregular stream function method (Dean [2])
For the linear wave theory and the regular stream function theory the mean wave height and pe-riod are used as input. The irregular stream function method uses the recorded wave elevationtime series as input. The measured extreme forces are compared with the calculated extremeforces according to the three wave theories. The ratio between measured and calculated ex-treme wave force is used for comparison. When comparing the results a distinction should bemade between non-breaking waves and breaking or post-breaking waves.
14 ECN-C–04-042
4 ANALYSIS OF WAVE EXPERIMENT AT EDF
For non-breaking waves the ratio between measured and calculated extreme wave force for thetwo stream function methods ranges from 0.8 to 1.3. For linear wave theory the values of theratio are general between 1 and 1.5, but can reach the value of 2.
For breaking and post-breaking waves the difference between measured and calculated waveforces is large. The linear wave theory gives a maximum ratio of 4. The stream functionmethod gives a maximum ratio of 2.35. For the irregular stream function method the ratio hasvalues between 0.75 and 2.
In the case of non-breaking waves the EDF report concludes, that for the water depths and waveconditions in the wave experiment acceptable estimate of the wave forces are found using theMorison equation together with the stream function. However for breaking and post-breakingwaves the applied methods underestimate the hydrodynamic forces. Applying linear wavetheory the measured wave forces can be four times higher than the model predicts. In case ofthe stream function method the measured forces can be 2.35 times higher.
When the location of the wind farm is in an area where breaking waves are expected othermodels should be used to calculate the breaking wave load. This means that an other wavetheory or load model should be selected. Wienke [19] has performed research on the breakingwave impact on slender cylindrical piles. In his study a theoretical model was developed andcompared with results of wave experiments.
EDF applied Morison equation for the wave load calculation and focused on the wave models.For the regular and irregular stream function method the calculated wave force profiles arecompared with the measured wave force profiles. Since the irregular stream function usesthe wave profile as an input the wave force profile corresponds better with the measurementthan the results with the regular stream function method. The regular stream function methodshows poor results for the wave height to water depth ratioH
d > 0.4. This is the range wherebreaking and post breaking occur. The better results of the irregular stream function methodimply that the asymmetry of the wave is important. Therefore it is suggested to model the wavetransformation due to the bottom slope by a Boussinesq wave. In research there is renewedinterest in this Boussinesq wave (Madsen [13]) and its application is discussed in the offshorewind community.
4.3 Environmental conditions of Dutch Exclusive Economic Zone
For comparison of the conditions of wave experiment the environmental conditions for futurewind farms in the Dutch Exclusive Economic Zone should be known. In particular for thewave experiments it is necessary to know something about the seabed slope, the water depth,extreme wave conditions and the occurrence of breaking waves.
As can be seen in Figure 5 most of the area of the Dutch Exclusive Economic Zone has 20-40m water depth. The bathymetry consists of sand banks and sand waves. The length of a sandwave is 100-800 m and the height about 5 m. Therefore a seabed slope can be expected in awind farm. It should be noted that future wind farms are only allowed outside the 12 mile zone.See the red line in Figure 5. This means that most of the offshore wind farms will be in waterdepths greater than 15 m.
For the sea defense works of the Netherlands there is monitoring network on the Dutch partof the North Sea. The network consists of nine survey locations. See figure 6. At the surveylocations the environmental conditions like wind speed, current, water level, wave height andwave period and directions are monitored for 20 to 30 years now. The data of the measurementsand the results of the analysis of the data are available to the public (www.golfklimaat.nl). Thedata is provided by the National Institute of Coastal and Marine Management (RIKZ). Now for
ECN-C–04-042 15

Wave loads on offshore wind turbines
Figure 5: Water depth in the Dutch exclusive economic zone
some survey locations at the North Sea the scatter diagram can be generated and the extremesignificant wave heights are estimated.
At the moment there are two offshore wind farm projects planned in the Dutch Economic Ex-clusive Zone. The water depth in the wind farms is about 20 m. The offshore wind turbines
16 ECN-C–04-042

4 ANALYSIS OF WAVE EXPERIMENT AT EDF
Figure 6: Survey locations of monitoring network RIKZ (source: RIKZ www.golfklimaat.nl)
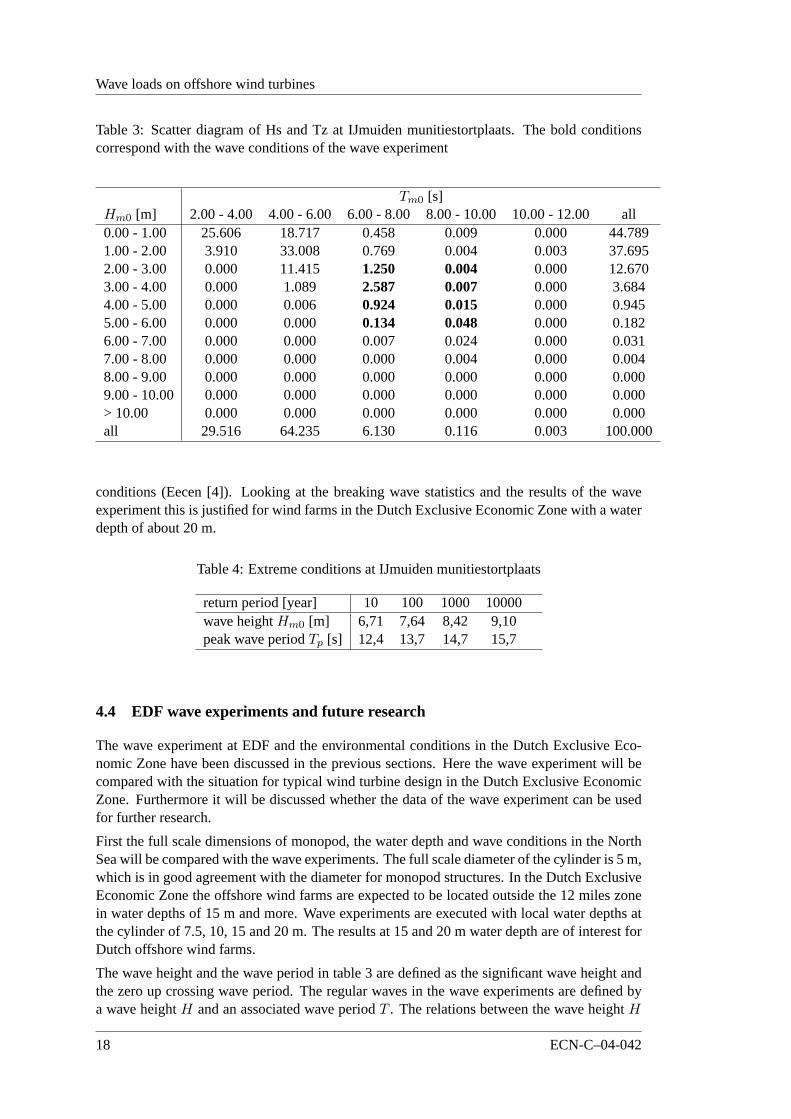
constructed at the moment have a substructure of the monopod type. The diameter of thesemonopods will be about 4-6 m. The survey location IJmuiden munitiestortplaats is selected forcomparison of the dutch offshore environmental conditions with the wave experiment condi-tions. The IJmuiden munitiestortplaats is a survey location near Q7 wind farm and the NearShore Wind farm (NSW). The scatter diagram of the significant wave height and zero up cross-ing period is given in table 3.
For five locations the extreme significant wave heightHm0 and the extreme peak wave periodTp are estimated. The results are based on measurements over the period 1979 - 1993. Intable 4 the extreme significant wave height and the corresponding peak wave period are givenfor IJmuiden munitiestortplaats for different return periods.
During the wave experiment breaking waves are observed. For offshore wind farm design it isinteresting to know how often breaking waves occur in the Dutch Exclusive Economic Zone.Ewing [5] presents statistics of wave breaking in the southern North Sea. The statistics arebased on wave measurements, hindcast data and visual observation. The main conclusion inthe report is:
Wave breaking due to shallow water in the southern North Sea is negligible for water depthgreater than 20 m. For the typical wave climate in this region most wave breaking takes placein depths less than 10 m.
ECN uses the stream function wave together with the Morison equation for extreme wave
ECN-C–04-042 17
Wave loads on offshore wind turbines
Table 3: Scatter diagram of Hs and Tz at IJmuiden munitiestortplaats. The bold conditionscorrespond with the wave conditions of the wave experiment
Tm0 [s]Hm0 [m] 2.00 - 4.00 4.00 - 6.00 6.00 - 8.00 8.00 - 10.00 10.00 - 12.00 all0.00 - 1.00 25.606 18.717 0.458 0.009 0.000 44.7891.00 - 2.00 3.910 33.008 0.769 0.004 0.003 37.6952.00 - 3.00 0.000 11.415 1.250 0.004 0.000 12.6703.00 - 4.00 0.000 1.089 2.587 0.007 0.000 3.6844.00 - 5.00 0.000 0.006 0.924 0.015 0.000 0.9455.00 - 6.00 0.000 0.000 0.134 0.048 0.000 0.1826.00 - 7.00 0.000 0.000 0.007 0.024 0.000 0.0317.00 - 8.00 0.000 0.000 0.000 0.004 0.000 0.0048.00 - 9.00 0.000 0.000 0.000 0.000 0.000 0.0009.00 - 10.00 0.000 0.000 0.000 0.000 0.000 0.000> 10.00 0.000 0.000 0.000 0.000 0.000 0.000all 29.516 64.235 6.130 0.116 0.003 100.000
conditions (Eecen [4]). Looking at the breaking wave statistics and the results of the waveexperiment this is justified for wind farms in the Dutch Exclusive Economic Zone with a waterdepth of about 20 m.
Table 4: Extreme conditions at IJmuiden munitiestortplaats
return period [year] 10 100 1000 10000wave heightHm0 [m] 6,71 7,64 8,42 9,10peak wave periodTp [s] 12,4 13,7 14,7 15,7
4.4 EDF wave experiments and future research
The wave experiment at EDF and the environmental conditions in the Dutch Exclusive Eco-nomic Zone have been discussed in the previous sections. Here the wave experiment will becompared with the situation for typical wind turbine design in the Dutch Exclusive EconomicZone. Furthermore it will be discussed whether the data of the wave experiment can be usedfor further research.
First the full scale dimensions of monopod, the water depth and wave conditions in the NorthSea will be compared with the wave experiments. The full scale diameter of the cylinder is 5 m,which is in good agreement with the diameter for monopod structures. In the Dutch ExclusiveEconomic Zone the offshore wind farms are expected to be located outside the 12 miles zonein water depths of 15 m and more. Wave experiments are executed with local water depths atthe cylinder of 7.5, 10, 15 and 20 m. The results at 15 and 20 m water depth are of interest forDutch offshore wind farms.
The wave height and the wave period in table 3 are defined as the significant wave height andthe zero up crossing wave period. The regular waves in the wave experiments are defined bya wave heightH and an associated wave periodT . The relations between the wave heightH
18 ECN-C–04-042

4 ANALYSIS OF WAVE EXPERIMENT AT EDF
and the significant wave heightHm0 and the associated wave periodT and the peak periodTp
is given in equation 4
H ≈ 1.8 Hm0
T = Tp ≈ 1.4 Tm0 (4)
Comparing the wave experiment conditions in table 2 with the conditions at IJmuiden mu-nitiestorplaats in table 3 and table 4 shows that about 5% of the scatterdiagram in table 3corresponds with the wave experiments conditions. The corresponding wave conditions areshown bold in table 3. It can be concluded that the conditions of the experiment correspondwith the conditions in the Dutch Exclusive Economic Zone.
EDF compared the experimental wave loads with numerical wave load models. A next stepcould be a wave load calculation using a Boussinesq wave model. To study the load impact ofa breaking wave it is necessary to have information about the wave kinematics, which are notmeasured during the wave experiment.
The results are summarized below.
• The wave conditions in the wave experiment correspond with the conditions in the DutchExclusive Economic Zone.
• Using the Morison equation and the stream function wave model an acceptable predic-tion of the wave loads can be made for non-breaking waves.
• For post-breaking and breaking waves the Morison equation and the stream functionwave underestimate the wave loads.
• For the water depths considered in the wave experiment the linear regular Airy wave isinsufficient.
• Wave breaking due to shallow water in the southern North Sea is negligible for waterdepth greater than 20 m. For the typical wave climate in this region most wave breakingtakes place in depths less than 10 m.
• ECN uses the stream function wave together with the Morison equation for extreme waveconditions (Eecen [4]). For wind farms in the Dutch Exclusive Economic Zone with awater depth of about 20 m this is justified.
• For impact loads due to breaking waves more advanced models are available like theBoussinesq wave model (Madsen [13]) and the wave impact load model of Wienke [19].
• The data of the experiment is already used by EDF for comparison between the measuredand calculated wave loads. No further analysis of the data is recommended.
ECN-C–04-042 19

20 ECN-C–04-042

5 CONCLUSIONS AND RECOMMENDATIONS
A feasibility study has been performed to see whether the results of the wave experiments atEDF can be used for further research and whether the results contribute to the Dutch target of6000 MW by the year 2020. The conditions of the wave experiment are compared with theconditions in the Dutch Exclusive Economic Zone. For water depth greater than 15 m there isgood agreement. It is expected that Dutch offshore wind farms will be constructed 12 miles ormore offshore. Here the water depth is 15 m or greater.
In the wave experiment report measured wave loads are compared with calculated wave loadsusing Morison equation. The conditions of the wave experiment are compared with the waveconditions in the Dutch part of the North Sea. The statistics of wave breaking in the southernNorth Sea is used. Based on this the following can be concluded:
• The wave conditions in the wave experiment correspond with the conditions in the DutchExclusive Economic Zone.
• Using the Morison equation and the stream function wave model an acceptable predic-tion of the wave loads can be made for non-breaking waves.
• For post-breaking and breaking waves the Morison equation and the stream functionwave underestimate the wave loads.
• For the water depths considered in the wave experiment the linear regular Airy wave isinsufficient.
• Wave breaking due to shallow water in the southern North Sea is negligible for waterdepth greater than 20 m. For the typical wave climate in this region most wave breakingtakes place in depths less than 10 m.
• ECN uses the stream function wave together with the Morison equation for extreme waveconditions (Eecen [4]). For wind farms in the Dutch Exclusive Economic Zone with awater depth of about 20 m this is justified.
• For impact loads due to breaking waves more advanced models are available like theBoussinesq wave model (Madsen [13]) and the wave impact load model of Wienke [19].
The data of the experiment is already used by EDF for comparison between the measured andcalculated wave loads. No further analysis of the data is recommended.
In case new wave experiments are considered, other subjects are recommended for investiga-tion, for instance:
• elastic modeling of the wind turbine support structure
• random (non-linear) waves
• wave-current interaction
The three subjects are discussed briefly below.
An offshore wind turbine is a dynamic system excitated by stochastic wind and waves. Thedynamics are more important than for other offshore structures. To include the dynamics ofthe structure in the wave experiment it may be interesting to model an elastic cylinder.
ECN-C–04-042 21

Wave loads on offshore wind turbines
Due to the dynamic behaviour of an offshore wind turbine the loading is best described usingrandom waves. However for shallow water and extreme wave conditions non-linearities in thewaves become more important. Wave experiments using random waves can be used to studywhich wave theory is best to model the extreme wave load on a wind turbine in relative shallowwater. Is it the regular wave, the linear random wave or the non linear random wave?
The effect of combined action of waves and currents on the fatigue life of a monopod in theDutch part of the North Sea is described by Peters [15]. The tidal currents change the encounterfrequency of the waves, the wave spectrum and the shape of the wave. Since the naturalfrequency of the wind turbine is in the region of wave spectrum the loading is sensitive toa shift of wave frequency by a current. The effect of combined waves and currents on thedynamics of a wind turbine should be studied.
22 ECN-C–04-042

REFERENCES
[1] Davies, M.J.S. Wave loading data from fixed vertical cylinders. Technical Report OTI92558, Health & Safety Executive HSE, 1992.
[2] Dean, R.G. Stream function representation of nonlinear ocean waves.Journal of Geo-physical Research, 70:4561–4572, 1965.
[3] Dean, R.G. and R.A. Dalrymple.Water wave mechanics for engineers and scientists.World Scientific Publishing Co. Pte. Ltd., 1991.
[4] Eecen, P.J. Wind waves : Forces due to waves on offshore wind turbines. Technical Re-port ECN-C–03-097, Energy research Centre of the Netherlands ECN, September 2003.
[5] Ewing, J.A. Statistics of wave breaking in the southern North Sea. Technical Report OTO93026, Health & Safety Executive HSE, 1993.
[6] Grundlehner, G.J. Systematic model tests on a harsh environment jack-up in elevatedconditions. InProceedings of5th international conference on jack-up platforms, London,September 1995. City University.
[7] Huseby, M. and J. Grue. An experimental investigation of higher harmonic forces on avertical cylinder.Journal of Fluid Mechanics, 414:75–103, 2000.
[8] Jensen, A., M. Huseby, J.K. Sveen and J. Grue. Measurements of velocities and accel-erations in steep irregular water waves. InProceedings of10th International Symposiumon Application of Laser Techniques to Fluid Mechanics, 2000.
[9] Journée, J.M.J. and W.W. Massie. Offshore Hydromechanics. Technical report, DelftUniversity of Technology, Delft, January 2001.http://www.ocp.tudelft.nl/mt/journee/#LINK3 .
[10] Journée, J.M.J., W.W. Massie, B. Boon and R. Onnink. Model Experiments on Jack-UpPlatform Hydromechanics. Technical Report 0809-P, Delft University of Technology,Delft, November 1988.
[11] Kriebel, D.L., E.P. Berek, S.K. Chakrabartie and J.K. Waters. Wave-current loading ona shallow water caisson. InOffshore Technology Conference, Houston, May 1996. OTC8067.
[12] Luck, M., M. Benoit and J.M. Menon. Experimental study of wave loading on offshorepile for wind turbines in shallow water depth. Technical Report HP-75/03/078/A, Elec-tricité de France, EDF R&D, December 2003.
[13] Madsen, P.A., H.B. Bingham and Hua Liu. A new Boussinesq method for fully nonlinearwaves from shallow to deep water.Journal of Fluid Mechanics, 462:1–30, 2002.
[14] Newman, J.N.Marine Hydrodynamics. MIT Press, Cambridge, Massachusetts, 1977.
[15] Peters, H.C. and H. Boonstra. Fatigue loading on a single pile platform due to combinedaction of waves and currents. InBehaviour of Offshore Structures, pages 1015–1035,Trondheim, 1988. Tapir Publishers.
[16] Sarpkaya, T. and I. Isaacson.Mechanics of wave forces on offshore structures. VanNostrand Reinhold Company Inc., 1981.
ECN-C–04-042 23

Wave loads on offshore wind turbines
[17] Sorensen, R.M.Basic wave mechanics for coastal and ocean engineers. John Wiley &Sons, 1993.
[18] Vugts, J.H. and A.G. Bouquet. Frequency domain description of wave forces on an ele-ment of a vertical pile in random seas. InBehaviour of Offshore Structures, pages 239–253, Amsterdam, 1985. Elsevier Science Publishers B.V.
[19] Wienke, J.Druckschlagbelastung auf schlanke zylindrische Bauwerke durch brechendeWellen. PhD thesis, Technischen Universität Carolo-Wilhelmina, Braunschweig,Juli 2001.http://opus.tu-bs.de/opus/frontdoor.php?source_opus=294 .
24 ECN-C–04-042


![A New Equation for Calculating Wave Loads on Offshore Structures (Lattices) [Rainey]](https://static.fdocuments.in/doc/165x107/5695d2d01a28ab9b029bd0ec/a-new-equation-for-calculating-wave-loads-on-offshore-structures-lattices.jpg)