Modelling of Urban Flooding
35
16.10.2019 1 Modelling of Urban Flooding Stormwater modelling and flood risks in the City of Turku Eric Wehner, Finnish Consulting Group (FCG) Mikko Huokuna, Finnish Environment Institute (SYKE)
Transcript of Modelling of Urban Flooding

16.10.2019 1
Modelling of Urban FloodingStormwater modelling and flood risks in the City of Turku
Eric Wehner, Finnish Consulting Group (FCG)
Mikko Huokuna, Finnish Environment Institute (SYKE)

16.10.2019 2
Objectives

16.10.2019 3
Objectives – Why urban flood modelling is important
Urban flood modelling importance growswith climate change
Simultaneous increase in urbanization andnumber of extreme rain events
Knowing the risks and being prepared tohandle them
Modelling (results) as input for
Flood hazard and risk mapping
Flood risk management planning
Flood forecast and early warning
Kuva Juha Alaluukas,Lahden kaupunki
Taustakartta: MaanmittauslaitosFlooded areas from SYKE’s surfacemodel

16.10.2019 4
Methods for numerical modelling of urban flooding
Modelling urban stormwater network:• Capacity analysis (present and future)
• Identify flood risks within stormwater sewer network & atcrucial culverts
Modelling flooding caused by surface flow• 2D surface flow modelling
• Identifying potentially flooded areas and creation of flood riskmaps based on• Surface flow only
• Surface flow including modelled manhole outflows based onSWMM model

16.10.2019 5
Stormwater network modelling

16.10.2019 6
SWMM model setup & content
Set up in FCG-SWMM based on EPA-SWMM
Accuracy highest on areas with stormwater sewers
Final model
• comprises the complete Turku region, including tributaries fromsurrounding municipalities: ~1200 catchments, ~1150 km2
• includes the existing storm water sewer network to a reasonableextent (> 380 km)
• includes important/necessary streams and storm water ditches aswell as culverts, but
• Detailed data about streams’ capacities and dam operation stillneeds to be added
Total catchmentTurku regionaldistrict
Aurajoki

16.10.2019 7
SWMM: Focus on urbanized areas
• Main catchment: 1150 km2
• Aurajoki (~875 km2), Raisionjoki (~130 km2)
• ~90% rural, 10% urban
• ~90% forest, agriculture and green area
• ~16% of the total catchment area belongs to Turku district
• Area with storm water sewerage: ~95 km2 / ~1140 sub-catchments (red)
• Surrounding area draining into Turku region:~1060 km2 / ~60 sub-catchments (blue)

16.10.2019 8
SWMM: Catchments and stormwater network
Most sensitive catchment parameters are:• Size & shape
Catchment delineation: City of Turku’s regional stormwater plan (2014) & NationalLand Survey of Finland (NLS) Semi-automatic GIS process
• Impervious area (total or effective, TIA/EIA) & initial lossesTIA from land-use maps, aerial picture evaluation (NLS)EIA: what part of the area is really connected to the network?
usually difficult to determine (field investigation, pipe inspections, constructionplans, calibration)
Losses (surface, depression) estimated by land-use / soil maps
Network:• Stormwater sewers: digital network map, imported & manually revised
• Culverts: Digital base-map, regional storm water plan
• Main streams, ditches: NLS (routes), DEM analysis, Google Street View ©

16.10.2019 9
SWMM: Calibration of example area
Location: Hippoksentie / Blomberginaukio, Catchment size ~85 ha, largely detached or semi-detached housing area
Measured flow & corresponding rain data from Kirstinpuisto for ~2 months (18.10. – 13.12.2018, Luode Consulting) 8 independent events,
no snow fall/melt, base flow ~8-10 l/s
Reduction of imperviousness for calibrated area ~40% compared to first TIA estimation
Estimated TIA 35% preliminarily calibrated EIA 21%
Transfer to other areas should be handled with care (catchment specific), additional calibration recommended

16.10.2019 10
SWMM: Rainfall parameters
In Finland: RATU = Extreme rainfall and floods in built-up areas (duration-recurrence)
Design rain depends on size of catchment (time of concentration) and design level (stormwatersewers ~1/2a to 1/5a, culverts ~1/5a – 1/100a)
Simulations were done for 1/10a, 1/25 and 1/100a with rain durations 15min – 120minExtreme event: Aug. 2007 in Pori ~100-130mm in ~3hChicago design storm was used as intensity curve
Keep in mind: climate change for year 2100 predicted rise in rain amount ~20%today’s 1/5a event future 1/2a event
Recurrenceintervall
Rain duration [min]15 30 60 120 ~180
intensity sum intensity sum intensity sum intensity sum intensity sum[1/a] [l/s*ha] [mm] [l/s*ha] [mm] [l/s*ha] [mm] [l/s*ha] [mm] [l/s*ha] [mm]
10 156 14 100 18 64 23 38 2725 183 17 120 22 75 27 45 32
100 233 21 147 26 100 36 56 40Pori 8.2007 128 115

16.10.2019 11
SWMM: Capacity analysisIdentifying potential flood risks by
visualizing manhole overflows

16.10.2019 12
SWMM: What is causing the potential flooding?
Identifying whatcauses the flooding(eg. bottlenecks)

16.10.2019 13
SWMM: Testing possible restoration options
Testing possiblesolutions

16.10.2019 14
SWMM: Comparing different rain events
Testing original design rain (1/2a)
In the future (1/5a, taking climatechange into account)

16.10.2019 15
SWMM: Comparing different boundary conditions
Low water level in Aurajoki
High water level in Aurajoki
16.10.2019 16
Surface flow modelling

16.10.2019 17
Use of the surface flow model in theUrbanStormwaterRisk-project
In the UrbanStormwaterRisk-project thesurface flow model was used for two purposes• Calculation of the flooded areas caused by
the overflow from the stormwater sewersystem; the amount of the outflow wascalculated with SWMM-model• No rain considered in the flow model
• Calculation of flooding caused by differentrain events using surface flow model inwhich the infiltration is based on land useand soil sealing data• Storm water sewer system not modelled;
considered only as constant “infiltration”• An area of 13x13 km was modelled in both cases

16.10.2019 18
Surface flow model used inUrbanStormWaterRisk-project Geometry based on NLS KM2 digital elevation
model (2x2 m)• modified at the locations of buildings and
roads and “known” culverts
Precipitation (time dependent intensity)• same precipitation for one simulation area (i.e.
rainfall is not moving)
Manning n• based on land use data (Corine 2012)
Drainage• Constant value for urban area describing the
underground drainage (mm/h). Corine 2012data is used to estimate where drainage isavailable
Infiltration• Based on land use data (Corine 2012) and the
imperviousness degree ( Soil sealing, EEA,Copernicus/EU)
The calculation method is described in the paper:Bates et.al. 2010. A simple inertial formulation of theshallow water equations for efficient two dimensionalflood inundation modelling .

16.10.2019 19
Same model was used to producepreliminary pluvial flood maps inFinland
The preliminary pluvial flood map wasproduced for about 1400 areas in Finland(6x6km areas).Those areas incudes more than 0,5 km2 ofurban or suburban area.GPU-calculation was utilized and the solution ofthe flow equations was programmed by usingCUDA-language

16.10.2019 20
Adding culverts to the model
The original DEM (2x2 m) inTurku area was modified byadding "routes" for culverts andby heightening the DEM at thelocations of buildingsCulverts were first addedautomatically but later the cityof Turku checked and correctedthe culvert data

16.10.2019 21
Calculation of the flooded areascaused by the overflow from thestormwater sewer system
Outflow from SWMM
SWMM-model
Surface flow model
Flooded areas
Manhole outflow hydrographis used as input for one cell
Flooding basedonly on overflowfrom manholes

16.10.2019 22
Calculation of the flooded areascaused by the overflow from thestormwater sewer system, rainprobabilities
Several rain probabilities and durationsconsidered• Probability 1/10a (T10)
• Rain durations 15, 30, 60 and 120 min
• Probability 1/25a (T25)• Rain durations 15, 30, 60 and 120 min
• Probability 1/100a (T100)• Rain durations 15, 30, 60 and 120 min
• Probability 1/100a (T100)• Rain 4 hours
• Extreme rain event (Pori 2007)

16.10.2019 23
Calculation of flooded areas caused by the overflow from the stormwater sewersystem (overflow calculated with SWMM, flooding with surface flow model)
Rain 1/10a 30 min Rain 1/100a 30 minRain 1/25a 30 min
• Maximum flood depth for different rain probabilities(duration 30 min).
• Pipes and manholes used in SWMM model are alsopresented on map

16.10.2019 24
Calculation of the flooded areas caused by the manholeoverflow from the stormwater sewer system, why this kind ofcombination was used
There are several commercial models available, which allow a combinationof modelling the stormwater sewer network and 2-dimensional surface flowHowever, in our case the modelled area is large which may cause problemswith combined models and we also wanted to test how the results fromSWMM-model could be used as an input for the surface flow modelAdvantage: the surface flow model was largely already built, so it wasinteresting to compare the resultsUsing EPA-SWMM, we are not bound to licenses or fees

16.10.2019 25
Calculation of flooding caused by different rain eventsusing surface flow model in which the infiltration is basedon land use and soil sealing data
Infilltration and drainage

16.10.2019 26
Calculation of flooding caused by different rain events using surfaceflow model in which the infiltration is based on land use and soilsealing data, results for rain duration 30 min
Results here
Rain 1/10a 30 min Rain 1/100a 60 minRain 1/25a 30 min
• Maximum flood depth for differentrain probabilities (duration 30 min).

16.10.2019 27
Comparison of the results for different methods
Results here
Overflow from SWMM manholes Surface flow model with precipitation
Maximum flood depth for rain even 1/10a duration 60 min

16.10.2019 28
Results here
Overflow from SWMM manholes Surface flow model with precipitation
Due to missing data or absence of stormwatersewers, some areas don’t produce manholeoverflows in SWMM no flooding visible
Comparison of the results for different methodsMaximum flood depth for rain even 1/10a duration 60 min

16.10.2019 29
Results here
Overflow from SWMM manholes Surface flow model with precipitation
Less flooding here insurface flow model
More flooding here insurface flow model
Stormwater sewer network is not used in surface flow model.This is one reason for differences in the results.
Comparison of the results for different methodsMaximum flood depth for rain even 1/10a duration 60 min
16.10.2019 30
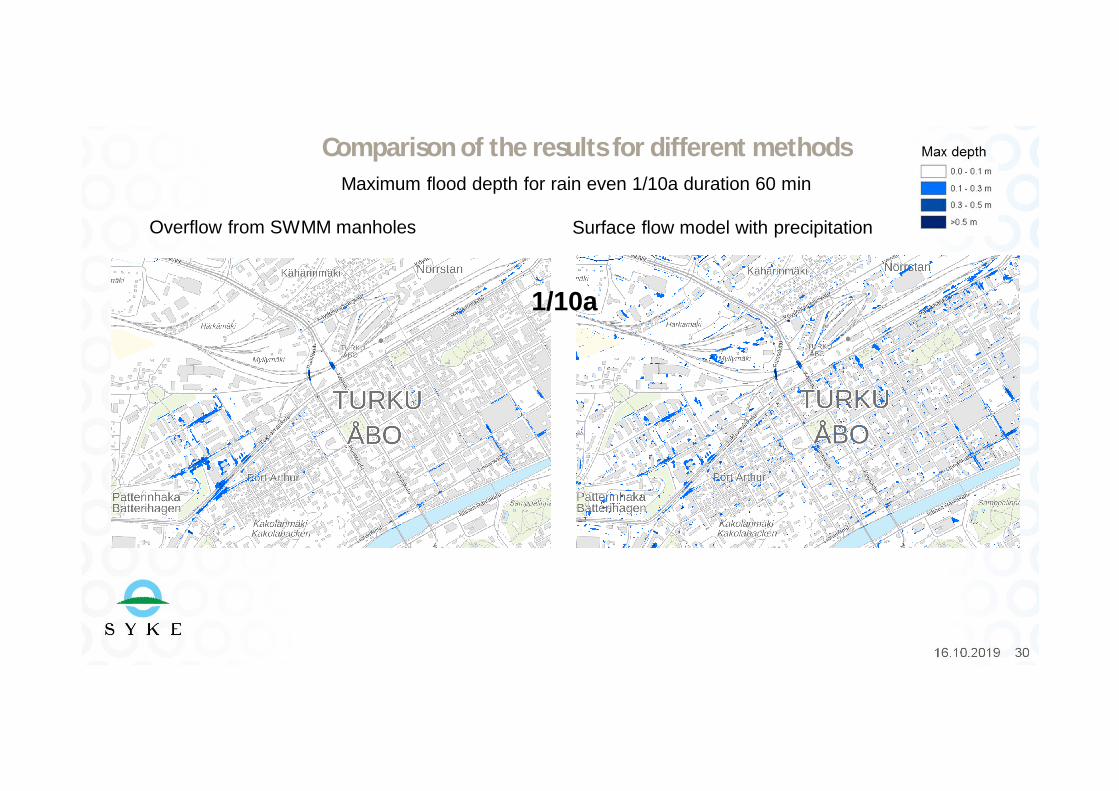
Comparison of the results for different methods
Results here
Overflow from SWMM manholes Surface flow model with precipitation
1/10a
Maximum flood depth for rain even 1/10a duration 60 min

16.10.2019 31
Comparison of the results for different methods
Overflow from SWMM manholes Surface flow model with precipitation
1/25a
Maximum flood depth for rain even 1/25a duration 60 min

16.10.2019 32
Comparison of the results for different methods
Overflow from SWMM manholes Surface flow model with precipitation
1/100a
Maximum flood depth for rain even 1/100a duration 60 min
The flooded areas became more equal when the amountof rainfall increases

16.10.2019 33
Possible model applications
Capacity analysis:Analyzing current state by determining capacities of pipes and culverts (includingback flow & tail water conditions)Identifying where and why does flooding occur (find bottlenecks and false data)
Stormwater management planning:Design new stormwater networks and management structures (influence of greeninfrastructure, LID like green roofs, centralized retention etc.)What effect do certain management measures have on the flooded areas?
Mapping flood risks and solving flood problems:Creation of flood hazard and risk management maps preparing for emergencysituationsEvaluating possible scenarios (e.g. effects of different management structures &Climate Change etc.)

16.10.2019 34
Conclusions & recommendations

16.10.2019 35
Conclusions
Detailed and up-to-date data is a crucial basis for pluvial flood modelling andmappingHigh probability floods needs accurate modeling of stormwater sewer system (effectof stormwater sewers is higher for small rain events)In many cases floods with very low probability may be modelled without taking intoaccount the stormwater sewer system – at least for preliminary studiesOverflow routes in areas with stormwater sewers may be simulated more accuratelywith surface flow modelMunicipality authorities, emergency services and all other involved stakeholdersmust cooperate closely to provide proper input for flood risk modelling and mappingFor usage within an early-warning-system additional work is necessary• obtaining and preprocessing forecasted rainfall data, automized simulation and
flood mapping, automized warning.