Modelling Low Impact Development Potential with...
25
Modelling Low Impact Development Potential with Hydrological Response Units Marija Eric, Celia Fan, Darko Joksimovic, James Li
Transcript of Modelling Low Impact Development Potential with...

Modelling Low Impact Development Potential with Hydrological Response Units Marija Eric, Celia Fan, Darko Joksimovic, James Li

Outline
1. Background and Objective
2. GIS in Screening and Development of LID
Opportunities and Development of UHRUs
3. Modelling Methodology
UHRU Hydrologic Models
Performance Curves
4. Results of Application of the Methodology
5. Conclusions

Background Lake Simcoe Protection
Plan Action Plan Specific Targets – P Loading
New developments – stormwater management master plans
Retrofits Controlled/controllable
areas (using conventional measures)
Uncontrolled areas
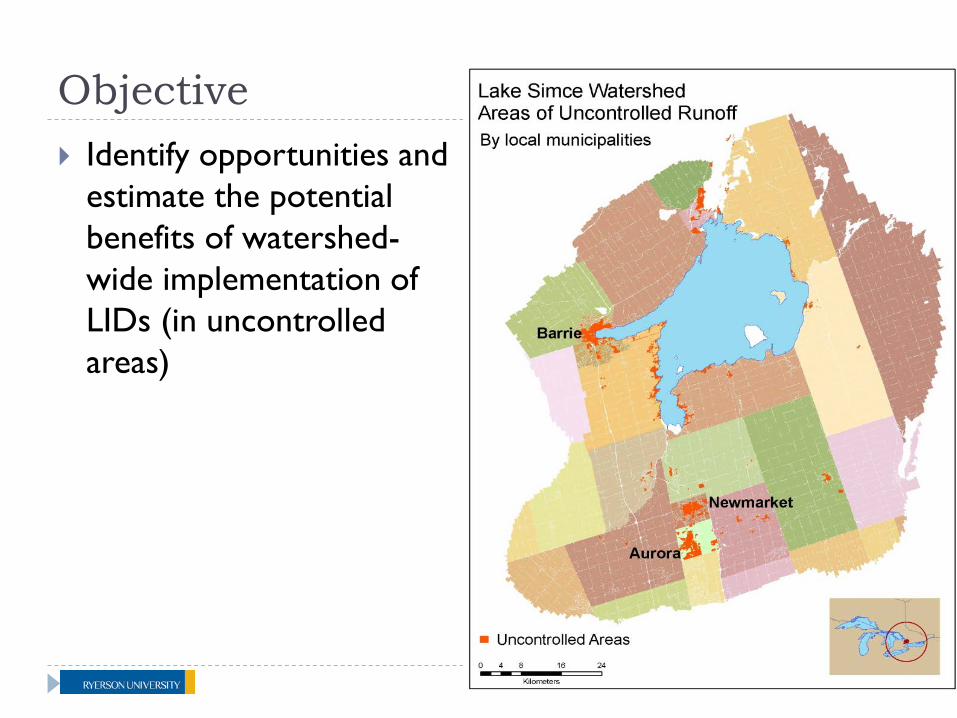
Objective Identify opportunities and
estimate the potential benefits of watershed-wide implementation of LIDs (in uncontrolled areas)
5
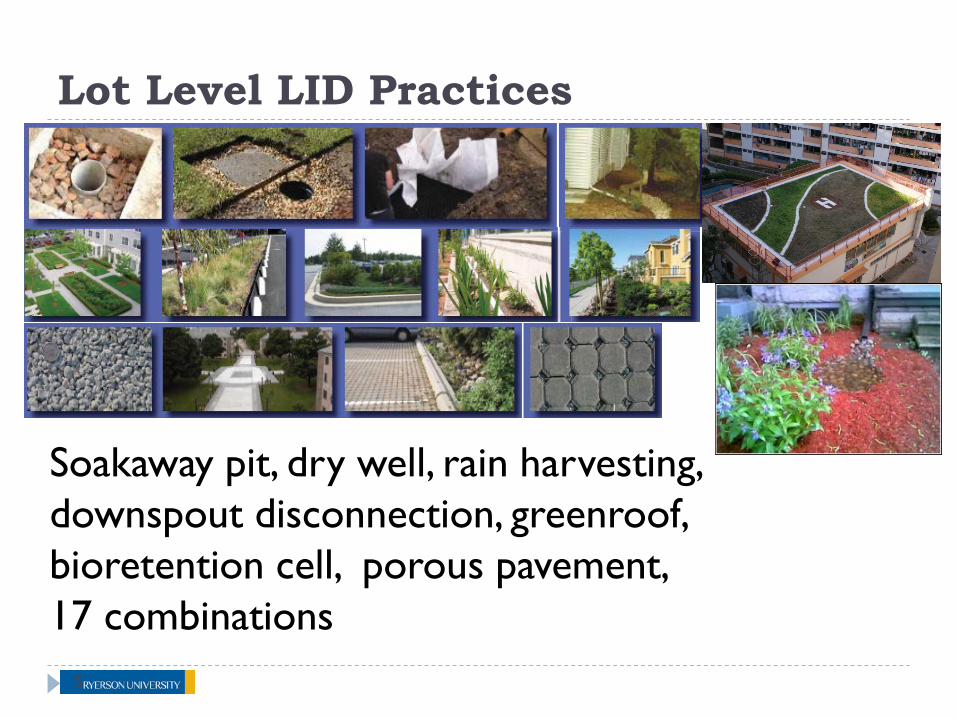
Soakaway pit, dry well, rain harvesting, downspout disconnection, greenroof, bioretention cell, porous pavement, 17 combinations
Lot Level LID Practices
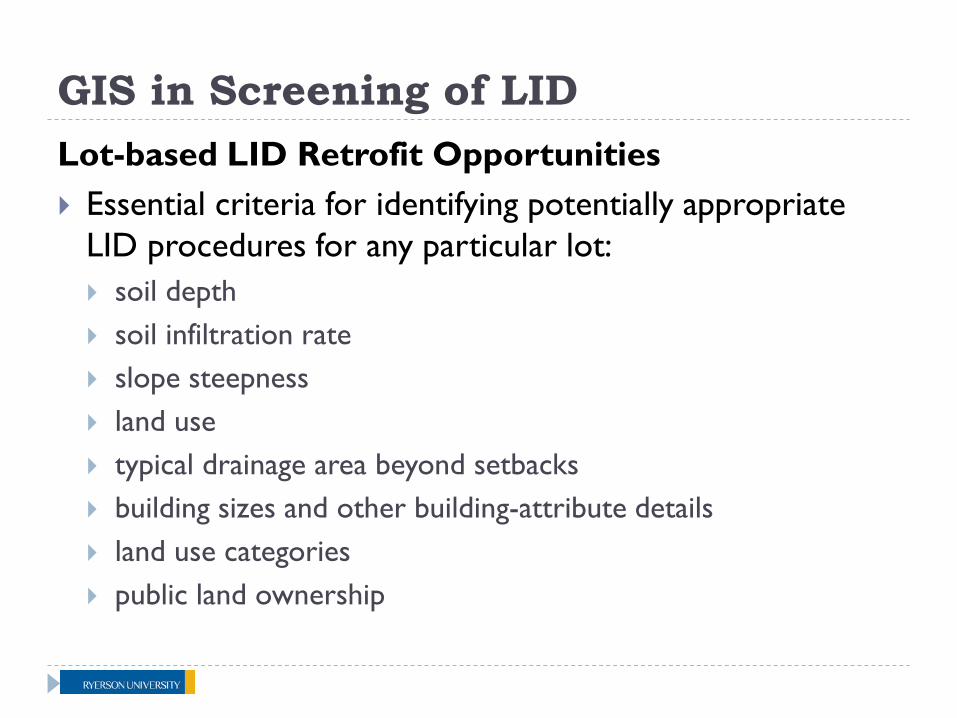
GIS in Screening of LID Lot-based LID Retrofit Opportunities Essential criteria for identifying potentially appropriate
LID procedures for any particular lot: soil depth soil infiltration rate slope steepness land use typical drainage area beyond setbacks building sizes and other building-attribute details land use categories public land ownership

GIS in Screening of LID Opportunities

Imperfect conformity between lots and stormwatersheds

Imperfect registration of buildings (green) on lots (orange)

Buildings identified as being larger than their lots were clipped to lot bundaries
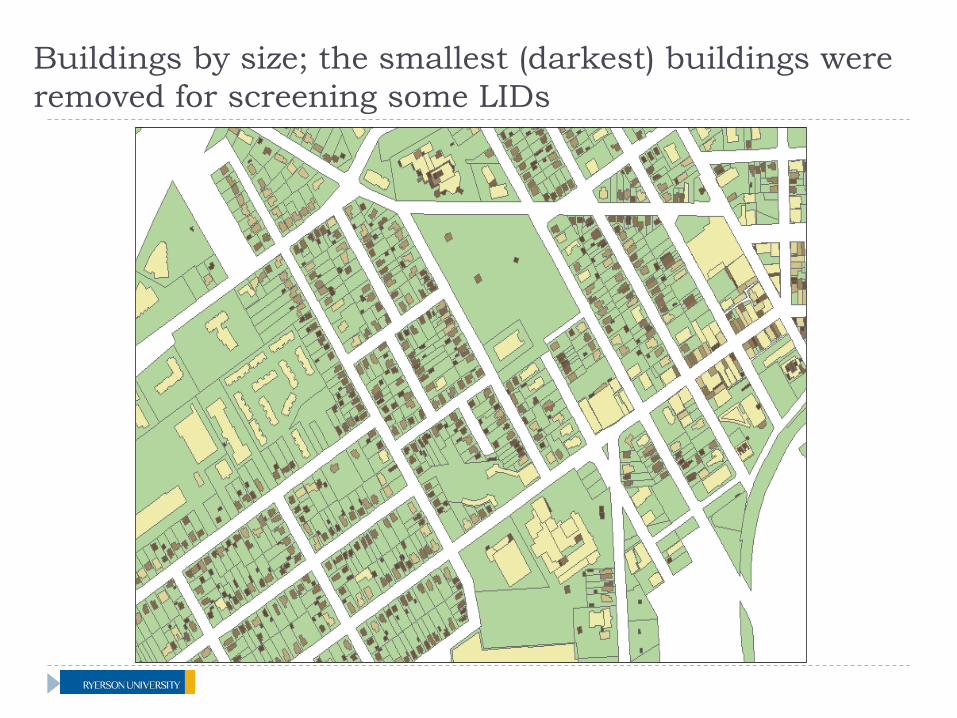
Buildings by size; the smallest (darkest) buildings were removed for screening some LIDs
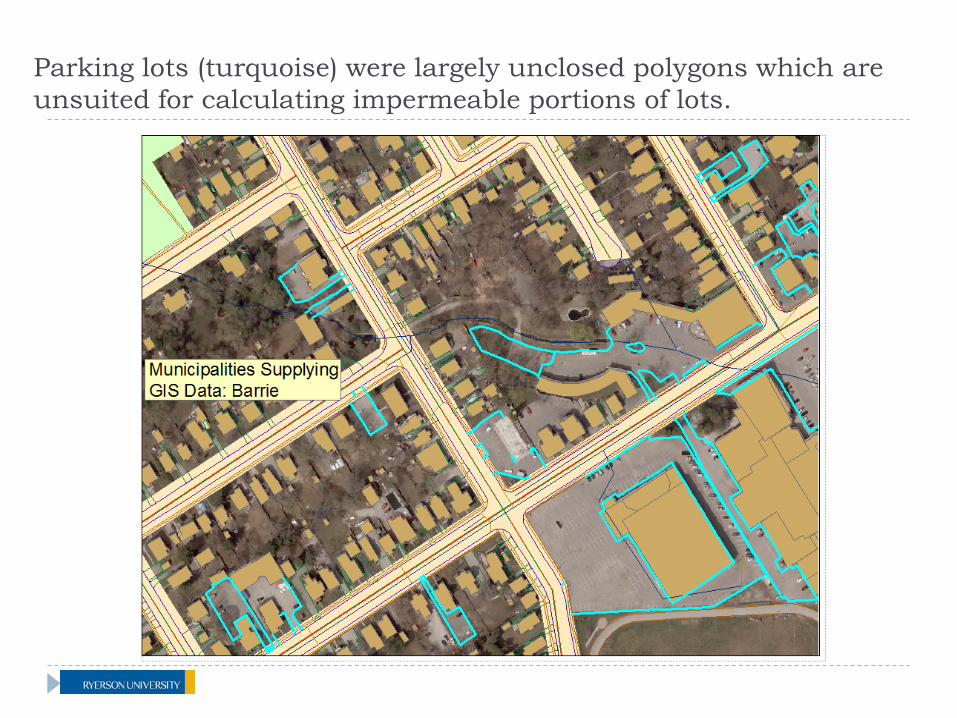
Parking lots (turquoise) were largely unclosed polygons which are unsuited for calculating impermeable portions of lots.

GIS in Screening of LID Opportunities Layers Barrie Newmarket East Gwillimbury Aurora
Parcels Comprehensive (from LSRCA/Teranet) Parking Completed Present None None
Driveways Present None None None
Buildings Comprehensive
(except attributes) Comprehensive
(except attributes) None None
Land Use Satisfactory (from LSRCA and DMTI) Comprehensive
Sidewalks Present Require
restructuring (lines) None Incomplete, lines
Soils Complete (Hydrographic Classes and Depths, from LSRCA)
Roads Completed (lines) Require
restructuring (lines) Present (lines) Present (lines)
Storm Drainage
System Present (lines) Comprehensive Present Present
Ditches Present None None None Parks Present Present from LSRCA Present
DEM/DTM from LSRCA
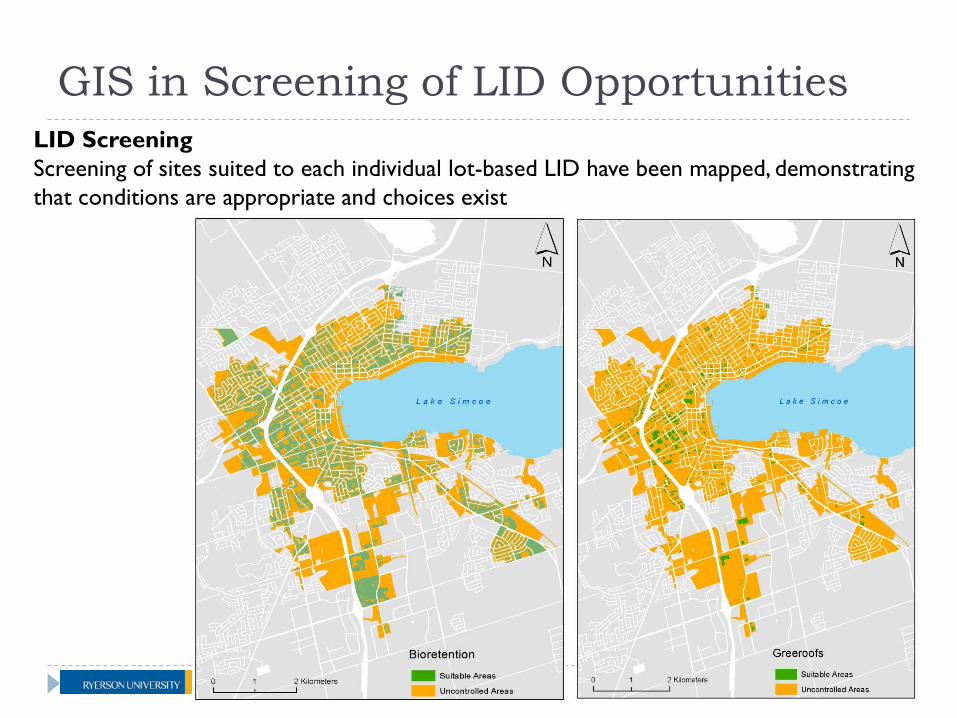
GIS in Screening of LID Opportunities LID Screening Screening of sites suited to each individual lot-based LID have been mapped, demonstrating that conditions are appropriate and choices exist

GIS in Screening of LID Opportunities LID Screening sites for combinations of lot-based LIDs have now been demonstrated to be appropriate:

Modelling Methodology
LID Potential for all Lake Simcoe watershed Maps and Tables
Aggregation of results over stormwatersheds MS Excel
UHRU Modelling USEPA SWMM5
Development of Urban Hydrologic Response Units (UHRUs)
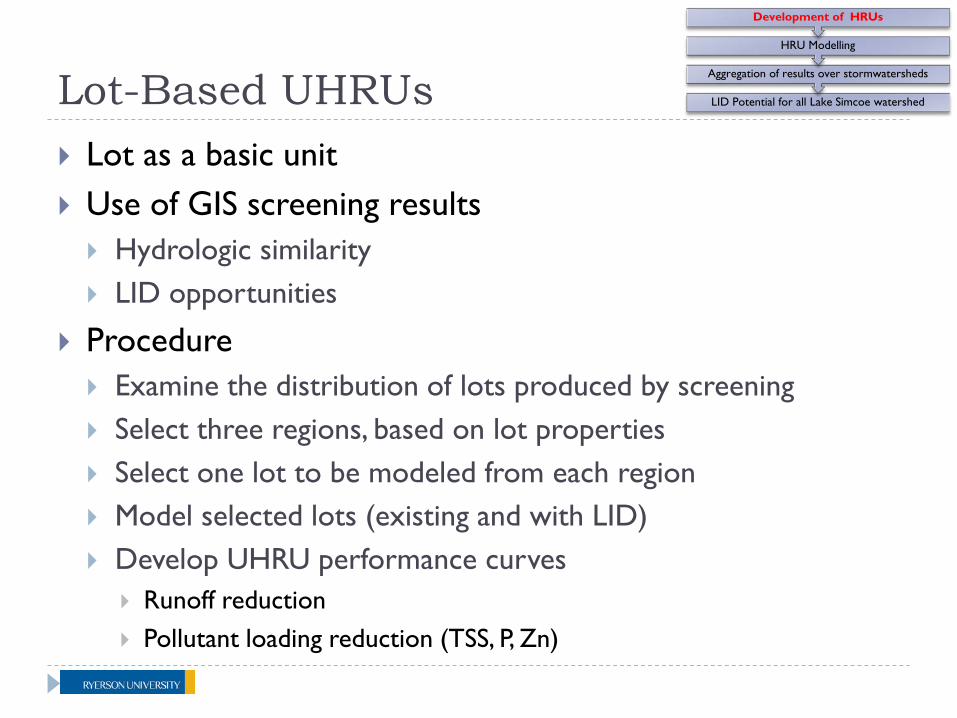
Lot-Based UHRUs Lot as a basic unit Use of GIS screening results Hydrologic similarity LID opportunities
Procedure Examine the distribution of lots produced by screening Select three regions, based on lot properties Select one lot to be modeled from each region Model selected lots (existing and with LID) Develop UHRU performance curves
Runoff reduction Pollutant loading reduction (TSS, P, Zn)
LID Potential for all Lake Simcoe watershed
Aggregation of results over stormwatersheds
HRU Modelling
Development of HRUs

Areas for Modeling Example: Soakaway pits in residential areas Examining and selection of lots in each region
LID Potential for all Lake Simcoe watershed
Aggregation of results over stormwatersheds
HRU Modelling
Development of HRUs
Percent Runoff Reduction = 2.018x(Building Area/Lot Area)0.7319
0
10
20
30
40
50
60
0 10 20 30 40 50 60 70 80 90
Runo
ff R
educ
tion,
in %
BldgSize/LotSize, in %

Modelling Inputs Rainfall Data Hourly records 1968-2003 for local gauge analyzed Average year (1985) precipitation used
Evapotranspiration Provided by LSRCA
Pollutant concentrations EMC based on Toronto WWFMMP Study (no local data available)
LID Sizing assumptions 2003 Ontario Ministry of Environment guidelines
Typical pollutant removal assumed (literature)
LID Potential for all Lake Simcoe watershed
Aggregation of results over stormwatersheds
HRU Modelling
Development of HRUs
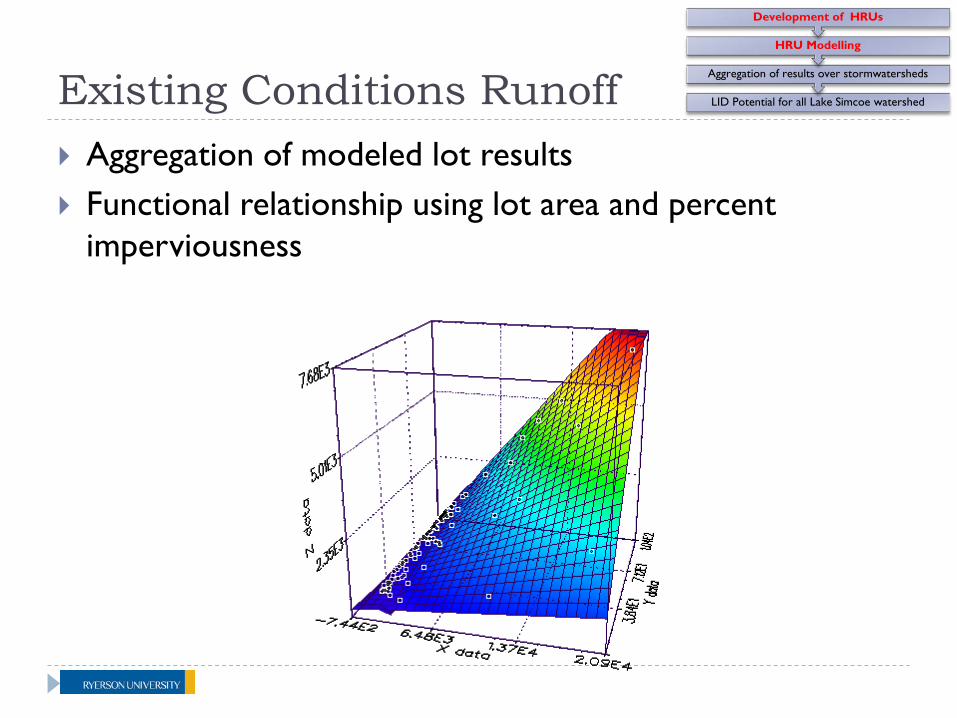
Existing Conditions Runoff Aggregation of modeled lot results Functional relationship using lot area and percent
imperviousness
LID Potential for all Lake Simcoe watershed
Aggregation of results over stormwatersheds
HRU Modelling
Development of HRUs
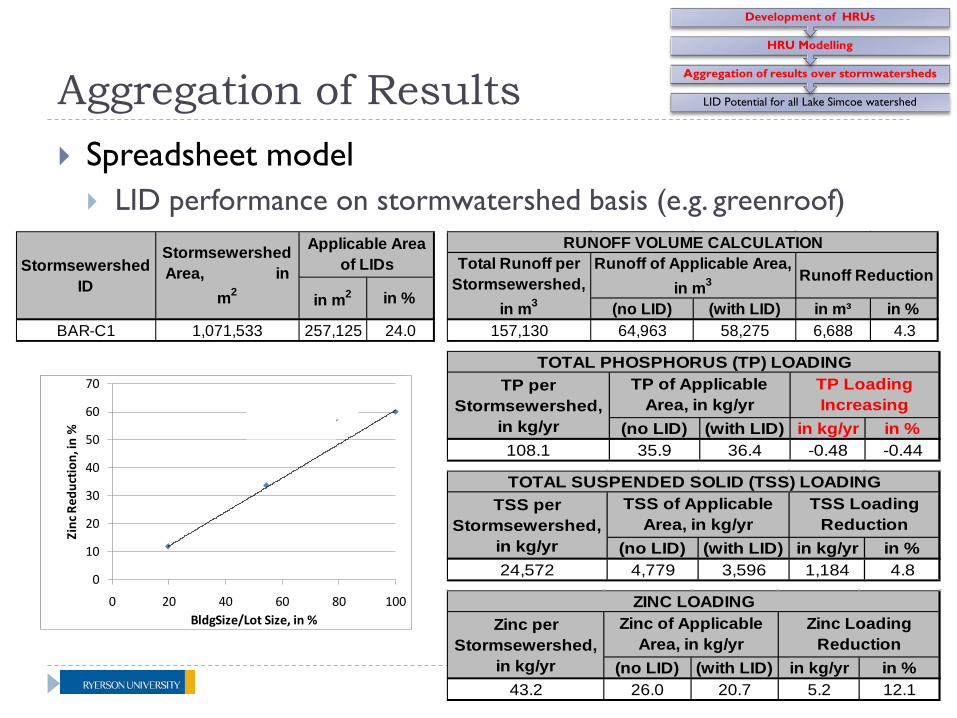
Aggregation of Results Spreadsheet model LID performance on stormwatershed basis (e.g. greenroof)
LID Potential for all Lake Simcoe watershed
Aggregation of results over stormwatersheds
HRU Modelling
Development of HRUs
BAR-C1 1,071,533 257,125 24.0
Stormsewershed ID
Stormsewershed Area, in
m2 in m2 in %
Applicable Area of LIDs
(no LID) (with LID) in m³ in %157,130 64,963 58,275 6,688 4.3
Total Runoff per Stormsewershed,
in m3
RUNOFF VOLUME CALCULATIONRunoff of Applicable Area,
in m3 Runoff Reduction
(no LID) (with LID) in kg/yr in %108.1 35.9 36.4 -0.48 -0.44
TP per Stormsewershed,
in kg/yr
TP of Applicable Area, in kg/yr
TP Loading Increasing
TOTAL PHOSPHORUS (TP) LOADING
(no LID) (with LID) in kg/yr in %24,572 4,779 3,596 1,184 4.8
TSS per Stormsewershed,
in kg/yr
TSS of Applicable Area, in kg/yr
TSS Loading Reduction
TOTAL SUSPENDED SOLID (TSS) LOADING
(no LID) (with LID) in kg/yr in %43.2 26.0 20.7 5.2 12.1
Zinc per Stormsewershed,
in kg/yr
Zinc of Applicable Area, in kg/yr
Zinc Loading Reduction
ZINC LOADING
y = 0.3161xR² = 0.98
0
5
10
15
20
25
30
35
0 20 40 60 80 100
Runo
ff R
educ
tion,
in %
BldgSize/Lot Size, in %
y = 0.63e0.02x
R² = 0.92
0
1
2
3
4
5
6
0 20 40 60 80 100
TP In
crea
sing,
in %
BldgSize/Lot Size, in %
y = 0.68xR² = 0.99
0
10
20
30
40
50
60
70
80
0 20 40 60 80 100
TSS
Redu
ctio
n, in
%
BldgSize/Lot Size, in %
y = 0.60x1.0009
R² = 0.99
0
10
20
30
40
50
60
70
0 20 40 60 80 100
Zinc
Red
uctio
n, in
%
BldgSize/Lot Size, in %

Aggregation of Modeling Results in Barrie Performance Maps: Lot-based: Individual LIDs
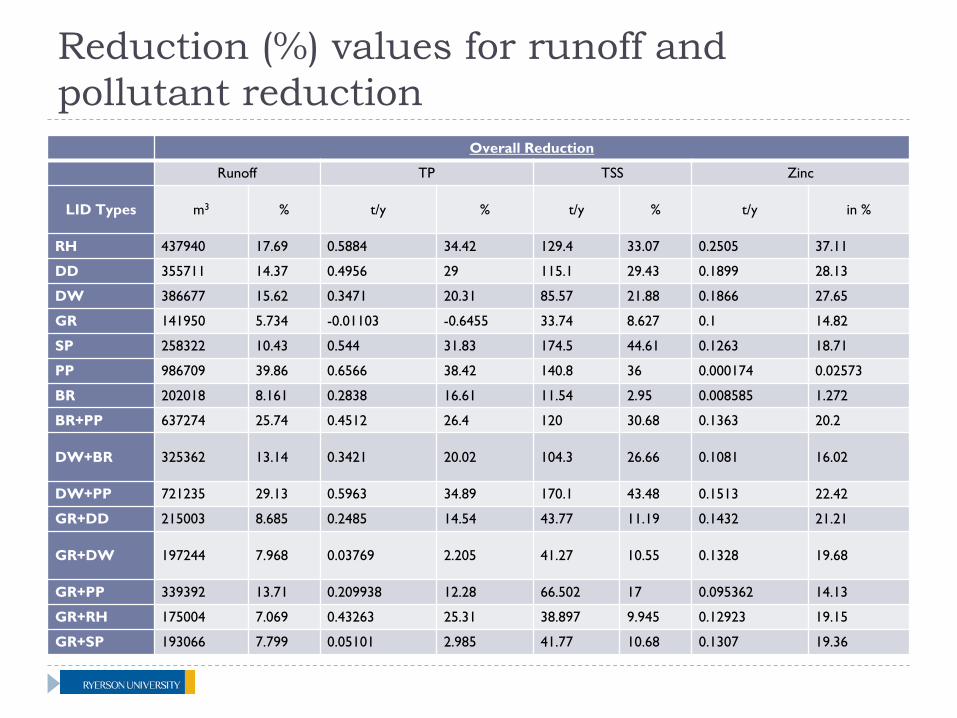
Reduction (%) values for runoff and pollutant reduction Overall Reduction
Runoff TP TSS Zinc
LID Types m3 % t/y % t/y % t/y in %
RH 437940 17.69 0.5884 34.42 129.4 33.07 0.2505 37.11
DD 355711 14.37 0.4956 29 115.1 29.43 0.1899 28.13
DW 386677 15.62 0.3471 20.31 85.57 21.88 0.1866 27.65
GR 141950 5.734 -0.01103 -0.6455 33.74 8.627 0.1 14.82
SP 258322 10.43 0.544 31.83 174.5 44.61 0.1263 18.71
PP 986709 39.86 0.6566 38.42 140.8 36 0.000174 0.02573
BR 202018 8.161 0.2838 16.61 11.54 2.95 0.008585 1.272
BR+PP 637274 25.74 0.4512 26.4 120 30.68 0.1363 20.2
DW+BR 325362 13.14 0.3421 20.02 104.3 26.66 0.1081 16.02
DW+PP 721235 29.13 0.5963 34.89 170.1 43.48 0.1513 22.42
GR+DD 215003 8.685 0.2485 14.54 43.77 11.19 0.1432 21.21
GR+DW 197244 7.968 0.03769 2.205 41.27 10.55 0.1328 19.68
GR+PP 339392 13.71 0.209938 12.28 66.502 17 0.095362 14.13
GR+RH 175004 7.069 0.43263 25.31 38.897 9.945 0.12923 19.15
GR+SP 193066 7.799 0.05101 2.985 41.77 10.68 0.1307 19.36
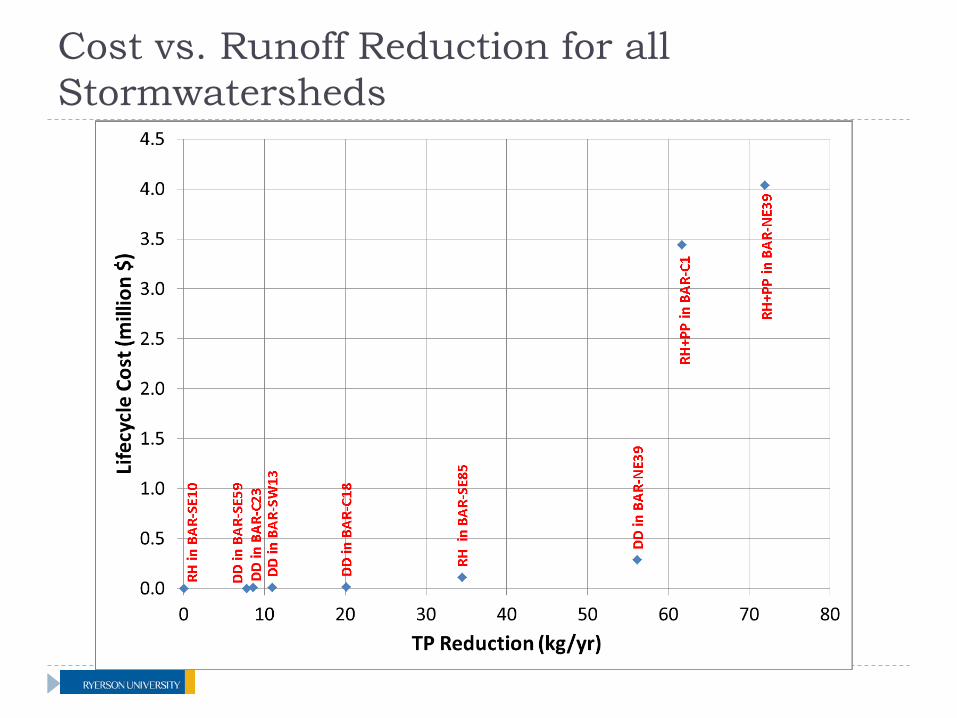
Cost vs. Runoff Reduction for all Stormwatersheds
0
10
20
30
40
50
60
70
0 10 20 30 40 50 60 70 80
Tota
l Cos
t, in
201
0 $x
106 C
DN
TP Loading Reduction, in kg/yr
RHBRDDDWGRPPSPBR+PPDW+PPGR+DDGR+DWGR+PPGR+RHDW+BRGR+BRGR+SPRH+PPSP+PPRH+BRSP+BRDD+GR+PPGR+RH+PPDD+GR+BRGR+RH+BR
Summary and Conclusions UHRU approach Allows watershed evaluation of implementation of small scale
practices Flexible
Range of LID practices Choice of hydrologic modelling tools
Prioritization and ranking of future efforts
Current / Future work Refinement of performance curves
Clustering (according to lot properties) Sensitivity analyses Uncertainty