Modelling cell migration strategies in the extracellularpainter/articles/kjp019.pdf · Modelling...
33
J. Math. Biol. (2009) 58:511–543 DOI 10.1007/s00285-008-0217-8 Mathematical Biology Modelling cell migration strategies in the extracellular matrix K. J. Painter Received: 27 March 2007 / Revised: 23 January 2008 / Published online: 12 September 2008 © Springer-Verlag 2008 Abstract The extracellular matrix (ECM) is a highly organised structure with the capacity to direct cell migration through their tendency to follow matrix fibres, a pro- cess known as contact guidance. Amoeboid cell populations migrate in the ECM by making frequent shape changes and have minimal impact on its structure. Mesenchy- mal cells actively remodel the matrix to generate the space in which they can move. In this paper, these different types of movement are studied through simulation of a conti- nuous transport model. It is shown that the process of contact guidance in a structured ECM can spatially organise cell populations. Furthermore, when combined with ECM remodelling, it can give rise to cellular pattern formation in the form of “cell-chains” or networks without additional environmental cues such as chemoattractants. These results are applied to a simple model for tumour invasion where it is shown that the interactions between invading cells and the ECM structure surrounding the tumour can have a profound impact on the pattern and rate of cell infiltration, including the formation of characteristic “fingering” patterns. The results are further discussed in the context of a variety of relevant processes during embryonic and adult stages. Mathematics Subject Classification (2000) 92C17 1 Introduction Cell migration plays a fundamental role in tissue development, maintenance and break- down. During embryonic growth, a variety of processes including gastrulation, neural Electronic supplementary material The online version of this article (doi:10.1007/s00285-008-0217-8) contains supplementary material, which is available to authorized users. K. J. Painter (B ) Department of Mathematics and Maxwell Institute for Mathematical Sciences, School of Mathematical and Computer Sciences, Heriot-Watt University, Edinburgh EH14 4AS, UK e-mail: [email protected] 123
Transcript of Modelling cell migration strategies in the extracellularpainter/articles/kjp019.pdf · Modelling...

J. Math. Biol. (2009) 58:511–543DOI 10.1007/s00285-008-0217-8 Mathematical Biology
Modelling cell migration strategies in the extracellularmatrix
K. J. Painter
Received: 27 March 2007 / Revised: 23 January 2008 / Published online: 12 September 2008© Springer-Verlag 2008
Abstract The extracellular matrix (ECM) is a highly organised structure with thecapacity to direct cell migration through their tendency to follow matrix fibres, a pro-cess known as contact guidance. Amoeboid cell populations migrate in the ECM bymaking frequent shape changes and have minimal impact on its structure. Mesenchy-mal cells actively remodel the matrix to generate the space in which they can move. Inthis paper, these different types of movement are studied through simulation of a conti-nuous transport model. It is shown that the process of contact guidance in a structuredECM can spatially organise cell populations. Furthermore, when combined with ECMremodelling, it can give rise to cellular pattern formation in the form of “cell-chains”or networks without additional environmental cues such as chemoattractants. Theseresults are applied to a simple model for tumour invasion where it is shown that theinteractions between invading cells and the ECM structure surrounding the tumourcan have a profound impact on the pattern and rate of cell infiltration, including theformation of characteristic “fingering” patterns. The results are further discussed inthe context of a variety of relevant processes during embryonic and adult stages.
Mathematics Subject Classification (2000) 92C17
1 Introduction
Cell migration plays a fundamental role in tissue development, maintenance and break-down. During embryonic growth, a variety of processes including gastrulation, neural
Electronic supplementary material The online version of this article(doi:10.1007/s00285-008-0217-8) contains supplementary material, which is available to authorized users.
K. J. Painter (B)Department of Mathematics and Maxwell Institute for Mathematical Sciences,School of Mathematical and Computer Sciences, Heriot-Watt University,Edinburgh EH14 4AS, UKe-mail: [email protected]
123
512 K. J. Painter
crest migration, axonal guidance and tissue formation require precisely coordinatedcell movements, either as individuals or as a collective cell group (for a review, see[35]. In the adult organism, cell migration is a crucial component of tissue homeo-stasis, tissue repair and the immune response. Mutations arising in cancerous cellsmay lead to their uncontrolled migration and subsequent invasion into the surroun-ding healthy tissue (e.g. [37]). A range of external cues impart information to the cellsthat regulates their movement, including long range diffusible chemicals (e.g. che-moattractants), contact with membrane bound molecules on neighbouring cells (e.g.cell–cell adhesion and contact inhibition) and contact with the extracellular matrix(ECM) surrounding the cells. In this paper we shall explore the role of interactionsbetween cells and the matrix in directing cell movement.
The ECM comprises a highly organised meshwork that forms a substantial partof tissues: in the case of connective tissue such as the dermal skin layer, up to 70%.A variety of proteins and polysaccharides make up the matrix, including collagen,fibronectin and hyaluronan. The characteristic rope-like meshwork of the ECM isprincipally formed from collagen proteins which can self-assemble to form collagenfibrils 10–300 nm in diameter and 100s of micrometers in length [1,25]. In additionto acting as a supporting structure to the cells, via its expression of a wide variety ofchemical cues the ECM plays a major regulatory role in all facets of cell behaviour,including differentiation, proliferation and migration. The latter is strictly controlledby the ECM, which has the ability to either facilitate or prevent cell movement: fibro-blasts and leukocytes utilise the ECM for movement as part of normal physiologicalresponses in tissue repair and inflammation. In addition to providing a “scaffold” towhich cells can anchor and generate force, the ECM provides guidance informationto the cells either indirectly through matrix bound adhesive molecules (haptotaxis) ordirectly through cells following along matrix fibres, a process known as contact gui-dance [16]. To other cell types, such as epithelial cells, the ECM presents a physicaland chemical barrier to movement, thereby playing an important role in maintainingtissue integrity.
1.1 Migration strategies in the ECM
A variety of motility types have been identified by cells in the ECM [18]. Broadly,these can be classified as either individual or collective. In the former, cells migrateas single elements and form only transient contacts with other migrating cells. In thelatter, migration occurs as a cluster or sheet of cells maintained by strong adhesivecontacts. In this paper the focus will be on individual cell migration.
Individual cell migration can be further subdivided into two classes: amoeboid andmesenchymal [18]. Mesenchymal, utilised by fibroblasts, certain tumour cells andneutrophils, is slow (0.1–2 µm/min) and cells move through continuous formationand breakage of “focal adhesions” between their membrane and the matrix. To createthe necessary space to move, cells cut a hole in the ECM through the production andsecretion of matrix degrading proteins (or proteolytic enzymes) such as members of theMMP family. Matrix degradation occurs in either a contact or non-contact dependentmanner: in the former (pericellular proteolysis) the proteolytic enzymes are recruited
123

Modelling cell migration strategies in the extracellular matrix 513
(c) cell chains(a) amoeboid (b) mesenchymal
Fig. 1 Schematic of different types of individual cell migration. a In amoeboid migration, cells squeezethrough the matrix but have negligible impact on its overall structure. b Mesenchymal migration involvessignificant matrix remodelling, leaving a trail of aligned matrix along the cell path. c Cell chains in mesen-chymal populations. Adapted from [18]
to focal adhesions at the leading edge of a migrating cell where they act on those fibresdirectly in its path. In non-contact dependent proteolysis, enzymes are secreted by thecell into the extracellular environment where they diffuse and degrade distant matrix.As a result of remodelling, a matrix defect arises (or cell-path) [20,41,60] comprised offibres predominantly oriented along the path of cell migration, Fig. 1b. The functionalrole (if any) of such cell-paths is unclear: imaging studies reveal that cells frequentlymigrate onto and along previously formed paths, occasionally forming “cell-chains”,Fig. 1c. Migrating cell-chains have been observed in a variety of biological processes:the formation of chains during the early stages of neural crest cell migration [31,33]suggests a potential role in embryonic patterning whilst their appearance in cancerpopulations [20] indicates a capacity to facilitate tumour spread through the creationof invasive pathways.
Amoeboid migration, named because of its mechanistic similarity to the movementof cellular slime molds, occurs in T-lymphocytes [59], certain carcinoma cells [56]and stem cells [17]. Cells form only transient contacts with the ECM and migrate bymaking frequent changes in direction and shape deformation (see Fig. 1a) to squeezethrough small holes in the matrix [59], thereby dispensing of the need for proteolyticaction and permitting faster migration speeds, between 2 and 30 µm/min.
As observed above, the ECM is known to impart directional information to cellsthrough their tendency to follow individual fibrils, a process known as contact gui-dance [16,24]. Contact guidance has been observed in both amoeboid (e.g. [59]) andmesenchymal cell populations [24] and has been proposed to play an important rolein cell migration in development and the adult. A number of studies have implicatedcontact guidance during the patterning of the pectoral fin bud of the teleost embryo:upon migrating into the fin, cells become contact-aligned with the highly organisedfibril structure which guides them to their final location [62,53]. Contact guidance hasalso been suggested as playing a role in the in vivo guidance of neural crest cells [43]whilst in the adult it has been demonstrated by both immune cells [58] and fibroblastcells responsible for tissue repair following injury [24].
1.2 Previous modelling
The effects of interactions between cell movement and the organisation/alignment ofan underlying matrix have been investigated by a number of previous authors applied
123

514 K. J. Painter
to various biological systems. The model developed in this paper builds on earlierwork in [27]. There, a transport model was formulated to describe mesenchymalmigration of cells in tissues, incorporating the twin actions of contact guidance/fibrefollowing by the cells and matrix remodelling. Hillen focusses on the correspondingmacroscopic (i.e. diffusion) limit for the various transport models above, the impactof contact guidance leading to an anisotropic diffusion tensor that depends on theunderlying structure of the ECM. An extension of the modelling in [27] to incorporatecell–cell interactions and chemotaxis has been presented in [8]. In the modellingpresented later, numerical simulations of an underlying transport model similar to thatproposed in [27] are conducted and their significance for different types of biologicalmovement discussed. A transport-based model for contact guidance has also beendeveloped and studied by Dickinson [14,15]. Barocas and Tranquillo developed the“anisotropic biphasic theory” by considering mass and momentum balance equationsbetween tissue-cell phase and interstitial fluid phase that incorporate cell and fibrealignment [5].
A number of models incorporating contact guidance have been developed by Sher-ratt, Dallon and others in the context of understanding fibroblast–ECM interactionsduring scarring/wound healing. These works can be split into two groups. In thefirst, hybrid discrete–continuous models were investigated in which fibroblasts weremodelled as discrete objects whilst the matrix and other factors (e.g. chemoattractants)were modelled as continuous variables [12,13,38]. Contact guidance was introducedby assuming the fibroblast cells orient according to the underlying collagen matrix(modelled as a single dominant angle). In the second set of papers, continuum descrip-tion were considered for both the cells and the matrix using either reaction-diffusionequations [45,46] or integro-pde systems [10,11]. The latter have also been developedto model the alignment of objects (such as fibroblast cells), however here the align-ment was initiated through direct cell–cell contact rather than contact guidance witha matrix [39,40].
1.3 Outline
In this paper a model is described for different types of cell migration in the ECM.The aim of the paper is to address the following questions.
− How does the architecture of the ECM alter the macroscopic organisation of cellsmigrating through contact guidance?
− How does feedback between contact-guided migration and matrix reorganisationby the cells alter patterning? In particular, can the mesenchymal “cell-chains” begenerated through these actions alone, or are additional mechanisms necessary(e.g. cell–cell adhesion)?
− How do the interactions between cells and the aligned structure of the ECM alterpatterns of infiltration during tumour invasion?
In Sect. 2 we develop a model based on the transport equation approach recently develo-ped in [27]. In Sect. 3, we apply this model to amoeboid migration and demonstrate thata structured ECM can induce cell aggregation and organisation. In Sect. 4 we modelmesenchymal migration by adding matrix remodelling by the cells. The combined
123
Modelling cell migration strategies in the extracellular matrix 515
action of contact guidance and matrix remodelling is shown to lead to cell-chainsand network pattern formation. In Sect. 5 a simple model is developed to describedtumour invasion into a structured ECM. The type of cell migration and the alignmentof the ECM are demonstrated to have a potentially large impact on the rate and man-ner of tumour invasion, leading to “fingering” type behaviour. Finally, we discuss thefindings in the context of physiological examples of cell migration.
2 Modelling
It is assumed that cells migrate as a “run and tumble” process in which periods ofrunning with fixed orientation are punctuated at discrete times by an instantaneoussensing of the environment and reorientation. The paradigm for this type of motionis the flagellar bacteria E. coli [1], yet it can reasonably approximate other typesof motion, such as eukaryotic cell movement, through the specific functional formsdescribing the speed and turning of cells. In principle, any number of external factorscan be incorporated into the sensing, for example tactic cues. The focus here will beon the influence of the ECM.
The model is formulated and solved in the form of a transport equation in whichcontinuous cell distributions of varying velocities are tracked in space. Reorientationsbetween velocities are selected according to a turning function/probability distributiondepending on the environmental variables. In cell movement, this approach has beenextensively utilised to model chemotaxis (e.g. see [26,47]). The continuous trans-port equation approach adopts a middle ground between microscopic/discrete cellapproaches and a truly macroscopic representation: while the model is formulatedusing a microscopic description for cell motion, the outputs are macroscopic proper-ties such as cellular densities and matrix distributions. This has led to their descriptionas “mesoscopic” in the literature [27]. Furthermore, the continuous nature of the equa-tions offers a greater degree of analytical tractability than a discrete approach.
2.1 General model
We consider the motion of an individual cell in some space Ω to follow a velocity-jump process [47], that is, cells move by smooth running interrupted at discrete timesby an instantaneous reorientation. In general, the choice of a new velocity and theaverage runtime between reorientations will depend on environmental factors. Thevelocity-jump process is formulated as follows
c(x, v, t)t + ∇ · vc(x, v, t) = −µc(x, v, t)+ µ
∫
V
T (v, v′)c(x, v′, t) dv′
m(x, φ, t)t = −∇Jm + f (c,m)
In the first equation above, c(x, v, t) can be interpreted either as the probability distri-bution for a cell to be at position x and velocity v at time t or, if it is assumed that thereare no direct cell–cell interactions, as the density of cells at position x with velocity v.
123
516 K. J. Painter
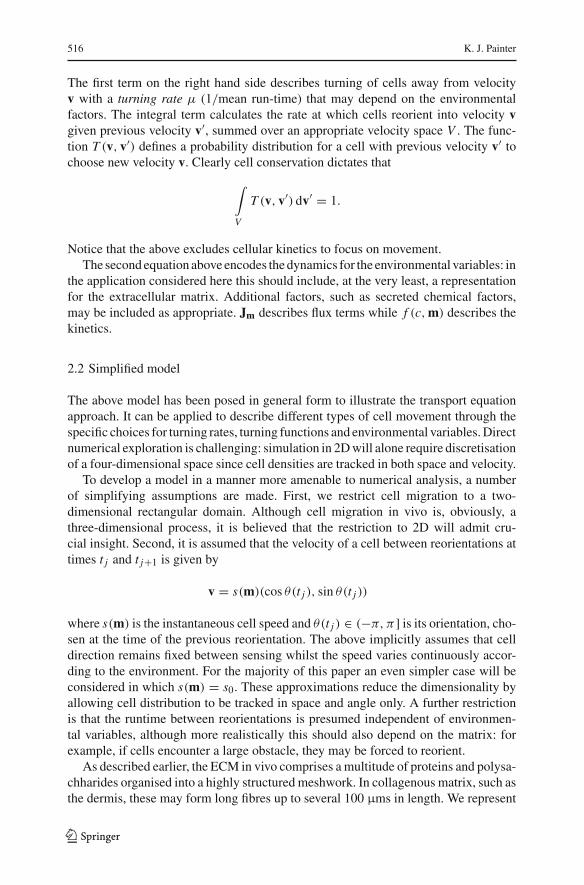
The first term on the right hand side describes turning of cells away from velocityv with a turning rate µ (1/mean run-time) that may depend on the environmentalfactors. The integral term calculates the rate at which cells reorient into velocity vgiven previous velocity v′, summed over an appropriate velocity space V . The func-tion T (v, v′) defines a probability distribution for a cell with previous velocity v′ tochoose new velocity v. Clearly cell conservation dictates that
∫
V
T (v, v′) dv′ = 1.
Notice that the above excludes cellular kinetics to focus on movement.The second equation above encodes the dynamics for the environmental variables: in
the application considered here this should include, at the very least, a representationfor the extracellular matrix. Additional factors, such as secreted chemical factors,may be included as appropriate. Jm describes flux terms while f (c,m) describes thekinetics.
2.2 Simplified model
The above model has been posed in general form to illustrate the transport equationapproach. It can be applied to describe different types of cell movement through thespecific choices for turning rates, turning functions and environmental variables. Directnumerical exploration is challenging: simulation in 2D will alone require discretisationof a four-dimensional space since cell densities are tracked in both space and velocity.
To develop a model in a manner more amenable to numerical analysis, a numberof simplifying assumptions are made. First, we restrict cell migration to a two-dimensional rectangular domain. Although cell migration in vivo is, obviously, athree-dimensional process, it is believed that the restriction to 2D will admit cru-cial insight. Second, it is assumed that the velocity of a cell between reorientations attimes t j and t j+1 is given by
v = s(m)(cos θ(t j ), sin θ(t j ))
where s(m) is the instantaneous cell speed and θ(t j ) ∈ (−π, π ] is its orientation, cho-sen at the time of the previous reorientation. The above implicitly assumes that celldirection remains fixed between sensing whilst the speed varies continuously accor-ding to the environment. For the majority of this paper an even simpler case will beconsidered in which s(m) = s0. These approximations reduce the dimensionality byallowing cell distribution to be tracked in space and angle only. A further restrictionis that the runtime between reorientations is presumed independent of environmen-tal variables, although more realistically this should also depend on the matrix: forexample, if cells encounter a large obstacle, they may be forced to reorient.
As described earlier, the ECM in vivo comprises a multitude of proteins and polysa-chharides organised into a highly structured meshwork. In collagenous matrix, such asthe dermis, these may form long fibres up to several 100 µms in length. We represent
123
Modelling cell migration strategies in the extracellular matrix 517
the matrix in the model by condensing it into a single generic variable m(x, φ, t)representing a fibrous ECM in which the matrix at each point in space is recorded as adistribution of fibres of varying orientation. Fibres are assumed not to have a specificpolarity (i.e. there is no “up” or “down” a matrix fibre) and thus the angular distributionfor matrix varies between −π and 0. At present, no further environmental variablesare considered. In vivo, the situation is more complex. For example, interactions bet-ween cells and the matrix are mediated by a variety of secreted and membrane boundmolecules, such as proteolytic enzymes, while guidance cues including chemotacticand haptotactic factors also play a role in cell orientation.
For simplicity, it is assumed that the cell action on the matrix is local, that is we takeJm = 0. This can be partially justified if the major contribution to remodelling is viapericellular proteolysis whereby enzyme action is mediated at the cell membrane [41].However, it is clearly a simplification of the true situation where cells can both secretediffusible enzymes which act over a longer range and alter the matrix nonlocallythrough mechanical forces. As above, the simplification here is intended to limit themodel to a manageable form and understand how interactions between cell guidanceby the matrix and matrix remodelling by the cells shape cell movement pathways.Clearly, a focus for future modelling work should be a more realistic representationof the nonlocal interactions between cells and the matrix.
Under the various assumptions above, the equations are reduced to
c(x, θ, t)t + ∇ · vc(x, θ, t) = −µc(x, θ, t)+ µ
π∫
−πT (θ, θ ′)c(x, θ ′, t) dθ ′, (1)
m(x, φ, t)t = f (c,m). (2)
where c(x, θ, t) describes the density of cells with orientation θ ∈ (−π, π ] andm(x, φ, t) describes the distribution of matrix fibres for φ ∈ (−π, 0]. It is assu-med that cells are restricted to a 2D rectangular domain Ω = [0, Lx ] × [0, L y] withperiodic boundary conditions, except where stated. Note that cell conservation nowrequires
π∫
−πT (θ, θ ′) dθ ′ = 1.
2.3 Numerical methods
A detailed investigation into the numerical scheme will be presented separately andwe confine ourselves here to a brief summary of the method invoked. In the numeri-cal simulations that follow, a Method of Lines approach is used to solve the genericequations (1–2) in which spatial and angular terms are initially discretised to yielda large system of time-dependent ODEs (the MOL-ODEs). Spatial terms compriseof an advective term representing cell movement and are approximated in conser-vative form using a finite volume method. To ensure reasonable spatial accuracy, the
123

518 K. J. Painter
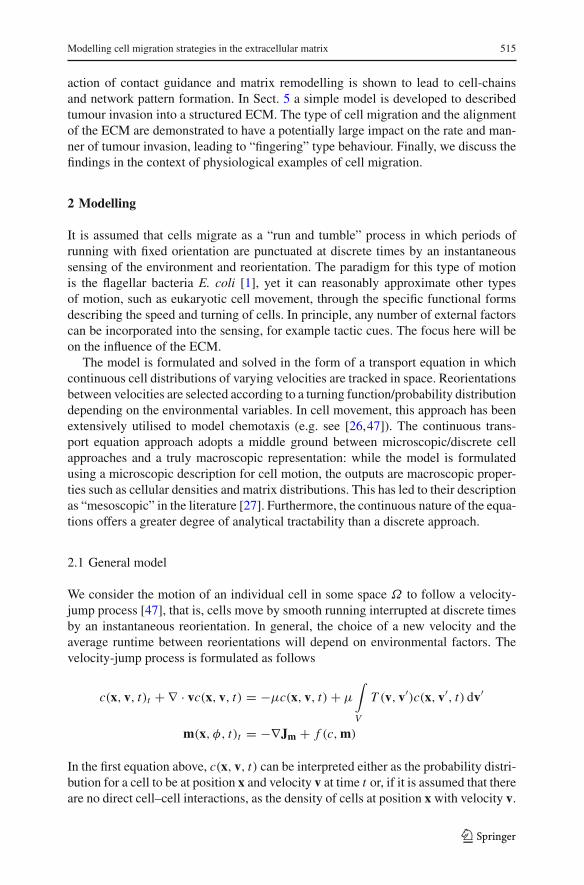
Table 1 List of functions andtheir interpretations employedin data representation
Notation/definition Interpretation
c = ∫ π−π c(x, θ, t)dθ Macroscopic cell density
m = ∫ 0−π m(x, φ, t)dφ Macroscopic matrix density
Θ = arg −→c (x, t) Dominant local cell orientation
Φ = arg −→m (x, t) Dominant local matrix orientation
cL = ‖−→c (x, t)‖ Strength of local cell alignment
mL = ‖−→m (x, t)‖ Strength of local matrix alignment
discretisation of the advective term utilises a third-order upwinding scheme augmentedwith a flux-limiting scheme to ensure positivity of solutions. Angular terms compriseof an integral term (representing cell-turning) which is approximated by discretisationin angle and employing a trapezoidal scheme. Integration in time of the MOL-ODEsystems has been performed using both explicit and implicit schemes. The explicitscheme (forward euler) is capable of handling the large system of equations genera-ted by the spatial/angular discretisation yet necessitates a small time step for stableand accurate solution. To provide an efficient and robust scheme capable of solvingwhat may, in general, be stiff systems of equations we have also used the ROWMAPstiff systems integrator [57]. Similar approaches to those described above have beendeveloped in other models of cell movement (e.g. see [23]). Tests using the two timeiteration methods yield equivalent results and simulations have been performed acrossa range of discretisation steps.
2.4 Representation of the data
Despite the number of simplifying assumptions, Eqs. (1)–(2) are capable of producinga vast amount of data, including cell/matrix density distributions in 2D space, angleand time. To portray this information, we define the following “observables”, listed inTable 1.
− Macroscopic cell/matrix densities, the total density at x summed across allcell/matrix orientations. For the cells,
c(x, t) =π∫
−πc(x, θ, t) dθ
with a similar definition for the matrix.− Cell/matrix alignment, a measure of the direction and strength of cell/matrix ali-
gnment at x. For the cells, this is computed as the vector
−→c (x, t) =π∫
−π(c(x, θ, t) cos θ, c(x, θ, t) sin θ) dθ. (3)
123

Modelling cell migration strategies in the extracellular matrix 519
The above is represented graphically by plotting its argument, Θ(x, t)(∈ (−π, π ]),and magnitude, cL(x, t) = ‖−→c ‖. This process, while providing information on the netmovement of the population, inevitably oversimplifies the characteristic cell movementpatterns. For example, for symmetric cell distributions (e.g. cells migrating uniformlyin all directions or equal cell densities migrating in opposite directions) we must have−→c = 0. In any such cases, an alternative measure will be employed to indicate thedominant orientations of the cells.
For the matrix alignment a similar quantity −→m (x, t) is obtained, modified to take thebidirectional nature of the fibres into account (i.e. their distribution lies only between−π and 0). First, we rescale by introducing the variable α = 2φ + π and calculate
π∫
−π(m(x, α, t) cosα,m(x, α, t) sin α) dα.
The above quantity yields a vector with argument A(x, t) lying in (−π, π ] due to therescaling of φ. To obtain the vector with the appropriate argument between −π and0 we perform the reverse scaling using A = 2Φ + π to obtain the matrix alignmentvector −→m (x, t) = mL(cosΦ, sinΦ).
To demonstrate the general suitability of this measure, we consider the two matrixdistributions in Fig. 2b and c. The matrix in (b) is randomly distributed in (−π, 0],normalised such that m = 1. The dominant matrix orientation is determined to beΦ =−3.04 radians, although for different sets of random initial data this varies uniformlyin (−π, 0]. The strength of matrix alignment mL is small (O(10−3)), indicative thatall matrix orientations are almost equally represented. For the matrix distribution in(c), the macroscopic matrix density is the same as above, m = 1, however now theorientation of the fibres is such thatΦ = −π/4 while mL is large (≈0.8), representinga highly aligned matrix.
3 Rules for “amoeboid” migration
3.1 Model formulation
Amoeboid migration is carried out by hematopoietic stem cells [17], T-cells [59]and certain cancer cells [56]. Migrating amoeboid cells can squeeze through smallholes in the matrix, thereby dispensing of the need to degrade it by proteolysis [59]:experimental studies indicates the matrix is only transiently distorted as cells squeezethrough it and the ECM rapidly returns to its previous state. The brief contact betweenthe ECM and cells permits rapid cell movement (2–30 µm/min) and cells demonstratefrequent turns, in part due to their need to circumnavigate large obstacles in the matrix(i.e. where they are unable to squeeze through).
From the perspective here, amoeboid-style migration offers the opportunity to studyhow the ECM can dictate global cell migration pathways: the “amoeboid-type” cellswe describe in the model are assumed to actively respond to the matrix through their
123

520 K. J. Painter
1/12
1/122/12
2/12
3/12
3/12
(a) Contact guidance
(b)
(c)
Fig. 2 a Schematic illustrating the modelling of contact guidance. The fractions give the probabilitiesof migrating in each of the indicated directions for the underlying matrix, based on Eq. (4) with b = 1.b, c The two types of local angular distribution of matrix fibres employed in the amoeboid model simulations.In c the dominant local matrix orientation is −π/4
tendency to follow fibres (i.e. contact guidance), but do not fundamentally alter itsstructure. The model is based on the following set of assumptions:
(A1) negligible matrix remodelling,(A2) frequent turning and high cell speeds,(A3) contact guided migration along fibres.
(A1) implies that matrix dynamics can be ignored and therefore the ECM is prescribedthrough its initial distribution. (A2) dictates the parameters for the cell speed andturning rate in the transport models: default values for these parameters are listedin Table 2. In the initial study it is assumed for simplicity that cells move with aconstant speed s0 and hence the velocity for cells migrating in direction θ is givenby v = s0(cos θ, sin θ)—more realistically the speed will be a function of the matrix(e.g. see [22,50]).
(A3) dictates the choice of probability distribution for selecting a new cell directionand, to model contact guidance, it is assumed that cells bias their direction accordingto the local distribution of m (see Fig. 2a):
T (θ, θ ′) =
⎧⎪⎪⎨⎪⎪⎩
1 − b
2π+ b
m(θ)
2mif θ ∈ (−π, 0]
1 − b
2π+ b
m(θ − π)
2mif θ ∈ (0, π ]
(4)
The above takes into account that fibres are bi-directional and cells are unable toresolve between “up” and “down” a fibre. b ∈ [0, 1] is a parameter reflecting thedegree to which random effects and contact guidance bias the choice of direction. Astraightforward calculation shows that the above satisfies the cell conservation condi-tion, i.e.
∫ π−π T dθ = 1. The above, with the simple addition of the random component,
is based on the assumptions in [27]. This relatively simple model for contact guidanceis based on phenomological grounds, rather than a precise mechanistic/biochemical
123
Modelling cell migration strategies in the extracellular matrix 521
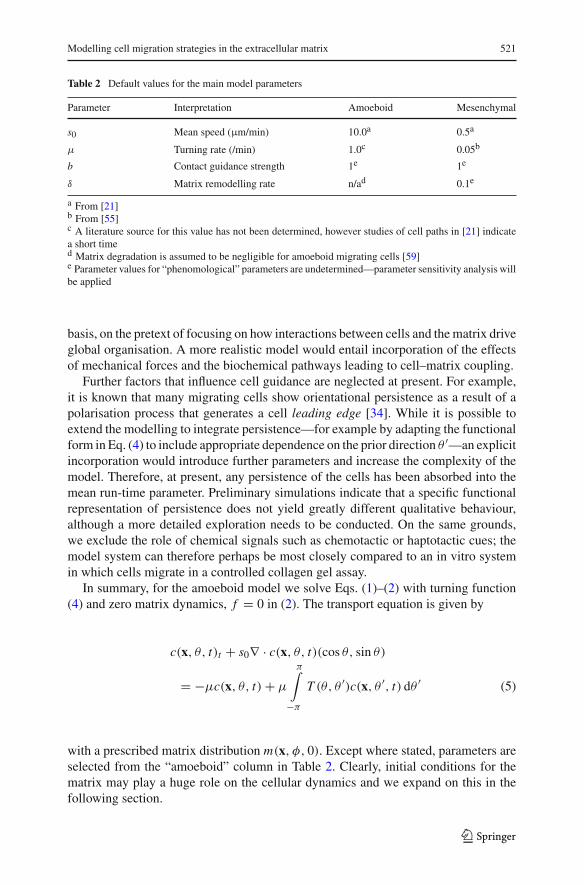
Table 2 Default values for the main model parameters
Parameter Interpretation Amoeboid Mesenchymal
s0 Mean speed (µm/min) 10.0a 0.5a
µ Turning rate (/min) 1.0c 0.05b
b Contact guidance strength 1e 1e
δ Matrix remodelling rate n/ad 0.1e
a From [21]b From [55]c A literature source for this value has not been determined, however studies of cell paths in [21] indicatea short timed Matrix degradation is assumed to be negligible for amoeboid migrating cells [59]e Parameter values for “phenomological” parameters are undetermined—parameter sensitivity analysis willbe applied
basis, on the pretext of focusing on how interactions between cells and the matrix driveglobal organisation. A more realistic model would entail incorporation of the effectsof mechanical forces and the biochemical pathways leading to cell–matrix coupling.
Further factors that influence cell guidance are neglected at present. For example,it is known that many migrating cells show orientational persistence as a result of apolarisation process that generates a cell leading edge [34]. While it is possible toextend the modelling to integrate persistence—for example by adapting the functionalform in Eq. (4) to include appropriate dependence on the prior direction θ ′—an explicitincorporation would introduce further parameters and increase the complexity of themodel. Therefore, at present, any persistence of the cells has been absorbed into themean run-time parameter. Preliminary simulations indicate that a specific functionalrepresentation of persistence does not yield greatly different qualitative behaviour,although a more detailed exploration needs to be conducted. On the same grounds,we exclude the role of chemical signals such as chemotactic or haptotactic cues; themodel system can therefore perhaps be most closely compared to an in vitro systemin which cells migrate in a controlled collagen gel assay.
In summary, for the amoeboid model we solve Eqs. (1)–(2) with turning function(4) and zero matrix dynamics, f = 0 in (2). The transport equation is given by
c(x, θ, t)t + s0∇ · c(x, θ, t)(cos θ, sin θ)
= −µc(x, θ, t)+ µ
π∫
−πT (θ, θ ′)c(x, θ ′, t) dθ ′ (5)
with a prescribed matrix distribution m(x, φ, 0). Except where stated, parameters areselected from the “amoeboid” column in Table 2. Clearly, initial conditions for thematrix may play a huge role on the cellular dynamics and we expand on this in thefollowing section.
123

522 K. J. Painter
3.2 Cell guidance under varying ECM architecture
3.2.1 Initial matrix distribution
The structure of the ECM varies considerably within a single tissue or from one tissueto another. For cells exhibiting contact guidance, this may have considerable impact onglobal movement patterns and this is investigated through simulation of the amoeboidmodel. We consider the following generic forms:
(E1) an unaligned or random ECM, i.e. no dominant fibre orientation, see Fig. 3 (a1);(E2) a globally aligned ECM, i.e. fibres predominantly oriented in a single direction,
Fig. 3 (b1);(E3) mixed ECM (combinations of (E1) and (E2)) Fig. 3 c1, d1;(E4) radially oriented ECM, Fig. 3e1.
All of the above matrix types are relevant to different tissues in vivo. Studies of extracel-lular matrix during embryonic development shows a high degree of organisation: forexample, the globally aligned structure of the tail fin in fish [53,62] and the structureof the ECM surrounding the neural crest [43]. In adults, the matrix surrounding theantigen-processing domains inside Peyer’s patches (part of the lymphoid tissue) ishighly organised with matrix fibres radiating out from the centre [44]. Transitions bet-ween different types of ECM occur in numerous examples. For example, ultrastructuralstudies of articular cartilage reveal the matrix is organised into a layered structure: inthe outer (tangential) layer, matrix is highly aligned with the fibres running parallel tothe articular surface, in the intermediate layer the matrix has a more isotropic structurewith little alignment of the fibres whilst in the deeper matrix fibres are again aligned,but this time orthogonally to the articular surface [29]. Highly varying ECM structurecan also be observed in sections of the dermal skin layer [54]. Dermal skin undergoeschanges during aging: while the matrix of younger dermal skin is relatively dense, thenumber of crosslinks decreases with age [30] as it takes on an increasingly tortuousnature.
To describe the various matrix types we must specify appropriate angular distribu-tions of the fibres. We assume no spatial variation of the macroscopic matrix density,normalised to m(x, 0) = 1, corresponding to a uniform matrix density. The distributionof fibres at x is assumed to belong to one of the following types:
− a random local distribution, in which fibres are uniformly distributed in (−π, 0],subject to a small angularly random perturbation (Fig. 2a);
− an aligned local distribution in which fibres are distributed with a Gaussian-typecurve centred on a predefined dominant local matrix orientation (Fig. 2b).
We plot the data to describe the various matrix types (E1)–(E4) in Fig. 3a2–e2. Repre-sented in the plots are the dominant local matrix orientation (Φ), indicated by the line,and the strength of matrix alignment (mL ), indicated by the grayscale.
Note that the generic phenotypes (E1)–(E4) may equally be represented with otherdistributions: numerical simulations indicate that only the quantitative behaviour ofsolutions is affected under such modifications. Situations where the matrix has a spe-cific geometric structure can also be modelled by appropriate alteration of the local
123
Modelling cell migration strategies in the extracellular matrix 523
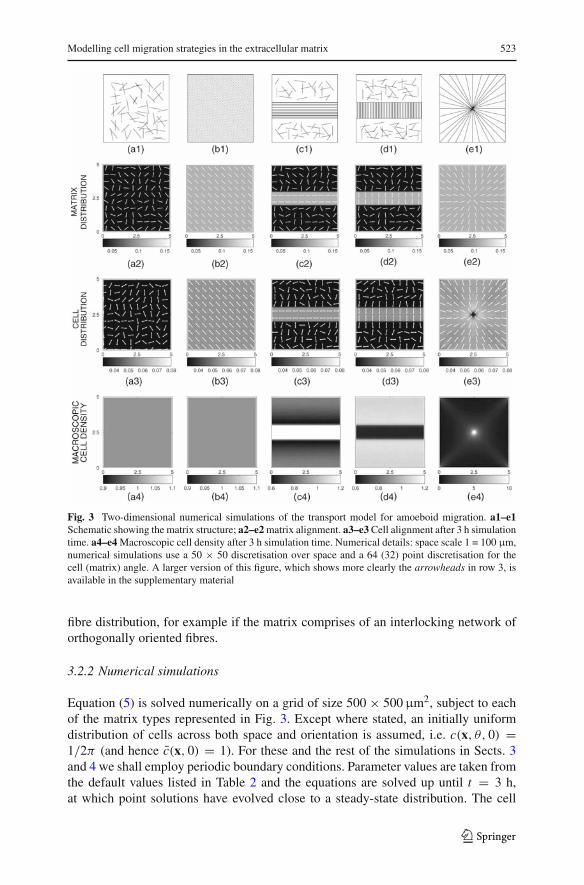
Fig. 3 Two-dimensional numerical simulations of the transport model for amoeboid migration. a1–e1Schematic showing the matrix structure; a2–e2 matrix alignment. a3–e3 Cell alignment after 3 h simulationtime. a4–e4 Macroscopic cell density after 3 h simulation time. Numerical details: space scale 1 = 100 µm,numerical simulations use a 50 × 50 discretisation over space and a 64 (32) point discretisation for thecell (matrix) angle. A larger version of this figure, which shows more clearly the arrowheads in row 3, isavailable in the supplementary material
fibre distribution, for example if the matrix comprises of an interlocking network oforthogonally oriented fibres.
3.2.2 Numerical simulations
Equation (5) is solved numerically on a grid of size 500 × 500 µm2, subject to eachof the matrix types represented in Fig. 3. Except where stated, an initially uniformdistribution of cells across both space and orientation is assumed, i.e. c(x, θ, 0) =1/2π (and hence c(x, 0) = 1). For these and the rest of the simulations in Sects. 3and 4 we shall employ periodic boundary conditions. Parameter values are taken fromthe default values listed in Table 2 and the equations are solved up until t = 3 h,at which point solutions have evolved close to a steady-state distribution. The cell
123
524 K. J. Painter
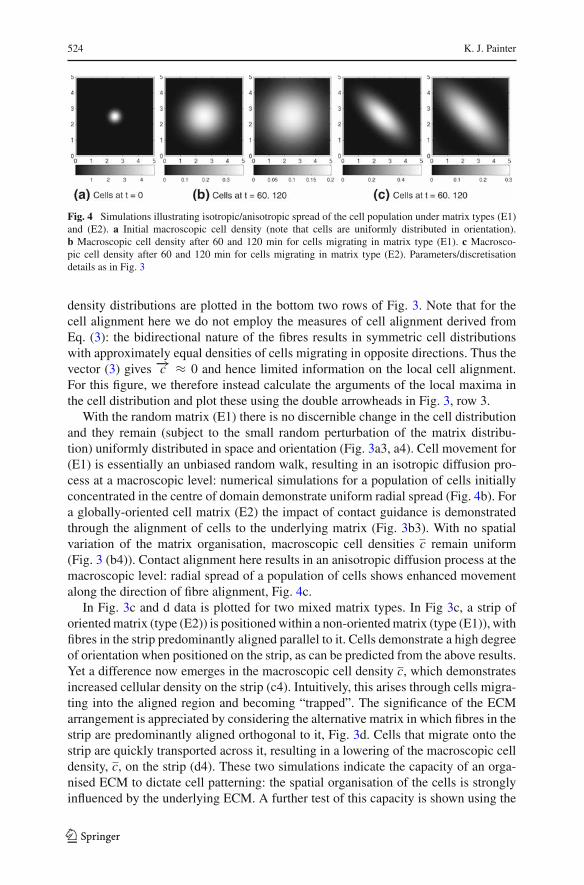
Fig. 4 Simulations illustrating isotropic/anisotropic spread of the cell population under matrix types (E1)and (E2). a Initial macroscopic cell density (note that cells are uniformly distributed in orientation).b Macroscopic cell density after 60 and 120 min for cells migrating in matrix type (E1). c Macrosco-pic cell density after 60 and 120 min for cells migrating in matrix type (E2). Parameters/discretisationdetails as in Fig. 3
density distributions are plotted in the bottom two rows of Fig. 3. Note that for thecell alignment here we do not employ the measures of cell alignment derived fromEq. (3): the bidirectional nature of the fibres results in symmetric cell distributionswith approximately equal densities of cells migrating in opposite directions. Thus thevector (3) gives −→c ≈ 0 and hence limited information on the local cell alignment.For this figure, we therefore instead calculate the arguments of the local maxima inthe cell distribution and plot these using the double arrowheads in Fig. 3, row 3.
With the random matrix (E1) there is no discernible change in the cell distributionand they remain (subject to the small random perturbation of the matrix distribu-tion) uniformly distributed in space and orientation (Fig. 3a3, a4). Cell movement for(E1) is essentially an unbiased random walk, resulting in an isotropic diffusion pro-cess at a macroscopic level: numerical simulations for a population of cells initiallyconcentrated in the centre of domain demonstrate uniform radial spread (Fig. 4b). Fora globally-oriented cell matrix (E2) the impact of contact guidance is demonstratedthrough the alignment of cells to the underlying matrix (Fig. 3b3). With no spatialvariation of the matrix organisation, macroscopic cell densities c remain uniform(Fig. 3 (b4)). Contact alignment here results in an anisotropic diffusion process at themacroscopic level: radial spread of a population of cells shows enhanced movementalong the direction of fibre alignment, Fig. 4c.
In Fig. 3c and d data is plotted for two mixed matrix types. In Fig 3c, a strip oforiented matrix (type (E2)) is positioned within a non-oriented matrix (type (E1)), withfibres in the strip predominantly aligned parallel to it. Cells demonstrate a high degreeof orientation when positioned on the strip, as can be predicted from the above results.Yet a difference now emerges in the macroscopic cell density c, which demonstratesincreased cellular density on the strip (c4). Intuitively, this arises through cells migra-ting into the aligned region and becoming “trapped”. The significance of the ECMarrangement is appreciated by considering the alternative matrix in which fibres in thestrip are predominantly aligned orthogonal to it, Fig. 3d. Cells that migrate onto thestrip are quickly transported across it, resulting in a lowering of the macroscopic celldensity, c, on the strip (d4). These two simulations indicate the capacity of an orga-nised ECM to dictate cell patterning: the spatial organisation of the cells is stronglyinfluenced by the underlying ECM. A further test of this capacity is shown using the
123

Modelling cell migration strategies in the extracellular matrix 525
matrix type (E5) in which fibres are aligned radially. Simulations (Fig. 3e) indicatethat the cell population can be induced to colocalise at the centre of the grid solelythrough the action of matrix fibril following, i.e. there is no necessity for an additionalorientational cue, such as a diffusible chemoattractant source.
Alterations in the cell speed, s0, and turning rate, µ, alter the timescale of patter-ning and the quantitative distribution of cells, but do not impact on their qualitativebehaviour. Alterations in the value of b have a greater impact on the patterns: forb = 0 there is no contact guidance of the cells and movement is isotropic diffusion.Subsequently, no global organisation of the cell population occurs.
These simulations demonstrate the ability of a structured ECM to dictate and orga-nise global cell movement patterns. Clearly, this may have important implications in,for example, the coordinated movements of early embryonic populations, the migra-tory pathways of immune cells or the directional spread of invasive tumours. Thelatter will be studied in greater detail in Sect. 5 while the former is expanded on in thediscussion.
4 Rules for “mesenchymal” migration
4.1 Model rules
The simulations in Sect. 3 indicate a potentially crucial role of the ECM as a deter-minant of cell organisation. The absence of matrix remodelling, however, means theinteraction is strictly one-way. The mesenchymal class of movement requires matrixremodelling by the cells, thereby introducing feedback between cells and their envi-ronment. In this section the modelling is extended to investigate the impact of thiscoupling on macroscopic cell organisation. The following generic rules define themodel for “mesenchymal”-style migration:
(M1) contact guidance along matrix fibres,(M2) slow cell speeds and infrequent turning,(M3) extensive matrix remodelling.
The first two dictate the choice of cell movement turning functions and parameters:contact guidance has been demonstrated for a variety of cell types that adopt mesenchy-mal migration (e.g. [24]). To describe (M1) the same functional forms are employedas in Sect. 3, namely the turning function (4) is assumed in Eq. 2. (M2) dictates speedand turning rates: except where stated the default values listed in Table 2 are employed.It is known that mesenchymal cells demonstrate a high degree of persistence in theirdirection of movement, however, as stated earlier, specific functional representationof this behaviour is not considered and its effect is absorbed into the mean turningrate.
Matrix remodelling comprises multiple processes, including degradation of fibresvia proteolytic enzymes, the production and assembly of new matrix componentsand the rearrangement of fibres through mechanical forces. Studies from migratingcarcinoma cells in 3D collagen gels have revealed the formation of “migration tracks”:re-organised pathways along which the matrix fibres are aligned in the direction ofcell migration [20,41,60], see Fig. 1. The functional role of these paths is unknown,
123
526 K. J. Painter
however nearby cells have been observed to realign and move onto the trails, resultingin the formation of moving “cell-chains” [20]. It is currently unclear as to whetherthese are generated solely through the reshaping of the environment by the cells orwhether direct cell–cell interactions are also required (e.g. through filopodial contactsor cell–cell adhesion). A use of the modelling here will be to study whether matrixremodelling and contact guidance are sufficient for the formation of the cell-chains.
Degradation of the ECM occurs through the action of proteolytic enzymes, such asMMPs, which can act in either a cell-localised or cell-nonlocalised manner. In the for-mer, proteolytic enzymes are recruited to the membrane at the cell leading edge [41],thereby focusing proteolysis to the fore of the cell. In the latter, proteolytic enzymes aresecreted into the environment as diffusible molecules, resulting in unfocused ECMdestruction. The synthesis and assembly of new matrix components is essential inembryonic growth, maintaining the structure of healthy tissue and repairing woundedtissue. Matrix components are secreted into the extracellular space as individual colla-gen proteins by cells such as fibroblasts, where they assemble to form the long fibrilsthat characterise much of the ECM. Although it is possible for the individual collagenproteins to self organise into collagen fibres, cells themselves may play a significantrole in their assembly (see [25]).
Clearly, matrix remodelling is highly complex and the precise mechanisms involvedwill depend on both the cell type and the physiological context. Here, on the groundsof keeping the modelling both manageable and generic, three relatively simple sets ofmatrix dynamics are considered.
(R1) involves degradation of the matrix as a cell clears matrix fibres ahead of itsmigration path.
(R2) results in a constant macroscopic matrix density, but with locally realignedmatrix fibres. This may be interpreted either as a process in which degradedmatrix components are recycled and reincorporated into the matrix or as one inwhich cells rearrange the fibres through mechanical forces as they pass throughit.
(R3) incorporates both matrix degradation and new matrix assembly and assumesthese are independent. Cells are assumed to actively secrete matrix compo-nents and assemble them along their migration path. The dynamical diffe-rence to case (R2) is that the macroscopic matrix density will be altered as thecells pass through it according to the relative rates of matrix production anddegradation.
4.1.1 Case R1
To set up appropriate equations to describe (R1), the remodelling forms proposed in[27] are adapted. To illustrate this, consider the proteolytic action of a single cell as itmigrates through the matrix. Rather than introduce extra complexity by incorporatingadditional variables, for example proteolytic enzymes, degradation is assumed to actat the cell surface only and its action on the matrix is described phenomenologically.This assumption can be justified on the grounds that proteolytic enzymes are recruitedto specific sites at the cell membrane. For a single cell, moving in direction θ and at
123

Modelling cell migration strategies in the extracellular matrix 527
position x, the degradation rate of fibres with orientation φ is taken to be
− δ (1 − ψ |cos(θ − φ)|) . (6)
The matrix degradation parameter δ in vivo/vitro will depend on cell type, reactionrates in the degradation pathway, proteolytic enzyme concentrations etc, howeverhere we simply take it to be constant. For varying ψ ∈ [0, 1] the above models eitherfocussed or unfocussed proteolytic degradation. The former assumes that degradingproteins are recruited to the front of the cell. As such, cells are more likely to encounterand degrade those fibres orthogonal to their path, thus we set ψ > 0. For unfocussedproteolysis it is assumed cells have equal action on all matrix orientations.
To compute the overall degradation of the matrix, we sum over all cell orientationsto derive type (R1) matrix dynamics:
m(x, φ, t)t = −δ⎛⎝
π∫
−π(1 − ψ |cos(θ − φ)|) c(x, θ, t) dθ
⎞⎠ m(x, φ, t). (R1)
Note that the above takes into account that cells migrating in opposite directions willhave equivalent proteolytic action on the matrix.
4.1.2 Case R2
For (R2) matrix is remodelled but without alteration of the macroscopic density:as mentioned above, this may be interpreted either as a process in which fibres areredistributed during cell migration (for example, as a result of mechanical forcesexerted by the cells on the matrix) or as a process in which the matrix componentsare recycled and reincorporated into the matrix. To derive the matrix dynamics, weconsider the latter. Considering the modelling of proteolytic degradation above andintegrating over all matrix directions, the sum total of matrix degraded at x will be
δσ = δ
0∫
−π
⎛⎝
π∫
−π(1 − ψ |cos(θ − φ)|) c(x, θ, t) dθ
⎞⎠ m(x, φ, t) dφ
To preserve the macroscopic matrix concentration, this matrix is reincorporated accor-ding to the existing matrix distribution. This leads to the type (R2) matrix dynamics:
m(x, φ, t)t = δ
⎛⎝σ −
π∫
−π(1 − ψ |cos(θ − φ)|) c(x, θ, t) dθ
⎞⎠ m(x, φ, y) (R2)
Note that this second form, coupled with the cell equation, is equivalent to that proposedin [27].
123
528 K. J. Painter
4.1.3 Case R3
For the final form of matrix dynamics, it is assumed cells both degrade, produce andplay an active role in assembling the matrix fibres as they migrate. Although matrixcomponents such as collagen are capable of self-organising into fibres, in vivo thematrix proteins are generated intracellularly, transported to secretary sites localised toparticular regions (e.g. the poles) of the cell surface and discharged into cell-controlledextracellular compartments where they are assembled into matrix fibres [1,25]. Thehigh level of regulation by the cell over this process allows matrix to be assembled ina controlled manner, for example, resulting in the construction of fibres along the pathof cell migration.
We incorporate both matrix production and degradation into the model; here, thesetwo processes are assumed to be independent, but in vivo they may well be linkedinternally or externally. Either way, the macroscopic matrix density may shift. Assu-ming that cells assemble the matrix fibres along their path then, coupled with the abovemodelling of proteolysis, we derive the following type (R3) dynamics:
m(x, φ)t = δ (γ (c(x, φ, t)+ c(x, φ + π, t))
−⎛⎝
π∫
−π(1 − ψ |cos(θ − φ)|) c(x, θ, t) dθ
⎞⎠ m(x, φ)
⎞⎠. (R3)
The above takes the bi-directional nature of the matrix into account through theassumption that matrix production depends on the sum c(x, φ, t)+ c(x, φ + π, t).
4.2 Numerics
The simulations from the amoeboid-style model in Fig. 3 indicated that the ECM mayplay a significant role on the global organisation of motile cell populations throughtheir tendency to follow matrix fibres. In the “mesenchymal-style” model, active feed-back between cell movement and matrix remodelling takes place. In this section, theimpact of this feedback is investigated by simulating the transport model for the cells,Eq. (1) with turning function (4) under the various forms for matrix dynamics given by(R1)–(R3).
4.2.1 Matrix dynamics
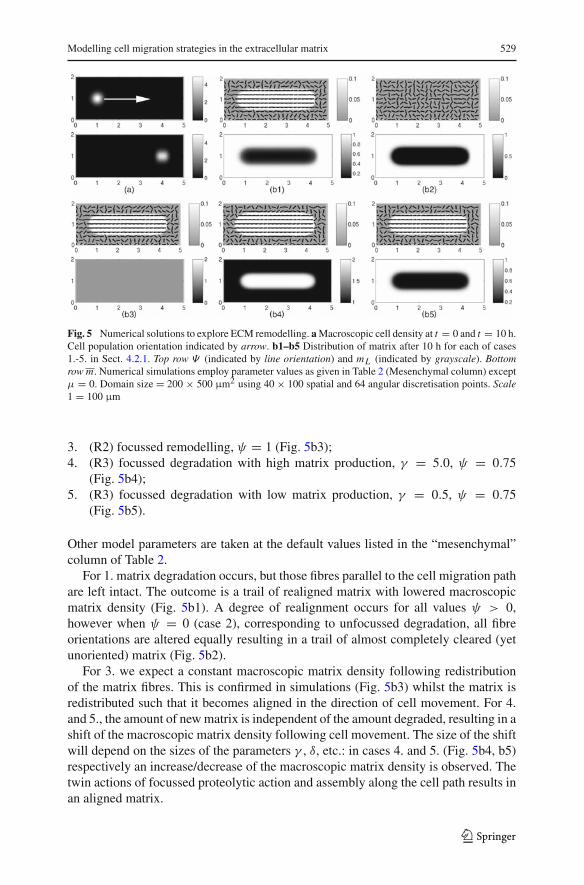
We first address how the different types of matrix dynamics (R1)–(R3) impact on itsrearrangement. A population of cells migrating with fixed direction (i.e. µ = 0)is placed in an initially nonoriented/random matrix (type (E1)). The initial loca-tion, final location and direction of cell movement is indicated in Fig. 5a. Figure 5bshows the alteration of the ECM under the various matrix dynamics for the followingcases:
1. (R1) focussed degradation, ψ = 1 (Fig. 5b1);2. (R1) unfocussed degradation, ψ = 0 (Fig. 5b2);
123
Modelling cell migration strategies in the extracellular matrix 529
Fig. 5 Numerical solutions to explore ECM remodelling. a Macroscopic cell density at t = 0 and t = 10 h.Cell population orientation indicated by arrow. b1–b5 Distribution of matrix after 10 h for each of cases1.-5. in Sect. 4.2.1. Top row Ψ (indicated by line orientation) and mL (indicated by grayscale). Bottomrow m. Numerical simulations employ parameter values as given in Table 2 (Mesenchymal column) exceptµ = 0. Domain size = 200 × 500 µm2 using 40 × 100 spatial and 64 angular discretisation points. Scale1 = 100 µm
3. (R2) focussed remodelling, ψ = 1 (Fig. 5b3);4. (R3) focussed degradation with high matrix production, γ = 5.0, ψ = 0.75
(Fig. 5b4);5. (R3) focussed degradation with low matrix production, γ = 0.5, ψ = 0.75
(Fig. 5b5).
Other model parameters are taken at the default values listed in the “mesenchymal”column of Table 2.
For 1. matrix degradation occurs, but those fibres parallel to the cell migration pathare left intact. The outcome is a trail of realigned matrix with lowered macroscopicmatrix density (Fig. 5b1). A degree of realignment occurs for all values ψ > 0,however when ψ = 0 (case 2), corresponding to unfocussed degradation, all fibreorientations are altered equally resulting in a trail of almost completely cleared (yetunoriented) matrix (Fig. 5b2).
For 3. we expect a constant macroscopic matrix density following redistributionof the matrix fibres. This is confirmed in simulations (Fig. 5b3) whilst the matrix isredistributed such that it becomes aligned in the direction of cell movement. For 4.and 5., the amount of new matrix is independent of the amount degraded, resulting in ashift of the macroscopic matrix density following cell movement. The size of the shiftwill depend on the sizes of the parameters γ , δ, etc.: in cases 4. and 5. (Fig. 5b4, b5)respectively an increase/decrease of the macroscopic matrix density is observed. Thetwin actions of focussed proteolytic action and assembly along the cell path results inan aligned matrix.
123

530 K. J. Painter
4.2.2 Contact guidance and ECM remodelling
In this section the coupling between ECM remodelling and contact guided migrationon the macroscopic cellular and matrix distributions is explored. For the rest of thissection we restrict attention to matrix dynamics (R2) and (R3) since under (R1) matrixis destroyed to negligible levels. Evolution of the model is considered from an almosthomogeneous initial distribution: cells are set at a small random perturbation about1/2π , normalised such that the macroscopic cell density c = 1, while the matrix isset at type (E1) (i.e. random/unoriented).
The numerical simulations of the model are shown in Fig. 6 (Movies showingthe evolution of the cells and matrix can be found in the supplementary material).Simulations illustrate a process of macroscopic pattern formation during which cellsbecome organised into long chains/networks underlain by pathways of aligned ECM.The mean length of the paths is significantly longer than the mean run length of the cells(defined as the speed/turning rate): for example, in the simulation displayed in Fig. 6,paths on the order of several hundred micrometers are visible, as opposed to a meanrun length of 10 µm. An examination of the cell and matrix distributions at selectedspatial points reveals additional information (Fig. 7). For a dense cell chain, location 1in Fig. 6, the matrix is highly aligned in the direction of the cell path (Fig. 7a, circles).The corresponding cell distribution reveals high cell densities moving in oppositedirections along this path (Fig. 7b, circles). On a lower density cell chain, location 2 inFig. 6, the matrix is less strongly aligned along the cell path (Fig. 7a, triangles) and thecorresponding cell distribution shows a much lower number of cells (Fig. 7b). Awayfrom the cell chains, location 3 in Fig. 6, the matrix is relatively unaligned and thereis a very low cell density (Fig. 7, stars). An extended simulation run time indicatesthese patterns persist: there is little difference between the patterns plotted after thefirst day and the patterns after 10 days (data not shown).
Further studies indicate that the twin actions of contact guidance and the reali-gnment of the ECM by the cells are responsible for the formation of the networks:solutions when either b = 0 (zero contact guidance) orψ = 0 (no matrix realignment)fail to generate patterns and the cell/matrix distributions evolve to uniform distribu-tions. Intermediate values of b and ψ allow networks to form, however these developon a slower timescale. Simulations using different matrix dynamics (type (R3)) alsoindicates the possibility of chain formation, see Fig. 8, thus indicating that patterningis not specific to a particular choice of kinetics. A detailed study into the conditionsunder which cell chain formation is possible will be undertaken in future work, howe-ver the investigations reported here indicates the realignment of the matrix fibres inthe path of cell migration is essential.
The simulations from the model suggest that the twin actions of matrix remodel-ling and contact guidance are sufficient for the generation of the network—there is nonecessity for additional cell–cell interactions such as adhesion or filopodial contacts(although these may clearly play a further role in practice—note that a model incor-porating the role of an aligned matrix, cell–cell interactions and chemotaxis has beendeveloped in [8]). The functional significance of the chains is unclear, yet as mentionedearlier they have been observed in both neural crest cell migration and in cancerouscell populations [20,33,31] and the creation of specific migration routes may allow
123

Modelling cell migration strategies in the extracellular matrix 531
Fig. 6 Evolution of the transport model with (R2) matrix dynamics for focussed proteolysis (ψ = 1) andcontact guidance (b = 1). Top two rows Macroscopic cell density c, Third row dominant cell orientation,Θ (green arrow) and strength of alignment cL (grayscale). Fourth row Dominant matrix orientation, Φ(green line) and strength of alignment mL (grayscale). Other parameters taken from Table 2 (mesenchymalcolumn). Discretisation: 100 × 100 space and 64 angle points. Length scale 1 = 100 µm
more efficient shuttling of certain cell types. For example, the radial organisationof the matrix surrounding Peyer’s patches in lymphoid tissues is consistent with thepathways of immune cells, however it is not clear the extent to which it is the cellsthemselves that have organised this matrix. The structure of the remodelled ECMdisplays a certain similarity to the ECM in vivo in tissues such as the dermis, wherecollagen fibres show a degree of local spatial organisation and structure with bundlingand local alignment of the fibres [30]. Note that in the simulations here, the absenceof specific guidance cues (for example, chemoattractants) results in a fairly randomnetwork structure.
123

532 K. J. Painter
−pi −3*pi/4 −pi/2 −pi/4 00
1
2
3
4
5
6123
−pi −pi/2 0 pi/2 pi0
5
10
15123
(a) matrix distribution (b) cell distribution
Fig. 7 Angular distributions of a matrix and b cells after t = 24 h for the labelled positions 1, 2 and 3 inFig. 6
Fig. 8 Demonstrate of chain formation using (R3) matrix kinetics. Solutions plotted after 24 h for para-meters in Table 2 together with ψ = 0.75 and γ = 0.5. Length scale and discretisation details as inFig. 6
4.2.3 Parameter sensitivity analysis
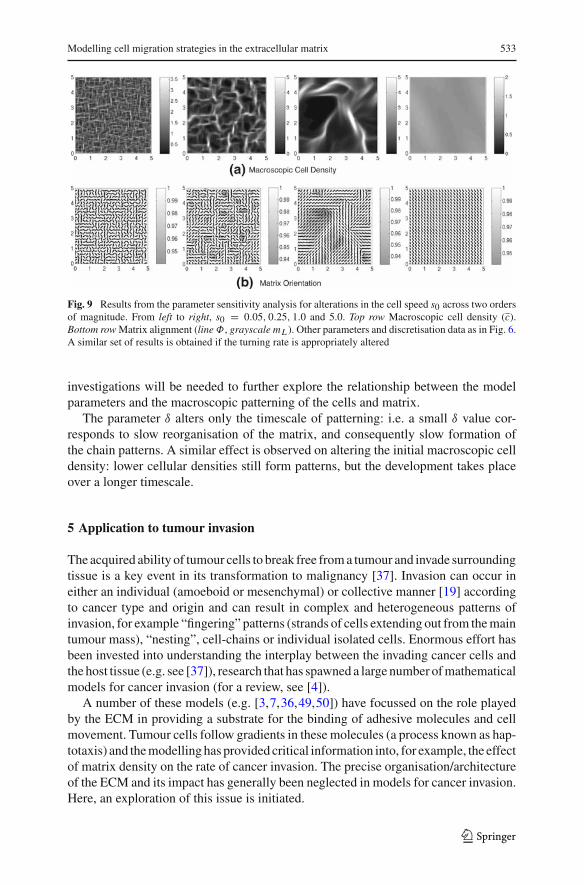
We tested the role of model parameters on the pattern forming capabilities of the model.As mentioned above, both focussed proteolysis and contact guidance are essential forthe formation of the patterns (determined by setting either b or ψ = 0). We nowinvestigate the effect of parameters s0, µ and δ by considering a variation over twoorders of magnitude range centred on the values in Table 2. Matrix dynamics aremodelled using (R2) and we set ψ = 1. Alterations of either the speed, s0, or theturning rate, µ, change properties of the moving cells and have a large impact onthe structure of the trails (Fig. 9). The effect of these two parameters can be linkedtogether by considering the mean run length = speed/turning rate, corresponding tothe average cell path length between reorientation. For a low mean run length (i.e.low cell speeds or high turning rates), chains are extremely short and the underlyingECM evolves with a high degree of spatial variation in its dominant orientation. Asthe mean run length increases, longer trails develop and the underlying ECM shows agreater degree of global organisation (i.e. the dominant local orientation of the matrixpersists over a wide region of space). Increasing the mean run length further results indisappearance of chain formation and the ECM becomes globally oriented. Analytical
123
Modelling cell migration strategies in the extracellular matrix 533
Fig. 9 Results from the parameter sensitivity analysis for alterations in the cell speed s0 across two ordersof magnitude. From left to right, s0 = 0.05, 0.25, 1.0 and 5.0. Top row Macroscopic cell density (c).Bottom row Matrix alignment (lineΦ, grayscale mL ). Other parameters and discretisation data as in Fig. 6.A similar set of results is obtained if the turning rate is appropriately altered
investigations will be needed to further explore the relationship between the modelparameters and the macroscopic patterning of the cells and matrix.
The parameter δ alters only the timescale of patterning: i.e. a small δ value cor-responds to slow reorganisation of the matrix, and consequently slow formation ofthe chain patterns. A similar effect is observed on altering the initial macroscopic celldensity: lower cellular densities still form patterns, but the development takes placeover a longer timescale.
5 Application to tumour invasion
The acquired ability of tumour cells to break free from a tumour and invade surroundingtissue is a key event in its transformation to malignancy [37]. Invasion can occur ineither an individual (amoeboid or mesenchymal) or collective manner [19] accordingto cancer type and origin and can result in complex and heterogeneous patterns ofinvasion, for example “fingering” patterns (strands of cells extending out from the maintumour mass), “nesting”, cell-chains or individual isolated cells. Enormous effort hasbeen invested into understanding the interplay between the invading cancer cells andthe host tissue (e.g. see [37]), research that has spawned a large number of mathematicalmodels for cancer invasion (for a review, see [4]).
A number of these models (e.g. [3,7,36,49,50]) have focussed on the role playedby the ECM in providing a substrate for the binding of adhesive molecules and cellmovement. Tumour cells follow gradients in these molecules (a process known as hap-totaxis) and the modelling has provided critical information into, for example, the effectof matrix density on the rate of cancer invasion. The precise organisation/architectureof the ECM and its impact has generally been neglected in models for cancer invasion.Here, an exploration of this issue is initiated.
123

534 K. J. Painter
The model is formulated in a simple and generic way (i.e. there is no specifictumour/tissue environment), although an inherent assumption is that migration takesplace via one of the individual migration strategies (amoeboid/mesenchymal) des-cribed earlier. Where applicable, type (R2) matrix dynamics are assumed, therebyassuring a constant macroscopic matrix density. Of course, in reality both the matrixalignment and density may undergo significant change, according to tissue and cancerorigin, with a correspondingly large impact on tumour infiltration. The assumption of(R2) dynamics allows attention to be focussed solely on the role of matrix alignment.Future extensions of the model will incorporate additional factors such as the impactof matrix density, adhesion receptors bound to the ECM etc.
In the modelling that follows the set-up illustrated in Fig. 10a is considered. Aninitially tumour free ECM region is assumed to be bordered on one side (x = 0) bya compact solid tumour (x < 0). It is presumed that the tumour was previously non-invasive, however from t = 0 a steady flow of tumour cells escapes the main tumourmass and invades the surrounding ECM. An interpretation for this would be a mutationarising in the main tumour mass leading to down-regulation in cell–cell adhesion andsubsequent escape into the ECM. To focus only on the invasion process, cell kinetics arecurrently ignored—i.e. migrating cells do not proliferate. For the timeframe consideredin the numerical simulations, this is a reasonable approximation.
It is assumed that, as before, cells move through contact guidance and we thereforesimulate Eq. (1) with turning function (4). Rather than consider a single form for thecell velocity, the following two cases are considered:
v(x, θ) = s0(cos θ, sin θ) or v(x, θ)=⎧⎨⎩
s0m(x,θ)m(x) (cos θ, sin θ) if θ ∈ (−π, 0]
s0m(x,θ−π)
m(x) (cos θ, sin θ) if θ ∈ (0, π ]
which we term constant and alignment-dependent respectively. The latter formassumes cell velocity increases with the strength of alignment. While this is somew-hat speculative in nature, an intuitive explanation is that cells migrating in an alignedmatrix may need to spend less time circumnavigating obstacles or clearing the matrix.
The boundary conditions for the cells require special attention and are described asfollows. Along the left and right boundaries we consider periodic boundary conditions.To model the invasion process we assume that along x = 0 there is a positive flux ofupward-moving invasive cells crossing into the ECM region. This flux is assumed tobe uniform across the tumour-ECM border. Cells moving downwards across x = 0are assumed to be deflected due to the presence of the solid tumour, and reverse theirmigratory direction. Along x = Lx we assume that any cells moving upwards “escape”and do not re-enter (i.e. there is a flux out of the domain resulting from cells moving“upwards” across x = Lx ) and zero-flux “downwards” across x = Lx .
5.1 Amoeboid/negligible-ECM remodelling
In the first set of simulations it is assumed cell movement is of “amoeboid”-style,i.e. contact-guided migration occurs but without any ECM remodelling. The focus is
123

Modelling cell migration strategies in the extracellular matrix 535
TUMOUR
ECM
sepyt xirtam citamehcs (a)
(c) macroscopic cell density
random parallel orthogonal mixed
random parallel orthogonal mixed
x=0
x=Lx
Fig. 10 a Schematic showing the set-up in the model for tumour invasion. b The four underlying ECMtypes. c Simulation result showing the macroscopic cell density for amoeboid migration following 8 h ofsimulation time for constant cell speed s0 = 2.5 µm/min and µ = 1.0/min on a spatial grid of dimensions250 × 150 µm2
on how the structure of the matrix alters the pattern of invasive spread. To this end,the four-matrix types displayed in Fig. 10b are considered: a random matrix with nodominant alignment, a globally oriented ECM aligned parallel to the tumour-ECMboundary, a globally oriented ECM aligned orthogonal to the tumour-ECM boundaryand a mixed scenario.
Figure 10c displays the results of the numerics following 8 h using the constantvelocity (with s0 = 2.5 µm/min and µ = 1.0/min). As can clearly be seen from thenumerics, the structure of the ECM may have a significant effect on the infiltrationrate into healthy tissue: in relation to the “random” ECM, the “orthogonally”-orientedECM permits much faster invasion while the “parallel”-oriented ECM permits muchslower invasion. For more complicated ECM structures, such as the “mixed” typerepresented in Fig. 10b, the invasion pattern may be complex with a heterogeneouspattern of tissue invasion. This suggests that invasive tumours originating in highlystructured matrix may show a complex pattern of infiltration. This is expanded onfurther in Sect. 5.3.
5.2 Mesenchymal/ECM remodelling
Reorganisation of the ECM is now incorporated by assuming the invading cells adopta mesenchymal class of movement. As stressed above, the macroscopic matrix density
123

536 K. J. Painter
Fig. 11 Tumour invasion with ECM remodelling. Top row Macroscopic cell density (m), bottom rowstrength of matrix alignment (mL ). a Constant cell speed with s0 = 0.5 µm/min and µ = 0.05/min.b Alignment-dependent cell speed with s0 = 1.0 µm/min. Equations solved on a spatial grid of dimensions250 × 150 µm2
is assumed constant (type (R2) dynamics with ψ = 1). For the simulations here, aninitially nonoriented/random ECM is considered (type (E1)). With a uniform rate ofinvasion along the tumour-ECM border and a nonoriented ECM, the invasion rate isalmost uniform with y and 2D data is thus represented by plotting of the macrosco-pic cell density (c) and strength of matrix alignment (mL ) as a function of x only(representing the depth of invasion).
With the incorporation of matrix remodelling, the matrix remodelling rate δ becomesa critical parameter. In Fig. 11a, invasion profiles are plotted for varying values of δand a constant cell migration speed following 8 h of simulation time. An increase inδ results in only marginal increase in the degree of invasion (top row). However, thematrix shows an increased level of alignment (with fibres aligned in the direction ofcell invasion) behind the invasion wavefront (bottom row).
Under an alignment-dependent cell speed, the extent of cell invasion is stronglydependent on the matrix remodelling rate, Fig. 11b. With negligible matrix remodel-ling, very little invasion takes place as cells remain “trapped” near the tumour-ECMborder. As δ is increased, however, the realignment of the matrix in the direction of cellinvasion results in a dramatic increase in the depth of invasion. The cell density profilenow has a compact wavefront with cells “stacking” at the tip of invasion. Intuitively,the compact form of the tumour derives from invading cells migrating quickly acrossthe aligned ECM region before accumulating on reaching the unorganised ECM.
5.3 Invasion into a remodelled matrix
In the final simulation from this preliminary investigation, the effect of tumour invasioninto a previously remodelled matrix is considered. As mentioned earlier, the ECMderived following mesenchymal movement displays a certain similarity to the structureof ECM in vivo in tissues such as the dermis. A simulation is conducted to investigateinvasion into remodelled ECM derived from the simulation in Fig. 6. The numericalresults are displayed in Fig. 12 for (a) amoeboid, and (b) mesenchymal migration,
123

Modelling cell migration strategies in the extracellular matrix 537
Fig. 12 Tumour invasion into a previously remodelled ECM. a Amoeboid migration with s0 =2.5 µm/min, µ = 1.0/min. b Mesenchymal migration with s0 = 0.5 µm/min, and µ = 0.05/min andδ = 0.1. The initial matrix distribution was taken from Fig. 6 and as indicated by the top right plot.Discretisation details as in Fig. 6
however a direct comparison between the two cases is somewhat redundant due todifferent choices of parameters such as the cell speed. In both cases, a constant cellvelocity was considered.
The numerics for both types of invasion reveal a complex and spatially heteroge-neous pattern of tumour infiltration. The aligned and spatially varying structure of thematrix results in enhanced migration along specific pathways, yielding a macroscopicfingering process. For amoeboid migration, no matrix remodelling occurs and there-fore the matrix structure displayed after 24 h is the same as its initial distribution.For mesenchymal migration, the matrix is remodelled, however only in a manner toreinforce the existing orientational structure of the matrix.
These simulations serve to reinforce the notion that matrix structure and organisa-tion may strongly impact on the type of tumour invasion. Complex patterns of tumourinvasion, for example “fingering” and cell-chain invasion may arise solely as a resultof the cell–matrix interactions.
6 Discussion
In this paper a continuous transport model has been developed to understand the role ofa structured extracellular matrix on the collective organisation of migrating cell popu-lations. Continuous transport equations have frequently been described in the litera-ture as “mesoscopic”: they provide a bridge between a truly “microscopic” approach
123
538 K. J. Painter
in which each cell is modelled as a discrete/individual object with precise rules formovement and a “macroscopic” model based on evolution equations for variables suchas the macroscopic cell/matrix densities in which movement is modelled in terms ofa total population flux. The transport model retains a microscopic description of cellmovement yet provides illumination on the dynamics of macroscopic variables. Wei-ghed against these advantages, however, they are comparatively more taxing to solvenumerically or analytically than a macroscopic approach.
The model here can be solved in a multiscale manner: a discrete model may bedeveloped to describe the underlying velocity-jump model upon which the transportequation is based and utilised in situations where the cell density is low or more com-plex models for cell behaviour required. Preliminary simulations of a discrete formu-lation of the model presented here indicates a close correspondence with the behaviourof the continuous transport model. The continuous transport model may be used tounderstand the dynamics of systems where the number of cells is unfeasibly large fora discrete approach or when a greater understanding of the macroscopic properties ofthe system are required. Through appropriate scaling of the length and time scales, itis possible to derive a fully macroscopic model for the cell density to tackle large scalebiological processes [27]. An important area under current investigation is to deter-mine whether the “cell-chain” behaviour reported here can also be observed in itscorresponding macroscopic model. The connection between microscopic/mesoscopicmodels of movement and their macroscopic counterparts is an important area whichhas received little rigorous treatment, although some work has been initiated for a“space-jump” type model of movement [48,28].
In the “amoeboid” model simulations it was shown how the ECM structure canorganise cells, for example inducing colocalisation despite the non-directional natureof the matrix fibres and the absence of other environmental cues (e.g. adhesion gra-dients, chemotactic cues). These results echo experimental observations of motile cellsplaced on micro-fabricated structures [61] and support the notion that the architec-ture of the ECM may play an important role in the organisation of cell populationsduring embryonic growth or facilitating movement during physiological processes.Ultrastructural studies of the developing pectoral fin in fish indicates contact guidancemay play an important role directing cell movement [62,53]: a potential application ofthe model here would be to test whether the ECM alone is capable of directing thesecell movement patterns, or if additional environmental cues (for example, chemoat-tractants) are required. Contact guidance has also been suggested as playing a role inthe in vivo guidance of early embryonic neural crest cells [43] and in the guidanceof adult lymphocytes. Detailed studies of “Peyer’s-patches” in the mouse indicate aradial pattern of ECM fibre alignment consistent with the migration pathways of lym-phocyte cells in and out of the patch [44]. Clearly, contact guided migration may playa role in facilitating the speed and guidance of the lymphocyte cells.
In the simulations of mesenchymal migration, we demonstrated the macroscopicformation of networks or cell-chains: dense connected pathways of motile cells similarto those reported in a number of in vitro and in vivo systems, including tumour cells[20], neural crest cells [33] and glioma gel assays [32]. The modelling here indicatesthat the twin actions of contact-guided migration along ECM fibres and an ECMremodelling process in which fibres become aligned along the path of cell migration
123

Modelling cell migration strategies in the extracellular matrix 539
are sufficient conditions for this process to occur—thus it is not necessary for additionalinteractions to take place, such as the formation of adhesive interactions between cells,cell-contact through filopodial interactions or communication via chemoattractants,although clearly all such processes may play a role in vivo examples of chain formation.A clear area for future work would be analytical investigation into the conditions forwhich network patterns arise and their structure. The resemblance of the remodelledECM to in vivo matrix in tissues such as the dermis indicate an ongoing process ofcellular migration (for example, as a result of normal tissue repair, immune systemsresponse) may result in gradual reorganisation of the skin.
One significant extension is to model dermal wound healing. In the early stages ofhealing, fibroblasts migrate into the wounded region to regenerate the ECM throughsecretion and assembly of collagen and other matrix components. Scarred tissue showsa significantly greater degree of bundling and alignment of the fibres than normaltissue, resulting in its different appearance and weaker nature. A variety of modelshave been developed by Sherratt and others (e.g. [10–13,38,45,46]) to determine therole of biological parameters on the form of the reconstituted matrix. The patterningand the matrix structure from the mesenchymal simulations here echo their results:for example, we demonstrated that the spatial scale of the “globally aligned regions”(see Fig. 9) depended on cell parameters such as speed and turning rates. It would beof interest to extend the modelling here to further compare the results to obtain newinsights into the mechanistic basis of wound healing.
The cell chain patterns presented here display a striking similarity to the networkof endothelial cells formed during “vasculogenesis”, the early embryonic formationof the vasculature. Vasculogenesis is a multi-step process in which endothelial cellsfirst form a connected network structure through their response to chemical signals(principally VEGF) and the surrounding ECM before undergoing tubularisation toform the blood capillaries. A great deal of understanding of this process has derivedfrom in vitro models in which cells are cultivated in a “Matrigel” scaffold. A number ofmechanochemical models have been developed that incorporate the mechanical forcesbetween the endothelial cells and the surrounding matrix (for example, see the reviewsin Chapter 8 of [42] and [2] for more information). The model developed here suggeststhat the twin actions of focussed proteolysis by the cells and contact guidance migrationmay be sufficient in generating the early network patterns, however it is important tonote that the model here neglects the forces between the cells and the matrix that willundoubtedly play a role in the patterning process. Omission of these details suitedthe purposes of the current modelling, where a simpler and more phenomenologicalmodel was desirable, however an important future extension of the model should bea more realistic description for the mechanical forces acting between cells and thematrix.
Preliminary simulations have been conducted to understand how the matrix orga-nisation may impact on the rate and pattern of tumour invasion. Whilst the modelwas purposefully kept simple in nature, it implied that the orientational structure ofthe ECM could be a significant determinant on the rate and heterogeneity of tumourinvasion. Significantly, we demonstrated that invasion into a complex ECM environ-ment could, through the simple action of matrix fibre following, give rise to complex“fingering” types of tumour invasion. These results indicate that for highly structured
123
540 K. J. Painter
connective tissues (such as the bone and dermis), clear understanding of the nature ofthe matrix may assist in identifying pathways of invasion. Another potential applica-tion for extension of the modelling lies in describing the growth pattern of gliomas.The heterogeneous growth of these brain tumours are believed to stem from regionalvariability in the environment [52]. For example, the rapid spread across the cor-pus callosum has been attributed to the tendency of individual glioma cells to migratealong the highly aligned white matter tracts [6]. Macroscopic models of glioma growthhave been formulated utilising an anisotropic diffusion tensor [9] derived from Dif-fusion Tensor Imaging (DTI) data that indicates the white matter tract anatomy [51].Significantly, the fully macroscopic models derived from an underlying descriptionof contact-guided cell migration along ECM fibres [27] comprise of a PDE equationincorporating an anisotropic diffusion tensor based on the underlying extracellulararchitecture. The modelling can thus potentially implicate a link between a guidedindividual cell migration of cells along white matter fibre tracts and the global pat-terns of glioma spread.
Incorporating remodelling of the matrix into the model demonstrated the impor-tance of understanding how cell migration parameters (such as cell speed) depend onthe alignment structure of the matrix. Under reasonable assumptions for the cell speed,large variations in the degree of invasion could be observed. Clearly, this latter workmay be extended in a number of manners. For example, a more precise incorporationof the manner in which cells remodel the matrix, inclusion of long range proteolyticenzymes, the role of adhesion molecules in the matrix and other chemical factorsshould all be considered in the modelling. This will form part of future extensions ofthe modelling.
Acknowledgments The author would like to express his gratitude to Thomas Hillen, who has providedthe stimulant for much of this work as well as a number of highly constructive suggestions. The authorwould further like to thank the two anonymous referees for their helpful comments. This work has beenpartially supported by an NIH grant CA113004.
References
1. Alberts B, Bray D, Lewis J, Raff M, Roberts K, Watson J (1994) Molecular biology of the cell. GarlandPublishing Inc, New York
2. Ambrosi D, Bussolino F, Preziosi L (2005) A review of vasculogenesis models. J Theor Med 6:1–193. Anderson ARA, Chaplain M, Newman E, Steele R, Thompson E (2000) Mathematical modelling of
tumour invasion and metastasis. J Theor Med 2:129–1534. Araujo RP, McElwain DLS (2004) A history of the study of solid tumour growth: the contribution of
mathematical modelling. Bull Math Biol 66:1039–10915. Barocas V, Tranquillo R (1997) An anisotropic biphasic theory of tissue-equivalent mechanics: The
interplay among cell traction, fibrillar network deformation, fibril alignment and cell contact guidance.J Biomech Eng 119:137–145
6. Bellail AC, Hunter SB, Brat DJ, Tan C, Van Meir EG (2004) Microregional extracellular matrix hete-rogeneity in brain modulates glioma cell invasion. Int J Biochem Cell Biol 36:1046–1069
7. Chaplain M, Lolas G (2005) Mathematical modelling of cancer cell invasion of tissue: the role of theurokinase plasminogen activation system. Math Models Methods Appl Sci 15:1685–1734
8. Chauviere A, Hillen T, Preziosi L (2007) Modeling cell movement in anisotropic and heterogeneousnetwork tissues. Networks Heterogeneous Media 2:333–357
123
Modelling cell migration strategies in the extracellular matrix 541
9. Clatz O, Sermesant M, Bondiau P, Delingette H, Warfield S, Malandain G, Ayache N (2005) Realisticsimulation of the 3d growth of brain tumours in mr images coupling diffusion with biomechanicaldeformation. IEEE Trans Med Imag 24:1334–1345
10. Dallon J, Sherratt J (2000) A mathematical model for spatially varying extracellular matrix alignment.SIAM J Appl Math 61:506–527
11. Dallon JC, Sherratt JA (1998) A mathematical model for fibroblast and collagen orientation. Bull MathBiol 60:101–129
12. Dallon JC, Sherratt JA, Maini PK (1999) Mathematical modelling of extracellular matrix dynamicsusing discrete cells: fiber orientation and tissue regeneration. J Theor Biol 199:449–471
13. Dallon JC, Sherratt JA, Maini PK (2001) Modeling the effects of transforming growth factor-beta onextracellular matrix alignment in dermal wound repair. Wound Repair Regen 9:278–286
14. Dickinson R (1997) A model for cell migration by contact guidance. In: Alt W, Deutsch A, Dunn G(eds) Dynamics of cell and tissue motion. Birkhauser, Basel, pp 149–158
15. Dickinson R (2000) A generalized transport model for biased cell migration in an anisotropic environ-ment. J Math Biol 40:97–135
16. Dunn GA, Heath JP (1976) A new hypothesis of contact guidance in tissue cells. Exp Cell Res 101:1–1417. Francis K, Palsson B, Donahue J, Fong S, Carrier E (2002) Murine Sca-1(+)/Lin(−) cells and human
KG1a cells exhibit multiple pseudopod morphologies during migration. Exp Hematol 30:460–46318. Friedl P (2004) Prespecification and plasticity: shifting mechanisms of cell migration. Curr Opin Cell
Biol 16:14–2319. Friedl P, Wolf K (2003) Tumour-cell invasion and migration: diversity and escape mechanisms. Nat
Rev Cancer 3:362–37420. Friedl P, Maaser K, Klein CE, Niggemann B, Krohne G, Zanker KS (1997) Migration of highly aggres-
sive MV3 melanoma cells in 3-dimensional collagen lattices results in local matrix reorganization andshedding of alpha2 and beta1 integrins and CD44. Cancer Res 57:2061–2070
21. Friedl P, Zanker KS, Brocker EB (1998) Cell migration strategies in 3-D extracellular matrix: diffe-rences in morphology, cell matrix interactions, and integrin function. Microsc Res Tech 43:369–378
22. Gaudet C, Marganski WA, Kim S, Brown CT, Gunderia V, Dembo M, Wong JY (2003) Influence oftype I collagen surface density on fibroblast spreading, motility, and contractility. Biophys J 85:3329–3335
23. Gerisch A, Chaplain M (2008) Mathematical modelling of cancer cell invasion of tissue: local and non-local models and the effect of adhesion. J Theor Biol. 250:684–704. doi:10.1016/j.jtbi.2007.10.026
24. Guido S, Tranquillo RT (1993) A methodology for the systematic and quantitative study of cell contactguidance in oriented collagen gels. Correlation of fibroblast orientation and gel birefringence. J CellSci 105:317–331
25. Hay E editor (1991) Cell Biology of Extracellular Matrix. Plenum Press, New York, 2nd edition26. Hillen T (2002) Hyperbolic models for chemosensitive movement. Math Models Methods Appl Sci
12:1007–103427. Hillen T (2006) M5 mesoscopic and macroscopic models for mesenchymal motion. J Math Biol
53:585–61628. Horstmann D, Painter K, Othmer H (2004) Aggregation under local reinforcement: from lattice to
continuum. Eur J Appl Math 15:545–57629. Hughes L, Archer C, Gwynn A (2005) The ultrastructure of mouse articular cartilage: collagen orien-
tation and implications for tissue functionality. a polarised light and scanning electron microscopestudy and review. Eur Cells Mater 9:68–84
30. Imayama S, Braverman IM (1989) A hypothetical explanation for the aging of skin. Chronologicalteration of the three-dimensional arrangement of collagen and elastic fibers in connective tissue. AmJ Pathol 134:1019–1025
31. Jacques TS, Relvas JB, Nishimura S, Pytela R, Edwards GM, Streuli CH, ffrench Constant C(1998) Neural precursor cell chain migration and division are regulated through different beta1 inte-grins. Development 125:3167–3177
32. Kaufman LJ, Brangwynne CP, Kasza KE, Filippidi E, Gordon VD, Deisboeck TS, Weitz DA(2005) Glioma expansion in collagen I matrices: analyzing collagen concentration-dependent growthand motility patterns. Biophys J 89:635–650
33. Kulesa PM, Fraser SE (1998) Neural crest cell dynamics revealed by time-lapse video microscopy ofwhole embryo chick explant cultures. Dev Biol 204:327–344
123

542 K. J. Painter
34. Lauffenburger DA, Horwitz AF (1996) Cell migration: a physically integrated molecular process. Cell84:359–369
35. Locascio A, Nieto MA (2001) Cell movements during vertebrate development: integrated tissue beha-viour versus individual cell migration. Curr Opin Genet Dev 11:464–469
36. MacArthur BD, Please CP, Pettet GJ (2005) A mathematical model of dynamic glioma-host interac-tions: receptor-mediated invasion and local proteolysis. Math Med Biol 22:247–264
37. Mareel M, Leroy A (2003) Clinical, cellular, and molecular aspects of cancer invasion. Physiol Rev83:337–376
38. McDougall S, Dallon J, Sherratt J, Maini P (2006) Fibroblast migration and collagen deposition duringdermal wound healing: mathematical modelling and clinical implications. Phil Trans R Soc Lond A364:1385–1405
39. Mogilner A, Edelstein-Keshet L (1996) Spatio-angular order in populations of self-aligning objects:formation of oriented patches. Physica D 89:346–367
40. Mogilner A, Edelstein-Keshet L, Ermentrout G (1996) Selecting a common direction. ii. peak-likesolutions representing total alignment of cell clusters. J Math Biol 34:811–842
41. Murphy G, Gavrilovic J (1999) Proteolysis and cell migration: creating a path? Curr Opin Cell Biol11:614–621
42. Murray J (2003) Mathematical biology II: spatial models and biochemical applications, 3rd edn.Springer, New York
43. Newgreen DF (1989) Physical influences on neural crest cell migration in avian embryos: contactguidance and spatial restriction. Dev Biol 131:136–148
44. Ohtsuka A, Piazza AJ, Ermak TH, Owen RL (1992) Correlation of extracellular matrix componentswith the cytoarchitecture of mouse Peyer’s patches. Cell Tissue Res 269:403–410
45. Olsen L, Maini P, Sherratt J, Marchant B (1998) Simple modelling of extracellular matrix alignmentin dermal wound healing. J Theor Med 1:172–192
46. Olsen L, Maini P, Sherratt J, Dallon J (1999) Mathematical modelling of anisotropy in fibrous connec-tive tissue. Math Biosci 158:145–170
47. Othmer H, Dunbar S, Alt W (1988) Models of dispersal in biological systems. J Math Biol 26:263–29848. Painter K, Horstmann D, Othmer H (2003) Localization in lattice and continuum models of reinforced
random walks. Appl Math Lett 16:375–38149. Perumpanani A, Simmons D, Gearing A, Miller K, Ward G, Norbury J, Schneemann M, Sherratt J
(1998) Does extracellular matrix mediated chemotaxis promote or impede cell migration? Proc R SocLond B 265:2347–2352
50. Perumpanani AJ, Byrne HM (1999) Extracellular matrix concentration exerts selection pressure oninvasive cells. Eur J Cancer 35:1274–1280
51. Price S, Burnet N, Donovan T, Green H, Pena A, Antoun N, Pickard J, Carpenter T, GillardJ (2003) Diffusion tensor imaging of brain tumours at 3t: a potential tool for assessing white mat-ter tract invasion? Clin Radiol 58:455–462
52. Swanson KR, Alvord ECJ, Murray JD (2002) Virtual brain tumours (gliomas) enhance the reality ofmedical imaging and highlight inadequacies of current therapy. Br J Cancer 86:14–18
53. Thorogood P, Wood A (1987) Analysis of in vivo cell movement using transparent tissue systems.J Cell Sci Suppl 8:395–413
54. Tsuji T (1982) Scanning electron microscopy of dermal elastic fibres in transverse section. Br J Der-matol 106:545–550
55. Wang HB, Dembo M, Hanks SK, Wang Y (2001) Focal adhesion kinase is involved in mechanosensingduring fibroblast migration. Proc Natl Acad Sci USA 98:11295–11300
56. Wang W, Wyckoff JB, Frohlich VC, Oleynikov Y, Huttelmaier S, Zavadil J, Cermak L, Bottinger EP,Singer RH, White JG, Segall JE, Condeelis JS (2002) Single cell behavior in metastatic primary mam-mary tumors correlated with gene expression patterns revealed by molecular profiling. Cancer Res62:6278–6288
57. Weiner R, Schmitt B, H P (1997) Rowmap–a row-code with krylov techniques for large stiff odes.Appl Numer Math 25:303–319
58. Wilkinson PC, Lackie JM (1983) The influence of contact guidance on chemotaxis of human neutrophilleukocytes. Exp Cell Res 145:255–264
59. Wolf K, Muller R, Borgmann S, Brocker EB, Friedl P (2003a) Amoeboid shape change and contactguidance: T-lymphocyte crawling through fibrillar collagen is independent of matrix remodeling byMMPs and other proteases. Blood 102:3262–3269
123

Modelling cell migration strategies in the extracellular matrix 543
60. Wolf K, Mazo I, Leung H, Engelke K , von Andrian UH, Deryugina EI, Strongin AY, Brocker EB,Friedl P (2003b) Compensation mechanism in tumor cell migration: mesenchymal-amoeboid transitionafter blocking of pericellular proteolysis. J Cell Biol 160:267–277
61. Wood A (1988) Contact guidance on microfabricated substrata: the response of teleost fin mesenchymecells to repeating topographical patterns. J Cell Sci 90:667–681
62. Wood A, Thorogood P (1984) An analysis of in vivo cell migration during teleost fin morphogenesis.J Cell Sci 66:205–222
123