Modeling with Molecular Pseudoconnectivity Descriptors. A Useful Extension of the Intrinsic I-State...
17
Modeling with Molecular Pseudoconnectivity Descriptors. A Useful Extension of the Intrinsic I-State Concept Lionello Pogliani ² Dipartimento di Chimica, UniVersita ` della Calabria, 87030 Rende, Italy ReceiVed: March 29, 2000; In Final Form: June 12, 2000 Intrinsic state molecular pseudoconnectivity indices, i.e., indices which are based on the intrinsic state concept and which are built on the intrinsic and the electrotopological state values, are used to model different properties of different classes of molecules: the side-chain molecular volume, the isoelectric point, the melting temperatures, the solubility, the specific rotations, and the crystal density of amino acids, the motor octane number and the melting temperatures of alkanes, the lattice enthalpy of metal halides, and the singlet excitation energies of DNA/RNA bases. A series of three activities are also modeled: the rates of hydrogen abstraction, the minimum anesthetic concentrations of chlorofluoroalkanes, and the antagonism of adrenalin by 2-bromo- 2-phenethylamines. The modeling of the properties has been compared with the modeling achieved by the well-known molecular connectivity indices, while the modeling of the activities is compared with the modeling achieved by specific E-state indices. A comparison with the modeling power of the molar masses is also always stressed. Molecular pseudoconnectivity terms derived by a trial-and-error procedure are the best descriptors for the melting temperatures and crystal density of amino acids, both properties of alkanes, the lattice enthalpy of metal halides, the singlet excitation energies of DNA/RNA bases, the minimum anesthetic concentration, and the adrenalin antagonism. Further, a molecular pseudoconnectivity term of chlorofluoro- alkanes, where subclasses of compounds share the same value of connectivity indices, is the best dominant descriptor for the rates of hydrogen abstraction. The advantage of these intrinsic state derived descriptors is rendered even more evident in the study of the activity of 2-bromo-2-phenethylamines, where many compounds show redundant connectivity and valence connectivity values. The modeling of the solubility of amino acids with pseudoconnectivity descriptors requires the introduction of supra-pseudoconnectivity descriptors, a fact that mimics a result already obtained with molecular connectivity indices. Sometimes a combination of molecular connectivity and pseudoconnectivity indices achieves a remarkable modeling. Introduction Recently, linear combinations of connectivity indices as well as molecular connectivity terms, which are derived from molecular connectivity indices by means of a trial-and-error procedure, proved to be good descriptors of a good deal of physicochemical properties. 1-5 Further, the recent introduction of semiempirical molecular connectivity terms, into which an empirical parameter is embedded, has proved that it is even possible to model different properties of a wide heterogeneous class of organic compounds. 6 One of the main characteristics of molecular connectivity terms is that they offer the advantage of being highly dominant single descriptors, a fact that normally allows the use of linear combinations of connectivity indices as well as of orthogonal descriptors to be short-circuited. A second practical advantage is that the construction procedure of these higher-level molecular connectivity descriptors allows the exponent of the molecular connectivity indices, which are their basic parameters, to be indirectly optimized. Clearly, molecular connectivity indices and terms represent only a subset, even if an important one, of the entire set of graph theoretical indices (refs 7-18 and references therein) used up to date. Molecular connectivity indices and terms are directly based on the graph and pseudograph representations of a molecule; 19-21 this last representation, the pseudograph representation, is of no use for inorganic compounds, 1,22 and the achieved modeling of these compounds is performed by the aid of valence molecular connectivity whose δ v values have heuristically been defined. 20 This last result brings us to consider the possibility to define new descriptors, which are not directly based on graph attributes, but which are based on some molecular feature that can impart to these new descriptors the characteristics of a molecular invariant. The finding of new invariants is, in fact, a task of paramount importance for a chemist as has indirectly been emphasized by W. Ostwald 23 at the beginning of this century. Kier and Hall in 1990 put forward a new molecular structural model, the electrotopological state (E state), based on an intrinsic I-state concept 24-26 by the aid of which it was possible from the atom’s topological environment to incorporate the information about the influence of the remainder of the molecular environment. The S index of this E state, which incorporates the influence of the remainder of the molecular environment, is a composite index embracing both electronic and steric attributes of atoms and molecules, and it is directly comparable to molecular orbital-type indices, or to steric parameters. Further, it reflects the electronegativity of an atom, the electronegativity of proximal and distant atoms, and its topological state, and it shows some common features with the concept of free valence of an atom introduced by Coulson in 1948. 26 Since then this new descriptor has successfully been used in a wide variety of structure-activity studies, as well as in studies encoding molecular similarity (see references in ref 26). Index S is a function of index I, which defines the so- called intrinsic I state of an atom that is based on graph and pseudograph parameters. Now, while I and S values are atom- ² Fax: x39-984-492044. E-mail: [email protected]. 9029 J. Phys. Chem. A 2000, 104, 9029-9045 10.1021/jp001191v CCC: $19.00 © 2000 American Chemical Society Published on Web 09/13/2000
Transcript of Modeling with Molecular Pseudoconnectivity Descriptors. A Useful Extension of the Intrinsic I-State...

Modeling with Molecular Pseudoconnectivity Descriptors. A Useful Extension of theIntrinsic I-State Concept
Lionello Pogliani†
Dipartimento di Chimica, UniVersita della Calabria, 87030 Rende, Italy
ReceiVed: March 29, 2000; In Final Form: June 12, 2000
Intrinsic state molecular pseudoconnectivity indices, i.e., indices which are based on the intrinsic state conceptand which are built on the intrinsic and the electrotopological state values, are used to model different propertiesof different classes of molecules: the side-chain molecular volume, the isoelectric point, the meltingtemperatures, the solubility, the specific rotations, and the crystal density of amino acids, the motor octanenumber and the melting temperatures of alkanes, the lattice enthalpy of metal halides, and the singlet excitationenergies of DNA/RNA bases. A series of three activities are also modeled: the rates of hydrogen abstraction,the minimum anesthetic concentrations of chlorofluoroalkanes, and the antagonism of adrenalin by 2-bromo-2-phenethylamines. The modeling of the properties has been compared with the modeling achieved by thewell-known molecular connectivity indices, while the modeling of the activities is compared with the modelingachieved by specific E-state indices. A comparison with the modeling power of the molar masses is alsoalways stressed. Molecular pseudoconnectivity terms derived by a trial-and-error procedure are the bestdescriptors for the melting temperatures and crystal density of amino acids, both properties of alkanes, thelattice enthalpy of metal halides, the singlet excitation energies of DNA/RNA bases, the minimum anestheticconcentration, and the adrenalin antagonism. Further, a molecular pseudoconnectivity term of chlorofluoro-alkanes, where subclasses of compounds share the same value of connectivity indices, is the best dominantdescriptor for the rates of hydrogen abstraction. The advantage of these intrinsic state derived descriptors isrendered even more evident in the study of the activity of 2-bromo-2-phenethylamines, where many compoundsshow redundant connectivity and valence connectivity values. The modeling of the solubility of amino acidswith pseudoconnectivity descriptors requires the introduction of supra-pseudoconnectivity descriptors, a factthat mimics a result already obtained with molecular connectivity indices. Sometimes a combination ofmolecular connectivity and pseudoconnectivity indices achieves a remarkable modeling.
Introduction
Recently, linear combinations of connectivity indices as wellas molecular connectivity terms, which are derived frommolecular connectivity indices by means of a trial-and-errorprocedure, proved to be good descriptors of a good deal ofphysicochemical properties.1-5 Further, the recent introductionof semiempirical molecular connectivity terms, into which anempirical parameter is embedded, has proved that it is evenpossible to model different properties of a wide heterogeneousclass of organic compounds.6 One of the main characteristicsof molecular connectivity terms is that they offer the advantageof being highly dominant single descriptors, a fact that normallyallows the use of linear combinations of connectivity indicesas well as of orthogonal descriptors to be short-circuited. Asecond practical advantage is that the construction procedureof these higher-level molecular connectivity descriptors allowsthe exponent of the molecular connectivity indices, which aretheir basic parameters, to be indirectly optimized. Clearly,molecular connectivity indices and terms represent only a subset,even if an important one, of the entire set of graph theoreticalindices (refs 7-18 and references therein) used up to date.
Molecular connectivity indices and terms are directly basedon the graph and pseudograph representations of a molecule;19-21
this last representation, the pseudograph representation, is ofno use for inorganic compounds,1,22and the achieved modelingof these compounds is performed by the aid of valence
molecular connectivity whoseδv values have heuristically beendefined.20 This last result brings us to consider the possibilityto define new descriptors, which are not directly based on graphattributes, but which are based on some molecular feature thatcan impart to these new descriptors the characteristics of amolecular invariant. The finding of new invariants is, in fact, atask of paramount importance for a chemist as has indirectlybeen emphasized by W. Ostwald23 at the beginning of thiscentury. Kier and Hall in 1990 put forward a new molecularstructural model, the electrotopological state (E state), basedon an intrinsic I-state concept24-26 by the aid of which it waspossible from the atom’s topological environment to incorporatethe information about the influence of the remainder of themolecular environment. TheS index of this E state, whichincorporates the influence of the remainder of the molecularenvironment, is a composite index embracing both electronicand steric attributes of atoms and molecules, and it is directlycomparable to molecular orbital-type indices, or to stericparameters. Further, it reflects the electronegativity of an atom,the electronegativity of proximal and distant atoms, and itstopological state, and it shows some common features with theconcept of free valence of an atom introduced by Coulson in1948.26 Since then this new descriptor has successfully beenused in a wide variety of structure-activity studies, as well asin studies encoding molecular similarity (see references in ref26). IndexS is a function of indexI, which defines the so-called intrinsic I state of an atom that is based on graph andpseudograph parameters. Now, whileI andSvalues are atom-† Fax: x39-984-492044. E-mail: [email protected].
9029J. Phys. Chem. A2000,104,9029-9045
10.1021/jp001191v CCC: $19.00 © 2000 American Chemical SocietyPublished on Web 09/13/2000
centered values even if the last one takes into consideration thewhole molecular framework, it is not at all odd to define newwhole molecular indices based on them in a similar way asømolecular connectivity indices are directly grounded on theconnectivity degree of a graph (δ) and of a pseudograph (δv).These new indices, as they rotate around the intrinsic I conceptand are indirectly based on connectivityδ andδv numbers, maybe called intrinsic state,IS, molecular pseudoconnectivity indicesor just molecular pseudoconnectivity indices and denoted theGreek letterψ. They will consist of two subtypes of indices:{ψ} ) {ψI, ψE}, whereψI is the subset of theI-derived indicesand ψE is the subset of theS-derived indices. Their indirectrelation to topological characteristics together with their elec-tronic features should make them interesting descriptors ofphysicochemical properties and activities. Thus, either as singledescriptors or as linear combinations of pseudoconnectivityindices (LCpCI) or as molecular pseudoconnectivity terms,Y) f(ψ), they should achieve some sort of modeling. In thepresent study we will attempt to model withψ or ψ-deriveddescriptors different properties of amino acids, alkanes, inorganicsalts, and DNA/RNA bases and to compare the achieved model-ing with the modeling power of molecular connectivity descrip-tors and of the molar masses. The activities of chlorofluoroal-kanes and 2-bromo-2-phenethylamines will also be modeled asthey offer a good example of classes of compounds where a lotof molecules show the same values of connectivity indices,iø,and also (the second class) of valence connectivity indices,iøv.
Method
The electronicSi E-state index for atomi proposed by Kierand Hall24-26 to describe quantitatively the mutual influence ofnon-hydrogen atoms in a molecule can be estimated by thefollowing formula:
where I ) [(2/N)2δv +1]/δ, N ) principal quantum number,∆Iij ) (Ii - Ij)/r2
ij, andrij ) counts of atoms in the minimumpath length separating two atomsi and j, which is equal to theusual graph distancedij + 1. From the definition of∆Iij it isevident thatScan also assume negative values. Because someSvalues are negative (in amino acids, inorganic salts, chlorof-luoroalkanes, and 2-bromo-2-phenethylamines), calculation ofsomeψE values could give rise to imaginary numbers. To avoidthis occurrence,S values have been rescaled. Buried carbonatoms bonded to highly electronegative atoms give rise tonegativeS values. It is, then, not at all odd to rescale everySi
value to theS value of the carbon atom in CF4, which equals-5.5, and which is the lowestSvalue a carbon atom can assume.Inevitably, this rescaling invalidates one of the results of theelectrotopological model, which states that in a molecule∑iSi
) ∑iI i. In alkanes, where such a rescaling has not beenundertaken, as no negativeSvalues are obtained, the values ofthe two indices,SψI andSψE are in fact equal (see the followingequations). As already done with precedingø-modeling thefollowing set of eightIS molecular pseudoconnectivity indiceswill be used to model the given properties and activities oforganic and inorganic compounds:
Their definition parallels the original definition ofø indices (refs5 and 20 and references therein)
The sums in eqs 3 and 4 are taken over all atoms, while thesum in eq 5 is over all edges (σ bonds) of the molecular graph,respectively. ReplacingI in eqs 3-6 with S, the subset{SψE,0ψE, 1ψE, TψE} of molecular pseudoconnectivity indices isobtained. Superscripts S and T stand for sum and total; the othersuperscripts follow the established denomination forø indices.20
Equations 3 and 5 deserve special attention. The index definedby eq 3 had already been proposed to describe molecularpolarity, while the index of eq 5 strongly mimics the sum ofthe bond-E-state index,BIS ) (IiIj)0.5, where the exponent ispositive instead of negative.27
To avoid confusion, denominationε for S-derived values (andcorrespondinglyι for I-derived values) has not been chosen assymbol as ε has already been used for edge-connectivityindices.28,29 Further, the proposed name forIS molecularpseudoconnectivity indices, especially the portion “pseudocon-nectivity”, has been chosen to avoid renaming the normalconnectivityø indices. In fact, naming them “indirect” molecularconnectivity indices would practically have forced renamingøindices as direct molecular connectivity indices, while to namethem molecular electrotopological connectivity indices wouldhave required redefining the meaning of connectivity. Anyway,the question of their names stays open and will surely be solvedin the near future.
Assuming that the relationship between properties,P, andmolecular pseudoconnectivity indices is linear, the modelingequation is given by the following dot product modulus:P )|C‚ψ|, whereP is the calculated property of a compound, rowvectorC is the vector of theck coefficients that are determinedby the least-squares procedure, and column vectorψ is thevector of the best pseudoconnectivity descriptors selected witha total combinatorial search technique and/or with a trial-and-error procedure (for terms only). The multivariate regressioncan be regarded as a linear combination of pseudoconnectivityindices (LCpCI) where the constant term of the regression canbe considered to multiply the unitary index,U0 ≡ 1, a kind ofbias index. Even thoughP is not always a linear function ofψ,it is nevertheless a linear function of theck coefficients. Ifψ isanm × n matrix (wheren ) number of compounds), thenP isa property column vector of the entire class of compounds. Barsin the modeling equation stand for absolute value to get rid ofcalculated negativeP values with no physical meaning andsimultaneously enhance the description, provided that thecorresponding experimental property is positive. The statisticalperformance of the different LCpCI, which can be obtained witha combinatorial procedure, is controlled by a quality,Q ) r/s,factor, wherer ) correlation coefficient ands ) standarddeviation of estimates, by the varianceF (Fischer ratio),F )fr2/[(1 - r2)ν], where f ) number of freedom degrees) n -(ν + 1), ν ) number of variables, andn ) number of data.The parameterQ, which is an “internal” statistic, is apt tocompare the descriptive power of different descriptors of thesame property, while the parameterF tells us, even ifQimproves, which additional descriptor endangers the statisticalquality of the combination. For every index of a LCpCI equation
Si ) Ii + ∑j
∆Iij (1)
{ψ} ) {SψI,0ψI,
1ψI,TψI ,
SψE, 0ψE, 1ψE, TψE} (2)
SψI ) ∑i
I i (3)
0ψI ) ∑i
(Ii)-0.5 (4)
1ψI ) ∑(IiIj)-0.5 (5)
TψI ) (I1‚I2‚I3...IN)-0.5 (6)
9030 J. Phys. Chem. A, Vol. 104, No. 39, 2000 Pogliani

the fractional utility,uk ) |ck/sk|, as well as the average fractionalutility ⟨u⟩ ) ∑uk/(ν + 1) will be given. This statistical parameterwill allow us to detect the paradoxical situation of a LCpCIwith a good predictive power but with a poor utility at the levelof its coefficients.30 It should be noticed thatQ, and r, andsvalues as well as⟨u⟩ andu values, even if some of them mayseem redundant, in their totality offer, a direct view of thestatistical behavior of a modeling and can also be used as acheck for eventual printing errors both of the author and of thejournal, as two nearby printing errors is a rather rare event.
When properties of some members of a class of compoundsassume negative values, the modeling equation should be usedwithout modulus bars,P ) C‚ψ. This is the case for the specificrotation (SR) of amino acids. Further, as the specific rotation(SR) of amino acids can assume negative and antithetic valuesfor the L- and D-forms, then the correlation vectors for theL- andD-forms are related through the relationCL ) -CD; thismeans that once a subset is modeled, the modeling of the othersubset is straightforward.
Usually, indices used in linear combinations, LCpCI, areinterrelated, a fact that has some negative effects as (i) it resultsin unstable estimated regression coefficients of vectorC, (ii) itmay render values predicted for compounds not in the originaltraining data set not reliable, (iii) it may also render an analysisof the relative importance of an index in a modeling equationa useless task, and, finally, (iv) it may worsen the utilities ofthe regression coefficients. The construction of dominantpseudoconnectivity terms,Y ) f(ψ), with a trial-and-errorprocedure offers the possibility to reduce the modeling equationto a simple linear form,P ) |c‚Y + c0U0|, and to short-circuit,thus, the orthogonality problem. The trial-and-error procedureto construct molecular connectivity or pseudoconnectivity termsruns in this way: (i) optimize the first index,1ψ, (ii) given 1ψintroduce and optimize2ψ (the second index), (iii) back-optimize1ψ, (iv) check that with the new1ψ index, the2ψ index continuesto be the best index, and so on. This procedure can beschematized, for the case of four parameters, by the aid of thefollowing symbolism, where I stands for introduce, O foroptimization, and C for check operations. Normally, optimiza-tion is optimal at the check point. The ratio can be built at everylevel, if the introduction of an index does not improve any morethe description at that level:
Usually, this procedure either converges rapidly or does notwork at all, and the found terms regularly have the followingform: Y ) [(ψ1)m + a(ψ2)n]q/[b(ψ3)o + c(ψ1)p]r, wherea, b, c,m, n, o, p, q, andr are optimization parameters that can also benegative, zero, or one.
Results
The experimental values of the physicochemical propertiesof amino acids and alkanes are collected in Tables 1 and 2,respectively. The lattice enthalpy values of metal halides arecollected in the second column of Table 8, and the first andsecond singlet excitation energies of DNA/RNA bases are col-lected in Table 10. The rates of hydrogen abstraction and mini-
mum anesthetic concentrations of chlorofluoroalkanes, in logunits, are collected in Tables 12 and 14, respectively. The meas-ure of biological response of 2-bromo-2-phenethylamines inpED50 units, i.e., the negative logarithm of the estimated dosefor 50% response, is given in Table 17. While the experimentalvalues of Tables 12, 14, and 17 have been taken from ref 26,the other experimental values have been taken from the citedpapers of the author.Ii andSi values ofI S andES matrices andvectors of Tables 3, 5, 7, 9, 11, and 15 have been obtained bythe aid of the E-calc software provided in a CD of a cited book.26
The indicesψI and ψE of Tables 4, 6, 8, 10, 12, 13, and 16have, instead, been obtained by the aid of a Turbo Basic softwareprogram written by the author. The meaning of columnsPcalc
andPjk of Tables 1, 2, 8, and 14 will be explained in the follow-ing sections. Amino acids, as well as DNA/RNA bases, havebeen represented by two-rowIS andES matrices, a representationalready used in a preceding paper where two-rowø matriceshave also been used1,31 for amino acids and purine and pyrimi-dine bases. In these matrices heteroatoms are substituted by theircorrespondingI values, in I S matrices, andS values, inES
matrices. This type of representation is also used for alkanes,which give rise in some cases to three-row matrices, chloroflu-oroalkanes, 2-Br-2-phenethylamines, and inorganic salts, whichgive rise to one-row matrices or vectors. In cyclic amino acidsof Table 3 (Pro, Hyp, His, Phe, Tyr, and Trp) the ring closurepoint is represented by an underlined value which connects tothe corresponding values denoted by a left broken arrow. Noticethat in Trp there are two ring closure points. The same “strategy”was used in Table 9 for the bases A and G, while in bases U,T, and C the ring closure is between the value on top of the“f” sign and the value on top of the left broken arrow sign.This last strategy has also been used with 2-bromo-2-phenethyl-amines. In alkanes, and chlorofluoroalkanes (CFC), instead, theproblem of double methyl (M) or double halogen substitutionat the same carbon was solved, underlining the correspondingI or Svalue, which means that the value should be reported ina virtual third row on the top of the first one. Single ethyl (E)substitution was here solved by adding a third line, while MEor EE substitution at the same carbon atom was solved, in thefirst case, by placing the corresponding value of M in parenthe-ses, and, in the second case, by underlining both ethylI andSvalues. A rapid glance at theseI S andES matrices or vectorsoffers some interesting insights into the meaning of the electro-topological state: (i) while some compounds show similarI S
matrices, no compound has the sameES matrix, (ii) single valuesin ES matrices seem to reflect electronegativity considerations,with the most negatively charged atom showing the highestSvalue, and (iii) the trend of carbonSvalues in amino acid andalkaneES matrices seems to reflect the NMR chemical shifttrend of the corresponding carbon atoms,32 a fact already no-ticed.26 It would be interesting to notice if differentSi valuesfor the same type of carbon in different amino acids or alkanesare also mapped by different chemical shifts and in the sameorder.
Discussion
Amino Acids. The average interrelation value of the{ψ}indices for amino acids is⟨r⟩ ) 0.818, while the strongest andweakest interrelations arer(0ψI, 1ψI) ) 0.992) r(0ψI, 0ψE) andr(SψI, TψE) ) 0.568, respectively. Before entering the modelingof the different properties of amino acids let us notice that the{0ψE} index is the best descriptor for the molar masses,M, ofamino acids withQ ) 0.159,F ) 459,r ) 0.980, ands ) 6.2,while {0ø} hadQ ) 0.156,F ) 441, r ) 0.979, ands ) 6.3.
O(1)
I(2), O(2|1), O(1|2), C(2|1)
I(3), O(3|1,2), O(2|3,1), O(1|2,3), C(3|1,2)
I(4), O(4|1,2,3), O(3|4,1,2), O(2|3,4,1), O(1|2,3,4),C(4|1,2,3)
Modeling with Pseudoconnectivity Descriptors J. Phys. Chem. A, Vol. 104, No. 39, 20009031
This result indicates thatψ indices should at least be decentdescriptors ofM-dependent properties.
Side-Chain Molecular Volume. Let us start modeling the side-chain molecular volume,V, of n ) 18 amino acids, shown inTable 2 (no Met, Cys, and Hyp). The bestø index for thisproperty1,31 is 0øv with a remarkable statistical score
For comparison purposes, the molar masses,M, describe thisproperty withQ ) 0.069 andF ) 83. The best multi-ø indexLCCI is given by the following two-ø index combination:31
where the last value is the utility of the bias index,U0 ≡ 1.Molecular pseudoconnectivity indices of the set of eq 2 do not
achieve the same good statistical score
Further, the utilities are not at all impressive, and especially,the utility of the unitary indexU0 shows that both regressions,the single-index and the two-index regressions, are useless. Atrial-and-error search for the best molecular pseudoconnectivityterm, YV ) f(ψ), for this property discovers the followinginteresting term:
This term ratesQ ) 0.176,F ) 341,r ) 0.977,s ) 5.6, ⟨u⟩ )
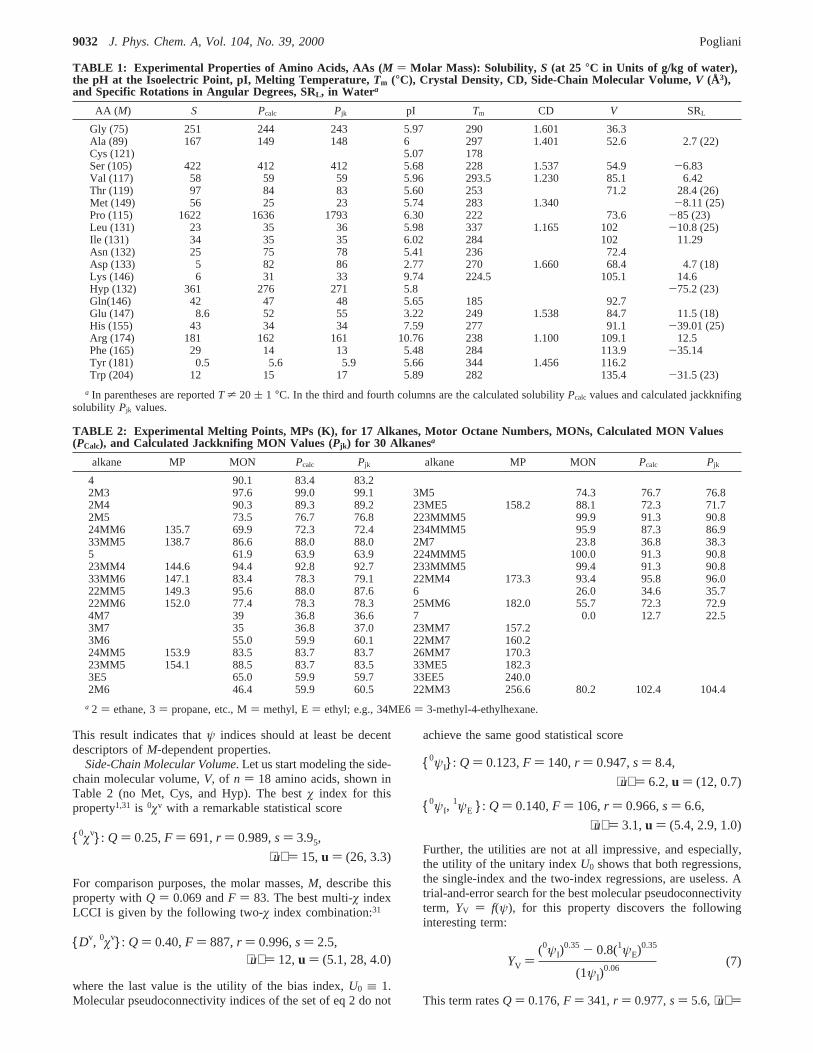
TABLE 1: Experimental Properties of Amino Acids, AAs (M ) Molar Mass): Solubility, S (at 25 °C in Units of g/kg of water),the pH at the Isoelectric Point, pI, Melting Temperature, Tm (°C), Crystal Density, CD, Side-Chain Molecular Volume,V (Å3),and Specific Rotations in Angular Degrees, SRL, in Watera
AA (M) S Pcalc Pjk pI Tm CD V SRL
Gly (75) 251 244 243 5.97 290 1.601 36.3Ala (89) 167 149 148 6 297 1.401 52.6 2.7 (22)Cys (121) 5.07 178Ser (105) 422 412 412 5.68 228 1.537 54.9 -6.83Val (117) 58 59 59 5.96 293.5 1.230 85.1 6.42Thr (119) 97 84 83 5.60 253 71.2 28.4 (26)Met (149) 56 25 23 5.74 283 1.340 -8.11 (25)Pro (115) 1622 1636 1793 6.30 222 73.6 -85 (23)Leu (131) 23 35 36 5.98 337 1.165 102 -10.8 (25)Ile (131) 34 35 35 6.02 284 102 11.29Asn (132) 25 75 78 5.41 236 72.4Asp (133) 5 82 86 2.77 270 1.660 68.4 4.7 (18)Lys (146) 6 31 33 9.74 224.5 105.1 14.6Hyp (132) 361 276 271 5.8 -75.2 (23)Gln(146) 42 47 48 5.65 185 92.7Glu (147) 8.6 52 55 3.22 249 1.538 84.7 11.5 (18)His (155) 43 34 34 7.59 277 91.1 -39.01 (25)Arg (174) 181 162 161 10.76 238 1.100 109.1 12.5Phe (165) 29 14 13 5.48 284 113.9 -35.14Tyr (181) 0.5 5.6 5.9 5.66 344 1.456 116.2Trp (204) 12 15 17 5.89 282 135.4 -31.5 (23)
a In parentheses are reportedT * 20 ( 1 °C. In the third and fourth columns are the calculated solubilityPcalc values and calculated jackknifingsolubility Pjk values.
TABLE 2: Experimental Melting Points, MPs (K), for 17 Alkanes, Motor Octane Numbers, MONs, Calculated MON Values(PCalc), and Calculated Jackknifing MON Values (Pjk ) for 30 Alkanesa
alkane MP MON Pcalc Pjk alkane MP MON Pcalc Pjk
4 90.1 83.4 83.22M3 97.6 99.0 99.1 3M5 74.3 76.7 76.82M4 90.3 89.3 89.2 23ME5 158.2 88.1 72.3 71.72M5 73.5 76.7 76.8 223MMM5 99.9 91.3 90.824MM6 135.7 69.9 72.3 72.4 234MMM5 95.9 87.3 86.933MM5 138.7 86.6 88.0 88.0 2M7 23.8 36.8 38.35 61.9 63.9 63.9 224MMM5 100.0 91.3 90.823MM4 144.6 94.4 92.8 92.7 233MMM5 99.4 91.3 90.833MM6 147.1 83.4 78.3 79.1 22MM4 173.3 93.4 95.8 96.022MM5 149.3 95.6 88.0 87.6 6 26.0 34.6 35.722MM6 152.0 77.4 78.3 78.3 25MM6 182.0 55.7 72.3 72.94M7 39 36.8 36.6 7 0.0 12.7 22.53M7 35 36.8 37.0 23MM7 157.23M6 55.0 59.9 60.1 22MM7 160.224MM5 153.9 83.5 83.7 83.7 26MM7 170.323MM5 154.1 88.5 83.7 83.5 33ME5 182.33E5 65.0 59.9 59.7 33EE5 240.02M6 46.4 59.9 60.5 22MM3 256.6 80.2 102.4 104.4
a 2 ) ethane, 3) propane, etc., M) methyl, E) ethyl; e.g., 34ME6) 3-methyl-4-ethylhexane.
{0øv}: Q ) 0.25,F ) 691,r ) 0.989,s ) 3.95,
⟨u⟩ ) 15,u ) (26, 3.3)
{Dv, 0øv}: Q ) 0.40,F ) 887,r ) 0.996,s ) 2.5,⟨u⟩ ) 12,u ) (5.1, 28, 4.0)
{0ψI}: Q ) 0.123,F ) 140,r ) 0.947,s ) 8.4,
⟨u⟩ ) 6.2,u ) (12, 0.7)
{0ψI,1ψE }: Q ) 0.140,F ) 106,r ) 0.966,s ) 6.6,
⟨u⟩ ) 3.1,u ) (5.4, 2.9, 1.0)
YV )(0ψI)
0.35 - 0.8(1ψE)0.35
(1ψI)0.06
(7)
9032 J. Phys. Chem. A, Vol. 104, No. 39, 2000 Pogliani
16, andu ) (19, 13). Not only the good score of the single0øv
continues to be unsurpassed, but if the score of the bestmolecular connectivity term of eq 8 is considered,Q ) 0.438,
F ) 2109,r ) 0.996,s ) 2.3, andu ) (46, 17), then theYV
term has no chance to compete withø-derived descriptors at
any statistical level. Both terms are “dead-end” terms; i.e., it isnot possible to improve the description with any linear combina-tion of terms or of terms and indices. In this respect, from nowon, it will be assumed that every term is a dead-end term, unlessit is used in an improved linear combination with otherdescriptors. If a mixed set composed of eight molecularconnectivity indices,{D, Dv, 0ø, 0øv, 1ø, 1øv, øt, øt
v}, and ofeight molecular pseudoconnectivity indices (see eq 2) isconsidered, then a very interesting modeling is achieved, quite
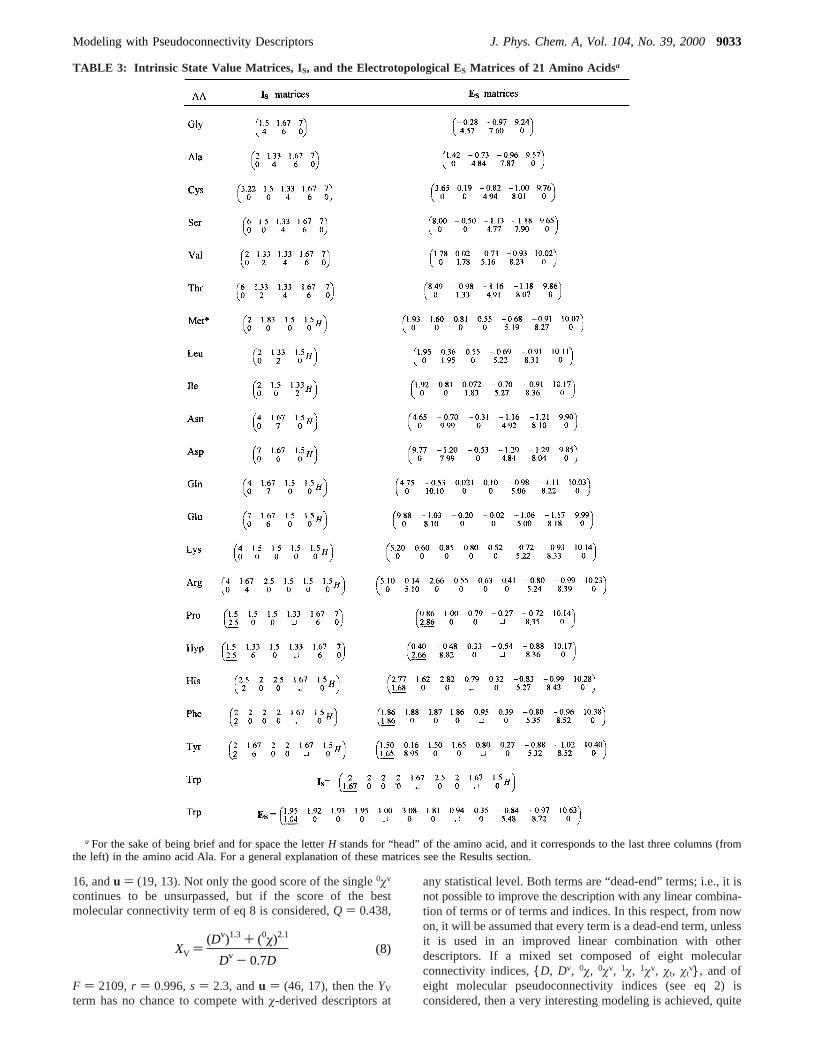
TABLE 3: Intrinsic State Value Matrices, I S, and the Electrotopological ES Matrices of 21 Amino Acidsa
a For the sake of being brief and for space the letterH stands for “head” of the amino acid, and it corresponds to the last three columns (fromthe left) in the amino acid Ala. For a general explanation of these matrices see the Results section.
XV )(Dv)1.3 + (0ø)2.1
Dv - 0.7D(8)
Modeling with Pseudoconnectivity Descriptors J. Phys. Chem. A, Vol. 104, No. 39, 20009033

similar to the modeling of the combination made up of twoøindices alone seen at the beginning of this paragraph
We will now try to check if a point in the data set is inflatingor deteriorating the modeling by leaving it out of the modelingand detecting the newQ value for the givenXV andYV termsto check which of these terms is too much influenced by aspecific point of the data set. This procedure will be appliedfor each data point, and the average⟨Q(X)⟩ and ⟨Q(Y)⟩ valuesas well as theQMAX and QMIN values for an excluded pointwill be given. This kind of leave-one-out method will be calledthe “Q-1-out” method. For V we have⟨Q(XV)⟩ ) 0.442,Q(XV)MIN ) 0.593 (Glu-out),Q(XV)MIN ) 0.423 (Trp-out), and⟨Q(YV)⟩ ) 0.176, Q(YV)MIN ) 0.201 (His-out),Q(YV)MIN )0.170 (many AA-out). No point is deteriorating or inflating, ina consistent way, the modeling.
Isoelectric Point. As this property is highly dependent on thetype of functional groups an amino acid has, its modeling affordsthe construction of specialYpI, as already done with normaløindices.2-4 In fact the best single pseudoindex rates quite poorly,{0ψI} with Q ) 0.153,F ) 1.4, r ) 0.3, ands ) 1.70, and nolinear combination of pseudoindices consistently improves themodeling. The statisticalQ/F score of the molar masses is,instead, much worse withQ ) 0.002 andF ) 0.14. The familyof eight terms that can be derived from the following generaltype of term can achieve an improved description:
Here∆n ) nA - nB, nA ) number of acidic groups (2 for Aspand Glu, 1 for all others),nB ) number of basic groups (2 forLys and His, 3 for Arg, and 1 for all others), andnT ) 3 (totalnumber of functional groups), and ifnT ) 2, then∆n ) 0.Clearly, there are eight such terms following the type ofψ indexin expression 9. The nomenclature for such terms can be definedin the following way: forψ ≡ SψE f YpI ≡ SYE, and so on.The best single descriptor for pI is the trivial,SYE, term, whichis just equal to 1+ ∆n/nT. This descriptor scoresQ ) 2.12,F
) 270,r ) 0.966,s ) 0.5, ⟨u⟩ ) 22, andu ) (16, 28). This 1+ ∆n/nT descriptor is also the best descriptor in theødescription. The following linear combination of two pseudoterms(LCpCI) improves the modeling only in a minor way:
Even the following convoluted higher-levelIS pseudoconnec-tivity term, with its score ofQ ) 2.20,F ) 288, r ) 0.969,s) 0.4, ⟨u⟩ ) 15, andu ) (17, 30), does not improve themodeling:
A conclusive word about pI simulation is given by a linearcombination of the two-XpI index (LCCT), and by a higher-level molecular connectivityX term. The two-X LCCT showsan unreliableu1 value, a fact which endangers the utility of thisLCCT
The following higher-level molecular connectivityXpI term,instead, shows an improved modeling power, withQ ) 3.41,F ) 693,r ) 0.987,s ) 0.3, ⟨u⟩ ) 58, andu ) (26, 90). Thisterm is in every insight better than the corresponding higher-level IS molecular pseudoconnectivity termYpI.
No interesting mixed{ø, ψ} descriptions can be obtained forpI.
The Q-1-out method for this property has⟨Q(XpI)⟩ ) 3.43,Q(XpI)MAX ) 4.16 (Cys-out),Q(XpI)MIN ) 3.31 (Asp-out), and⟨Q(YpI)⟩ ) 2.23,Q(YpI)MAX ) 3.43 (Lys-out),Q(YpI)MIN ) 2.10(Arg-out). The amino acid Cys is deteriorating the descriptivepower ofXpI, as without Cys the correlation coefficient enhances
TABLE 4: IS Molecular Pseudoconnectivity Indices for 21 Amino Acidsa
AA SψI0ψI
1ψITψI
SψE0ψE
1ψETψE
Gly 20.17 2.87653 1.64846 0.04876 55.59 1.79888 0.61430 0.00533Ala 22.00 3.63425 2.32607 0.03661 55.01 2.14940 0.78058 0.00179Cys 24.72 4.30090 2.87594 0.02356 63.23 2.52101 0.94227 0.00065Ser 27.50 4.15189 2.75426 0.01726 66.02 2.52046 0.96944 0.00061Val 25.33 5.20847 3.69109 0.02244 69.35 2.92156 1.10863 0.00026Thr 29.33 4.90961 3.43195 0.01296 73.34 2.91805 1.16460 0.00024Met 26.83 6.00647 4.23467 0.01804 76.37 3.29648 1.22896 0.00001Pro 23.00 5.50909 4.38551 0.03564 76.01 2.94957 1.21321 0.00029Leu 26.83 6.02497 4.35520 0.01833 76.36 3.30240 1.25155 0.00010Ile 26.83 6.02497 4.36330 0.01833 73.33 3.41587 1.26010 0.00013Asn 34.17 5.39543 3.73214 0.00618 83.68 3.26195 1.30864 0.00008Asp 36.17 5.30368 3.66114 0.00505 85.68 3.27170 1.33558 0.00008Lys 30.00 6.69313 4.82917 0.01150 85.01 3.66577 1.38908 0.000035Hyp 28.83 5.96795 4.82216 0.01545 78.34 3.32198 1.42521 0.00010Gln 35.67 6.21193 4.39881 0.00505 90.66 3.64139 1.44242 0.00003Glu 37.67 6.12018 4.32781 0.00412 92.67 3.64889 1.46916 0.00003His 32.17 7.19659 5.43098 0.00654 92.66 4.01363 1.63775 0.000012Arg 36.67 7.78291 5.53389 0.00345 102.66 4.36498 1.67151 0.000004Phe 33.17 8.05300 6.14710 0.00578 99.17 4.40001 1.78495 0.000005Tyr 38.84 8.52796 6.55737 0.00258 110.32 4.76156 1.97446 0.000002Trp 39.01 10.2331 8.32851 0.00219 121.50 5.51765 2.35735 0.0000002
a ψE values have been obtained after a rescaling procedure (see the Method section).
{0øv, 1ψE}: Q ) 0.373,F ) 764,r ) 0.995,s ) 2.7,
⟨u⟩ ) 9.1,u ) (17, 4.5, 5.9)
YpI ) ψSψE
(1 + ∆nnT
) (9)
{0YI,SYE}: Q ) 2.16,F ) 139,r ) 0.969,s ) 0.45,
⟨u⟩ ) 12.5,u ) (1.3, 9.4, 27)
YpI )(SYE - TψI)(
SψE - 0.8SψI)
(0ψI - TψI)(10)
{DXv, 0Xv}: Q ) 2.14,F ) 136,r ) 0.966,s ) 0.5,⟨u⟩ ) 12,u ) (1.2, 5.6, 28)
XpI )[(1øv)0.5 + 180øt
v]
D (0.04øtv - ∆n
nT) (11)
9034 J. Phys. Chem. A, Vol. 104, No. 39, 2000 Pogliani
up to r(XpI) ) 0.991, and the amino acid Lys is deterioratingthe corresponding modeling power ofYpI, as with Lys-outr(YpI)) 0.983.
Melting Temperature. Molar masses are very bad descriptorsfor the melting points,Tm, of 20 amino acids (no Hyp) withQ
) 0.003 andF ) 0.15. Normally the modeling of this propertyis rather problematic, but it can be interesting to detect howpseudoindices rate relative to connectivity indices. Theø-model-ing affords a molecular connectivity term,XTm, quite similar totheXpI term (see eq 9, where0øv replacesSψE), used to model
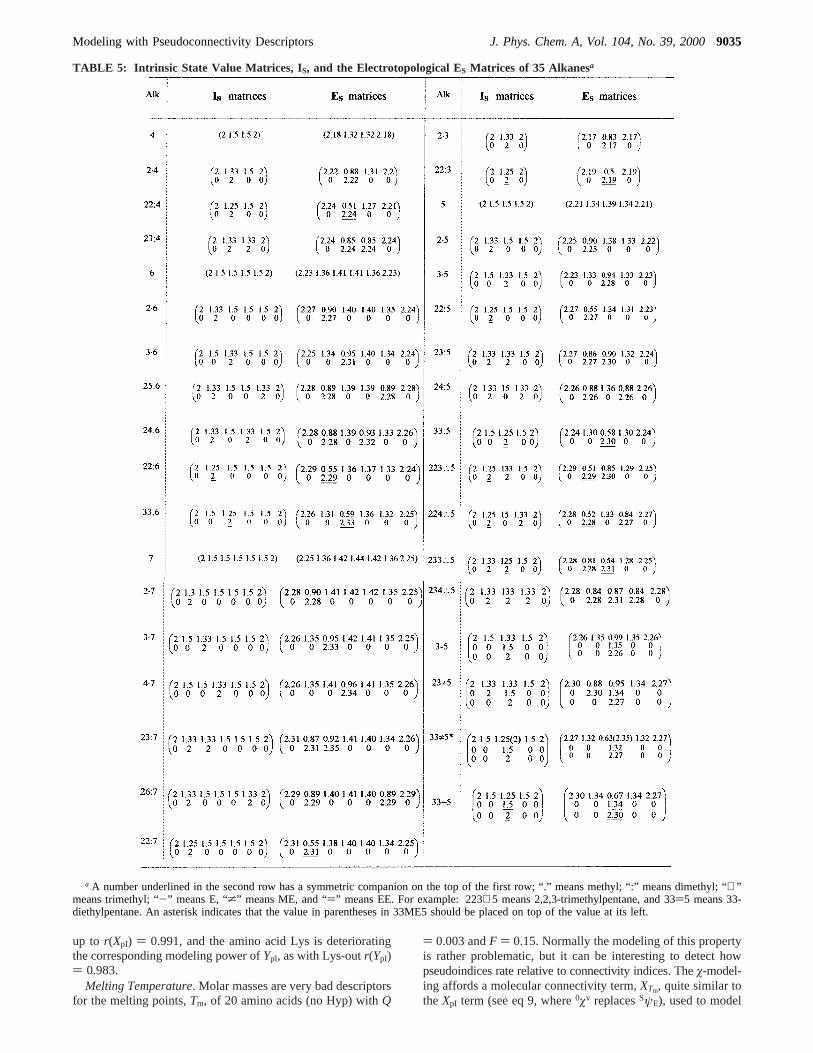
TABLE 5: Intrinsic State Value Matrices, I S, and the Electrotopological ES Matrices of 35 Alkanesa
a A number underlined in the second row has a symmetric companion on the top of the first row; “.” means methyl; “:” means dimethyl; “∴”means trimethyl; “-” means E, “*” means ME, and “)” means EE. For example: 223∴5 means 2,2,3-trimethylpentane, and 33)5 means 33-diethylpentane. An asterisk indicates that the value in parentheses in 33ME5 should be placed on top of the value at its left.
Modeling with Pseudoconnectivity Descriptors J. Phys. Chem. A, Vol. 104, No. 39, 20009035

pI. The main difference between the two properties resides inthe definition of∆n. Here, amino acids Leu and Tyr have∆n) 1, amino acids Pro, Ser, Thr, Cys, Asn, Asp, Gln, Glu, Lys,His, and Arg instead have∆n ) -1, and the rest have∆n )0.2,3 Practically the best molecular connectivity description isgiven by the following term:
Practically, because the0X term shows a very similar modelingpower, with a somewhat betterF ) 50, andr ) 0.857, we preferto stress the importance of the trivial index 1+ ∆n/nT ≡ 0Xv.The best molecular pseudoconnectivity description, instead, isgiven by a formally similarIS pseudoterm,YTm, where 0ψI
replacesSψE in eq 9 and where∆n fits the new definition usedfor XTm
The term{1YE}, where1ψE replacesψ in the numerator, achieveshere the best description withQ ) 0.039,F ) 54, r ) 0.867,s ) 22, ⟨u⟩ ) 6.4, andu ) (7.4, 5.4). Like the isoelectric point,no positive modeling forTm can be achieved with a mixed setof {ø, ψ} indices. Because the modeling of this property is farfrom being optimal and the approximations done are too drastic,the Q-1-out method will not be considered here.
Solubility. The modeling of the solubility,S, of 20 aminoacids (no Cys), whose experimental values are in Table 2, wasperformed with LCCI and with molecular connectivity terms.2-5
It was the modeling of this property, which includes such strong
outliers as Arg, Ser, Hyp, and Pro, that obliged introduction ofthe following set of reciprocal connectivity indices (R ) 1/ø)weighted by an association parameter,a:
where,a(Pro) ) 8, a(Ser, Hyp, Arg)) 2, anda(others)) 1.This parameter,a, which can be seen as a statistical weightingfactor, can, in some cases, assume the physical meaning of anassociation parameter, due to association or self-associationphenomena in solution.2 The fact that total connectivity indiceshave to be divided, instead of multiplied by the associationparametera, resides in their definition: their values decreasewith increasing complexity of the chemical graph.
While the modeling of the molar masses is quite insufficientwith Q ) 0.0009, andF ) 2.1, a single suprareciprocalmolecular connectivity index achieves a more than optimalmodeling
This modeling shows next to the exceptionally goodr and utilityvalues a rather unsatisfactorys value. The correlationC vectorfor this description isC ) (1010.8,-139.39).
A quite similar set of reciprocal pseudoconnectivity indiceshas to be introduced to model the same property, with the samevalues fora (R ) 1/ψ, i.e., 1RE ) 1/1ψE)
TABLE 6: IS-ψ Indices and the CorrespondingM Values for 35 Alkanes
alkane M SψI0ψI
1ψITψI
0ψE1ψE
TψE
4 58 7 3.04721 1.82137 0.33333 3.09535 1.93658 0.347522M3 58 7.33 2.98843 1.83942 0.30657 3.13418 2.23538 0.343382M4 72 8.83 3.80493 2.51162 0.25031 3.95622 2.95133 0.282852M5 86 10.33 4.62142 3.17829 0.20438 4.77695 3.62286 0.2320924MM6 114 13.66 6.19564 4.54075 0.12531 6.46451 5.35240 0.1557233MM5 100 12.25 5.35585 3.88021 0.14907 5.72225 5.20690 0.196055 72 8.5 3.86370 2.48803 0.27217 3.92127 2.62765 0.2864123MM4 86 10.66 4.56265 3.20444 0.18797 4.84192 4.07533 0.2344733MM6 114 13.75 6.17234 4.54687 0.12172 6.54557 5.86741 0.1615822MM5 100 12.25 5.35585 3.87168 0.14907 5.74679 5.18957 0.1992722MM6 114 13.75 6.17234 4.53835 0.12172 6.57797 5.88218 0.165154M7 114 13.33 6.25442 4.51716 0.13625 6.41035 4.98086 0.155093M7 114 13.33 6.25442 4.51716 0.13625 6.41562 4.99395 0.156043M6 100 11.83 5.43792 3.85049 0.16688 5.59164 4.31168 0.1896524MM5 100 12.16 5.37914 3.86854 0.15348 5.65026 4.66456 0.1907823MM5 114 12.16 5.37914 3.87664 0.15348 5.65779 4.76215 0.192013E5 100 11.83 5.43792 3.85603 0.16688 5.58260 4.31251 0.188592M6 100 11.83 5.43792 3.84495 0.16688 5.60066 4.30686 0.190743M5 86 10.33 4.62142 3.18382 0.20438 4.76721 3.63311 0.2303123ME5 114 13.66 6.19564 4.54884 0.12531 6.46593 5.41886 0.15633223MMM5 114 14.08 6.11357 4.57141 0.11194 6.67389 6.55196 0.16963234MMM5 114 13.95 6.13686 4.56946 0.11525 6.58029 5.98920 0.164402M7 114 13.33 6.25442 4.51162 0.13625 6.42647 4.99086 0.15732224MMM5 114 14.08 6.11357 4.56193 0.11194 6.65920 6.35212 0.16788233MMM5 114 14.08 6.11357 4.57440 0.11194 6.66292 6.56652 0.1691722MM4 86 10.75 4.53935 3.20501 0.18257 4.96477 4.64625 0.249316 86 10 4.68020 3.15470 0.22222 4.73859 3.30194 0.2338525MM6 114 13.66 6.19564 4.53521 0.12531 6.46544 5.32558 0.155507 100 11.50 5.49670 3.84373 0.18144 5.56001 3.98114 0.1917823MM7 128 15.16 7.01214 5.20997 0.10232 7.29928 6.10314 0.1291022MM7 128 15.25 6.98884 5.20501 0.09938 7.39435 6.54912 0.1344926MM7 128 15.16 7.01214 5.20188 0.10232 7.29573 6.01709 0.1288533ME5 114 13.75 6.17234 4.55540 0.12172 6.51454 5.84471 0.1584533EE5 128 15.25 6.98884 5.23059 0.09938 7.31469 6.50000 0.1286222MM3 72 9.25 3.72285 2.52982 0.22361 4.11716 3.82255 0.29487
{0Xv}: Q ) 0.037,F ) 48, r ) 0.854,s ) 23,⟨u⟩ ) 6, u ) (6.9, 6.1)
YTm) ψ
0ψI(1 + ∆n
nT) (12)
{aR} ) {aDR, aDRv, a0R, a0Rv, a1R, a1Rv, Rt/a, Rtv/a} (13)
{a0Rv}: Q ) 0.029,F ) 2052,r ) 0.996,s ) 35,⟨u⟩ ) 29,u ) (45, 13)
{a(1/ψ)} ){aSRI, a0RI, a1RI,
TRI/a, aSRE, a0RE, a1RE, TRE/a} (14)
9036 J. Phys. Chem. A, Vol. 104, No. 39, 2000 Pogliani
The best description is given by the followingIS pseudo-suprareciprocal index:
This last description is a much worse description than thecorresponding 1/ø description.
Now if the modeling is done by the aid of the combined setof eqs 13 and 14, then it is possible to find the followinginteresting combination
whose negative point is the lowu2 utility value of the secondindex and also a poors value. Also the combination{a0Rv,TRE/a} shows a similar descriptive power withQ ) 0.028,F )1005, and similar pooru2 ands values.
The Q-1-out method for the solubility of amino acids has⟨Q(a0Rv)⟩ ) 0.029,Q(a0Rv)MAX ) 0.035 (Hyp-out),Q(a0Rv)MIN
) 0.028 (many AA-out), and⟨Q(a0RI)⟩ ) 0.014,Q(a0RI)MAX
) 0.025 (Ser-out),Q(a0RI)MIN ) 0.011 (Pro-out). While theamino acid Hyp has a minor influence onr, which, with Hyp-out, equalsr(a0Rv) ) 0.997, the amino acid Ser has a greaterinfluence onr of {a0RI}, which, with Ser-out, equalsr(a0RI) )0.994. To further determine the individual influence of a givenexperimental point on the modeling characteristics of{a0Rv},we remove sequentially each solubility value from the data setand determine again theC vector of the model, and the newmodel is used to predict the observation left out. In the thirdcolumn of Table 1 are reported the calculatedPcalc solubilityvalues with the normalC ) (1010.8,-139.39) vector, and inthe fourth column of the same table are reported thePjk
calculated solubility values calculated with this method, wherethe subscript jk stands forjackknifing, the vulgar name for thissort of external validation method, which has in theQ-1-outmethod another example. It should be noticed that calculatedSvalues, to avoid negative values (here Trp), have been obtainedwith the modulus equationS ) |c1(a0Rv) + c2U0|. The figuresin columnsPcalc andPjk are of interest. In spite of some minorvariations there is hardly any doubt that there is a similar trendall along the two sets of values; further, the coefficients of thecorrelation vector all along the jackknifing procedure show onlyminor variations (∼2%). Closer analysis of bothPcalc andPjk
shows that, while prediction of the solubility of some aminoacids is insufficient, prediction ofS(Asp) fails totally. TheQ-1-out method for Asp-out hasQ ) 0.033, quite close toQMAX,and this shows that the two methods even if complementary donot superpose. The negative results are to be ascribed to thepoor s value. The physical meaning of this failure might bedue to the neglect of other association phenomena in solution.
Specific Rotation. The specific rotation of 16L-amino acids,SRL (in angular degrees, normally given as [R]25
D) is aninteresting property, as not only some of its values are negative,but also because the modeling of SRL leads directly to thecorresponding modeling of SRD for theD-amino acids. In fact,the SRD modeling can be achieved with just a change in signof the correlation vector, i.e,CL ) - CD.4,5,31 Practically, amodeling done onn amino acids is in this way automaticallyextended to 2n amino acids. Molar mass once again is a quitedeceiving descriptor, withQ ) 0.0003 andF ) 0.34. The overallbest molecular connectivity description is given by the followingcombination of two reciprocal connectivity indices (R ) 1/ø)
while the overall best single index description is quite poor andis achieved by{øt} with Q ) 0.014 andF ) 3.2. The trial-and-error procedure discovers the following optimal term forSR
with the following statistics:Q ) 0.084,F ) 112, r ) 0.943,s ) 11, ⟨u⟩ ) 11, u ) (11, 11).
Molecular pseudoconnectivity indices do not achieve the samekind of description; further there are no reciprocal pseudoindiceswith improved modeling power. While the best single pseudo-index description is given by{1ψI} with Q ) 0.011 andF )1.9, the best two pseudoindex descriptions do not achieve thesame optimal description of the reciprocal 1/ø combination
The IS molecular pseudoconnectivity termYSR of eq 16 withQ) 0.059,F ) 56, r ) 0.894,s ) 15, ⟨u⟩ ) 10, andu ) (7.5,12) cannot be compared withXSR
This last term shows a rather homogeneous structure as it ismade up ofψI-type indices only. Here, use of the mixed set{ø, ψ} of eight molecular connectivity indices and eightIS
molecular pseudoconnectivity indices allows the followingcombination that achieves a better modeling than the set of twoIS molecular pseudoconnectivity indices to be found:
TheQ-1-out method for this property has⟨Q(XSR)⟩ ) 0.084,Q(XSR)MAX ) 0.092 (Leu- and Arg-out),Q(XSR)MIN ) 0.079(Pro-out), and⟨Q(YSR)⟩ ) 0.060,Q(YSR)MAX ) 0.069 (Thr-out),Q(YSR)MIN ) 0.054 (Pro-out). Practically, no amino acid isdeteriorating or inflating the modeling power of bothXSR andYSR terms.
Crystal Density. Let us start noticing that the descriptivepower of the molar mass for this property, forn ) 10 aminoacids, is Q ) 1.9 and F ) 1.1. The best molecularIS
pseudoconnectivity index and the best two-index LCpCI for the10 points of this property are
These last values should be compared with the modeling powerof the corresponding molecular connectivity indices, which showonly a small but evident improvement relative to the aforemen-tioned indices4,31
{a0RI}: Q ) 0.013,F ) 418,r ) 0.979,s ) 77,
⟨u⟩ ) 15,u ) (23, 6.2)
{a0Rv, TRI/a}: Q ) 0.028,F ) 1009,r ) 0.996,s ) 35,
⟨u⟩ ) 17,u ) (41, 0.83, 8.1)
{DR, 0R}: Q ) 0.089,F ) 62, r ) 0.952,s ) 11,⟨u⟩ ) 9.2,u ) (11, 11, 5.8)
XSR )0ø - (øt
v)0.3
D0.8 + 0.2(øt)0.02
(15)
{1ψI,0ψI }: Q ) 0.044,F ) 15, r ) 0.838,s ) 19,
⟨u⟩ ) 4.5,u ) (5.1, 5.3, 3.2)
YSR )1ψI + 15TψI
(0ψI - 1ψI)1.5
(16)
{0ø, 0ψE}: Q ) 0.056,F ) 25, r ) 0.892,s ) 16,
⟨u⟩ ) 6.4,u ) (7.0, 7.1, 5.1)
{0ψI}: Q ) 2.38,F ) 1.9,r ) 0.43,s ) 0.2,
⟨u⟩ ) 4.8,u ) (1.4, 8.3)
{0ψI,0ψE}: Q ) 6.81,F ) 7.6,r ) 0.827,s ) 0.1,
⟨u⟩ ) 4.9,u ) (3.5, 3.3, 7.7)
Modeling with Pseudoconnectivity Descriptors J. Phys. Chem. A, Vol. 104, No. 39, 20009037
But a more accurate descriptor for this property is surely thefollowing IS molecular pseudoconnectivity term, which showsa nice improvement in every statistics, withQ ) 9.92,F ) 32,r ) 0.895,s ) 0.1, ⟨u⟩ ) 4.1, andu ) (5.7, 2.6)
This pseudoterm even overrates the corresponding molecularconnectivity term, whose statistical score isQ ) 7.91,F ) 20.4,r ) 0.848,s ) 0.1, ⟨u⟩ ) 5.4, andu ) (4.5, 6.4).
The only negative point ofYCD is the low utility value forU0.But the last word about the modeling of the crystal density isleft to a combination of a molecular connectivity index and amolecular pseudoconnectivity index, which by far overrates eventhe found trial-and-error terms
It is interesting to notice that these two indices, a normal and aIS molecular pseudoconnectivity index, are quite correlated withr(0ø, SψE) ) 0.987.
TheQ-1-out method for CD has⟨Q(XCD)⟩ ) 8.09,Q(XCD)MAX
) 12.0 (Arg-out),Q(XCD)MIN ) 7.07 (Leu-out), and⟨Q(YCD)⟩) 10.5,Q(YCD)MAX ) 18.7 (Met-out),Q(YCD)MIN ) 8.98 (Asp-out). While the amino acid Arg is deteriorating the descriptivepower ofXCD, as with Arg-outr(XCD) is enhanced to 0.907, theamino acid Met is deteriorating in a consistent way thedescriptive power ofYCD, as with Met-outr(YpI) is enhanced to0.970.
Alkanes. Alkanes do not have multiple bonds and lone-pairelectrons; for this reason the subset{øv} of valence molecularconnectivity indices coincides with the subset of nonvalence{ø} indices. For pseudoconnectivity indices, instead, the onlyreduction in number ofIS pseudoindices is due to the E-staterelation, SψI ≡ SψE, which reduces the number of chosenpseudoindices from eight to seven only, i.e.,{SψI, 0ψI, 1ψI, TψI
, 0ψE, 1ψE, TψE}. That for alkanes the relationSψI ≡ SψE holdsis due to the fact thatψE values need not be rescaled, as everyS value is here positive.
Motor Octane Number. While the description of this propertyfor 30 alkanes (see Table 2) by the aid of the molar masses isvery bad withQ ) 0.006,F ) 0.79, andr ) 0.17, an optimaldescription ofM is, instead, achieved by the{1ψI} pseudoindexwith Q ) 2.60,F ) 61496,r ) 0.9998, ands ) 0.4. The bestconnectivity index forM, {D}, achieves onlyQ ) 0.262,F )625,r ) 0.978, ands ) 3.7. The modeling of the motor octanenumber with indices of the set{D, 0ø, 1ø, øt}2,4,5 shows anunsatisfactory description at the level of the best single-index{øt} which fares onlyQ ) 0.015 andF ) 4.7, while the bestthree-index LCCI shows an adequate modeling with
The trial-and-error search finds a very effectiveXMON term,whose ratings are
This dominant term offers the possibility, through a forwardcombinatorial search, to find a mixed linear combination madeup of a molecular connectivity term and three molecularconnectivity indices, with enhancedQ, r, ands values
Molecular pseudoconnectivity indices, which have a meaninterrelation of ⟨r⟩ ) 0.964, rmax(SψI, 0ψE) ) 0.998, andrmin(1ψE, TψE) ) 0.86, show a satisfactory modeling only witha LCpCI of four indices
Combinations with more indices do not improve any furtherthe descriptive power of the modeling. The following molecularpseudoconnectivity term,YMON, found by a trial-and-errorprocedure, instead, shows a more than impressive modelingpower, which overrates even the descriptive power ofXMON
This term in a linear combination with the1ψE descriptor showsa small improvement inQ ) 0.110, due to an improvedr )0.950, butF worsens toF ) 124. The correlation vector of thispseudoterm isC ) (-5.29525, 127.268). No mixed set{ø, ψ}LCCI shows an improved modeling.
The Q-1-out method for this property of alkanes has⟨Q(XMON)⟩ ) 0.085, Q(XMON)MAX ) 0.095 (22MM3-out),Q(XMON)MIN ) 0.081 (7-out), and⟨Q(YMON)⟩ ) 0.108,Q(YMON)MAX ) 0.124 (22MM3-out),Q(YMON)MIN ) 0.105(4M7-out). Alkane 22MM3 is not consistently deteriorating thedescriptive power of bothXMON andYMON, and also, no alkaneis excessively inflating the modeling of MON in bothX andYrepresentations. In Table 2, the fourth, fifth, ninth, and lastcolumns report the calculated MON values and the calculatedMON jackknifing values,Pcalc andPjk, respectively. The twosets of values,Pcalc andPjk, are quite similar, more similar thanthe corresponding values for the solubility of the amino acids.The only consistent deviation betweenPcalc and Pjk can bedetected in compound 22MM3. Even here calculated MONvalues have been obtained with the modulus equation MON)|c1YMON + c2U0|, as alkane 7 hasPcalc < 0.
Melting Temperature. The modeling of the subclass of 17melting points of Table 2, which is made up of similar alkanes,[MMi + MEi + EEi], where i is the main chain, and M and E
{0øv}: Q ) 3.44,F ) 3.9,r ) 0.570,s ) 0.2,⟨u⟩ ) 5.4,u ) (2.0, 8.9)
{Dv, 0ø}: Q ) 9.05,F ) 13, r ) 0.890,s ) 0.10,⟨u⟩ ) 11.5,u ) (4.7, 5.2, 13)
YCD )(SψI)
0.7 + 2.1(1ψI)1.2
0ψI - 0.8(1ψE)1.1 - 0.8(TψI)0.7
(17)
XCD )(0øv)1.2 + 1.80ø
(1ø)0.8 - 1.3(øt)2.1
(18)
{0ø, SψE}: Q ) 12.2,F ) 24, r ) 0.935,s ) 0.1,
⟨u⟩ ) 10,u ) (6.7, 6.4, 17)
{D, 0ø, 1ø}: Q ) 0.092,F ) 57, r ) 0.932,s ) 10,u ) (6.1, 7.1, 4.3, 5.3),⟨u⟩ ) 5.7
Q ) 0.085,F ) 146,r ) 0.916,s ) 11,⟨u⟩ ) 19.5,u ) (12, 27)
XMON )(0ø‚øt)
0.1 + (D)1.3
(0ø - 1.51ø)1.2(19)
{XMON, D, 0ø, 1ø}: Q ) 0.129,F ) 85, r ) 0.965,s ) 7.9,
⟨u⟩ ) 7.5,u ) (4.8, 5.6, 5.4, 5.4, 4.1)
{SψI,0ψI,
TψI,TψE }: Q ) 0.107,F ) 59, r ) 0.951,
s ) 8.9,u ) (8.9, 8.3, 5.5, 4.7, 0.5),⟨u⟩ ) 5.6
Q ) 0.108,F ) 237,r ) 0.946,s ) 8.7,u ) (15, 32),⟨u⟩ ) 24
YMON )SψI + TψE
(SψI - 20ψI)1.2
(20)
9038 J. Phys. Chem. A, Vol. 104, No. 39, 2000 Pogliani
stand for methyl and ethyl substitutents along the main chain,has never been satisfactory.2 The best single descriptor for thisset of compounds is the followingXMP term, whose statisticalratings are
The subscript MP stands for melting points to differentiate itfrom the subscriptTm used for amino acids. This term is farfrom being an optimal descriptor, and a better but not optimaldescription for this property can be achieved by a normal LCCIcomposed by the following two indices:
The given description is nevertheless much better than thedescription achieved by molar masses, which shows the fol-lowing statistical values:Q ) 0.005,F ) 0.38, andr ) 0.16.
The bestIS molecular pseudoconnectivity descriptor for thisproperty is the followingYMP term, highly influenced by thetotal type of pseudoindices,Tψ. This IS-ψ term rates
This term overrates the descriptive power ofXMP. It is, further,important to notice that single-ψ or LCpCI fares better thansingle-ø or LCCI descriptions. In fact, for what concerns thesingle descriptors we have in both graph-ø and IS-ψ repre-sentations{øt}, Q ) 0.011,F ) 2, r ) 0.339,s ) 32, and{TψI}, Q ) 0.023,F ) 9, r ) 0.617,s ) 27. Noteworthy isalso the descriptions achieved by a mixed combination ofmolecular connectivity and pseudoconnectivity indices, whosemodeling power is not unimportant:{øt, TψE}, Q ) 0.040,F )14, r ) 0.817,s ) 21, u ) (5.0, 4.8, 6.6),⟨u⟩ ) 5.5.
The Q-1-out method for MP has⟨Q(XMP)⟩ ) 0.033,Q(XMP)MAX ) 0.056 (33EE5-out),Q(XMP)MIN ) 0.017 (22MM3-out) and⟨Q(YMP)⟩ ) 0.066,Q(YMP)MAX ) 0.075 (33ME5- and22MM5-out), Q(YMP)MIN ) 0.058 (22MM3-out). For whatconcerns the descriptive power ofXMP, while alkane 33EE5 isdeteriorating the description, in fact, with 33EE5-out we haver(XMP) ) 0.856, alkane 22MM3 is, instead, inflating dramati-cally the description, in fact, with 22MM3-outr(XMP) worsens
to 0.405. The descriptive power ofYMP instead is not deterioratedby 33ME5 and 22MM5, as with 33ME5-out and 22MM5-outwe haver(YMP) ) 0.935.
Lattice Enthalpy of Inorganic Salts. The lattice enthalpiesof n ) 20 metal halides, MeX, of Table 7 can be modeled inan adequate way by the molar massM, with Q ) 0.015,F )45, andr ) 0.846. The bestψ descriptor forM is {0ψI} withQ ) 0.028,F ) 62, r ) 0.880, ands ) 31, while the bestøindex for M is {1øv} with Q ) 0.030,F ) 70, r ) 0.895, ands) 29. For these metal halides, whose graph may approximatelybe represented as two connected points,bsb, we have1ψI ≡TψI and 1ψE ≡ TψE, while SψI and SψE are nearly coincidentwith r ) 0.99998. The overall mean⟨r⟩ equals 0.941, and theweakest interrelation isr(0ψI, SψE) ) 0.863. The best single-,two-, and three-index LCpCI descriptions are
From these ratings we notice the overall good quality of thethree-index LCpCI. Only the average utility decreases alongthis series but not in a way to endanger the utility of the LCpCI.Now, three indices to model twenty properties could be judgeda rather risky choice. A trial-and-error procedure discovers, infact, the following very goodIS pseudo-term
whose statistical values areQ ) 0.053,F ) 584, r ) 0.985,s) 19, u ) (24, 28), and⟨u⟩ ) 26. The correlation vector isC) (373.966, 406.508), and no mixed set{ø, ψ} combinationoffers a LCpCI with better modeling. The connectivity descrip-tors show, instead, the following modeling power:
TABLE 7: Intrinsic State Value Vectors, I S, and the Electrotopological ES Vectors of 20 Metal Halids, MeXa
MeX (M) I S vector ES vector MeX (M) I S vector ES vector
LiF (25.9) (2 8) (0.5 9.5) LiCl (42.4) (2 4.11) (1.47 4.64)NaF (42) (1.44 8) (-0.19 9.64) NaCl (58.4) (1.44 4.11) (0.78 4.78)KF (50.1) (1.25 8) (-0.44 9.69) KCl (74.6) (1.25 4.11) (0.53 4.83)RbF (10.5) (1.16 8) (-0.55 9.71) RbCl (120.9) (1.16 4.11) (0.42 4.85)CsF (151.9) (1.11 8) (-0.61 9.72) CsCl (168.4) (1.11 4.11) (0.36 4.86)LiBr (86.8) (2 2.75) (1.81 2.94) LiI (133.8) (2 2.12) (1.97 2.15)NaBr (102.9) (1.44 2.75) (1.12 3.08) NaI (149.9) (1.44 2.12) (1.28 2.29)KBr (119) (1.25 2.75) (0.88 3.13) KI (166) (1.25 2.12) (1.03 2.34)RbBr (165.4) (1.16 2.75) (0.76 3.15) RbI (212.4) (1.16 2.12) (0.92 2.36)CsBr (212.8) (1.11 2.75) (0.70 3.16) CsI (259.8) (1.11 2.12) (0.86 2.37)
a M ) molar mass.
Q ) 0.033,F ) 19, r ) 0.749,s ) 23,⟨u⟩ ) 5.7,u ) (4.4, 7.0)
XMP )(D - 0ø)2
(1ø - 3.9øt)0.6
(21)
{1ø, øt}: Q ) 0.043,F ) 16, r ) 0.834,s ) 20,
⟨u⟩ ) 5.0,u ) (5.2, 5.6, 4.3)
Q ) 0.066,F ) 77, r ) 0.914,s ) 14,⟨u⟩ ) 26,u ) (8.8, 43)
YMP ) ( TψI + TψE
1ψI - 0.8TψE)6
(22)
{0ψI }: Q ) 0.027,F ) 157,r ) 0.947,s ) 35,
u ) (12, 23),⟨u⟩ ) 18
{0ψI,1ψI }: Q ) 0.040,F ) 167,r ) 0.975,s ) 24,
u ) (8.1, 4.4, 16),⟨u⟩ ) 9.6
{0ψI,1ψI,
SψE }: Q ) 0.060,F ) 250,r ) 0.989,s ) 17,
u ) (13, 7.6, 4.6, 16),⟨u⟩ ) 10
Y∆H )(1.50ψE + 1ψE)8
(0ψI)5
(23)
{0øv}: Q ) 0.015,F ) 45, r ) 0.846,s ) 57, ⟨u⟩ ) 17
{Dv, 0øv}: Q ) 0.033,F ) 115,r ) 0.965,s ) 29, ⟨u⟩ ) 19
{0øv, 1øv, Dz}: Q ) 0.043,F ) 131,r ) 0.980,s ) 22,⟨u⟩ ) 6.3
X∆H )(Dv)0.5 + 0.2
Dv + 4.20øv(24)
Modeling with Pseudoconnectivity Descriptors J. Phys. Chem. A, Vol. 104, No. 39, 20009039
The modeling power of this term isQ ) 0.037,F ) 281, r )0.969,s ) 24,u ) (17, 65), and⟨u⟩ ) 41. Theu2 utility of theX∆H terms improves over theu2 utility of the Y∆H term but atsome expense of theu1 utility. No mixed {ø, ψ} indexdescription is worth being cited for this property.
TheQ-1-out method for this property of metal halides shows⟨Q(X∆H)⟩ ) 0.037,Q(X∆H)MAX ) 0.042 (NaBr-out),Q(X∆H)MIN
) 0.035 (LiF-out), and⟨Q(Y∆H)⟩ ) 0.053,Q(Y∆H)MAX ) 0.062(LiCl- or KF-out), Q(Y∆H)MIN ) 0.051 (for many consecutivelyMeX-out). For what concerns the descriptive power of bothtermsX∆H and Y∆H neither of them seems to be consistentlyinfluenced by the exclusion of any metal halide. In the thirdcolumn of Table 8 the calculated lattice enthalpy values,Pcalc,with vectorC ) (373.966, 406.508) are shown, and along thefourth column of the same table the corresponding jackknifingvalues,Pjk, are shown. The two sets of values are quite similar,even more similar than the MON case.
Singlet Excitation Energies of DNA/RNA Bases.The firstand second singlet excitation energies,∆E1 and∆E2, of DNA/RNA bases A, G, U, T, and C offer an interesting benchmarkfor the newly definedIS molecular pseudoconnectivity indices.
In fact these two dimensionally similar properties have recently4
been modeled by a single and the same molecular connectivityterm, whose form and statistical values are
From these results it is evident thatX∆E is a good∆E2 descriptor,while the description of∆E1 is less satisfactory. The discrepancyin Q values (the bestQ value for the worser value) is due tothe largersvalue for∆E2, as the originalsvalue for∆E1 equals0.088. The interesting side of this modeling resides in the“broad” validity of this term, which is an optimal descriptorfor both properties. Now, if pseudoconnectivity terms are used,not only the “broad” validity is maintained but is even en-
TABLE 8: Experimental Lattice Enthalpies ∆HLL at 298.15 K (kJ mol-1) for 20 Metal Halides, MeX, Their Corresponding
Calculated (Pcalc) and Calculated Jackknifing (Pjk ) Values, and theIS Molecular Pseudoconnectivity Valuesa
MeX ∆HLL Pcalc Pjk
SψI0ψI
1ψISψE
0ψE1ψE
LiF 1037 1026 1018 10 1.06066 0.25 21 0.66645 0.10541NaF 926 885 879 9.44 1.18689 0.29463 20.45 0.69097 0.11153KF 821 828 828 9.25 1.24798 0.31623 20.25 0.70113 0.11406RbF 789 796 797 9.16 1.28203 0.32827 20.16 0.70588 0.11525CsF 750 778 780 9.11 1.30271 0.33558 20.11 0.70854 0.11592LiCl 852 892 899 6.11 1.20037 0.34879 17.11 0.69281 0.11895NaCl 786 775 774 5.55 1.32660 0.41105 16.56 0.71094 0.12446KCl 717 728 729 5.36 1.38769 0.44119 16.36 0.71837 0.12670RbCl 695 703 704 5.27 1.42174 0.45798 16.27 0.72183 0.12775CsCl 678 689 689 5.22 1.44242 0.46819 16.22 0.72378 0.12834LiBr 815 819 819 4.75 1.31013 0.42640 15.75 0.71408 0.12731NaBr 752 722 721 4.19 1.43636 0.50252 15.20 0.73006 0.13269KBr 689 683 682 4 1.49745 0.53936 15.01 0.73631 0.13477RbBr 668 663 663 3.91 1.53150 0.55989 14.91 0.73969 0.13590CsBr 654 652 651 3.86 1.55218 0.57236 14.86 0.74142 0.13647LiI 761 763 763 4.12 1.39391 0.48564 15.12 0.72743 0.13229NaI 705 683 681 3.56 1.52014 0.57234 14.57 0.74234 0.13760KI 649 651 651 3.37 1.58123 0.61430 14.37 0.74847 0.13976RbI 632 634 634 3.28 1.61528 0.63768 14.28 0.75136 0.14077CsI 620 624 624 3.23 1.63596 0.65188 14.23 0.75299 0.14135
a ψE values have been obtained after a rescaling procedure (see the Method section).
TABLE 9: Intrinsic State Value Matrices, I S, and the Electrotopological ES Matrices of the Five DNA/RNA Basesa
a Their molar masses,M, are given in parentheses.
X∆E ) ( 0ø
øt + 1000øtv)5
(25)
∆E1: Q ) 8.96,F ) 4.5,r ) 0.790,s ) 0.1,
u ) (2.3, 107),⟨u⟩ ) 55
∆E2: Q ) 6.85,F ) 44, r ) 0.967,s ) 0.14,
u ) (6.6, 86),⟨u⟩ ) 46
9040 J. Phys. Chem. A, Vol. 104, No. 39, 2000 Pogliani

hanced; in fact following term shows enhanced statistics forboth energies:
Even here the discrepancy inQ values is due to the differents
vales (s ) 0.085 and 0.11, respectively). For comparisonpurposes it is to be noticed that the molar masses as descriptorsrate, for∆E1, Q ) 4.9, F ) 1.5, andr ) 0.578, and, for∆E2,Q ) 3.7,F ) 13, andr ) 0.899. The last result for∆E2 is theonly interesting modeling achieved byM in this study.
QSAR Studies of Chlorofluoroalkanes (CFCs) and of2-Bromo-2-Phenethylamines (BrPhAm).Rates of HydrogenAbstraction. Recently, it has been possible to simulate by theaid of the E-state index of the carbon atom bonding the largestnumber of hydrogen atoms,S(1), and of two non-E-statedescriptors, the3øc molecular connectivity index, and the1κRshape index33 the rates of hydrogen abstraction in units of logK of 26 CFCs, that is, the effect of their reaction with the
TABLE 10: Experimental First ∆E1 and Second∆E2 Singlet Excitation Energies (eV) of the DNA/RNA Bases and TheirCorresponding IS Molecular Pseudoconnectivity Valuesa
base ∆E1 ∆E2SψI
0ψI1ψI
TψISψE
0ψE1ψE
TψE
A 4.75 5.99 24.51 6.60019 5.08618 0.01410 79.50 3.60497 1.49359 0.00004G 4.49 5.03 30.68 7.09998 5.54098 0.00639 91.27 3.98554 1.71209 0.00001U 4.81 6.11 26.34 4.98270 3.54757 0.01711 70.33 2.88573 1.16416 0.00024T 4.67 5.94 28.01 5.75652 4.19355 0.01324 77.50 3.27130 1.32709 0.00009C 4.61 6.26 23.84 5.04963 3.55672 0.02066 67.92 2.86843 1.12262 0.00025
a ψE values have been obtained after a rescaling procedure (see the Method section).
TABLE 11: Intrinsic State Value Matrices, I S, and the Electrotopological ES Matrices of 32 Chlorofluorocarbons (CFCs)a
a A number underlined in the second row has a symmetric companion on the top of the first row.
Y∆E ) ( SψI - 4.81ψI
TψI + 120TψE)4
(26)
∆E1: Q ) 9.34,F ) 5.4,r ) 0.802,s ) 0.09,
u ) (2.4, 105),⟨u⟩ ) 54
∆E2: Q ) 8.62,F ) 70, r ) 0.979,s ) 0.1,
u ) (8.3, 103),⟨u⟩ ) 56
Modeling with Pseudoconnectivity Descriptors J. Phys. Chem. A, Vol. 104, No. 39, 20009041
hydroxyl radical. In Table 11 are collected the two-row matricesor vectors of 32 CFCs, where the last 6 CFCs are used to modelthe next activity. From these matricesS(1) values can easily beread, but they are also reported in ref 32. In Table 12 are, instead,collected the 26{ψ} values together with the logK values. Itis here interesting to stress that the subsets of monosubstituted,bisubstituted, and trisubstituted CFC compounds at the samecarbon atom and at two different carbon atoms share the samevalue for each of the four molecular connectivity indices ofsubset{D, 0ø, 1ø, tø}. The modeling achieved by the linearcombination{S(1),3øc, 1κR} is quite good withQ ) 3.47,F )60, r ) 0.943,s ) 0.3, u ) (10, 11, 9.4, 3.9), and⟨u⟩ ) 8.6.Let us start saying that pseudoconnectivity indices (see Table12) are not able to achieve a better modeling with any linearcombination of three indices or less, but things are completelydifferent at the level of a single descriptor. The best singledescriptor among the three given indices isS(1), with Q ) 0.861,F ) 11, r ) 0.560,s ) 0.7,u ) (3.3, 53), and⟨u⟩ ) 28. Now,the following IS pseudoconnectivity term has the features of anoverall dominant descriptor for this activity
with Q ) 2.03,F ) 61, r ) 0.847,s ) 0.4,u ) (7.7, 41),⟨u⟩) 24. This is not the best overall term that can be found by atrial-and-error procedure; a more convoluted term, such as the
one of eq 28, offers a somewhat better description withQ )2.07,F ) 63, r ) 0.852,s ) 0.4, u ) (8, 41), ⟨u⟩ ) 24
Clearly, the small improvement due to the second term doesnot decrease the importance, due to its simplicity (kind ofOccam’s razor) of the term of eq 27, and this goes also to showhow the search procedure for the terms works. Interestinglyenough is the fact that a linear combination of term 28 with thetwo aforementioned indices achieves a modeling similar to{S(1), 3øc, 1κR}
Only u2-u4 values differ consistently along the two combina-tions. The interrelation between{Y′log K, 3øc, 1κR} indices is quitelow with r(Y′log K, 3øc) ) 0.28,r(Y′log K, 1κR) ) 0.20, andr(3øc,1κR) ) 0.80. While the{Y′log K, 3øc, 1κR} combination achievesa somewhat better modeling than the{S(1), 3øc, 1κ} combination,the combination{Ylog K, 3øc, 1κR}, instead, hasQ ) 3.42 andF) 58, only a bit worse than the{S(1), 3øc,1κ} combination.Molar masses, again, rate quite poorly withQ ) 0.042,F )0.03, andr ) 0.033.
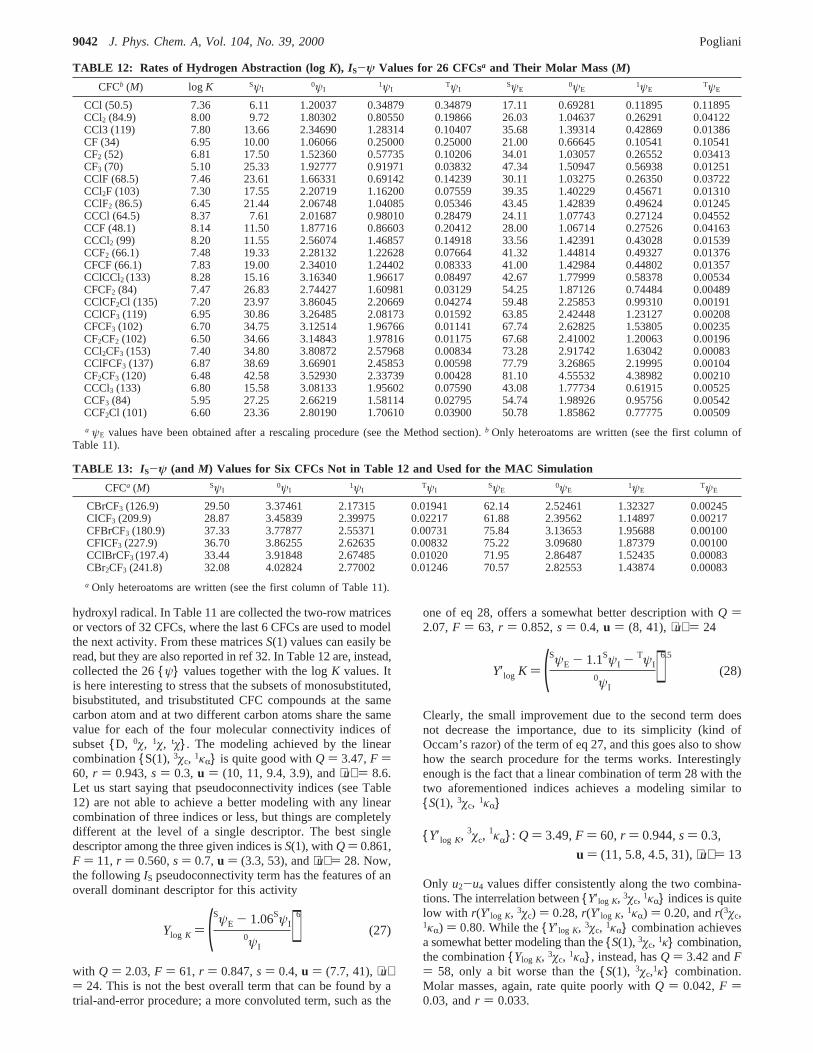
TABLE 12: Rates of Hydrogen Abstraction (log K), IS-ψ Values for 26 CFCsa and Their Molar Mass (M)
CFCb (M) log K SψI0ψI
1ψITψI
SψE0ψE
1ψETψE
CCl (50.5) 7.36 6.11 1.20037 0.34879 0.34879 17.11 0.69281 0.11895 0.11895CCl2 (84.9) 8.00 9.72 1.80302 0.80550 0.19866 26.03 1.04637 0.26291 0.04122CCl3 (119) 7.80 13.66 2.34690 1.28314 0.10407 35.68 1.39314 0.42869 0.01386CF (34) 6.95 10.00 1.06066 0.25000 0.25000 21.00 0.66645 0.10541 0.10541CF2 (52) 6.81 17.50 1.52360 0.57735 0.10206 34.01 1.03057 0.26552 0.03413CF3 (70) 5.10 25.33 1.92777 0.91971 0.03832 47.34 1.50947 0.56938 0.01251CClF (68.5) 7.46 23.61 1.66331 0.69142 0.14239 30.11 1.03275 0.26350 0.03722CCl2F (103) 7.30 17.55 2.20719 1.16200 0.07559 39.35 1.40229 0.45671 0.01310CClF2 (86.5) 6.45 21.44 2.06748 1.04085 0.05346 43.45 1.42839 0.49624 0.01245CCCl (64.5) 8.37 7.61 2.01687 0.98010 0.28479 24.11 1.07743 0.27124 0.04552CCF (48.1) 8.14 11.50 1.87716 0.86603 0.20412 28.00 1.06714 0.27526 0.04163CCCl2 (99) 8.20 11.55 2.56074 1.46857 0.14918 33.56 1.42391 0.43028 0.01539CCF2 (66.1) 7.48 19.33 2.28132 1.22628 0.07664 41.32 1.44814 0.49327 0.01376CFCF (66.1) 7.83 19.00 2.34010 1.24402 0.08333 41.00 1.42984 0.44802 0.01357CClCCl2 (133) 8.28 15.16 3.16340 1.96617 0.08497 42.67 1.77999 0.58378 0.00534CFCF2 (84) 7.47 26.83 2.74427 1.60981 0.03129 54.25 1.87126 0.74484 0.00489CClCF2Cl (135) 7.20 23.97 3.86045 2.20669 0.04274 59.48 2.25853 0.99310 0.00191CClCF3 (119) 6.95 30.86 3.26485 2.08173 0.01592 63.85 2.42448 1.23127 0.00208CFCF3 (102) 6.70 34.75 3.12514 1.96766 0.01141 67.74 2.62825 1.53805 0.00235CF2CF2 (102) 6.50 34.66 3.14843 1.97816 0.01175 67.68 2.41002 1.20063 0.00196CCl2CF3 (153) 7.40 34.80 3.80872 2.57968 0.00834 73.28 2.91742 1.63042 0.00083CClFCF3 (137) 6.87 38.69 3.66901 2.45853 0.00598 77.79 3.26865 2.19995 0.00104CF2CF3 (120) 6.48 42.58 3.52930 2.33739 0.00428 81.10 4.55532 4.38982 0.00210CCCl3 (133) 6.80 15.58 3.08133 1.95602 0.07590 43.08 1.77734 0.61915 0.00525CCF3 (84) 5.95 27.25 2.66219 1.58114 0.02795 54.74 1.98926 0.95756 0.00542CCF2Cl (101) 6.60 23.36 2.80190 1.70610 0.03900 50.78 1.85862 0.77775 0.00509
a ψE values have been obtained after a rescaling procedure (see the Method section).b Only heteroatoms are written (see the first column ofTable 11).
TABLE 13: IS-ψ (and M) Values for Six CFCs Not in Table 12 and Used for the MAC Simulation
CFCa (M) SψI0ψI
1ψITψI
SψE0ψE
1ψETψE
CBrCF3 (126.9) 29.50 3.37461 2.17315 0.01941 62.14 2.52461 1.32327 0.00245CICF3 (209.9) 28.87 3.45839 2.39975 0.02217 61.88 2.39562 1.14897 0.00217CFBrCF3 (180.9) 37.33 3.77877 2.55371 0.00731 75.84 3.13653 1.95688 0.00100CFICF3 (227.9) 36.70 3.86255 2.62635 0.00832 75.22 3.09680 1.87379 0.00100CClBrCF3 (197.4) 33.44 3.91848 2.67485 0.01020 71.95 2.86487 1.52435 0.00083CBr2CF3 (241.8) 32.08 4.02824 2.77002 0.01246 70.57 2.82553 1.43874 0.00083
a Only heteroatoms are written (see the first column of Table 11).
Ylog K ) (SψE - 1.06SψI
0ψI)6
(27)
Y′log K ) (SψE - 1.1SψI - TψI
0ψI)6.5
(28)
{Y′log K, 3øc,1κR}: Q ) 3.49,F ) 60, r ) 0.944,s ) 0.3,
u ) (11, 5.8, 4.5, 31),⟨u⟩ ) 13
9042 J. Phys. Chem. A, Vol. 104, No. 39, 2000 Pogliani

Minimum Anesthetic Concentrations. Even if it has not beensimulated, it has nevertheless been suggested that the minimumanesthetic concentration (MAC), in log units, of 11 trifluoro-methylethanes could optimally be modeled with theS(F) valuesof the three fluoro atoms bonded to the same carbon atom.34
TheES andI S matrices of these 11 compounds are collected inTable 11, and from them it is possible to read theS(F) values.In Table 13 are collected the pseudoconnectivity values of thesix remaining CFCs included in the log MAC modeling butnot taking part in the logK modeling. Finally, in Table 14 arecollected the log MAC experimental values of the 11 com-pounds. Unexpectedly, the molar mass is a discrete descriptorfor this property withQ ) 2.24,F ) 23, andr ) 0.847, butthe S(F) index achieves a very good improvement withQ )4.05,F ) 74, r ) 0.944,s ) 0.2,u ) (8.6, 8.8), and⟨u⟩ ) 8.7.While no single IS molecular pseudoconnectivity index cancompete withS(F) as a single descriptor, the following linearcombination of two indices, instead, seems to be the optimalsolution:
The very good values ofQ, F, andu seem to leave no doubtabout the quality of this combination, whose two parametersare not so strongly correlated withr(0ψI, SψE) ) 0.73. Noticethat the best single pseudoindex,{0ψI}, rates onlyQ ) 1.23and F ) 6.9. But, to model 11 points with 2 parameters is arather uneasy choice. A trial-and-error procedure discovers thefollowing excellentIS-ψ term, withQ ) 15.3,F ) 1065,r )0.996,s ) 0.06,u ) (33, 35), and⟨u⟩ ) 34:
The correlation vector of the vector termY ) (Ylog MAC, U0),which allows thePcalc values given in Table 14 to be derivedwith the equation log MAC) C‚Y (without bars, as two valuesare negative), isC ) (-206.258, 7.66399). TheQ-leave-one-out method and the jackknifing method both reveal the greatstability of the modeling, as (i)Pjk values (see Table 14, lastcolumn) are nearly identical to the original calculatedPcalc
values, (ii) theC vector is highly constant with an error of(2%for each parameter, and (iii)Q values are also highly constant,with the only exception for compound CFICF3, which, when itis left out, gives rise toQ ) 22, F ) 2155, andr ) 0.998. Itis to be noticed that the term of eq 29 has been chosen following“Occam’s razor” considerations. A more convoluted term, where
0ψI + 0.4SψE replacesSψE in the denominator and where thewhole expression is elevated to the 0.8 power, shows asomewhat improved statistical value, withQ ) 16.1,F ) 1171,r ) 0.996,s ) 0.06, andu ) (34, 36).
Antagonism of Adrenalin by 2-Bromo-2-Phenethylamines(BrPhAm). The hydrogen-suppressed formula of BrPhAmderivatives is NCCBrPhYpZm, where Yp and Zm are substituentsin para (p) and meta (m) positions of the phenyl Ph ring.35 TheirI S andES matrices and correspondingψ value are collected inTables 15 and 16, respectively, while their molar mass,M,
TABLE 14: Logarithm of the Minimum AnestheticConcentration (MAC) of 11 Trifluoromethyl Ethanes(tFMeE), Calculated log MAC, Pcalc, and Calculated logMAC, Pjk , with the Leave-One-Out or Jackknifing Methoda
tFMeE log MAC Pcalc Pjk
CH3CF3 1.60 1.60 1.60CH2ClCF3 0.90 0.89 0.89CH2BrCF3 0.45 0.39 0.39CH2ICF3 0.10 0.12 0.13CHF2CF3 1.70 1.71 1.71CHFClCF3 1.18 1.13 1.12CHFBrCF3 0.70 0.70 0.70CHFICF3 0.30 0.44 0.45CHCl2CF3 0.43 0.38 0.37CHClBRCF3 -0.10 -0.03 -0.02CHBr2CF3 -0.40 -0.47 -0.51
a Compounds are taken from Table 13 and some from Table 12.
{0ψI,SψE}: Q ) 13.6,F ) 419,r ) 0.995,s ) 0.1,
u ) (29, 22, 15),⟨u⟩ ) 22
Ylog MAC )1ψI + TψI
SψE
(29)
TABLE 15: Intrinsic State Value Matrices, I S, and theElectrotopological ES Matrices of n ) 222-Bromo-2-Phenethylamines (NCCBrPhYpZm)a
a IS andES values of Br, Yp, and Zm are in the second row.
Modeling with Pseudoconnectivity Descriptors J. Phys. Chem. A, Vol. 104, No. 39, 20009043
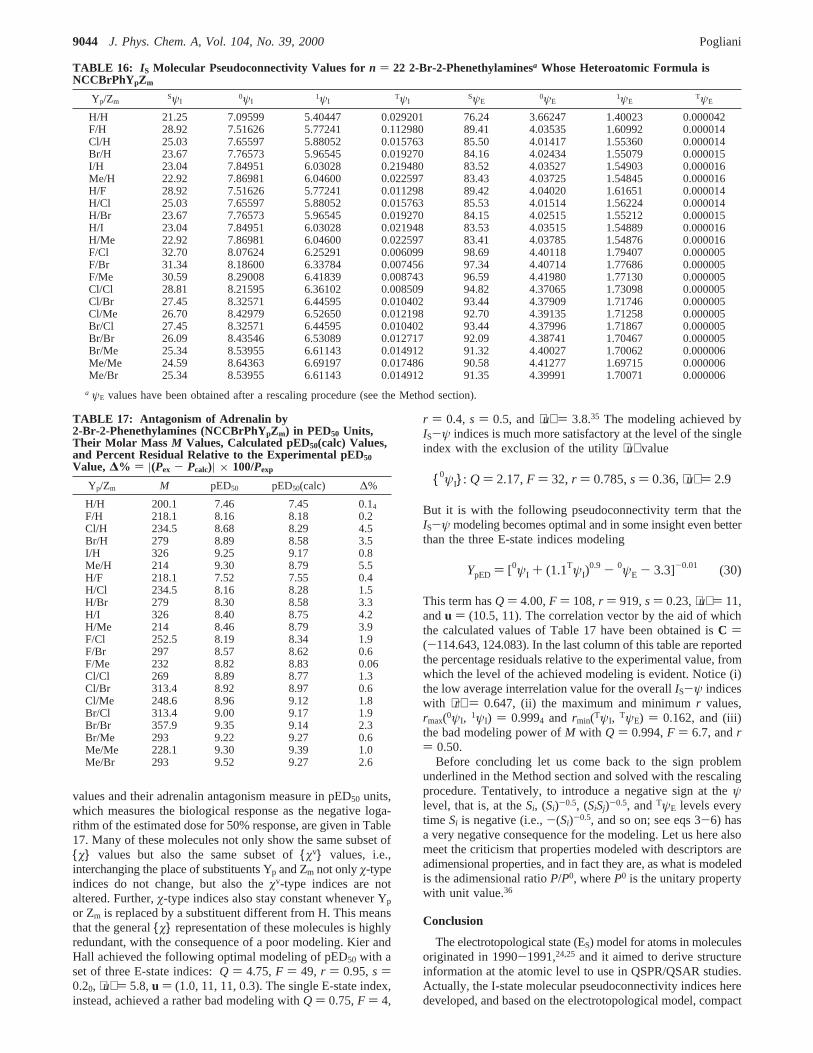
values and their adrenalin antagonism measure in pED50 units,which measures the biological response as the negative loga-rithm of the estimated dose for 50% response, are given in Table17. Many of these molecules not only show the same subset of{ø} values but also the same subset of{øv} values, i.e.,interchanging the place of substituents Yp and Zm not onlyø-typeindices do not change, but also theøv-type indices are notaltered. Further,ø-type indices also stay constant whenever Yp
or Zm is replaced by a substituent different from H. This meansthat the general{ø} representation of these molecules is highlyredundant, with the consequence of a poor modeling. Kier andHall achieved the following optimal modeling of pED50 with aset of three E-state indices:Q ) 4.75,F ) 49, r ) 0.95,s )0.20, ⟨u⟩ ) 5.8,u ) (1.0, 11, 11, 0.3). The single E-state index,instead, achieved a rather bad modeling withQ ) 0.75,F ) 4,
r ) 0.4, s ) 0.5, and⟨u⟩ ) 3.8.35 The modeling achieved byIS-ψ indices is much more satisfactory at the level of the singleindex with the exclusion of the utility⟨u⟩ value
But it is with the following pseudoconnectivity term that theIS-ψ modeling becomes optimal and in some insight even betterthan the three E-state indices modeling
This term hasQ ) 4.00,F ) 108,r ) 919,s ) 0.23,⟨u⟩ ) 11,andu ) (10.5, 11). The correlation vector by the aid of whichthe calculated values of Table 17 have been obtained isC )(-114.643, 124.083). In the last column of this table are reportedthe percentage residuals relative to the experimental value, fromwhich the level of the achieved modeling is evident. Notice (i)the low average interrelation value for the overallIS-ψ indiceswith ⟨r⟩ ) 0.647, (ii) the maximum and minimumr values,rmax(0ψI, 1ψI) ) 0.9994 and rmin(TψI, TψE) ) 0.162, and (iii)the bad modeling power ofM with Q ) 0.994,F ) 6.7, andr) 0.50.
Before concluding let us come back to the sign problemunderlined in the Method section and solved with the rescalingprocedure. Tentatively, to introduce a negative sign at theψlevel, that is, at theSi, (Si)-0.5, (SiSj)-0.5, andTψE levels everytime Si is negative (i.e.,-(Si)-0.5, and so on; see eqs 3-6) hasa very negative consequence for the modeling. Let us here alsomeet the criticism that properties modeled with descriptors areadimensional properties, and in fact they are, as what is modeledis the adimensional ratioP/P0, whereP0 is the unitary propertywith unit value.36
Conclusion
The electrotopological state (ES) model for atoms in moleculesoriginated in 1990-1991,24,25 and it aimed to derive structureinformation at the atomic level to use in QSPR/QSAR studies.Actually, the I-state molecular pseudoconnectivity indices heredeveloped, and based on the electrotopological model, compact
TABLE 16: IS Molecular Pseudoconnectivity Values forn ) 22 2-Br-2-Phenethylaminesa Whose Heteroatomic Formula isNCCBrPhYpZm
Yp/ZmSψI
0ψI1ψI
TψISψE
0ψE1ψE
TψE
H/H 21.25 7.09599 5.40447 0.029201 76.24 3.66247 1.40023 0.000042F/H 28.92 7.51626 5.77241 0.112980 89.41 4.03535 1.60992 0.000014Cl/H 25.03 7.65597 5.88052 0.015763 85.50 4.01417 1.55360 0.000014Br/H 23.67 7.76573 5.96545 0.019270 84.16 4.02434 1.55079 0.000015I/H 23.04 7.84951 6.03028 0.219480 83.52 4.03527 1.54903 0.000016Me/H 22.92 7.86981 6.04600 0.022597 83.43 4.03725 1.54845 0.000016H/F 28.92 7.51626 5.77241 0.011298 89.42 4.04020 1.61651 0.000014H/Cl 25.03 7.65597 5.88052 0.015763 85.53 4.01514 1.56224 0.000014H/Br 23.67 7.76573 5.96545 0.019270 84.15 4.02515 1.55212 0.000015H/I 23.04 7.84951 6.03028 0.021948 83.53 4.03515 1.54889 0.000016H/Me 22.92 7.86981 6.04600 0.022597 83.41 4.03785 1.54876 0.000016F/Cl 32.70 8.07624 6.25291 0.006099 98.69 4.40118 1.79407 0.000005F/Br 31.34 8.18600 6.33784 0.007456 97.34 4.40714 1.77686 0.000005F/Me 30.59 8.29008 6.41839 0.008743 96.59 4.41980 1.77130 0.000005Cl/Cl 28.81 8.21595 6.36102 0.008509 94.82 4.37065 1.73098 0.000005Cl/Br 27.45 8.32571 6.44595 0.010402 93.44 4.37909 1.71746 0.000005Cl/Me 26.70 8.42979 6.52650 0.012198 92.70 4.39135 1.71258 0.000005Br/Cl 27.45 8.32571 6.44595 0.010402 93.44 4.37996 1.71867 0.000005Br/Br 26.09 8.43546 6.53089 0.012717 92.09 4.38741 1.70467 0.000005Br/Me 25.34 8.53955 6.61143 0.014912 91.32 4.40027 1.70062 0.000006Me/Me 24.59 8.64363 6.69197 0.017486 90.58 4.41277 1.69715 0.000006Me/Br 25.34 8.53955 6.61143 0.014912 91.35 4.39991 1.70071 0.000006
a ψE values have been obtained after a rescaling procedure (see the Method section).
TABLE 17: Antagonism of Adrenalin by2-Br-2-Phenethylamines (NCCBrPhYpZm) in PED50 Units,Their Molar Mass M Values, Calculated pED50(calc) Values,and Percent Residual Relative to the Experimental pED50Value, ∆% ) |(Pex - Pcalc)| × 100/Pexp
Yp/Zm M pED50 pED50(calc) ∆%
H/H 200.1 7.46 7.45 0.14F/H 218.1 8.16 8.18 0.2Cl/H 234.5 8.68 8.29 4.5Br/H 279 8.89 8.58 3.5I/H 326 9.25 9.17 0.8Me/H 214 9.30 8.79 5.5H/F 218.1 7.52 7.55 0.4H/Cl 234.5 8.16 8.28 1.5H/Br 279 8.30 8.58 3.3H/I 326 8.40 8.75 4.2H/Me 214 8.46 8.79 3.9F/Cl 252.5 8.19 8.34 1.9F/Br 297 8.57 8.62 0.6F/Me 232 8.82 8.83 0.06Cl/Cl 269 8.89 8.77 1.3Cl/Br 313.4 8.92 8.97 0.6Cl/Me 248.6 8.96 9.12 1.8Br/Cl 313.4 9.00 9.17 1.9Br/Br 357.9 9.35 9.14 2.3Br/Me 293 9.22 9.27 0.6Me/Me 228.1 9.30 9.39 1.0Me/Br 293 9.52 9.27 2.6
{0ψI}: Q ) 2.17,F ) 32, r ) 0.785,s ) 0.36,⟨u⟩ ) 2.9
YpED ) [0ψI + (1.1TψI)0.9 - 0ψE - 3.3]-0.01 (30)
9044 J. Phys. Chem. A, Vol. 104, No. 39, 2000 Pogliani
again the information at the molecular level and try to use thisinformation for QSAR/QSPR studies. Through the ES modelthe pseudodescriptors are not only indirectly related to graphand pseudograph properties, but also enclose electronic informa-tion, a fact that could render them interesting rivals of othergraph theoretical descriptors.
It has been said that “anything can be defined provided it isconsistent: usefulness is the key”;37 well, IS pseudoconnectivitydescriptors are both consistent and useful. In fact, the molecularpseudoconnectivity descriptors defined and used in this workpossess quite interesting modeling aptitudes. They are discretebut poorer descriptors thanø indices of amino acid properties,even if the melting point and crystal density of amino acids arebetter but not optimally described by molecular pseudoconnec-tivity terms. It is with the motor octane number and meltingpoints of alkanes and the lattice enthalpy of inorganic salts thatmolecular pseudoconnectivity terms achieve an optimal descrip-tion, nearly doubling the descriptive power of the correspondingmolecular connectivity terms, a fact which is probably due totheir capacity to model electronic characteristics at a finer levelthan normally done by graph and/or pseudograph invariants.This last characteristic can, surely, explain the enhancedmodeling of the singlet energies of DNA/RNA bases achievedby a singleIS pseudoconnectivity term. Good mixed{ø, ψ}descriptions have been detected with the solubility of aminoacids, with the specific rotations, and especially with the crystaldensity of amino acids, which overrates any other description.A mixed description for the melting points of alkanes can alsobe mentioned, even if it rates poorer than a corresponding two-øindex LCCI. The fact that mixed{ø, ψ} descriptions arepractically never much better than the homogeneous descriptionsseems to overrule the use of such mixed sets for future modeling.The interesting modeling power of pseudoconnectivity descrip-tors is underlined by three QSAR studies: the rate of extractionand the minimum anesthetic concentration of CFCs, and theantagonism of adrenalin by 2-Br-2-phenethylamines. HereIS
pseudoconnectivity descriptors offer an interesting alternativeto the solution of the modeling problem. Further, pseudocon-nectivity indices seem to be optimal descriptors of the molarmasses of amino acids (0ψE), and, by far, of the molar mass ofalkanes (1ψE).
The trend already detected with molecular connectivityindices, that is, the much better quality of higher-level trial-and-error descriptors or terms, is here thoroughly confirmed forpseudoconnectivity terms also. The construction of this termallows an enormous freedom to be achieved with a small set ofindices, with the consequence that single molecular pseudo-connectivity terms rate normally better than any linear combina-tions of molecular pseudoconnectivity indices (LCpCI).
What remains to be seen is the modeling power ofIS
molecular pseudoconnectivity descriptors relative to a set ofcompounds which strongly differ from each other by van derWaals interactions and/or hydrogen bonds. Would semiempiricalmolecular pseudoconnectivity terms fill the gap as theircounterparts the semiempirical molecular connectivity terms,already did?6
Facing the global modeling capability of (δ, δv)-relateddescriptors, a sentiment of amazement cannot be hidden; it issurely something more than a strange coincidence, as, forexample, it is held by astronomers the strange Bode law38 whichexplains all the distances of the planets and planetoids fromthe sun with the exclusion of Neptune and Pluto.
Acknowledgment. I thank Professors L. B. Kier of theVirginia Commonwealth University, Richmond, VA, and L. H.
Hall of the Eastern Nazarene College, Quincy, MA, for theirconstant support and help.
References and Notes(1) Pogliani, L.J. Chem. Inf. Comput. Sci. 1996, 36, 1082.(2) Pogliani, L.J. Phys. Chem. 1996, 100, 18065.(3) Pogliani, L.Med. Chem. Res. 1997, 7, 380.(4) Pogliani, L.J. Chem. Inf. Comput. Sci. 1999, 39, 104.(5) Pogliani, L.J. Mol. Struct.: THEOCHEM1999, 466, 1.(6) Pogliani, L.J. Phys. Chem. 1999, 103, 1598.(7) Balaban, A. T., Ed.Chemical applications of Graph theory;
Academic Press: London, 1986.(8) Trinajstic, N. Chemical graph theory, 2nd ed., CRC Press: Boca
Raton, FL, 1992.(9) Reinhard, M.; Drefahl, A.Handbook for Estimating Physicochem-
ical Properties of Organic Compounds; Wiley: New York, 1999.(10) Basak, S. C.; Magnuson, V. R.; Niemi, G. J.; Regal, R. R.Discr.
Appl. Math. 1988, 19, 17.(11) Basak, S. C.; Niemi, G. J.; Veith, G. D. J. Math. Chem. 1991, 7,
243.(12) Katrizky, A. R.; Mu, L.J. Chem. Inf. Comput. Sci. 1998, 38, 28,
293 and 300.(13) Randicˇ, M.; Basak, S. Variable Molecular Descriptors. InSome
Aspects of Mathematical Chemistry; Sinha, D. K., Basak, S. C., Mohanty,R. K., Basumallik, I. N., Eds. In press.
(14) Gutman, I.; Popovic, Lj; Estrada, E.; Bertz, S. H.ACH-ModelsChem. 1998, 38, 819.
(15) Amic, D.; Beslo, D.; Lucicˇ, B.; Nikolic, S.; Trinajstic, N.J. Chem.Inf. Comput. Sci. 1998, 38, 819.
(16) Todeschini, R.; Consonni, V.Handbook of Molecular Descriptors,Wiley: New York, in press.
(17) Basak, S.; Balaban, T.; Grunwald, G. D.J. Chem. Inf. Comput.Sci. To be published.
(18) Basak, S.; Nikolicˇ, S.; Trinajstic, N.; Amic, D.; Beslo, D.J. Chem.Inf. Comput. Sci. To be published.
(19) Rosen, K. H.Discrete mathematics and its applications; McGraw-Hill: New York, 1995.
(20) Kier, L. B.; Hall L. H.Molecular connectiVity in structure-actiVityanalysis; Wiley: New York, 1986.
(21) Randicˇ, M. J. Am. Chem. Soc. 1975, 97, 6609.(22) Pogliani, L.Croat. Chem. Acta1997, 70, 803.(23) “The significance of a law of nature ... is the finding of an invariant,
that is to say, a quantity which remains unchanged even when all the otherdetermining elements vary within the possible limit imposed by the law.Thus, we perceive that the historical development of scientific concepts isever associated with the discovering and working out of such invariants.”Ostwald, W. InThe Question of the Atom: from the Karlsruhe Congress tothe First SolVay Conference, 1860-1911; Nye, M. J., Ed.; Tomash: LosAngeles, 1986.
(24) Kier, L. B.; Hall, L. H. Pharm. Res. 1990, 7, 801.(25) Hall, L. H.; Mohney, B.; Kier, L. B.J. Chem. Inf. Comput. Sci.
1991, 31, 76.(26) Kier, L. B.; Hall, L. H. Molecular Structure Description. The
Electrotopological State; Academic Press: New York, 1999 (see alsoreferences therein).
(27) Kier, L. B.; Hall, L. H. Molecular Structure Description. TheElectrotopological State; Academic Press: New York, 1999; pp 65-67and 230.
(28) Estrada, E.J. Chem. Inf. Comput. Sci. 1990, 35, 31.(29) Nikolic, S.; Trinajstic, N.; Ivanis, S.Croat. Chim. Acta1999, 72,
875.(30) Randic, M.Int. J. Quantum Chem.: Quantum Biol. Symp. 1994,
21, 215.(31) Pogliani, L.J. Phys. Chem. 1993, 97, 6731.(32) Gil, V. M. S.; Geraldes, C. F. G. C.Ressonaˆncia Magnetica
Nuclear; Fundac¸ ao Calouste Gunbelkian: Lisboa, 1987.(33) Kier, L. B.; Hall, L. H. Molecular Structure Description. The
Electrotopological State; Academic Press: New York, 1999; pp 170-172.(34) Kier, L. B.; Hall, L. H. Molecular Structure Description. The
Electrotopological State; Academic Press: New York, 1999; pp 163-164.(35) Kier, L. B.; Hall, L. H. Molecular Structure Description. The
Electrotopological State; Academic Press: New York, 1999; pp 90-93.(36) Berberan-Santos, M. N.; Pogliani, L.J. Math. Chem. 1999, 26, 255(37) Garrett, A. J. M. InMaximum Entropy in Action, Buck, B.,
Macaulay, V. A., Eds. Clarendon Press: Oxford, 1992; p 142.(38) Bode’s law proposed by the 18th century astronomer Titus-Bode
held that the distances of all known planets from the sun (inclusiveplanetoids between Mars and Jupiter) in terms of Earth’s distance followedfrom a sequence of doubled numbers: 0, 3, 6, 12, 24, .... Adding 4 to eachnumber and dividing by 10 gives the desired distance. This law fails totallyfor Neptune and Pluto and shows some deviations for Saturn and Uranus.Many astronomers held Bode’s law for a strange coincidence. Gamow, G.One, Two, Three.....Infinite; Dover: New York, 1988; pp 307-308.
Modeling with Pseudoconnectivity Descriptors J. Phys. Chem. A, Vol. 104, No. 39, 20009045