MODELING VEHICLE OCCUPANT HEAD AND HEAD RESTRAINT POSITIONS
70
MODELING VEHICLE OCCUPANT HEAD AND HEAD RESTRAINT POSITIONS Matthew P. Reed Carol A. C. Flannagan Miriam A. Manary Lawrence W. Schneider University of Michigan Transportation Research Institute Biosciences Division +\'r 0, April 2001 * qrt + $@,$ UMTRl The University of Michigan % , ,,,, Transportation Research Institute
Transcript of MODELING VEHICLE OCCUPANT HEAD AND HEAD RESTRAINT POSITIONS

MODELING VEHICLE OCCUPANT HEAD AND HEAD RESTRAINT POSITIONS
Matthew P. Reed Carol A. C. Flannagan
Miriam A. Manary Lawrence W. Schneider
University of Michigan Transportation Research Institute
Biosciences Division
+\'r 0,
April 2001 * qrt + $@,$
UMTRl The University of Michigan %, ,,,, Transportation Research Institute


MODELING VEHICLE OCCUPANT HEAD AND HEAD RESTRAINT POSITION
Final Report
Matthew P. Reed Carol A. C. Flannagan
Miriam A. Manary Lawrence W. Schneider
Biosciences Division University of Michigan Transportation Research Institute
Prepared for:
Alliance of Automobile Manufacturers
April 200 1


Technical Report Documentation Page
Modeling Vehicle Occupant Head and Head Restraint Positions
UMTRI-200 1-8
7. Author(s) / 8. Performing Organization Report No.
3. Recipient's Catalog No. 1. Report No.
4. Title and Subtitle
2. Government Accession No.
5. Report Date
The University of Michigan Transportation Research Institute 2901 Baxter Road
Reed, M.P., Flannagan, C.A.C., Manary, M.A., Schneider, L.W. 9. Performing Organization Name and Address
11. Contract or Grant No.
UMTRI-2001-8 10. Work Unit no. (TRAIS)
Alliance of Automobile Manufacturers
Ann Arbor, Michigan 48109-2150 U.S.A. 12. Sponsoring Agency Name and Address
14. Sponsoring Agency Code
13. Type of Report and Period Covered
I
15. Supplementary Notes
16. Abstract
In January 2001, NHTSA issued a Notice of Proposed Rulemaking (NPRM) concerning the regulation of automobile head restraints in Federal Motor Vehicle Safety Standard (FMVSS) 202. This report presents analyses of occupant posture and position data that were conducted in preparation for comments from UMTRI on the NPRM. The focus of this report is on the potential impact of head restraint geometry requirements on t.he accommodation of vehicle occupant head positions in normal driving and riding postures. This report makes specific recommendations for head restraint geometry and measurement procedures. The analysis in th,is report indicates that head restraints on seats with adjustable seatback angles should extend at least 730 mm above the H- point (vertically, not along the manikin torso line as specified in the NPRM). The head restraint profile below this height should lie entirely forward of a line 315 rnrn rearward of the H-point. An analysis of driver postures indicates that it is not possible for a head restraint that rotates with the seatback to produce a mean driver backset of less than about 70 mm, because to do so would disaccommodate a substantial number of drivers' preferred head positions. Further reductions in driver backset will require new solutions to head restraint positioning.
Automobile Safety, Seats, Head Restraints / Unlimited 19. Security Classification (of this report) ( 20. Security Classification (of this page) 1 21. No. of Pages ( 22. Price
17. Key Words
None 1 None
18. Distribution Statement


CONTENTS
SUMMARY 1
1.0 INTRODUCTION 3
2.0 TERMINOLOGY AND DEFINITIONS
H-Point Seatback Angle (SBA) Head Restraint Measurement Device (HRMD) Backset Head Restraint Height Eyelllipse Standard Head Model Occupant Population
3.0 HEAD AND HEAD RESTRAINT POSITIONS IN PASSENGER SEATS WITH FIXED SEATBACK ANGLES 11
4.0 HEAD AND HEAD RESTRAINT POSITIONS IN SEATS WITH ADJUSTABLE SEATBACK ANGLES
4.1 Experimental Data 17 4.2 Modeling Driver Backset 22 4.3 Head Restraint Height in Seats with Adjustable Seatback Angles 29
5.0 REPLACEMENT OF THE SAE J826 H-POINT MANIKIN 3 1
6.0 RECOMMENDED HEAD RESTRAINT GEOMETRY TO ACCOMMODPLTE PREFERRED OCCUPANT HEAD POSITIONS 3 3
6.1 Head Restraint Height 6.2 Fore-Aft Head Restraint Position
7.0 PROCEDURES FOR MEASURING HEAD RESTRAINT GEOMETRY 3 5
8.0 DISCUSSION 37
8.1 Accommodation 8.2 Limitations 8.3 Measurement Procedures
9.0 CONCLUSIONS 4 1
10.0 REFERENCES 43

APPENDIX A: COVARIANCE OF HEAD SIZE AND POSITION 45
APPENDIX B: FIXED-SEAT EYELLIPSE MODEL 47
APPENDIX C: CALCULATING AN APPROXIMATING NORMAL DISTRIBUTION FOR A MIXTURE OF TWO NORMALS 5 3


ACKNOWLEDGEMENTS
The analyses in this report are based on data collected in several research studies. Sponsors of those studies include the Motor Vehicle Manufacturers Association, the American Automobile Manufacturers Association, the Alliance of Automobile Manufacturers, and industry partners of the Automobile Seat and Package Evaluation and Comparison Tools (ASPECT) program. ASPECT partners include BMW, DaimlerChrysler, Ford, General Motors, Johnson Controls, Lear, Magna, Mazda, PSA-Peugeot-Citroen, Toyota, Volkswagen of America, and Volvo.


LIST OF FIGURES
Figure
1. Definitions of H-point and seatback angle.
2. Head restraint measurement device.
3. HRMD backset probe profile.
4. Alternative definitions of head restraint height.
5 . Illustrations of eyellipse concepts.
6. Side-view geometry of the standard head model.
7. Eyellipse and back-of-head ellipse for a seat with a fixed seatback angle.
8. Geometry used for comparing head restraint heights.
9. Driver eye locations with respect to H-point.
10. Driver vertical eye locations with respect to H-point as a function of stature.
1 1. Driver eyellipse and head ellipse with respect to H-point.
12. Seatback angle as a function of stature.
13. Geometry used to calculate the distributions of driver head-to-head restraint clearance variables.
14. Cumulative driver backset distributions for the geometry in Figure 13.
15. Cumulative driver backset distributions for three mean driver-selected seatback angles.
16. Head restraint positions relative to mean head location.
17. Distribution of mean driver-selected seatback angle across vehicles.
18. ASPECT manikin prototype.
19. Proposed procedure for measuring head restraint height and fore-aft position.
Page
6
6
3
8
9
10
12
14
17
18
19
20


LIST OF TABLES
Table
1. Summary Statistics for Seatback Angle in Vehicles
2. Driver-Selected Seatback Angle Statistics for Ten Vehicle Seats
3. Options for Specifying Head Restraint Height and Fore-aft Position
Page
2 1
22
3 9


SUMMARY
In January 2001, NHTSA issued a Notice of Proposed Rulemaking (NPRM) concerning the regulation of automobile head restraints in Federal Motor Vehicle Safety Standard (FlMVSS) 202. This report presents analyses of occupant posture and position data that were conducted in preparation for comments from UMTRI on the NPRM. The focus of this report is on the potential impact of head restraint geometry requirements on the accommodation of vehicle occupant head positions in normal driving and riding postures. This report makes specific recommendations for head restraint geometry and measurement procedures.
The NPRM lays out requirements for head restraint height and fore-aft position. Under the proposed regulation, fore-aft position (backset) would be measured with the head restraint measurement device (HRDM), a metal headform that attaches to the SAE J826 H-point manikin. Based on the analyses in this report, head restraints meeting the proposed requirements would, if mounted on current vehicle seats, interfere with the head positions of about 13 percent of drivers in normal driving and would contact the hair of about 33 percent of drivers. Interference with preferred head positions produces discomfort, restricts head mobility, and may adversely affect a driver's field of view.
The NPRM proposes to measure head restraint height along the H-point manikin torso line in a manner consistent with the current FMVSS 202. This method couples head restraint height and backset requirements, making it difficult to work with the two variables separately. A new method of specifying and measuring both head restraint height and fore-aft position is proposed that does not require the use of the HRMD.
Under the proposal in this report, head restraints in seats with adjustable seatback angles are measured with the seatback set to 22 degrees, the mean driver-selected seatback ang'le across vehicles. The head restraint profile along the occupant centerline is determined by translating a 165-mm-diameter sphere in contact with the head restraint. The height of the head restraint is the height of the highest point on the head restraint profile that lies forward of the required fore-aft position with respect to H-point and below which all points on the profile lie forward of the fore-aft criterion.
The analysis in this report indicates that head restraints on seats with adjustable seatback angles should extend at least 730 mm above the H-point (vertically, not along the manikin torso line as specified in the NPlIM). The head restraint profile below this height should lie entirely forward of a line 315 mm rearward of the H-point. In seats with fixed seatback angles, the height and fore-aft requirements are a function of the manikin-measured seatback angle. Head restraints meeting these criteria would span the vertical head center of mass locations of about 99 percent of occupants, and would allow about 99 percent of occupants to sit without interference between their heads and the head restraint. Approximately 95 percent of occupants would be able to sit without hair contact with the head restraint.

An analysis of driver postures indicates that it is not possible for a head restraint that rotates with the seatback to produce a mean driver backset of less than about 70 mrn, because to do so would disaccommodate a substantial number of drivers' preferred head positions. Further reductions in driver backset will require new solutions to head restraint positioning.
1.0 INTRODUCTION
The National Highway Traffic Safety Administration (NHTSA) has recently issued a Notice of Proposed Rulemaking (NPRM) concerning Federal Motor Vehicle Safety Standard (FMVSS) 202, which specifies design and performance requirements for automobile 'head restraints. The NPRM lays out new dimensional requirements for both front and rear seat head restraints, including height and backset specifications (backset refers to the hori;contal distance between the back of the occupant's head and the front surface of the head restraint).
The proposed revisions to FMVSS 202 would require head restraints in the front seats to attain a height of at least 800 mm, measured along the H-point manikin torso line, and preclude their downward adjustment below 750 rnm. Head restraints in rear seats wo~uld be required to be at least 750 mm above H-point along the manikin torso line. The head restraint measurement device (HRMD), developed by the Insurance Corporation of Blritish Columbia (ICBC), would be used to measure the fore-aft position of head restraints. The HRMD is a metal headform that attaches to the SAE J826 H-point machine. In front seats, the fore-aft offset (backset) between the head form of the HRMD could not exceed 510 mrn when the seatback is reclined 25 degrees with respect to vertical. In rear seat, the same backset requirement would have to be met at the fixed angle provided by the seat.
UMTRI has gathered extensive data on vehicle occupant posture and position over more than two decades. The studies have included measurements of the seat positions and eye locations of hundreds of drivers in dozens of vehicles driven on-road, as well as detailed investigations in reconfigurable vehicle mock~ps~. The data have been used to develop new vehicle: interior design models (Flannagan et al. 1996, Flannagan et al. 1998, Manary et al. 1998a), s.tatistica1 models describing the effects of vehicle design variables on chest-to-steering-wheel clearance (Manary et al. 1998b), and more representative crash dummy positioning procedures (Manary et al. 1998~).
In a related effort, UMTRI led the development of a new seat measurement (H-point.) manikin as part of the Automotive Seat and Package Evaluation and Comparison Tools (ASPECT) program. The ASPECT manikin is currently being considered by the SAE Design Devices committee as a replacement for the current SAE J826 H-point machine.
The data from these studies provide the opportunity to assess the proposed head restraint requirements with respect to actual vehicle occupant posture and position. An analysis using the UMTRI data and models was conducted to address the following questions:
What is the distribution of driver and passenger head locations with respect to population anthropometry, seat reference points, and dimensions?
How would the distribution of head-restraint-to-head dimensions be affected by the proposed regulations?
What is the tradeoff between head restraint position and occupant accommodation?
How can head restraint dimensions be measured to relate the dimensions most accurately to occupant head locations?
The body of the report presents results from analyses of data and applications of models previously created at UMTRI. Details of the calculation methods are presented in appendices. Separate analyses are conducted for seats with fixed (non-adjustable) seatback angles, typical of rear seats, and for seats with adjustable seatback angles.

2.0 TERMINOLOGY AND DEFINITIONS
To reduce confusion in interpretation, several of the key terms used in this report are defined. The definitions are based largely on SAE Recommended Practices (SAE 2000). Differences between definitions used in this report and those used in the NPRM are highlighted.
The H-point is a reference point with respect to a seat that is defined and measured with the SAE J826 H-point manikin. The Seating Reference Point (SgRP) is a particular H-point location within the range of seat travel that is used for a variety of design purposes. TJnlike the SgRP, which is stationary with respect to the vehicle, the H-point moves with the seat. The H-point is defined and measured only at one manufacturer-specified seat configu~ration, including the angles and settings for all adjustable components. Changes in component adjustments (for example, seatback angle) can affect the H-point location with respect to the seat. H-point is closely related to human hip joint location in the seat, but human hip locations are necessarily variable due to anthropometric and seat design factors.
2.2 Seatback Angle (SBA)
Seatback angle is the angle of the seat backrest in side view with respect to vertical as measured by the SAE 5826 manikin. This dimension is called back angle in SAE JlV00 and is denoted by the code L40. This angle is also referred to as torso angle, because the angle is measured from the torso segment of the H-point manikin. Contrary to the SAE definition, back angle (or seat back angle) is sometimes used to refer to the orientation of some part of the physical structure of the seatback. Of course, this definition does not have meaning across seats that differ in construction. The SAE code (L40) has the advantage of being unambiguous, but does not convey much meaning to those who are unfamiliar with it. Torso angle creates the impression that the angle is human referenced, whereas the angle measured by the H-point manikin does not have a direct anatomical referent. Similarly, back angle could be taken to refer to the seat, to the manikin, or to the occupant. In this report, seatback angle means SAE L40. The NPRM uses torso angle to refer to SAE LAO.

Figure 1. Definitions of H-point and seatback angle, shown using the SAE J826 2D template that represents the posterior profile of the H-point manikin.
2.3 Head Restraint Measurement Device (HRMD)
The HRMD was developed at the Insurance Institute of British Columbia (ICBC) for measuring the height and fore-aft position of head restraints (Pedder and Gane 1995). The HRMD, shown in Figure 2, has been used at the Insurance Institute for Highway Safety (IIHS) to measure head restraint geometry in current vehicles (IIHS 1997). NHTSA relied heavily on the IIHS measurement data in formulating the NPRM requirements, and has proposed that the HRMD be used to measure head restraint backset for compliance with FMVSS 202.
Figure 2. Head Restraint Measurement Device mounted on the SAE 5826 H-point machine.
6

2.4 Backset
Backset is the horizontal spacing between an occupant's head and the head restraint. In the NPRM, backset is defined and measured with the HRMD by sliding a probe horizontally rearward from the HRMD headforrn until it contacts the head restraint. The distance the probe moves from its initial position flush with the back of the headform to the contact point defines HRMD-measured backset. In this report, backset is used more generally to refer to the horizontal distance between the rearward-most point on an occupant's head and the head restraint. The same definition is used in this report when conducting analyses with the HRMD. Depending on head restraint geometry, backset as defined in this report may differ from HRMD-measured backset, because the HRMD probe is profiled to match the back of the headform, as shown in Figure 3. To eliminate the effects of interaction between the probe and head restraint geometry, HRMD-referenced backsets in this report are measured horizontally from the back of the headfonn to the nearest point on the head restraint profile without using the profile of the built-in HRMD backset tool.
Figure 3. HRMD backset probe profile. The probe slides horizontally rearward from the headform to measure backset.
Because the HRMD has a simple linkage, the location of the back and top of the headform can be calculated as a function of seatback angle using simple equations. The vertical position of the top of head above H-point is given by
HRMDZ = 505.5 cos(SBAt3") t 292 [I]
where SBA is the manikin-measured seatback angle and HRMDZ is the height of the top of the headform in mm above H-point.
The back of the HRMD headform is 96 mm below the top of the head. The fore-aft position of the back of the headform with respect to H-point is given by
HRMDX = 505.5 sin(SBA + 3") + 73 [21
where HRMDX is the position of the back of the HRMD headforrn aft of H-point in mm. Neglecting the influence of the headform profile, an HRMD-measured backset can be referenced to H-point using equations 1 and 2.

2.5 Head Restraint Height
The current and proposed FMVSS 202 definition of head restraint height is measured along the SAE J826 manikin torso line, i.e., along a vector that forms an angle equal to L40 with vertical. Under the FMVSS 202 definition, the head restraint height is the distance from the H-point to the intersection of the manikin torso line with a tangent to the top of the centerline contour of the head restraint on the occupant centerline. Figure 4 shows this definition. In this report, head restraint height is the vertical distance from H-point to horizontal line passing through the uppermost point on the head restraint on the occupant centerline. (This definition is refined in Section 7.)
Figure 4. Alternative definitions of head restraint height. HF is the current and proposed FMVSS 202 height dimension. HHRMD is the height measured from the top of the ICBC HRDM used by IIHS. H is the height dimension used in this report.
2.6 Eyellipse
The analyses in this report are based primarily on UMTRI's work to develop new eyellipses for vehicle interior design. The eyellipse (the word is a contraction of eye and ellipse) is a statistical construct that is useful for representing the distribution of occupant's eye locations. Eyellipses are used extensively for vision analyses (instrument panels, mirrors, pillar obscuration) and are also the basis for head-location contours used to assess head clearance.
The original automobile eyellipses were developed in the early 1960s using driver eye locations measured photographically in convertibles (Meldrum 1965). Various adjustments to the original models have been made over the years (e.g., Devlin and Roe 1968; Hammond and Roe 1972), but the current SAE J941 (Driver Eye Range) is based on the same dataset as the original. Over the past decade, UMTRI has gathered data on eye locations from hundreds of drivers in dozens of vehicles (Manary et al. 1998a). A model resulting from these studies is now the basis for completely new 5941 proposal that will be balloted by the SAE Driver Vision Standards Committee this year.

An eyellipse (or eyellipsoid in three dimensions) is a graphical device used to represent the approximation of the occupant eye location distribution as a multidimensional normal density distribution. Analyzing the driver eye location data from the study in the early 1960s, Meldrum observed that the side-view and plan-view distributions of eye locations from a mixed-gender population were approximately normal. Multivariate normal density distributions are commonly represented in two dimensions by ellipses centered on the mean that enclose a specified percentage of the distribution. Because the marginal distribut.ions of a multinorrnal distribution are normal, tangents to a particular density ellipse have the property of dividing the distribution into uniform fractions. For example, all tangents to a two-dimensional 74% inclusion ellipse divide the distribution in to 95%/5% fractions. Figure 5 illustrates this property of centered multinormal inclusion ellipses. Thus, each ellipse enclosing a particular percentage is also a cutoff ellipse characterized by another, larger percentage.
This characteristic of cutoff ellipses is particularly useful for representing eye locations, because vision analyses are frequently conducted using rays passing tangent to obstrl~ctions such as pillars, mirror edges, and hood lines. A line tangent to the obstruction and to the 95% cutoff eyellipse determines the vision angle attainable by at least 95 percent of occupants. Cutoff eyellipses are also useful in head restraint design to assess, for exiimple, the percentage of occupants whose heads lie forward of a vertical plane.
Tangenl to Eyellipse
( 74% Enclosed / ' 95% Cutoff Eyelliese
Figure 5. Illustration of eyellipse concepts.
2.7 Standard Head Model
A geometric representation of the human head is used for the analyses in this report, As noted in the NPRM, head size is not strongly correlated with overall body dimensioins. In a U.S. army survey, the correlation between stature and head length (front to back) was 0.35 (Gordon et al. 1989). More importantly, the variance in head dimensions is small compared with the variance in vehicle occupant head position. For example, the standard deviation of male head length is 7 mm, while the standard deviation of fore-aft driver head position with respect to the seat H-point is 35.3 mm (see below). Consequently, it is reasonable tlo adopt the simplification of a uniform head size for these analyses. Appendix A presents a sample analysis that includes variance in head size to demonstrate that it does not substantially affect the modeling of head restraint clearance.
For this report, a mean rnalelfemale head size is used. Using the ANSUR data (Gordon et al. 1989), the mean head length (glabella to posterior pole, measured in the midsagital plane parallel to the Frankfort plane) for a 50150 rnalelfemale population is 192 mm. In the

UMTRI studies, the occupant's eye location is calculated from two landmarks. With the Frankfort plane horizontal, the eye is given the vertical coordinate of the ectocanthus (corner eye) landmark and the lateral coordinate and fore-aft coordinates of the infraorbitale landmark. Averaging across men and women, this eye location was found to lie an average of 21 mm below and 18 mm rearward of glabella. Hence, the horizontal distance from the eye to the back of the head averages 174 mm for a 50150 malelfemale U.S. adult population. Figure 6 shows the geometry of the standard head model used in this report.
/, Gli
Figure 6. Side-view geometry of the standard head model. Dimensions in rnrn.
I abella
2.8 Occupant Population
Back of Head
Many of the analyses in this report use the parameters of the distributions of occupant stature as inputs. To simplify the calculations, all analyses use the same population, defined as a 50150 malelfemale adult population with stature distributions obtained from the 1988-1994 U.S. National Health and Nutrition Examination Survey (NHANES). Official summary statistics from this survey are not yet available; however, unofficial summary tables have been published on the website of the National Center for Health Statistics (http://www.cdc.gov/nchs/). Using tables for the stature of men and women age 20 and older, the mean stature is taken to be 1755 mm for men and 1618 mm for women. In a large population of adults, stature is approximately normally distributed within gender. Using this assumption, the standard deviation of stature for each gender was calculated by dividing the difference between the reported 5th and 95th percentile values by the difference between the z-scores of these quantiles (3.29). For men, the reported 5th- and 95th-percentile stature values are 1636 mm and 1880 mm, giving a standard deviation estimate of 74.2 mm. For women, the 5th and 95th percentile stature values are 1504 rnm and 1730 mm, giving a standard deviation estimate of 68.7 mm. These values are only slightly different from weighted standard deviation estimates calculated at UMTRI using the actual NHANES data. The differences arise because the stature distributions diverge slightly from the normal distribution.
v \

3.0 HEAD AND HEAD RESTRAINT POSITIONS IN PASSENGER SEATS WITH FIXED SEATBACK ANGLES
When the seatback angle is fixed, as is generally the case in rear seats, the occupant's torso and head position with respect to the H-point is strongly affected by the seatback anglle. UMTRI has developed a statistical model to predict the distribution of occupant eye locations as a function of seatback angle and anthropometry. This model is based on studies of' driver and passenger postures in vehicles and in the laboratory (Flannagan 1996, 1998; Manary et al. 1998a; Manary et al. 1999).
In studies to develop a new driver eyellipse, the postures of up to 120 drivers were recorded in 22 vehicles (Manary et al. 1998a). In each of these vehicles, the driver seat was provided with an adjustable seatback. In a laboratory study, the postures of 48 men and womeri were recorded while sitting in seats with seatbacks fixed at 19,23, and 27 degrees (Manary et al. 1994). In the data collected with fixed seatbacks, the effects of seatback angle on driver torso posture were examined. The side-view H-point-to-eye angle with respect to vertical was linearly affected by seatback angle, with no interactions with subject anthropometry. This linear relationship was used to adjust the in-vehicle driver data to 22 degrees, the mean selected seatback angle observed across vehicles. The resulting data, when appropriately weighted to account for stratified sampling, provided good estimates of the variability of eye location for seats with fixed seatback angles. The mean eye location in seats with fixed seatback angles is determined from the seatback angle function. An eyellipse model based on these analyses is now part of the new SAE J941 draft, which is expected to be balloted this year. Appendix B contains a detailed description of the fixed-seat eyellipse model.
This model is based on data that were unaffected by head restraint position. In the laboratory studies, the head restraints were removed from the seats. The head restraints for the in- vehicle studies were mostly adjustable. The head restraints were initially placed in their lowest position, and very few drivers adjusted them prior to driving the vehicles. Al.though the data on head contacts are not available, few of the drivers in the vehicle studies contacted the head restraints with their head or hair in their normal driving postures. Hence, these models represent preferred head locations in the absence of a head restraint.
Figure 7 shows a 95% cutoff eyellipse for the U.S. adult population in a seat with a :fixed, 25- degree seatback angle. Under the definition of the cutoff ellipse, any tangent to the eyellipse divides the eye location distribution in to 5%/95% fractions. Hence, 95% of occupant's eyes lie below a horizontal tangent to the top of the eyellipse. The standard head model can be used to transform the eyellipse into an ellipse describing the locations of the backs of occupants' heads. Using the assumption that the variance in head size is small compared to the variance in head location (see Appendix A), the back-of-head (head) ellipse is obtained by translating the eyellipse by the vector from the eye to the back of the head of the standard head model. The head ellipse has the same cutoff properties as the eyellipse, so 95:% of

occupants heads are predicted to lie forward of a vertical tangent to the back of the head ellipse.
For comparison, Figure 7 also shows the HRMD as it would be located in a seat with a 25- degree seatback angle. A 50-mm line is shown extending from the rearmost point on the head contour, graphically indicating the 50-mm backset proposed in the NPRM. The analysis indicates that a head restraint with a backset of 50 mm would contact the heads of about seven percent of adult occupants if they sat in their preferred postures. The percentage of people who whose preferred head position would be intersected by the seat is approximately constant over a range of seatback angles from 18 to 32 degrees.
Figure 7. Eyellipse and back-of-head ellipse for a seat with a fixed seatback angle of 25 degrees. The HRMD is also shown, with a 50-mm line extending from the rearmost paint on the headform.
Under the assumptions of the fixed-seat eyellipse (see Appendix B), the horizontal distribution of eye locations with respect to H-point is approximated by a normal distribution with standard deviation 30.3 mm. The back-of-head distribution (head ellipse) follows the same distribution. Hence, the distribution of backset can be calculated for any head restraint geometry, seatback angle, and population. For the U.S. adult population, the mean horizontal back-of-head location is given by
MeanHeadX = 639 sin (0.719 SBA - 9.6) + 174 [I]
where SBA is the seatback angle in degrees. The mean vertical position of the population back-of-head points can be approximated by
MeanHeadZ = 639 cos(0.719 SBA - 9.6) + 21 [21

This is also a good approximation of the average vertical head center-of-mass location, because the average CM location is at approximately the same vertical position as the, rearmost point on the head (cf. Hubbard and McLeod 1974). The standard deviation of vertical head position for seats with fixed seatback angles is 36.3 mm (see Appendix B).
These distributions can be used to assess head restraint geometry with respect to occupant head positions. Under the normal distribution assumption for vertical head position, adding 60 mm to equation 2 gives the he:ad restraint height above H-point required to cover !35% of occupant,'^ head CM locations (84 mm to cover 99 percent).
HeadZ95 = 639 cos(0.719 SBA - 9.6) + 8 1
HeadZ99 - 639 cos(0.719 SBA - 9.6) + 105
For a fixed seatback angle of 25 degrees, a head restraint height above H-point of 713 mm is required to cover 95% of occupant's head CM locations (737 mm for 99 percent). These correspond to ICBC HRMD measurements (down from the top of the head form) of 45 rnrn for 95% and 24 mm for 99%. Both of these values are well within the vertical range considered "good" by IIHS (see Figure B in the NPRM).
The NPRM, following the current FMVSS 202, quantifies head restraint height by measuring along the manikin torso line (that is, along a vector oriented at an angle with respect to vertical equal to SAE L40, i.e., seatback angle). This approach confounds the measl~rement of backset and head restraint height, and complicates assessment of head restraint ge:ometries that conform to the proposed criteria. Nonetheless, using the simplified geometry outlined in Figure A of the NPRM, head restraint heights measured with respect to the H-point can be related to those measured along the manikin torso line. The results depend on the fore-aft position of the head restraint as well as the seatback angle. Figure 8 outlines the geometry used for this comparison.

Backset -*
Figure 8. Geometry used for comparing head restraint heights quantified using the NPRM method with occupant head locations. Note the restriction that the point at which the FMVSS height is measured has the same distance aft of H-point as the point at which backset is measured. This is rarely the case for production head restraints.
Using the geometry in Figure 8, the FMVSS height can be calculated as
where X is the head restraint distance aft of H-point. Rearranging, the height above H-point is given by
H = (H, - X sin(SBA) ) / cos(SBA) [61
At a 25-degree seatback angle, the rearmost point on the HRMD lies 262 mm rearward of H- point. A 50-mm backset gives a value of X of 312 mm. Inserting these values in equation 5 gives the FMVSS height that corresponds to a particular height above H-point.
The NPRM specifies a minimum head restraint height of 750 mm for rear seats measured along the manikin torso line, along with an HRMD-measured backset of 50 mm. Using the simplified geometry from Figure A of the NPRM, a head restraint height above H-point of 713 mm corresponds to an FMVSS-measured height of 778 mm, higher than the NPRM proposal.
The fore-aft head position distribution can be used to determine the fore-aft head restraint position that will provide adequate accommodation to occupants while minimizing backset. Head restraint contact with the back of the head creates substantial discomfort by forcing the neck into an awkward posture, so an adequate fixed-position head restraint should interfere with the preferred head positions of very few occupants. Using 99% accommodation as a target, the corresponding head restraint position is given by adding 7 1 mm to equation 1 :
HeadX99 = 639 sin(0.719 SBA - 9.6) + 245 [71

For a seatback angle of 25 degrees, HeadX99 is 338 mm aft of H-point. This corresponds to an HRMD-measured backset of 76 mm. With this backset, the FMVSS-defined height corresponding to HeadZ95 is 789 mm. With a 76 mm backset, the minimum head restraint height of 750 mm specified in the: NPRM would span the vertical CM locations of about 67% of occupants. The interactions between the FMVSS height and backset calculations highlight the value of specifying head restraint height and backset separately and measuring them vertically and horizontally from H-point, rather than along the manikin torso line.


4.0 HEAD AND HEAD RESTRAINT POSITIONS IN SEATS WITH AD JUSTABLE SEATBACK ANGLES
4.1 Experimental Data
Data to address seats with adjustable seatback angles (called front seats in this report,, since most front seats have adjustable seatback angles) were gathered from drivers in vehicles and in laboratory studies. Although this analysis uses driver data, laboratory and field studies have demonstrated that normal driver and passenger postures are very similar (Manany et al. 1998a), so these results should apply to front passenger seats as well.
In front seats, driver eye locations with respect to H-point can be modeled fairly simply. Figure 9 shows eye locations from 120 drivers in typical midsize sedan relative to H-point. As the figure implies, there is no correlation between the vertical and fore-aft eye locations with respect to H-point. Vertical eye location is a strong function of driver stature, but fore- aft eye location is not significantly related to driver anthropometry. These findings are consistent across vehicles in the UMTRI database.
Figure 9. Driver eye locations with respect to H-point in one midsize sedan (N=120 men and women).
750
n 700 -
w C 0 .- 5 650 - z Qr h
"00 - m 0 .- Y L
550 {
500
. . %
I ' .. . i.., . . . 8 , e m . . . +I C
I ..:.. .. . . 9.
..I. . ' . .. . I ,I. .. . & ' :,I. # . I
5 . I . . I
I . . . .. . . . . . I . .
1 1 1 1 1 1 1 1 1 1 1 1 1 1 1 1 1 1 1
-50 0 50 1 00 150 Fore-aft Eye Position (mm)

Stature (mm)
Figure 10. Driver vertical eye locations with respect to H-point as a function of stature in one midsize sedan (N=120 men and women). R' = 0.78, RMSE = 20.1.
Horizontal eye location is approximately normally distributed with a mean of 60 mm aft of H-point and a standard deviation of 35.3 mm. Because vertical eye position is linearly related to stature, the distribution is expected to be a mixture of two single-gender normals. Appendix C outlines the method for calculating a single approximating normal distribution that fits well on the tails. For the U.S. adult population, the mean eye height is 627 mm above H-point with an approximating standard deviation of 35.6 mm. Noting the similarity between the horizontal and vertical standard deviations, the driver eye location distribution with respect to H-point can be modeled well using a bivariate normal distribution with zero correlation and standard deviation 35.3 mm on each axis. Cutoff and density ellipses calculated for this distribution are circles. Applying the standard head model to the eyellipse, the driver head ellipse (modeling the distribution of back-of-head points) is centered 648 mm above and 234 mm aft of H-point, with horizontal and vertical standard deviation of 35.3 mm. Figure 11 shows the 95%-cutoff driver eyellipse and head ellipse with respect to H- point.
The head positions represented by this distribution are dependent only on the population anthropometry. Head position with respect to H-point is not affected to an important degree by vehicle package variables, such as seat height, and is unrelated to the manufacturer's design seatback angle (Manary et al. 1998a). Hence, this distribution is appropriate for use in all SAE Class A vehicles (i.e., passenger cars and LTVs).

95% Cutoff
- 234 - Figure 11. Driver eyellipse and head ellipse (95% cutoff) with respect to H-point for U.S. adult driver population in seats with adjustable seatback angles. Fore-aft and vertical standard deviations of the bivariate eye and back-of-head normal distributions are 35.3 mm. HRMD is shown with a seatback angle of 25 degrees.
Calculating head-to-head-restraint dimensions in front seats is considerably more complicated than in rear seats because changes in seatback angle alter the geometric relationship between the head and head restraint. In this analysis, the head restraint is assumed to be attached to the seatback, which pivots around a single axis. Although there are seats with more complicated kinematics, the single-pivot-axis seat is believed to represent the majority of current front seats.
During in-vehicle experiments, driver-selected seatback angle was measured by recording the positions of reference points on the seatback after the driver completed seat adjustments and returned from a drive. These reference points were also recorded while conducting an H- point measurement using the SAE J826 manikin with the seatback angle (manikin torso line angle) at 22 degrees, the mean expected seatback angle (see below for more discussion of mean expected seatback angle). Deviations from the reference orientation obtained during the H-point measurement were interpreted one-to-one as changes in seatback angle. Note that this is different from installing the manikin and measuring the seatback angle at a range of angles. An angle change of the seatback of three degrees might change the manilkin- measured angle by more or less, depending on how the manikin interacts with the seat. The data are more readily interpreted when driver-selected seatback angle is referenced to a single manikin-measured seatback angle. For this reason, it is important that seatback angle measurements be made as close as possible to the mean selected seatback angle for occupants using the seat.

Driver-selected seatback angle is correlated with driver stature, but to a much smaller extent than is commonly assumed. Figure 12 shows seatback angle as a function of stature for a typical vehicle. Stature in this subject pool spanned the range from less than 5th-percentile female to greater than 95th-percentile male for the U.S. adult population. The R2 for a linear regression of stature on seatback angle is 0.15, indicating a weak relationship. The mean expected seatback angle in this vehicle for women who are 5th-percentile female by stature is 22 degrees, compared to 25.5 degrees for men who are 95th percentile by stature.
~ ~ ~ I ~ I ~ I I I ~ I I I ~ I I I ~ ~ I I
. 1450 1550 1650 1750 1850 1950
Stature (mm)
Figure 12. Seatback angle as a function of stature for one vehicle (N=120).
Because the test population was stratified by stature, reweighting is necessary to calculate the standard deviation of seatback angle that would be expected for the U.S. adult population. Appendix C outlines this approach. Table 1 lists the mean and standard deviation of seatback angle for the U.S. adult population calculated for five vehicles, each tested with 60 men and 60 women. (The vehicles in Table 1 were select to span a wide range of package configurations and only coincidentally are from the same manufacturer.)

Table 1 Summary Statistics for Seatback Angle in Vehicles
In a laboratory study, the driver and passenger postures of 36 men* were measured in each of ten driver seats selected to span a wide range of contouring and stiffness (Manary et ;al. 1999). The participants' statures spanned the range from 1640 to 1940 mm. Although there were no significant differences between driver and passenger postures on the variables considered here, only driver data were used for this analysis. Although only men were studied, an estimate of the mean and standard deviation of seatback angle that would be observed was estimated by using the anthropometric weighting methods described in1 Appendix C. In brief, the observed relationship between stature and seatback angle was used to adjust the mean and to weight the standard deviation to represent the U.S. adult population. Table 2 lists the mean and standard deviation of seatback angle after adjusting to match the U.S. adult population.
* This study was conducted to validate the ASPECT H-point manikin, which represents midsize-male anthropometry, hence only men were measured. As noted in the text, this does not substantially dimirdsh the value of the data for the current application.

Table 2 Driver-Selected Seatback Angle Statistics for Ten Vehicle Seats
by applying the mean stature effect coefficient from the in-vehicle data of 0.01 16 degree per mm of stature, resulting in a correction of -0.8 degrees.
S.D.
** Seat 6, a heavy truck seat with a highly restricted seatback angle range, is excluded from this analysis. The recliner on Seat 7 had insufficient range, resulting in substantial censoring, and hence is excluded from this analysis.
I *Data from 36 men adjusted to represent the U.S. adult population (men and women)
1.45
4.2 Modeling Driver Backset
0.71
Efect of Seatback Angle Variance
The foregoing summary statistics on driver head position and seatback-angle selection behavior can be used to model the spatial relationship between the driver's head and the head restraint. The seatback pivot location and head restraint geometry are the variable inputs. Figure 13 shows an idealized seatback and head restraint geometry. The analysis will focus on backset, the variable most strongly affected by changes in seatback angle. HRMD- referenced backsets will be those measured with a seatback angle of 25 degrees. The most- rearward part of the HRMD headform lies 263 rnm rearward of the H-point with the manikin torso back line at 25 degrees with respect to vertical, so HRMD-measured backsets can be referenced to H-point by adding 263 mm.

Backset
Manikin Torso Line
Figure 13. Geometry used to calculate the distributions of driver head-to-head-restraint clearance variables. The head restraint is assumed to be vertical when the seatback angle is 25 degrees. For a typical front seat, the seatback pivot location with respect to H-point is given by X, = 135 mm and Z, = 90 mm.
For the small angle changes associated with the range of driver-selected seatback angles (about a 15 degree range), a head restraint that is vertical in the middle of the range is approximately vertical throughout the range. Hence, if the front surface of the head restraint is assumed to be vertical, backset can be modeled effectively using only the head restraint position at the mean head height (back-of-head point) of 648 mm above the H-point. The head restraint location along this horizontal line changes with seatback angle according to the sine of the seatback angle, but this relationship is very nearly linear in seatback angle over the range of interest. The fore-aft distribution of head restraint position along the mlean- head-height line can then be calculated by a linear transformation of seatback angle. Driver- selected seatback angle is approximately normally distributed. Because a normal distribution remains normal under a linear transformation, the location of the head restraint along the mean-head-height line can be modeled as normal.
The relationship between seatback angle and head restraint fore-aft position dependls on the seatback pivot location relative to H-point and the head restraint geometry. In the ten seats for which values are reported in Table 2, the average pivot location was 90 mm below and 135 mm rearward of H-point. Figure 13 shows this pivot location and an idealized head restraint meeting the proposed NPRM backset criterion of 50 mm (313 mm aft of H-point with the seatback angle at 25 degrees).
One way to determine the relationship between the fore-aft head restraint position (:X,,) and seatback angle is to measure X,, at two different seatback angles. Using the geometry in Figure 13 and seatback angles of 18 and 26 degrees gives a difference in X,, of 1041. mm.

Dividing by the angle range (8 degrees) gives a linear scaling factor to convert seatback angle changes into changes in head restraint position. Algebraically,
m = (X,,,, - XHRj) 1 (SBAj - SBA,) [81
where SBAj and SBAi are two seatback angles. For the geometry in Figure 13, m is 13 mmldegree. The standard deviation of X,, (s,,)can then be computed as
Using averages across Tables 1 and 2, the seatback angle distribution is modeled as a normal distribution with mean 22.3 degrees and standard deviation 3.4 degrees. The standard deviation of X,, is then 44.2 mm.
Backset for the driver is the horizontal distance from the back of the head to the head restraint, or X,, - X,. Both are modeled as normal distributions, so the distribution of backset is also a normal distribution with standard deviation given by
where sH is the standard deviation of fore-aft head position and r is the correlation between fore-aft head position and fore-aft head restraint position. Because correlation remains invariant with linear transformations of the contributing variables, the correlation between X, and X,, is the same as the correlation between X,and seatback angle. Across the five vehicles in Table 2, the mean correlation coefficient between seatback angle and fore-aft head position with respect to H-point is 0.6 18 (minimum 0.556, maximum 0.730). Hence, for the geometry in Figure 13, the standard deviation of driver backset is 36 mm.
The mean driver backset depends on mean driver-selected seatback angle. With a mean seatback angle of 22.3 degrees and the geometry in Figure 13 (including a 50-mm HRMD backset measured at 25 degrees), the mean driver backset is 44 mm. For head restraints that are vertical at a seatback angle of 25 degrees, the mean backset and the HRMD-measured backset are additive. For example, a 100-mm HRMD-measured backset (obtained at 25 degrees) would give a mean driver backset of 94 mm if the mean selected seatback angle is 22.3 degrees.
Figure 14 shows the distribution of driver backset for a range of HRMD-measured backsets. With an HRMD backset of 50 mm measured at 25 degrees (the NPRM proposal), the head restraint intersects the preferred head positions of about 13 percent of drivers (intersection indicated by negative driver backset). For HRMD backsets of 75 and 100 mm, the percentages are 4% and 0.9%, respectively.

Cumulative Fraction
-100 I - 5 0 5 0 100 15 0 200
Driver Backset (mm)
1
0.8
Figure 14. Cumulative driver backset distributions for the geometry in Figure 13 and a mean driver-selected seatback angle of 22.3 degrees.
-
! ! HRMD Backset 25 50 75 loo at 25 Degrees (rnrn)
EfSect of Mean Driver-Selected Seatback Angle Across Vehicles
Among the variables affecting the distribution of driver backsets, the most important. are the mean selected seatback angle and the head restraint location aft of H-point (or backset as measured by the HRMD). Figure 14 showed that the mean driver backset is approximately linear with the fore-aft position of the head restraint, measured at a constant seatback angle near the center of the driver-selected range.
Combining the data from Tables 1 and 2, the standard deviation of mean selected seatback angle across vehicles (seats) is 1.3 degrees. This represents the precision with which the mean selected seatback angle can be predicted for any particular vehicle. Assuming a normal distribution of mean driver-selected seatback angles across vehicles, 95 percent of mean driver-selected seatback angles will lie in the range of 22.3 + 2.5 degrees, or 19.8 to 24.8 degrees. Figure 15 shows the distribution of driver backsets that would be obtained if the mean selected seatback angle was 19.8,22.3, or 24.8 degrees for an HRMD backset of 50 mm and the pivot geometry in Figure 13. The mean backset ranges from 12 rnrn for a mean driver-selected seatback angle of 19.8 degrees to 76 mm for a mean seatback angle of 24.8 degrees. As noted above, the slope of the seatback-angle-to-backset relationship for this seatback geometry is 13 mm per degree.

Cumulative Fraction
- 1 0 0 - 5 0 50 1 0 0 1 5 0 200 I
Driver Backset (mm)
1
0.8
Figure 15. Cumulative driver backset distributions for three mean driver-selected seatback angles, using an HRMD-measured backset of 50 mm at 25 degrees and the geometry from Figure 13.
-
19.8 Y 22,3 24.8 Mean Driver-Selected
Effect of the Angle at Which Backset is Measured with the HRMD
Seatback Angle (deg)
The NPRM, following the procedures developed by ICBC, specifies that backset should be measured with the seatback angle set to 25 degrees. As noted above, 25 degrees is close to the 95th percentile of the mean driver-selected seatback angle distribution across vehicles. The HRMD-measured backset is better representative of the mean of the distribution of driver backsets if the HRMD measurement is made at 22 degrees.
In general, a 50-mm HRMD backset measured at 22 degrees will produce larger driver backsets than the same backset measured at 25 degrees. Using the geometry in Figure 13 and a mean driver-selected seatback angle of 22 degrees, the mean driver backset for a 50-mm HRMD backset measured at 22 degrees is 54 mm, compared with 40 mm for a 50-mm HRMD backset measured at 25 degrees. This difference holds across backsets: the mean driver backset is 14 mm larger for the same HRMD-measured backset at 22 degrees. Hence, the 50-d25-degree backset proposed in the NPRM is equivalent to a 36-md22-degree backset.
Backset Spec$ications to Accommodate Preferred Driver Head Positions
For typical seatback pivot locations, the standard deviation of driver backset is about 35 mm (lower pivot locations would produce slightly larger backset standard deviations, if seatback angle standard deviation remained constant). This information can be used to select a head restraint backset specification that provides minimum backset for drivers without interfering with the preferred head positions of a substantial percentage of drivers. Figure 16 shows the driver and corresponding HRMD backsets required to accommodate the driver population.

The NPRM-proposed 50-mm backset measured at 25 degrees would disaccomrnodate about 13 percent of U.S. drivers (see Figure 14). As shown in Figure 16, a 25-degree backset of 91 mm at 25 degrees is required to accommodate 99 percent of drivers (68 mm for 95 percent accommodation). Measured at 22 degrees, the HRMD backset to accommodate 99 percent of drivers' preferred head positions is 77 mm (54 mm for 95 percent accommodation>^. IIHS has rated an HRMD backset of 70 rnm measured at 25 degrees as "good." Figure 16 shows that such a backse,t: would disaccommodate about 4.5 percent of drivers' preferred head positions.
Note that these calculations are only valid if the mean driver-selected seatback angle is 22 degrees. If the mean seatback angle is less than 22 degrees, a larger percentage of drivers would be disaccommodated than is shown in Figure 16. If the mean selected seatback angle is greater than 22 degrees, a larger percentage of drivers will be accommodated, but the mean driver backset will also be larger than expected.
L A 0.91 0.92 0.93 0.94 0.95 0.96 0.97 0.98 0.99 1
Fraction of Drivers Accommodated
Figure 16. Head restraint positions relative to mean head location in a seat with a mean driver-selected seatback angle of 22 degrees. The horizontal axis shows the fraction of drivers whose preferred head location does not intersect the head restraint. The right axes show the corresponding HRMD-measured backsets for measurements at 22 and 25 degrees.
Accommodation Across Vehicles
Mean selected seatback angle is assumed to vary across vehicles with a standard deviation of 1.3 degrees (see Tables 1 and 2). The percentage disaccommodated in each vehicle is obtained by evaluating the cumulative density function of the backset distribution at zero. As noted above, the backset distribution is a function of mean selected seatback angle (:see Figure 15). Hence, the backset distribution and percentage disaccommodated can be calculated for each possible mean seatback angle.

Figure 17 shows the percentage of drivers disacommodated as a function of mean selected seatback angle for a head restraint meeting the NPRM criteria and the pivot geometry from Figure 13. Also shown is a normal probability density function representing the expected distribution of mean seatback angle across the vehicle fleet. Integrating the product of these two functions gives the percentage of all vehicle drivers who would be disaccommodated. For a head restraint meeting the NPRM criterion of a 50-mm/25-degree HRMD backset, about 13 percent of drivers across vehicles would be disaccommodated.
A 50-mm backset specified at 22 degrees would disaccommodate about 7 percent of drivers. An 80-mm HRMD backset at 22 degrees would disaccommodate about 1.2 percent of drivers across vehicles. Due to the shape of the disaccommodation curve in Figure 17, the percentage of drivers disacommodated across vehicles is reasonably approximated by the percentage disaccommodated at the mean selected seatback angle of 22 degrees, i.e., that given in Figure 16.
Disrtibution of Mean Driver- Selected Seatback Angle
2 0 2 2 2 4 2 6 2 8
Seatback Angle (degrees)
Figure 17. Distribution of mean driver-selected seatback angle across vehicles and the expected fraction of drivers disaccomrnodated by a head restraint meeting the backset criterion proposed in the NPRM.
These analyses do not consider hair contact with the head restraint. If hair contact is considered to be disaccommodation, then a larger backset is required. In a study of driver headroom perception, the head and hair contours of 100 men and women were digitized (Reed and Schneider 1999). For the current analysis, the fore-aft distance between the most rearward point on the hair and the most rearward point on the hair was calculated. The distribution is skewed, as expected, with a long upper tail. The mean hair margin for men is 22 mm, compared to 36 mm for women. For a 50/50 maletfemale population, the median hair margin is 25 mm (50 mm at the 90th percentile). Even the median hair margin is a substantial fraction of the mean occupant backsets discussed above. For example, the mean occupant (head) backset for a head restraint meeting the NPRM backset criterion in a driver seat with a 22-degree mean seatback angle is 40 mm. Including the median hair margin, the mean backset is reduced to 15 mm, and 33 percent of drivers are disaccommodated.

4.3 Head Restraint Height in Seats with Adjustable Seatback Angles
Head restraint height is comparatively easier to model and specify than backset. As noted above, the vertical distribution of the back-of-head point for a U.S. driver population is modeled by a normal distribution with mean 648 mm and standard deviation 35.3 mm. A head restraint spanning 95 percent of drivers' back-of-head points would reach 706 rnm above H-point (730 rnrn above H-point for 99 percent).
The FMVSS dimension corresponding to this value depends on the fore-aft position and the geometry of the head restraint. Using the geometry in Figure 13, which includes a 50 rnm HRMD backset measured at 25 degrees, the corresponding FMVSS height for 95 pericent coverage is 772 mm (794 mm for 99 percent coverage). Under the same geometric assumptions, the NPRM requires a minimum FMVSS height of 750 mm and a minirrium attainable FMVSS height of 800 mrn. The foregoing calculations suggest that the heights proposed in the NPRM will span 95 to 99 percent of drivers' head positions, but the IWVSS measurement technique ties the height measurement to backset and head restraint geometry.


5.0 REPLACEMENT OF THE SAE 5826 H-POINT MANIKIN
The current SAE J826 H-point manikin was developed in the early 1960s. Although it has been an effective tool for vehicle interior design, the manikin is difficult to use and has poor repeatability in modem seats wit11 prominent lumbar supports. Because the manikin h,as a single, rigid torso shell, the manikin tends to pivot around a prominent lumbar support, resulting in inter- and intra-operator variance in H-point and seatback angle measures.
These and other problems associated with the current manikin motivated the SAE Design Devices committee to investigate the possibility of developing a new H-point maniki.n. Beginning in 1995, the Automotive Seat and Package Evaluation and Comparison Tools (ASPECT) program developed a new H-point manikin with an articulated lumbar spine that interacts more repeatably with automobile seats (Reed et al. 1999). The manikin, shown in Figure 18, is now nearing approval by the SAE Design Devices committee as a replalcement for the current H-point machine. Prototypes of the new manikin are in use at the 12 iiuto industry companies who sponsored the program, including General Motors, Ford, DaimlerChrysler, Toyota, and others.
Figure 18. ASPECT manikin prototype.
Although the new manikin has many advantages over the old manikin, the most important feature for the purposes of the current analysis is the articulated lumbar spine. The articulation allows the manikin to conform more readily to a longitudinally contoured

seatback. The posture of the lumbar spine in the manikin is interpreted as lumbar support prominence. Preliminary data suggest that the new H-point manikin (known as the ASPECT manikin or HPM-11) will provide more reliable measurements of H-point and seatback angle than the old manikin.
The proposed changes to FMVSS 202 could pose problems for the industry in switching to the new manikin. In particular, the requirement to use the ICBC HRMD would require manufacturers to maintain the old manikin in their design and audit procedures, because the ICBC HRMD cannot be used with the new manikin.
NHTSA can preserve the ability of the industry to switch to a new seat design manikin by revising FMVSS 202 in such a way that:
1. the ICBC HRMD is not required, 2. head restraint position requirements are specified with respect to H-point, and 3. the H-point-manikin usage procedures reference the most recent version of SAE J826 at
the time the final rule is issued.
These steps will not diminish the safety benefits anticipated under the new rule, and will preclude the unintended effect of preventing the industry from moving to an improved seat design and measurement tool.

6.0 RECOMMENDED HEAD RESTRAINT GEOMETRY TO ACCOMMODATE PREFERRED OCCUPANT HEAD POSITIONS
These recommendations are based on the premise that a good head restraint that is fixed to the seatback will
1. lie directly rearward of the head center of mass of at least 99 percent of occupants, and
2. provide the minimum occupant backset possible while accommodating 99 percent of occupants' preferred head positions.
In practice, accommodating 99 percent of head positions is approximately equivalent to acommodating 95 percent of head positions with a median hair margin of 25 mm. All calculations assume a U.S. adult population (defined by NHANES 111) with an even (gender distribution. This assumption is reasonable for front seats but may be conservative fix rear seats in most vehicles where the average occupant size is smaller.
6.1 Head Restraint Height
Head restraint height is measured vertically from H-point. The measurement procedure used in the NPRM (along the manikin torso line) does not provide a measure of the height of the front surface of the head restraint.
Seats with Fixed Seatback Angle
Rear head restraints should extend at least vertically above H-point a distance given by
HFs = 639 cos(0.719 SBA - 9.6) t 105 11
where SBA is the seatback angle measured by the SAE J826 manikin.
Seats with Adjustable Seatback Angle
Front head restraints should extend at least 730 mm vertically above the H-point, measured with the seatback angle at 22 degrees.
6.2 Fore-aft Head Restraint Position
Fore-aft head restraint position is measured rearward from H-point.
Seats with Fixed Seatback Angle
The front surface of the head restraint should lie a distance rearward of H-point given by
X,, = 639 sin(0.719 SBA - 9.6) t 245 [I21

where SBA is the seatback angle measured by the SAE J826 H-point manikin.
Seats with Adjustable Seatback Angle
The front surface of the head restraint should lie 315 mm rearward of H-point when the seatback angle is 22 degrees as measured by the SAE J826 H-point manikin.

7.0 PROCEDURES FOR MEASURING HEAD RESTRAINT GEOMETRY
As noted above, the ICBC HRMD is not needed to measure fore-aft head restraint position, and can lead to problems with repeatability. An alternative is to specify and measure head restraint geometry with respect to H-point. A new method for measuring the effective locations of the front and top of the head restraint is proposed that can be accomplished physically or in CAD without requiring new tools.
A standard H-point measurement is made using the SAE 5826 H-point manikin to establish the H-point and seatback angle. For a seat with an adjustable seatback, the seatback angle is adjusted to obtain 22M.5 degrees. With the manikin in the seat, the head restraint geometry on the occupant centerline is measured by translating a 165-mm-diameter sphere such that the center of the sphere lies on the occupant centerline plane and the sphere contacts the front surface of the head restraint. (The 165-mm-diameter sphere is taken from the proposed procedure in the NPRM for measuring gaps in head restraints. Such a sphere reasoniably approximates the curvature of the back of the head.) The front surface profile of the head restraint is obtained by translating the path of the sphere center rearward by the sphere radius (82.5 mm). Figure 19 shows this procedure schematically.
The height of the head restraint is the highest point on the front surface profile of the: head restraint below which all points on the head restraint and seat profile meet the fore-aft head restraint requirement. If the head restraint height is adjustable, the measurement is repeated in the full-up and full-down positions to determine the range of height adjustment.
The step-by-step procedure is as follows:
1. Establish the H-point and seatback angle. For a seat with an adjustable seatback angle, set the seatback angle to 22 degrees. For a physical measurement, the H-point manikin would be installed according to the latest SAE J826 procedures.
2. Determine the head restraint profile. Translate a 165-mm-diameter sphere such that the center of the sphere lies on the occupant centerline plane and the sphere contacts the front surface of the head restraint. (The 165-mm-diameter sphere is taken from the proposed procedure in the NPRM for measuring gaps in head restraints. Such a sphere reasonably approximates the curvature of the back of the head, but avoids the idiosyncrasies of the HRMD backset probe.) The front surface profile of the head restraint is obtained by translating the path of the sphere center rearward by the sphere radius (82.5 mm). Figure 2 shows this procedure schematically. For a physical measurement, a simple mechanical probe with a 165-mm-diameter wheel could be moved along the surface of the head restraint on the centerline to record the contour. More accurate measurements could be made by digitizing the front surface of the head restraint relative to the H-point and conducting the analysis in software.

3. Determine the height of the head restraint. The height of the head restraint is the highest point on the front surface profile of the head restraint below which all points on the head restraint and seat profile meet the fore-aft head restraint requirement. If the head restraint height is adjustable, the measurement is repeated in the full-up and full-down positions to determine the range of height adjustment.
5. Determine fore-aft position. If a single measure of fore-aft head restraint position is required, measure the fore-aft position with respect to H-point of the intersection of the head restraint profile with a horizontal line 648 rnrn above the H-point. (The most rearward point on drivers' heads lies an average of 648 mm above H-point.)
Translate a 165-mm-Diameter Sphere In Contact with the Front Surface of Head Restraint On Occupant Centerl~ne To Determine the Head Restraint Profile \ ,,
Head Restralnt Must Be A At Least Thrs Hlgh
Head Restraint Profile
Head Restralnt Height 1s the Highest Point on the Head Restraint Profile Below Which the Entlre Proflie Lles Forward of the Vertical Llne Deflnlng the Horizontal Posltlon Requ~rement
1 Horizontal Pos~tton Requ~rement: Head Restralnt Profrle Must Lie Forward of This llne - 315 -
Figure 19. Proposed procedure for measuring head restraint height and fore-aft position. Seatback angle, height, and fore-aft position specifications are the recommendations for seats with adjustable seatbacks. See text for recommended values for seats with fixed seatback angle.

8.0 DISCUSSION
8.1 Accommodation
The analyses in this report are intended to provide information on vehicle occupant head position that can be used to make informed decisions about head restraint design. The primary focus is on the distribution of occupant head positions and the resulting restrictions on comfortable head restraint position. Although quantitative data are lacking, the ccmsensus among a number of auto industry human factors practitioners is that most drivers fincl even hair contact with the head restraint to be unacceptable. Interference between an occupant's preferred head position and the head restraint causes posture deviations that can rapidly become uncomfortable.
The focus in this report on accommodation of preferred head position is not intended to imply that this should be the sole consideration in the design of head restraints. The proper functioning of the head restraint in rear-impact situations should be paramount. However, head restraints that interfere with occupant's preferred head positions will be discouraged through customer complaints to the manufacturers. The apparent remedy for such complaints, under the proposed regulations, will be for manufacturers to redesign their seats to produce more reclined mean driver-selected seatback angles, thereby increasing driver backset. Based on the analyses above, it is likely that the few vehicles IIHS measure:d with backsets less than 75 mm have seats that produce larger-than-average seatback angles.
8.2 Limitations
The analyses in this report are based on work performed over the past decade at UMTRI. Although data from only 5 vehicles and 10 seats were used directly, the summary statistics used to build the head-position and backset models are consistent with those obtained from larger numbers of vehicles
For rear seats, the analyses are based on the calculated fore-aft and vertical variance in eye position. The fixed-seat eyellipse model, described in Appendix B, was developed by adjusting in-vehicle driver eye location data to a common seatback angle. The resulting standard deviation of fore-aft eye location based on adjusted in-vehicle data (30.3 mm), is very similar to the standard deviation obtained in the laboratory study with fixed seatback angles (28.4 mm).
The data used to model head position in seats with adjustable seatback angle were similarly consistent across vehicles (see Table 1). It is unlikely that the use of data from more vehicles would substantially change the three values that are most important for modeling driver backset: the standard deviations of fore-aft head position with respect to H-point and seatback angle, and the correlation between fore-aft head position and seatback angle. The analysis is not highly sensitive to the correlation. Using the highest and lowest values in

Table 1 changes the estimated backset standard deviation in a range from 30 rnm (r = 0.73) to 38 mm (r = 0.556).
Uncertainty in mean driver-selected seatback angle has been explicitly modeled. The variable that is most likely to affect the accuracy of the estimate of the backest variance across vehicles is the standard deviation of seatback angle, which ranges from 2.4 to 4.4 across the seats and vehicles in Tables 1 and 2. These values would produce backset standard deviations from 29 mm to 44 mm, respectively (using r = 0.618). Broadly speaking, the backset standard deviation probably lies between 30 and 40 rnrn in most vehicles (assuming a head restraint with a vertical front surface positioned high enough to lie rearward of all drivers' back-of-head landmarks). This range of backset standard deviations would produce a range of head restraint position criteria spanning about twice that amount, or about 20 mm. This is a reasonable estimate of the uncertainty in the backset analyses.
An interesting way to assess the model validity is to compare the recommendations for fixed- and adjustable-seatback head restraint geometry, because the two models are based on different data. Using a fixed seatback angle of 22 degrees, the recommended head restraint height is 740 mm, slightly higher than the 730 rnm recommended for seats with adjustable seatbacks. The recommended fore-aft position for a head restraint in a fixed seat with a 22- degree back angle is 3 14 mm, very close to the 3 15 mm recommended for a seat with an adjustable seatback angle.
A primary limitation of the models in this report is that occupant behavior is modeled without considering responses to interference from the head restraint. With the higher and more-forward head restraints that would be required by the NPRM, a significant percentage of drivers would experience head or hair contact with the head restraint as they adjusted the seatback angle, and hence might choose a posture different from the one modeled. In particular, this effect would increase the correlation between seatback angle and fore-aft head position (because they would become physically linked for some people). Mean selected seatback angles would be likely to increase, and the variance in seatback angle would be likely to decrease. These effects would tend to reduce the variance in backset. In general, the distribution of driver backset in a seat with a more restrictive head restraint position would likely be non-normal because of a disproportionate number of people with near zero backset. These are the people who might receive the best protection from the head restraint, but they are also those most likely to complain about head and hair interference.
8.3 Measurement Procedures
The proposed revision of FMVSS 202 provides an opportunity to revise the measurement definitions and methods used in the standard. However, adding a new tool (the ICBC HRMD) to measure backset while preserving the old method for measuring head restraint height is unwieldy. One clear advantage in retaining the old method for measuring height is continuity with European and past U.S. practice, something the industry has advocated. However, combining the backset and height measurements in a single procedure, as described above, provides measurements that are easier to specify consistently. In effect, the proposal in this report creates a "head restraint zone" with respect to H-point within which

the profile of the head restraint must lie (the zone is a function of seatback angle for sleats with fixed seatback angle).
Table 3 lists four options for measuring head restraint height and fore-aft position. Option 1 is the current NPRM proposal and option 4 is the proposal advocated in this report. Options 2 and 3 are preserve the current method of measuring head restraint height, but option 3 measures fore-aft position with respect to H-point, rather than using the HRMD.
Table 3 Options for Specifying Head Restraint Height and Fore-aft Position
Option
1
2
3
4
Height Measurement
FMVSS 202 (manikin torso line)
FMVSS 202
FMVSS 202
Height above H- point
Fore-aft Measurement
ICBC HRMD at 25 degrees
ICBC HRMD at 22 degrees
Position rearward of H-point
Position rearward of H-point
Comments
NPRM proposal
More accurate representation of mean occupant backset
Eliminates need for ICBC HRMD; provides opportunity to use new H-point manikin
Eliminates need for ICBC HRMD:, provides opportunity to use new H-point manikin; measures height in a manner more closely related to the vertical range of restraint effectiveness


9.0 CONCLUSIONS
The extensive data on vehicle occupant head location collected at UMTRI provide a useful starting point for specifying head restraint geometry. Although there is necessarily some uncertainty in the analysis presented in this report, several important observations can be made.
1. The vertical position of vehicle occupant's heads can be predicted accurately from knowledge of the distribution of population anthropometry and postural variance. The analysis suggests that the head restraint heights proposed in the NPRM would span 95 percent or more of occupant's head positions. Measuring head restraint height vertically from H-point, rather than along the torso line as in the NPRM, would decouple the fore-aft and vertical position specifications and create a clearer standard.
2. Head restraint fore-aft positions are constrained by the distribution of occupant's preferred head positions. Interfering with preferred head positions has a substantial cost with respect to comfort and accommodation, and hence the minimum average occupant backset is constrained by the variance in preferred head positions. Because this variance is independent of vehicle and seat geometry as well as anthropornetry, it represents a fundamental human behavior that must be taken into account in specifying head restraint positions. Roughly speaking, a head restraint must lie at least 70 to 80 mm rearward of the mean back-of-head location to accommodate an acceptable percentage of people. This means that the mean backset achievable with fixed,-position head restraints cannot be reduced appreciably below 70 mm without disaccommodating a substantial percentage of occupants.
3. Many occupants do not like their hair to be in contact with the head restraint. Typical hair margins of 25 mm may mean that larger average backsets than those suggested by the head position analysis (more rearward head restraint positions) are necessary for occupant acceptance.
4. A new measurement procedure is suggested that eliminates the need for the ICBC HRMD and decouples the measurement of head restraint height and fore-aft position. The HRMD is not necessary to specify and measure head restraint geometry, and requiring the device could unnecessarily restrict the ability of the industry to upgrade the SAE H-point manikin. The new procedures can be implemented physically or in software.


10.0 REFERENCES
Devlin, W.A. and Roe, R.W. (1968). The eyellipse and considerations in the driver's forwardfield of view. Technical Paper 680105. Warrendale, PA: Society of Automotive Engineers, Inc.
Flannagan, C.C., Schneider, L.W., and Manary, M.A. (1996). Development of a seating accommodation model. Technical Paper 960479. Warrendale, PA: Society of Automotive Engineers, Inc.
Flannagan, C.A.C., Manary, M.A., Schneider, L.W., and Reed, M.P. (1998). An improved seating accommodation model with applications to diferent user populations. Technical Paper No. 98065 1. Warrendale, PA: Society of Automotive Engineers, Inc.
Gordon, C.C., Churchill, T., Clauser, C.E., Bradtmiller, B., McConville, J.T., Tebbetts, I., and Walker, R.A. (1989). 1988 Anthropometric Survey of U.S. Army Personnel: Methods and Summary Statistics. Final Report NATICWTR-891027. Natick, MA: U.S. Army Natick Research, Development, and Engineering Center.Hammond and Roe??
Hammond, D.C. and Roe, R.W. (1972). Driver head and eye positions. Technical Paper 720200. Warrendale, PA: Society of Automotive Engineers, Inc.
Hubbard, R.P. and McLeod, D.G. (1974). Definition and development of a crash dummy head. Proc. 18th Stapp Car Crash Conference. SAE Technical Paper 741 193. Warrendale, PA: Society of Automotive Engineers, Inc.
Insurance Institute for Highway Safety (1997). Status Report, Vol. 32, No. 4. Arlington, VA: Insurance Institute for Highway Safety.
Manary , M.A., Flannagan, C.A.C., Reed, M.P., and Schneider, L.W. (1 998a). Development of an improved driver eye position model. Technical Paper No. 980012. Warrendalt:, PA: Society of Automotive Engineers, Inc.
Manary, M.A., Flannagan, C.A.C., Reed, M.P., and Schneider, L.W. (1998b). Predicting Proximity of Driver Head and Thorax to the Steering Wheel. In the Proc. of the 16th International ESV Conference. Washington DC NHTSA.
Manary, M.A., Reed, M.P., Flannagan, C.A.C., and Schneider, L.W. (1998~). ATD Positioning based on driver posture and position. Proc. 4Td Stapp Car Crash Conference. Technical Paper 983163. Warrendale, PA: Society of Automotive Engineers, Inc.
Manary, M.A., Flannagan, C.A.C., Reed, M.P., and Schneider, L.W. (1999). Huma!n subject testing in support of ASPECT. Technical Paper 990960. Warrendale, PA: Society of Automotive Engineers, Inc.

Meldrum, J.F. (1 965). Automobile driver eye position. Technical Paper 650464. Warrendale, PA: Society of Automotive Engineers, Inc.
National Highway Traffic Safety Administration (2001). 49 CFR Part 571. Federal Motor Vehicle Safety Standards; Head Restraints; Proposed Rule. Docket No. NHTSA-2000-8570. U.S. Department of Transportation, Washington, DC. (http://dms.dot.gov)
Pedder, J. and Gane, J. (1995). Evaluation of head restraint position in passenger vehicles in Canada. In Proc. Canadian Multidisciplinary Road Safety Conference IX. Quebec, Canada: Montreal University Transportation Research Center.
Reed, M.P., Roe, R.W., and Schneider, L.W. (1999). Design and development of the ASPECT manikin. Technical Paper 990963. Warrendale, PA: Society of Automotive Engineers, Inc.
Reed, M.P. and Schneider, L.W. (1999). Investigating driver headroom perception: methods and models. Technical Paper 990893. Warrendale, PA: Society of Automotive Engineers, Inc.
SAE (2000). SAE Handbook. Society of Automotive Engineers, Warrendale, PA.
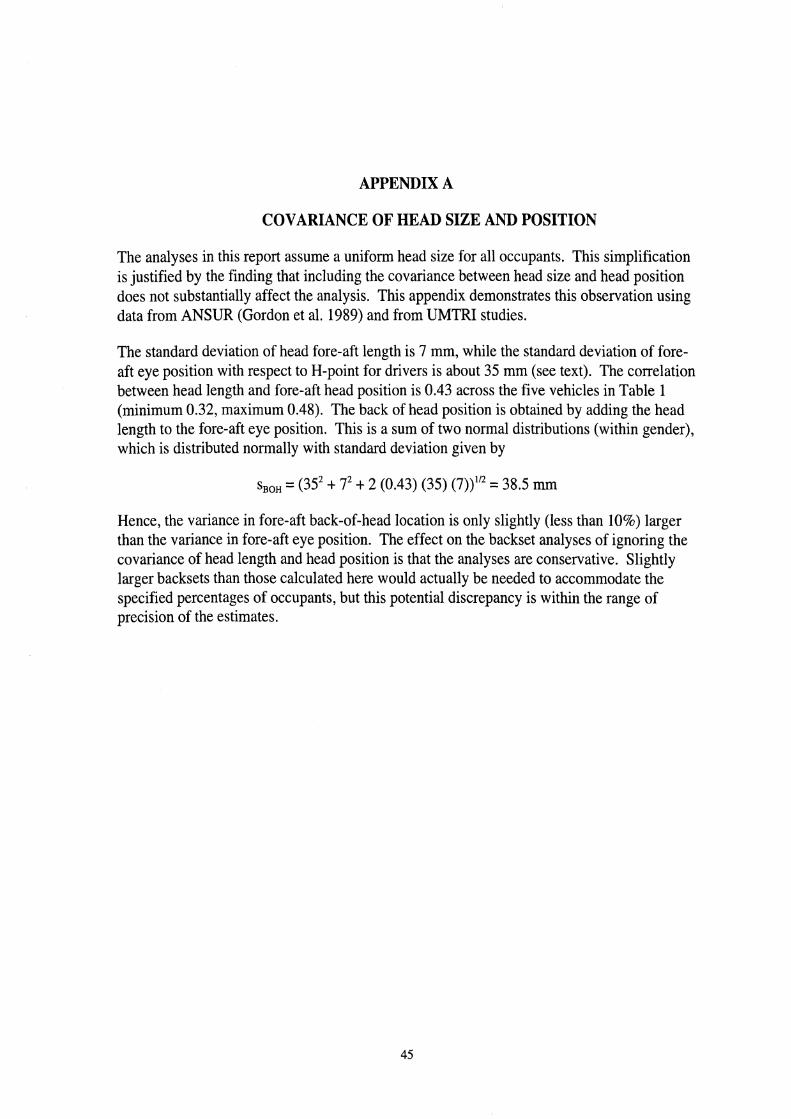
APPENDIX A
COVARIANCE OF HEAD SIZE AND POSITION
The analyses in this report assume a uniform head size for all occupants. This simplification is justified by the finding that including the covariance between head size and head position does not substantially affect the analysis. This appendix demonstrates this observation using data from ANSUR (Gordon et al. 1989) and from UMTRI studies.
The standard deviation of head fore-aft length is 7 mm, while the standard deviation of fore- aft eye position with respect to H-point for drivers is about 35 mm (see text). The correlation between head length and fore-aft head position is 0.43 across the five vehicles in Table 1 (minimum 0.32, maximum 0.48). The back of head position is obtained by adding the head length to the fore-aft eye position. This is a sum of two normal distributions (within gender), which is distributed normally with standard deviation given by
Hence, the variance in fore-aft back-of-head location is only slightly (less than 10%) larger than the variance in fore-aft eye position. The effect on the backset analyses of ignoring the covariance of head length and head position is that the analyses are conservative. Slightly larger backsets than those calculated here would actually be needed to accommodate the specified percentages of occupants, but this potential discrepancy is within the range of precision of the estimates.


APPENDIX B
FIXED-SEAT EYELLIPSE MODEL
This appendix presents the fixed-seat eyellipse model developed at UMTRI that was included in a recent draft of SAE Recommended Practice J941. This procedure is not currentky an SAE standard, but may soon be adopted in some form. Although the analysis by which this model was developed has not yet been published, its development follows on work reported by Manary et al. (1998a). The report text contains more information on the developn~ent and application of the fixed-seat eyellipse to modeling head-to-head-restraint distances. Terminology not defined here is defined in SAE 51 100. Note that this is a draft procedure, and is subject to change.
Fixed seat eyellipses apply to seated positions with no H-Point or back angle adjustment. The eyellipse centroid is related to the fixed H-Point (SgRP) location. The only vehicle factor affecting location of the fixed seat eyellipse is the given seatback angle L40. Other seat contour adjustments are assumed fixed at the manufacturer's design specifications or at consistent nominal and/or unapplied settings. These eyellipses are based on NHANES I11 anthropometry, assuming a U.S. adult population with an even gender mix.

Zero Y Grid
0 C y d p a n Eyeiiipse Cenboid Lefl and Rihl Evelii~se Centroid
I - .
Plan View . .. . . . . - 0 - Lefi and Right Eye are 65 rnm Aparl
S ~ R P ~
Side View Rear View
Figure B1. Fixed seat eyellipse, side-view axis angle, and centroid location.
B.1 Axis Angles - The eyellipse is aligned with the vehicle axes in plan view (Z plane) and rear view (X plane), but it is tilted in side view (Y plane). The side-view angle of the eyellipse depends on the seat back angle* relative to the vertical. The axis angles in plan and rear view are both 0 degrees, but the side-view angle must be calculated. See Figure B 1.
B.1.1 Side-View Angle - The longer primary axis of the fixed-seat eyellipse is the z axis. This primary z axis is tilted back and on a line from the centroid to the H-Point called the "H-Point to eye path". This angle 6 is related to the fixed-seat back angle as defined in equation C 1. See Figure B 1.
where 6 is the side view eyellipse angle in degrees (tipped back at the top from vertical) and L the seatback angle.

*The dimension code for Seat Back Angle depends on the passenger seat posiltion under study; L40-2 BACK ANGLE - SECOND or L40-3 BACK ANGLE - THIRD as defined in SAE J1100.
B.2 Mean Male and Female H-Point-To-Eye Distances - These values must be calculated to determine axis lengths and centroid locations and are calculated from the mean statures and standard deviation of statures for the selected male and female population.
Equations B2 and B3 are used to calculate the needed H-Point-to-eye-distance.
[B2 and B3]
where SM and SF = mean population stature within gender (male or female), and h~ and h~ = mean hip-to-eye distance within gender (male or female).
B.3 Mean Male and Female H-Point-To-Eye Standard Deviations - The next !step is to calculate standard deviation of H-Point-to-eye distance for males and females;, according to Equation B4 and B5. The mean and standard deviation of H-Point-to- eye distance define the two overlapping normal distributions for males and females. These distributions lie along the primary axis (z') of the fixed-seat eyellipse and embody the way in which driver population anthropometry affects the locatialn and size (in the z' axis) of the fixed-seat eyellipse.
[B4 and B5]
where, oh; = standard deviation along zY-axis, and
o, = standard deviation of stature for gender, G
The steps so far are similar to the procedure used to construct the adjustable-seat eyellipse. The primary-axis length (in this case, the z' axis) is calculated by determining the cutoff values at the upper and lower ends of the distribution. To do this, the user must first calculate the cutoff percentiles for the distributions at each end. Equation B6 gives pu, the upper boundary, and Equation B7 gives pi, the lower boundary.

p~ = percentile of male distribution to use as cutoff percentile pi = percentile of female distribution to use as cutoff percentile k = proportion of males in population pt = target eyellipse percentile
The boundaries of the fixed-seat eyellipse in the z' axis are determined from the normal distributions for males and females, according to Equations B8 and B9. This procedure only works when the eyellipse percentile is relatively high (e.g., 95%) and the gender mix is near 50150.
where, hU is the upper boundary of hip-to-eye distance, and hl is the lower boundary of hip-to-eye distance
B.4 Centroid Location - The centroid of the fixed-seat eyellipse is the mid-point between the two H-Point-to-eye boundary points, along the primary axis and at the seat centerline. Equations ClOa through ClOc give the centroid location relative to SgRP in the vehicle axis system.
x, = (hu + 4 sin a
2
2, = (hu + hl) cosa
2
[B 1 Oa]
[B 1 Ob]
[B lob]
B.5 Axis Lengths - Having determined the axis angles and the centroid location, the remaining task is to determine the three axis lengths. The length of the primary axis (z') is the difference between the upper and lower boundaries of hip-to-eye distance (Equation B 1 1).

The length of the x' axis (perpendicular to z' in side view) depends on the variability in the hip-to-eye angle relative to vertical. The side-view angle, 6, is the mean hip-to- eye angle. Hip-to-eye angle is distributed normally with a standard deviation of 2.7 degrees. Thus, boundary angles can be computed using the normal distribution with mean a and standard deviation 2.7. A radius at each boundary angle with length equal to the mean hip-to-eye distance will end at the x'-axis boundary of the fixed- seat eyellipse. These radii are shown in Figure 1 as ru and rl, and the distance: between their endpoints is the x'-axis length. This length is very close to the :length of the arc between the endpoints, a value that can be calculated easily by multiplying the angle between the radii (in radians) by the radius length (the mean hip-to-eye distance). The procedure described in this paragraph is expressed mathematic:ally in Equation B 12.
Finally, the y axis in the fixed-seat eyellipse is the same as in the adjustable-seat eyellipse. Eye location along the y axis is modeled as a normal distribution with a fixed standard deviation of 18.23 mm, regardless of population anthropometry. Thus, Equation B 13 gives the y-axis length as a function of eyellipse target percentile.
These equations define the parameters of the fixed-seat eyellipse for any driver population anthropometry. The shape of the eyellipse is the same across vehi~cles (for the same driver population) except for small differences in angle as a functio~n of back angle. The fixed-seat eyellipse is expressed relative to SgRP rather than pedal reference points, as with the adjustable-seat eyellipse, because only the location of the h-point is relevant if the seat and seatback cannot be adjusted.


APPENDIX C
CALCULATING AN APPROXIMATING NORMAL DISTRIBUTION FOR A MIXTURE OF TWO NORMALS
Many human anthropometric dimensions are approximately normally distributed within gender, but there are often substantial differences in mean between men and women. An anthropmetric distribution from a population containing both men and women is best modeled as a mixture of two normal distributions. Appendix B used this approach to create a cutoff ellipse describing passenger eye locations.
Although it is less accurate than carrying the two single-gender normal distributions through the analysis, a reasonable normal approximation to a mixture of normals can be created when the difference between the means is not substantially larger than the standard deviation of the contributing normals.
This is the case for seatback angle and eye location. Across the five vehicles in Table 1, vertical driver eye location with respect to H-point is a function of stature given by the regression function
EyeZ = 135 + 0.2914 Stature + N(O,21.2)
with R~ = 0.74 and root-mean-square error (RMSE) = 21.2. Under the assumptions of linear regression, the residual variance not accounted for by the regression function is mode:led by a normal distribution with zero mean and standard deviation equal to RMSE.
Assuming that stature within gender is normally distributed, EyeZ is a linear functioni of a normal distribution plus another independent normal distribution (residual error). The standard deviation of EyeZ is given by
s,,, = ((0.2914)2 (s,)~ + (21 .2)2)'"
where s, is the single-gender standard deviation of stature. The mean value of EyeZ is obtained by evaluating the regression function at the mean stature.
Using data from NHANES 111, mean statures for U.S. men and women are 1755 mm and 1618 mm, respectively. Male and female standard deviations are approximately 74.2 mm and 68.7 mm, respectively. Using these values, vertical eye position for men is distributed normally with mean 646 mm and standard deviation 30.3 mm. For women, the mean is 606 mm and the standard deviation is 29.2 mm. The gender difference in eye height is about 30 percent larger than the within-gender standard deviation.
For many anthropometric analyses, only the tails of the distribution are of interest. This is the case with vertical eye (head) height, used in this analysis to calculate appropriate head

restraint heights. A single normal distribution can be chosen such that a particular pair of percentiles exactly matches the mixture of male and female normals. For the eye height analysis, the targets are the 5th and 95th percentiles. The 95th percentile of the even mixture of male and female normal distributions must be solved iteratively. For the current distributions, the 95th percentile of the combined male-female distribution is 685 mm and the 5th percentile is 568 mm. (A simplified approach that works reasonably well for distributions that are fairly well separated is to assume that there are no women in the upper tail and no men in the lower tail. The 95th percentile of the mixture distribution is then the 90th percentile of the male distribution and the 5th percentile of the mixture is the 10th percentile of the female distribution. In this case, the 5th and 95th percentiles that would be estimated using this assumption are within a millimeter of the values calculated using the more general iterative approach.)
The difference between the 5th and 95th percentiles of the mixture distribution is 117 mm. Dividing this difference by twice the 95th percentile of the standard normal distribution (1.645) gives 35.6 mm as the standard deviation of the approximating single normal distribution. The mean is simply the average of the male and female means, which is 627 mm. Figure C1 shows the approximating normal distribution along with the male and female normal distributions. The single normal is an excellent approximation to the normal mixture for percentiles near the target percentiles. With the vertical eye location distribution, the error is less than one millimeter over the range from 90th to 99th percentile.
Female Distribution Male Distribution
Single Normal Approximating Mixture Mixture Distributio
5th 50th 95th - Percentiles of Mixture and
Eye Height (mm) Approximating Single Normal
Figure C1. Single normal distribution approximating the mixture of two single-gender normal distributions, using the example of eye height. Plotted curves are probability density functions (area under each curve is equal).