Modeling Tools for SOFC Design and Analysis Library/Events/2011/seca/thu-am... · Modeling Tools...
22
Modeling Tools for SOFC Design and Analysis Moe A Khaleel Brian Koeppel, Kurt Recknagle, Xin Sun, Elizabeth Stephens, Kevin Lai, Emily Ryan Pacific Northwest National Laboratory Richland, WA 99352 12 th Annual SECA Workshop Pittsburgh, PA July 28, 2011 1
Transcript of Modeling Tools for SOFC Design and Analysis Library/Events/2011/seca/thu-am... · Modeling Tools...
Modeling Tools for SOFC Design and Analysis
Moe A Khaleel
Brian Koeppel, Kurt Recknagle, Xin Sun, Elizabeth Stephens, Kevin Lai, Emily Ryan
Pacific Northwest National Laboratory
Richland, WA 99352
12th Annual SECA Workshop
Pittsburgh, PA
July 28, 2011
1
PNNL Modeling Activities: Objectives & Approach
Objectives
Develop integrated modeling tools to: Evaluate the tightly coupled multi-physical phenomena in SOFCs
Allow SOFC designers to perform numerical experiments for evaluation of stack electrochemical, thermal, and mechanical performance
Aid understanding of materials degradation issues
Provide wide applicability for industry teams’ to solve their challenging design problems
Provide technical basis for stack design
Approach: Multiphysics-based analysis tools
SOFC-MP: A multi-physics solver for computing the coupled flow-thermal-electrochemical response of multi-cell SOFC stacks
Distributed Electrochemistry (DEC) model – Cell level multi-physics model for considering the effects of local properties and conditions on global SOFC performance
Targeted evaluation tools for specific cell design challenges
Experimental support to provide material property data
2
PNNL Modeling Tools: Overview
SOFC-MP
2D and 3D multi-physics stack model
2D model benchmarked with literature data
Distributed Electrochemistry (DEC) Model
3D multi-physics model of the SOFC electrodes and electrolyte for the investigation of SOFC performance and degradation issues
Degradation modeling framework
Cathode Contact Paste Modeling
FEA model for the simulation of densification behavior in cathode contact materials
Glass Seal Modeling
Investigate the behavior of glass seal materials and designs at operating temperatures
Interconnect Modeling
Integrated modeling and experimental approach for prediction on interconnect lifetime
3
SOFC-MP: Multi-Physics Stack Modeling Tool
4
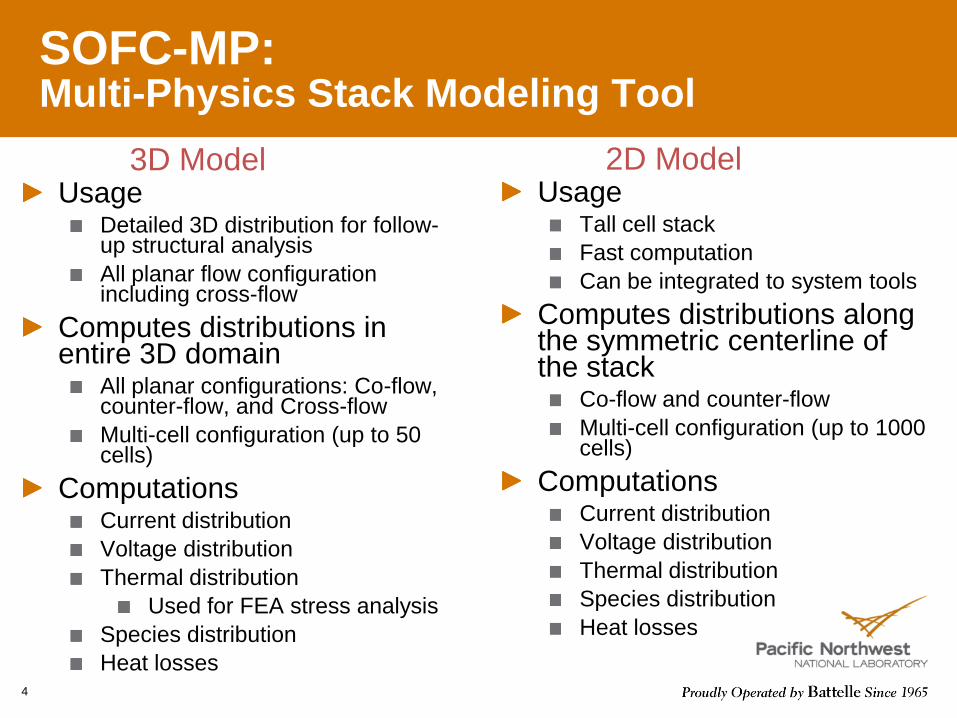
UsageDetailed 3D distribution for follow-up structural analysis
All planar flow configuration including cross-flow
Computes distributions in entire 3D domain
All planar configurations: Co-flow, counter-flow, and Cross-flow
Multi-cell configuration (up to 50 cells)
ComputationsCurrent distribution
Voltage distribution
Thermal distribution
Used for FEA stress analysis
Species distribution
Heat losses
UsageTall cell stack
Fast computation
Can be integrated to system tools
Computes distributions along the symmetric centerline of the stack
Co-flow and counter-flow
Multi-cell configuration (up to 1000 cells)
ComputationsCurrent distribution
Voltage distribution
Thermal distribution
Species distribution
Heat losses
3D Model 2D Model
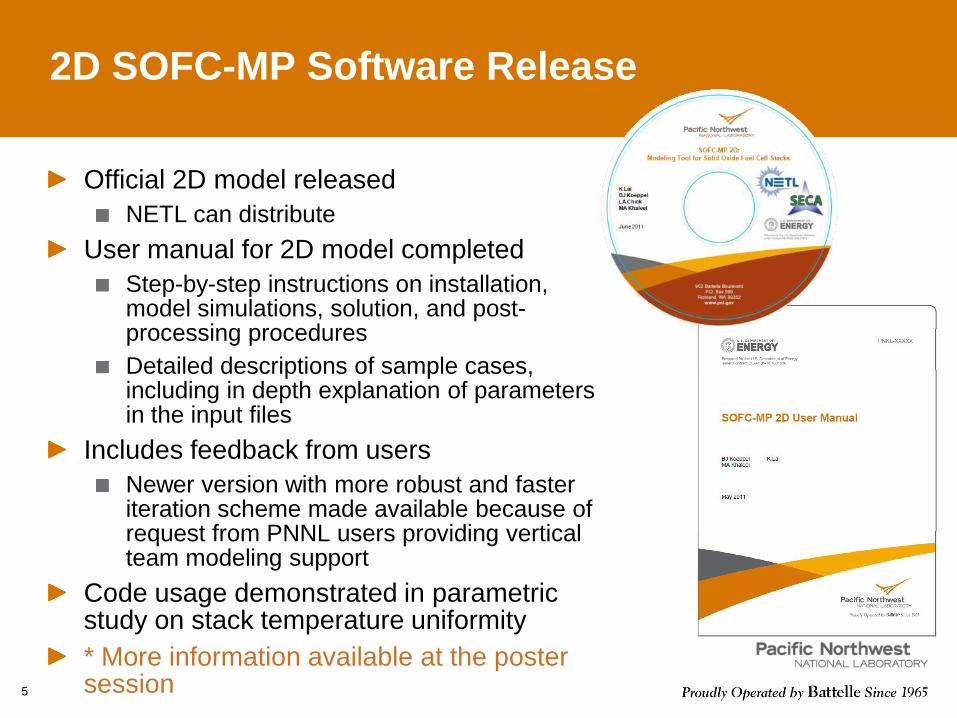
2D SOFC-MP Software Release
Official 2D model released
NETL can distribute
User manual for 2D model completed
Step-by-step instructions on installation, model simulations, solution, and post-processing procedures
Detailed descriptions of sample cases, including in depth explanation of parameters in the input files
Includes feedback from users
Newer version with more robust and faster iteration scheme made available because of request from PNNL users providing vertical team modeling support
Code usage demonstrated in parametric study on stack temperature uniformity
* More information available at the poster session5
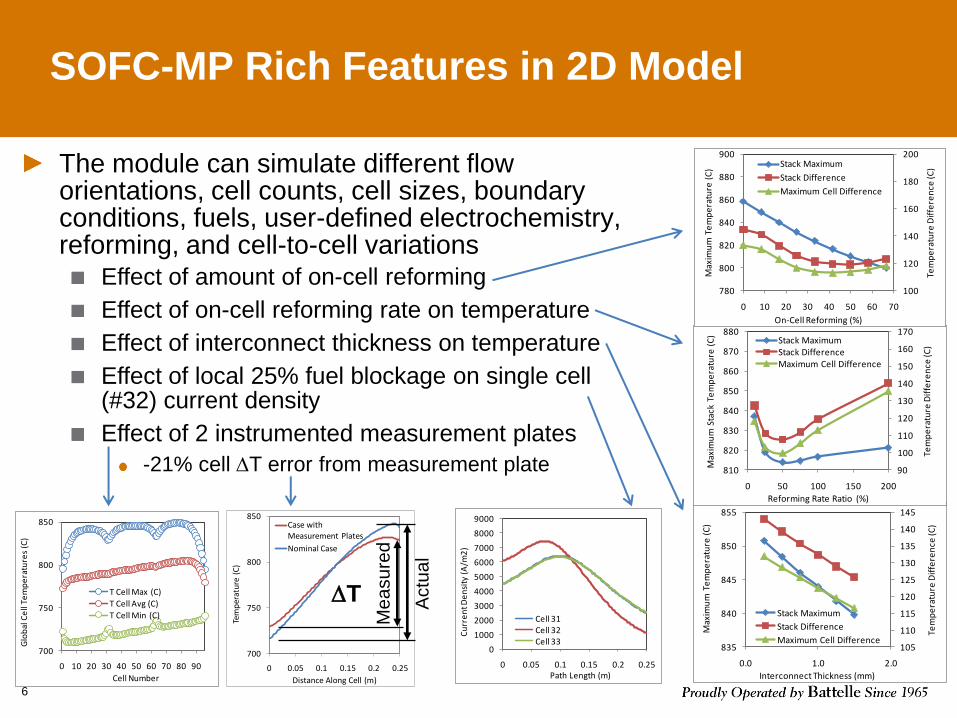
SOFC-MP Rich Features in 2D Model
6
The module can simulate different flow orientations, cell counts, cell sizes, boundary conditions, fuels, user-defined electrochemistry, reforming, and cell-to-cell variations
0
1000
2000
3000
4000
5000
6000
7000
8000
9000
0 0.05 0.1 0.15 0.2 0.25
Cu
rre
nt D
en
sity
(A
/m2
)
Path Length (m)
Cell 31Cell 32Cell 33
700
750
800
850
0 10 20 30 40 50 60 70 80 90
Glo
bal
Ce
ll Te
mp
era
ture
s (C
)
Cell Number
T Cell Max (C)
T Cell Avg (C)
T Cell Min (C)
700
750
800
850
0 0.05 0.1 0.15 0.2 0.25
Tem
per
atu
re (
C)
Distance Along Cell (m)
Case with Measurement Plates
Nominal Case
Me
asu
red
Actu
al
DT
105
110
115
120
125
130
135
140
145
835
840
845
850
855
0.0 1.0 2.0
Tem
pe
ratu
re D
iffe
ren
ce (C
)
Max
imu
m T
em
pe
ratu
re (
C)
Interconnect Thickness (mm)
Stack Maximum
Stack Difference
Maximum Cell Difference
90
100
110
120
130
140
150
160
170
810
820
830
840
850
860
870
880
0 50 100 150 200
Tem
pe
ratu
re D
iffe
ren
ce (C
)
Max
imu
m S
tack
Te
mp
era
ture
(C
)
Reforming Rate Ratio (%)
Stack MaximumStack DifferenceMaximum Cell Difference
100
120
140
160
180
200
780
800
820
840
860
880
900
0 10 20 30 40 50 60 70
Tem
pe
ratu
re D
iffe
ren
ce (C
)
Max
imu
m T
em
pe
ratu
re (
C)
On-Cell Reforming (%)
Stack Maximum
Stack Difference
Maximum Cell Difference
Effect of amount of on-cell reforming
Effect of on-cell reforming rate on temperature
Effect of interconnect thickness on temperature
Effect of local 25% fuel blockage on single cell (#32) current density
Effect of 2 instrumented measurement plates
-21% cell DT error from measurement plate

Distributed Electrochemistry (DEC) Model: Modeling SOFC Performance
Understand degradation in the electrodes
Resolve local conditions in the cell resulting from various operating conditions
Investigate the effect of microstructure on cell performance
Confidently predict global cell performance for a range of conditions
Increase performance by advanced electrode design
ObjectivesTechnology Challenges
Develop a model to predict cell performance based on operating conditions and microstructure
Base the performance model on coupled electric potential, charge transfer, and reactive transport
Use a modeling approach that enables varying structural parameters
Validate the model by comparison with experimental data
Simulate microstructural and operational effects on cell performance
7

DEC Model: Recent Accomplishments
Developed a 3D multi-physics model of the SOFC electrodes and electrolyte
Resolves the electrochemistry throughout the electrode thickness
Predicts the global SOFC performance based on local conditions within the electrodes
Includes electrode microstructures via an effective properties model
Allows for spatially varying microstructural and electrochemical properties
Validated the DEC model with experimental button cell data at various fuel compositions and operating voltages
Demonstrated the DEC model’s capabilities to investigate the effects of electrode microstructure on SOFC performance
Developed a degradation modeling framework for considering the effects of local degradation within the electrodes on the overall SOFC performance
* More information available at poster session
8
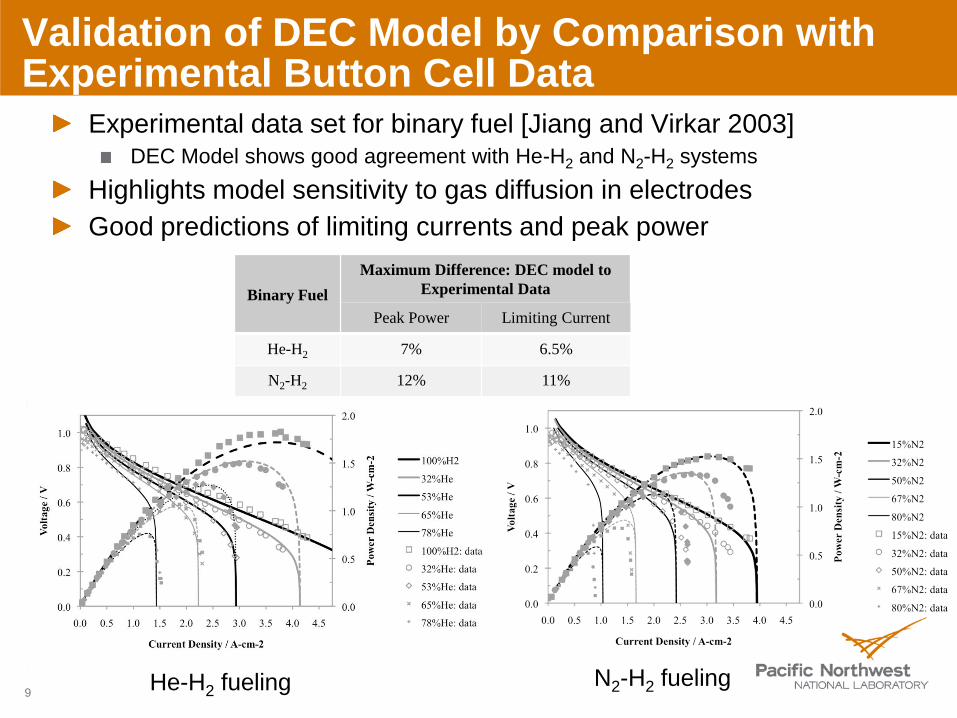
Validation of DEC Model by Comparison with Experimental Button Cell Data
Experimental data set for binary fuel [Jiang and Virkar 2003]DEC Model shows good agreement with He-H2 and N2-H2 systems
Highlights model sensitivity to gas diffusion in electrodes
Good predictions of limiting currents and peak power
He-H2 fueling N2-H2 fueling9
Binary Fuel
Maximum Difference: DEC model to
Experimental Data
Peak Power Limiting Current
He-H2 7% 6.5%
N2-H2 12% 11%
Degradation and Life Prediction of Coated Metallic Interconnects Summary
Motivation: Ensure IC life meets the SECA life time requirement
Goal: Use modeling to predict interconnect life with and without spinel coating under isothermal cooling and thermal cycling
Technical Approach: Develop a combined modeling/experimental approach to enhance spallation resistance; use finite element based modeling tools to evaluate various design issues on spallation driving forces and determine the main factors influencing IC degradation in terms of spallation; and evaluate IC candidate materials
Accomplishments:
Developed an integrated modeling and experimental approach for IC life prediction:
Identified and quantified spallation driving forces
Quantified interfacial strength
IC life prediction for coated and uncoated Crofer 22
Interfacial strength quantification for as-received and surface modified SS441
10
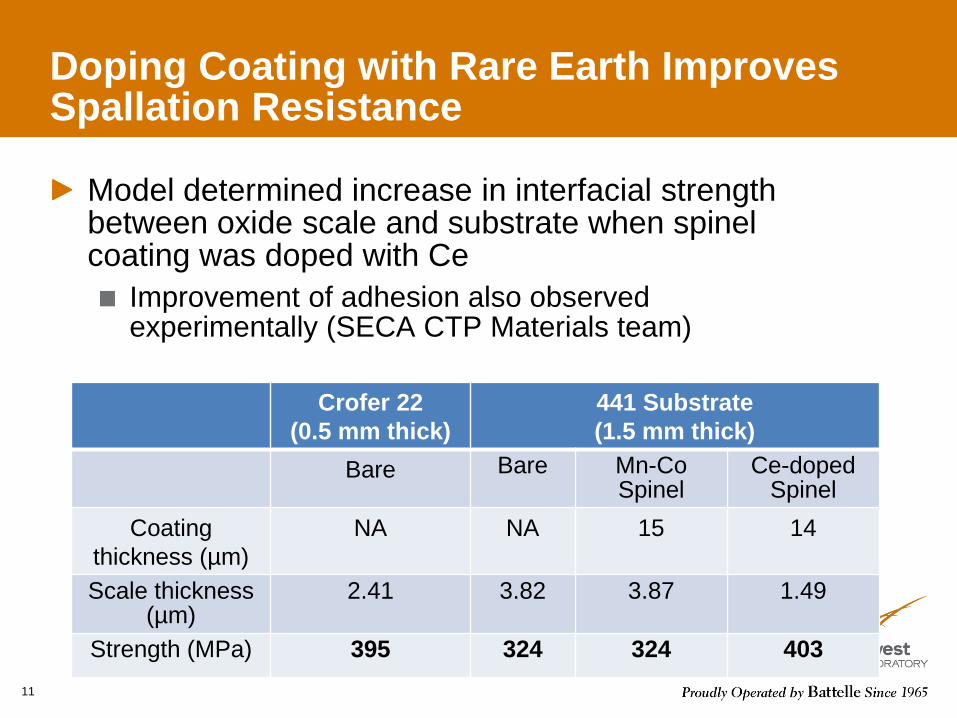
Doping Coating with Rare Earth Improves Spallation Resistance
Model determined increase in interfacial strength between oxide scale and substrate when spinel coating was doped with Ce
Improvement of adhesion also observed experimentally (SECA CTP Materials team)
11
Crofer 22
(0.5 mm thick)
441 Substrate
(1.5 mm thick)
Bare Bare Mn-Co Spinel
Ce-doped Spinel
Coating
thickness (µm)
NA NA 15 14
Scale thickness (µm)
2.41 3.82 3.87 1.49
Strength (MPa) 395 324 324 403
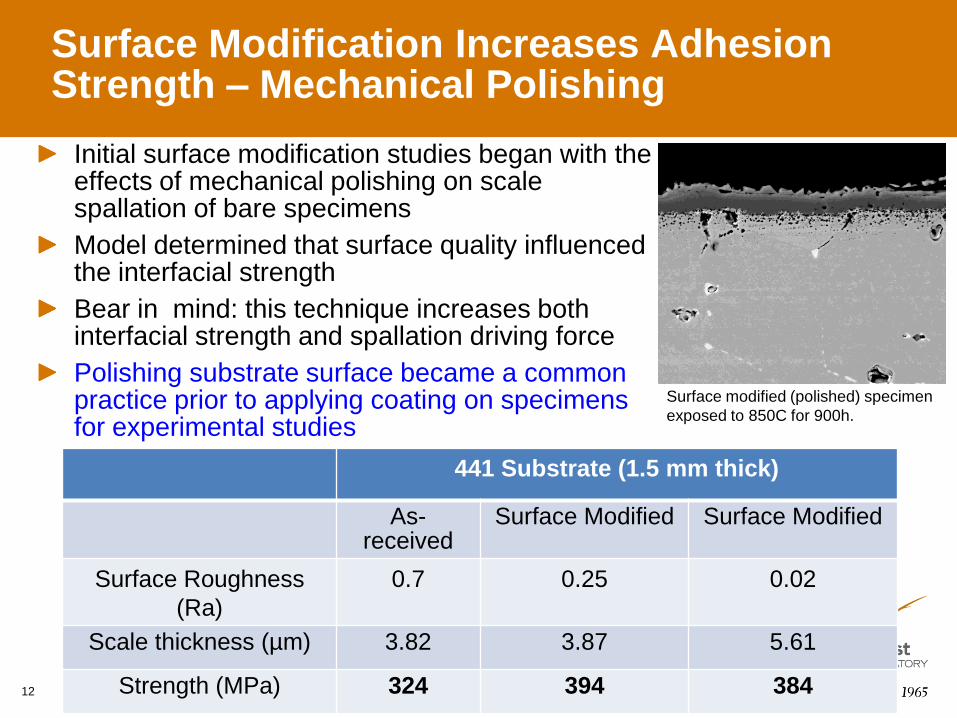
Surface Modification Increases Adhesion Strength – Mechanical Polishing
Initial surface modification studies began with the effects of mechanical polishing on scale spallation of bare specimens
Model determined that surface quality influenced the interfacial strength
Bear in mind: this technique increases both interfacial strength and spallation driving force
Polishing substrate surface became a common practice prior to applying coating on specimens for experimental studies
12
441 Substrate (1.5 mm thick)
As-received
Surface Modified Surface Modified
Surface Roughness
(Ra)
0.7 0.25 0.02
Scale thickness (µm) 3.82 3.87 5.61
Strength (MPa) 324 394 384
Surface modified (polished) specimen
exposed to 850C for 900h.
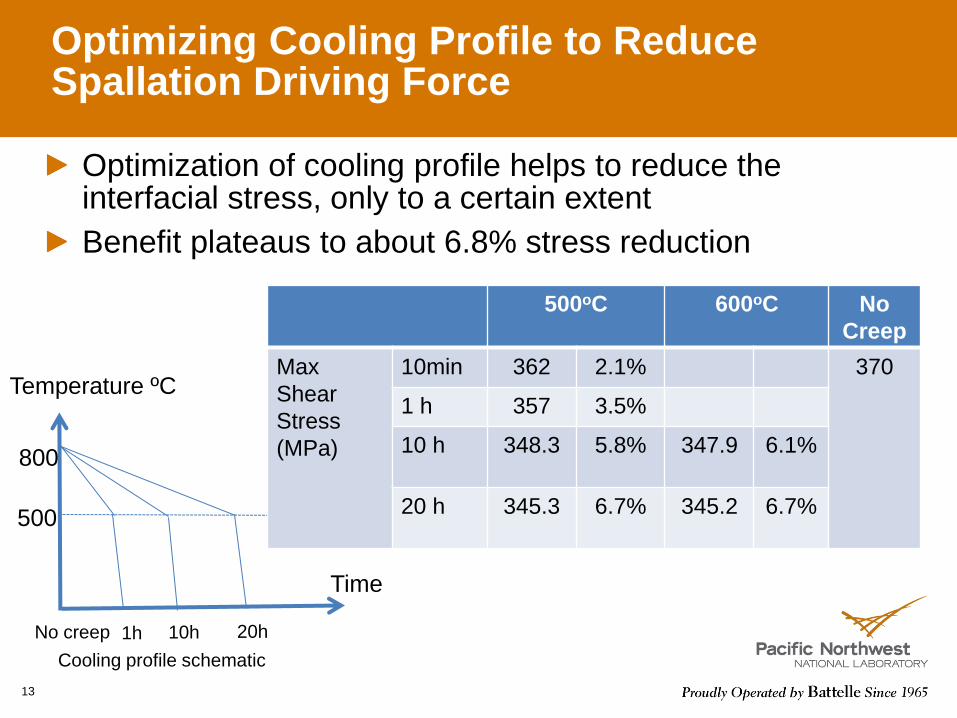
Optimizing Cooling Profile to Reduce Spallation Driving Force
Optimization of cooling profile helps to reduce the interfacial stress, only to a certain extent
Benefit plateaus to about 6.8% stress reduction
13
800
500
Temperature ºC
Time
No creep 1h 10h 20h
500oC 600oC No
Creep
Max
Shear
Stress
(MPa)
10min 362 2.1% 370
1 h 357 3.5%
10 h 348.3 5.8% 347.9 6.1%
20 h 345.3 6.7% 345.2 6.7%
Cooling profile schematic
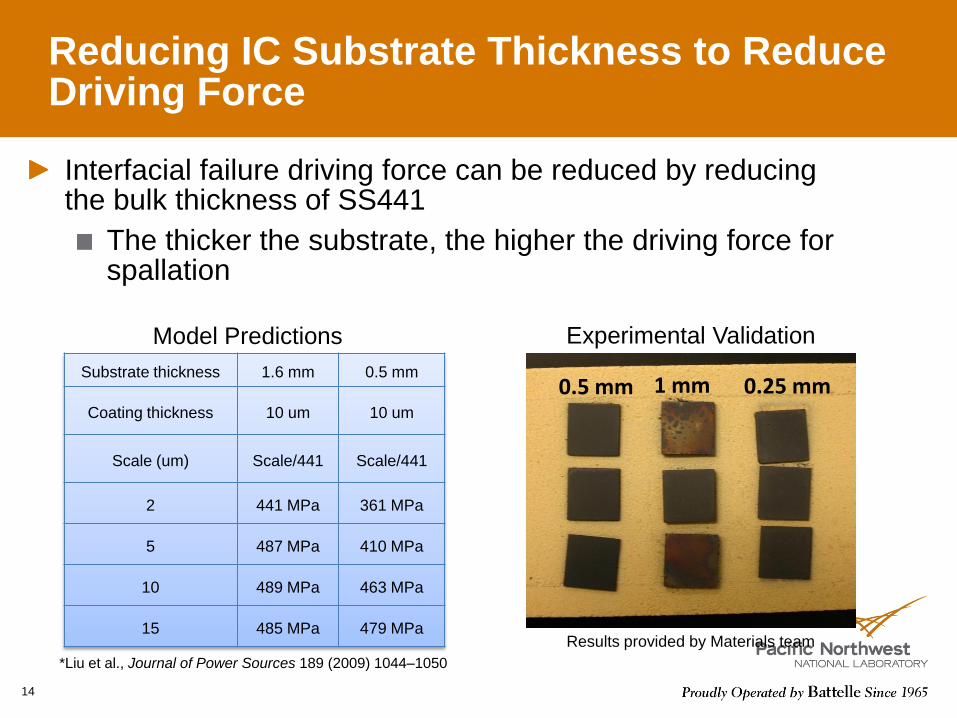
Reducing IC Substrate Thickness to Reduce Driving Force
Interfacial failure driving force can be reduced by reducing the bulk thickness of SS441
The thicker the substrate, the higher the driving force for spallation
14
Substrate thickness 1.6 mm 0.5 mm
Coating thickness 10 um 10 um
Scale (um) Scale/441 Scale/441
2 441 MPa 361 MPa
5 487 MPa 410 MPa
10 489 MPa 463 MPa
15 485 MPa 479 MPa
0.5 mm 1 mm 0.25 mm
Model Predictions Experimental Validation
Results provided by Materials team
*Liu et al., Journal of Power Sources 189 (2009) 1044–1050
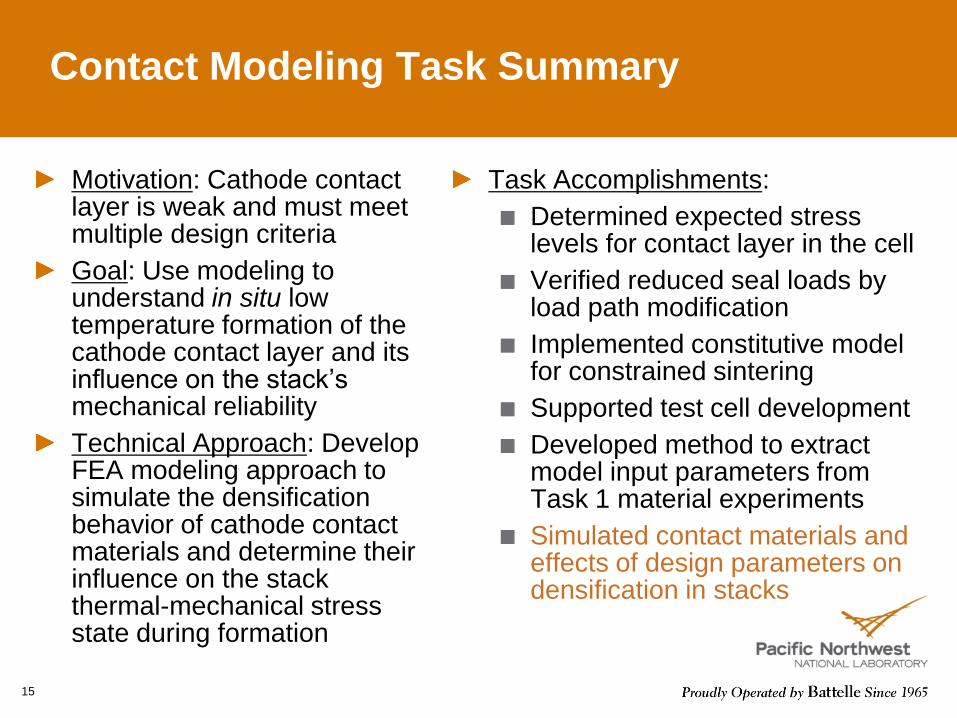
Contact Modeling Task Summary
Motivation: Cathode contact layer is weak and must meet multiple design criteria
Goal: Use modeling to understand in situ low temperature formation of the cathode contact layer and its influence on the stack’s mechanical reliability
Technical Approach: Develop FEA modeling approach to simulate the densification behavior of cathode contact materials and determine their influence on the stack thermal-mechanical stress state during formation
Task Accomplishments:
Determined expected stress levels for contact layer in the cell
Verified reduced seal loads by load path modification
Implemented constitutive model for constrained sintering
Supported test cell development
Developed method to extract model input parameters from Task 1 material experiments
Simulated contact materials and effects of design parameters on densification in stacks
15
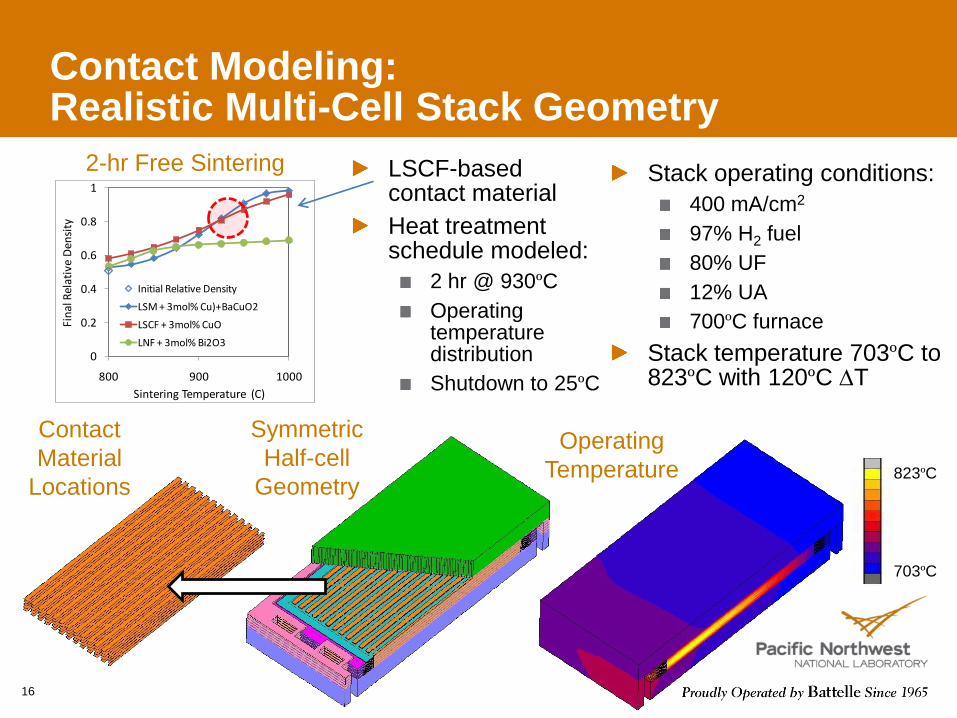
Contact Modeling:Realistic Multi-Cell Stack Geometry
LSCF-based contact material
Heat treatment schedule modeled:
2 hr @ 930ºC
Operating temperature distribution
Shutdown to 25ºC
16
Contact
Material
Locations
Symmetric
Half-cell
Geometry
Operating
Temperature
703ºC
823ºC
Stack operating conditions:
400 mA/cm2
97% H2 fuel
80% UF
12% UA
700ºC furnace
Stack temperature 703ºC to 823ºC with 120ºC DT
0
0.2
0.4
0.6
0.8
1
800 900 1000
Fin
al R
elat
ive
Den
sity
Sintering Temperature (C)
Initial Relative Density
LSM + 3mol% Cu)+BaCuO2
LSCF + 3mol% CuO
LNF + 3mol% Bi2O3
2-hr Free Sintering

Contact Modeling: Smaller Initial Grain Size Improves Density
Densification with nominal 0.4 mm grain inadequate
Maximum density only 72%
Distribution non-uniform across the cell
Corners and edges restricted by stiff surrounding frame; relative spring stiffness between frame and active area will be critical design parameter
Grain size < 0.5 mm substantially improved density but geometry influence remained
17
0.1
Rela
tive D
ensity
0.98
0.52
15
MPa Good
Fail
Initial
Grain
Size
(mm)
Max
Final
Density
1.0 59%
0.7 63%
0.4 72%
0.2 91%
0.1 98%
0.2 0.4 0.7 1.0
ShutdownOperationEnd of
Sintering
Str
ess
-20
-10
0
10
20
30
40
50
60
70
0 0.05 0.1 0.15 0.2 0.25
Co
nta
ct L
ayer
Str
ess
(MP
a)
Path Length (m)
IC Interface
Cathode Interface
Acceptable Stress Range
Contact Interface Stress

Seal Materials Modeling:Task Summary
Motivation: To explore the behavior of seal materials at operating temperatures and better understand the interplay of material microstructure and properties on stresses and degradation
Goal: Use modeling to assist the development of a reliable sealing system to achieve the stack-level design requirements
Technical Approach: Develop time and temperature dependent seal models to use as building blocks in stack-level seal performance simulations and investigate the effects of various design parameters on multi-cell stacks
18
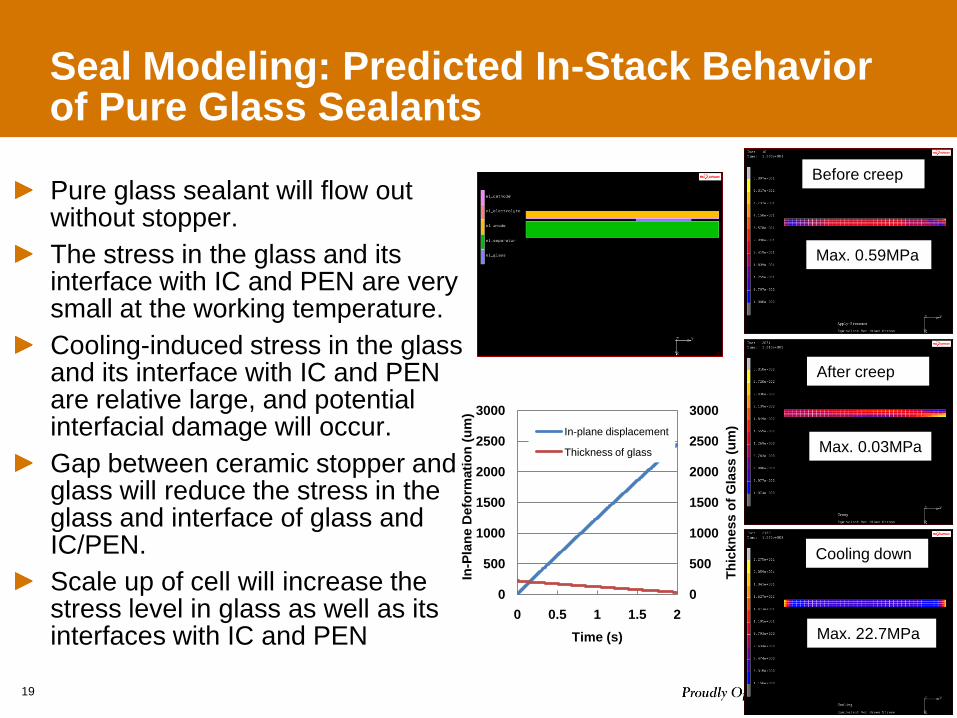
Pure glass sealant will flow out without stopper.
The stress in the glass and its interface with IC and PEN are very small at the working temperature.
Cooling-induced stress in the glass and its interface with IC and PEN are relative large, and potential interfacial damage will occur.
Gap between ceramic stopper and glass will reduce the stress in the glass and interface of glass and IC/PEN.
Scale up of cell will increase the stress level in glass as well as its interfaces with IC and PEN
19
Max. 22.7MPa
Max. 0.03MPa
Max. 0.59MPa
After creep
Before creep
Cooling down
0
500
1000
1500
2000
2500
3000
0
500
1000
1500
2000
2500
3000
0 0.5 1 1.5 2
Th
ickn
ess o
f G
lass (
um
)
In-P
lan
e D
efo
rmati
on
(u
m)
Time (s)
In-plane displacement
Thickness of glass
Seal Modeling: Predicted In-Stack Behavior of Pure Glass Sealants
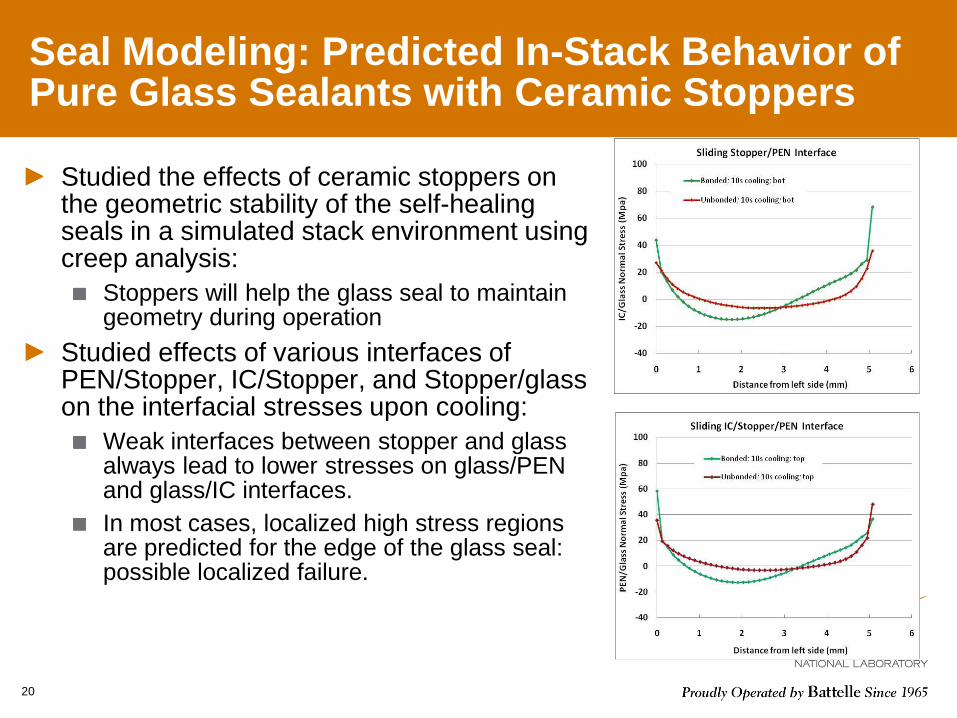
Studied the effects of ceramic stoppers on the geometric stability of the self-healing seals in a simulated stack environment using creep analysis:
Stoppers will help the glass seal to maintain geometry during operation
Studied effects of various interfaces of PEN/Stopper, IC/Stopper, and Stopper/glass on the interfacial stresses upon cooling:
Weak interfaces between stopper and glass always lead to lower stresses on glass/PEN and glass/IC interfaces.
In most cases, localized high stress regions are predicted for the edge of the glass seal: possible localized failure.
20
Seal Modeling: Predicted In-Stack Behavior of Pure Glass Sealants with Ceramic Stoppers
PNNL Modeling Summary
SOFC-MP: 2D and 3D multi-physics stack models
2D Software and manual released
DEC Model: 3D multi-physics cell model
Resolves the local conditions within the cell and predicts SOFC global performance from cell level electrochemistry
Contact Modeling: Continuum sintering model suitable for stack modeling
Good free sintering densification of candidate materials possible for T<1000ºC
Reduced initial grain size improved densification with only a small negative impact on predicted stresses at operation and shutdown
Interconnect Modeling and Experimentation: Integrated modeling and experimental approach for IC life prediction
Spallation resistance can be improved by increasing the interfacial strength between the oxide scale and substrate
Spallation driving force can be reduced through cooling profile optimization and by reducing IC thickness
Seal Modeling:
Predicted the outflow pattern for pure glass seal with different initial glass height (volume) in PNNL leak test setup
Studied the possible self-healing mechanisms/driving forces for glass seal:
Role of pressure on crack healing rate
Role of gravity on healing rate for thin glass seal21
Current/Future Modeling Activities
Simulation of long-term and transient degradation behaviors
DEC Model: Implement secondary reactions (degradation)
SOFC-MP: Include transient degradation of state variables & coupling to DEC model
Improved accessibility to software tools
Transfer DEC model to open source tool (e.g. OpenFoam)
Transfer SOFC-MP to a more flexible framework for interface with FEA solvers beyond MSC MARC
Contact Modeling:
Identify/test a specimen configuration for validation of constrained sintering simulations
Adapt model to other volumetric behaviors in the stack (e.g. anode reduction, seal formation, re-oxidation tolerance)
Interconnect Modeling:
Quantification of interfacial strength for varying surface modified SS441
Life prediction for coated and surface modified SS441
Seal Modeling:
Continue to quantify the self-healing mechanisms for SCN glass and develop temperature dependent constitutive models for SCN glass considering aging/ crystallization
Use modeling tools to virtually examine the various concepts of engineering seal design with glass/stopper sealing system in multi-cell stack
22