AN INTEGRATED APPROACH TO MODELING AND … Library/Research/Coal/energy systems...AN INTEGRATED...
34
AN INTEGRATED APPROACH TO MODELING AND MITIGATING SOFC FAILURE Andrei Fedorov, Comas Haynes, Jianmin Qu Georgia Institute of Technology DE-AC26-02NT41571 Program Manager: Donald Collins, National Energy Technology Laboratory
Transcript of AN INTEGRATED APPROACH TO MODELING AND … Library/Research/Coal/energy systems...AN INTEGRATED...

AN INTEGRATED APPROACH TO MODELING AND MITIGATING SOFC FAILURE
Andrei Fedorov, Comas Haynes, Jianmin QuGeorgia Institute of Technology
DE-AC26-02NT41571Program Manager: Donald Collins, National Energy Technology Laboratory

Project Overview
Electrochemical Reaction
Thermal Transport
Failure
Fracture
CellPerformance
Thermomechanical Damage
Phase I is a one-year effort to investigate and evaluate the feasibility of the solution proposed and/or the merits of the scientific path of inquiry.
Phase II will seek to mature the science and technology developed to a sufficient level that it can be utilized by the SECA Industry Teams.

Technical Issues to be Addressed
Thermomechanical Damage and FailureThermal stresses due to thermal mismatchDelamination and fracture due to thermal mismatch and thermal shockWarpage due to thermal mismatchSeal reliability
Thermal Transport Flow, heat and reagent species transport in porous mediaThermal radiation heat transfer in porous mediaCoupling between radiation heat transfer and other modes of heat transferSource/sink terms for transport equations due to electrochemical reactions
ElectrochemistryCell and stack level engineering modelsInterdependency between electrochemistry and thermal/mass transport Transient processes and failure modes

Electrochemistry

Model Objectives Achieved
Ø Engineering Code§ Accurate and viable
§ Customized structural-language algorithms that are portable to software
§ Enhanced designer insight via graphically intuitive trends
ØComplement to SECA DOE National Labs’ Efforts§ Resolution of reformate stream analysis (NETL)
§ Automated convergence upon set fuel utilization (PNNL)
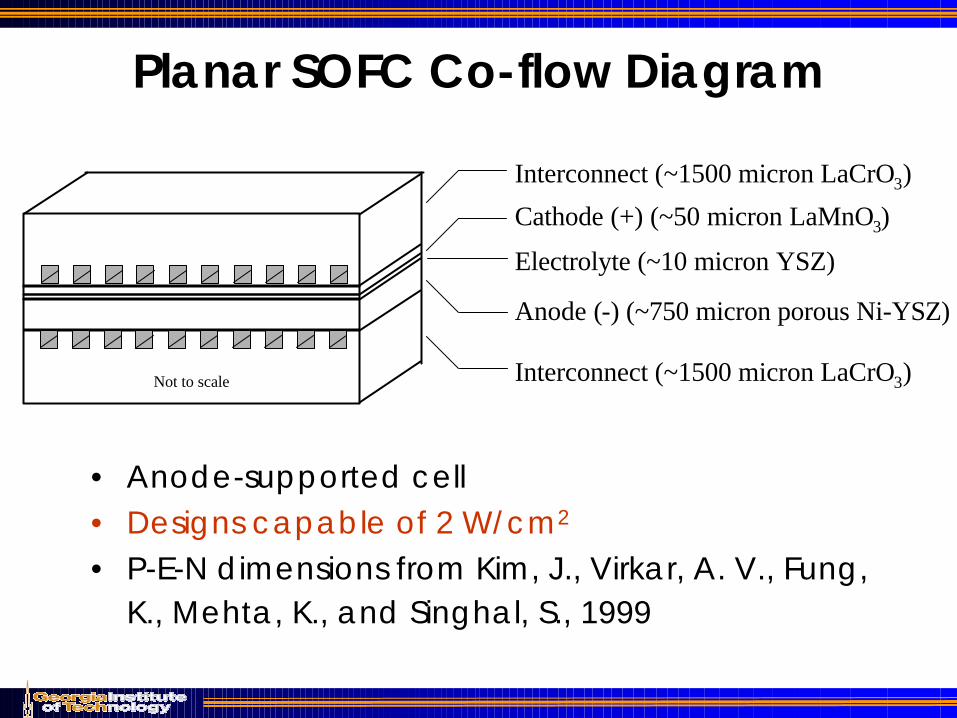
• Anode-supported cell• Designs capable of 2 W/cm2
• P-E-N dimensions from Kim, J., Virkar, A. V., Fung, K., Mehta, K., and Singhal, S., 1999
Interconnect (~1500 micron LaCrO3)
Anode (-) (~750 micron porous Ni-YSZ)
Electrolyte (~10 micron YSZ)
Cathode (+) (~50 micron LaMnO3)
Interconnect (~1500 micron LaCrO3)Not to scale
Planar SOFC Co-flow Diagram

Planar SOFC Co-flow Model
Pressure(n)=f(xi, Po)PH2 PH2O PCO PCO2 PCH4
Pressure(n)=f(xi, Po)PO2 PN2
Pressure(n+1)=f(xi, Po)PH2 PH2O PCO PCO2 PCH4
Pressure(n+1)=f(xi, Po)PO2 PN2
Flow rates(n)=f(Pi, Qfuel, i(n))NH2 NH2O NCO NCO2 NCH4 Ntotal
Flow rates(n)=f(NOS, Ntotal)NO2 NN2
Flow rates(n+1)=f(P i, Qfuel , i(n))NH2 NH2O NCO NCO2NCH4 Ntotal
Flow rates(n+1)=f(NOS, Ntotal)NO2 NN2
Temperature(n)=f(Q(i)) Temperature(n+1)=f(Q(i))
i(n)
i(n)
nO2
Ano
dech
anne
lC
atho
dech
anne
l
1 2 3 n
Air
Fuel
L
( )
+−
−+−−−=
asOH
Ho ip
ip
FRTi
FRT
iiEiVo
o
2
21ln2
1ln2
lnas
ii
baR
Electrochemical model is a combination of the polarization model of Kim et al. (1999) and Haynes’ slice technique (Haynes and Wepfer, 1999)

Planar SOFC Co-flow Model Validation• Model agrees with experimental data• Discrepancies, primarily differences in fuel
utilization, caused by comparing a button cell to a much larger channel model
0
0.2
0.4
0.6
0.8
1
0 1 2 3 4 5 6
Current Density [A/cm2]
Vol
tage
[V]
Model Experimental

• Assumptions– Isothermal channels as a design goal– Convection to air stream is the dominant form of cell
thermal management– Laminar, hydrodynamically fully developed flow at the
leading edge due to extensive manifolding • Methodology
– Use well-regarded laminar flow Nusselt correlations for airflow within rectangular ducts, to determine appropriate inlet air temperatures and resulting cell temperature profile
– Vary parameters as required to determine impact• Voltage• Fuel utilization• Fuel-based inverse equivalence ratio / “number of
stoichs” (NOS)
Thermal Model for Cells

Promoting Isothermal Cells
100010501100115012001250130013501400
0 0.1 0.2 0.3 0.4 0.5 0.6 0.7 0.8 0.9 1
Cell Distance [dimensionless]
Tem
pera
ture
[K]
Base Best
∆Τ = 39
∆Τ = 270
FU=0.3, Vop=0.9, and NOS=81000
1100
1200
1300
1400
1500
1600
0 0.1 0.2 0.3 0.4 0.5 0.6 0.7 0.8 0.9 1
Cell Distance [dimensionless]
Tem
pera
ture
[K]
Base FU = 0.3 FU = 0.9
∆Τ = 270∆Τ = 391
∆Τ = 142
1000
1100
1200
1300
1400
1500
1600
1700
0 0.1 0.2 0.3 0.4 0.5 0.6 0.7 0.8 0.9 1Cell Distance [dimensionless]
Tem
pera
ture
[K]
Base NOS = 2 NOS = 8
∆Τ = 270∆Τ = 135
∆Τ = 527
↑ Vop ↑ NOS
↓ Fuel UtilizationBest Case
1000
1100
1200
1300
1400
1500
1600
0 0.1 0.2 0.3 0.4 0.5 0.6 0.7 0.8 0.9 1
Cell Distance [dimensionless]
Tem
pera
ture
[K]
Base Volt = 0.3 Volt = 0.9
∆Τ = 270
∆Τ = 157
∆Τ = 378

Graphically Intuitive Design Aids Development

Fuel Cell M&S UpdatesP
ower
(W
)
328
98.4
267.1739
Eta
(%
)
52.1
19.3
33.1078
EA
PD
(mW
/cm
^2) 393
118
320.4608
CV
DP
(kW
/I)
1.64
0.492
1.337379
TA
IR(K
)
1140
46.8
928.7051
sfc
0.691
0.256
0.403396
Voltage(0.5,0.75)
0.5
0.750.61979
NOS(1.5,4.5)
1.5
4.53.0625
Press(2,5)
2 53.5625
Fuel Util(0.5,0.9)
0.5
0.90.69167
Horiz VertVoltage(0.5,0.75)NOS(1.5,4.5)Press(2,5)Fuel Util(0.5,0.9)
Factor0.6197917
3.0625 3.5625
0.6916667
Current X
Power (W)Eta (%)EAPD(mW/cm^2)CVDP(kW/I)TAIR(K)sfc
Response 213
. . .
593.40.4736189
Contour267.1739133.107801320.460831.3373789928.705150.4033964
Current Y 213
. . . . .
Lo Limit . . . . .
0.48
Hi Limit
0.75
Vol
tage
(0.5
,0.7
5)0.
5
Power (W)
sfc
0.5 Fuel Util(0.5,0.9) 0.9
Real-Time Visualization of Constraint Space
Real-Time Visualization of Constraint Space
SFC

Latter Phase I/ Phase II Developments
ØGreater collaboration with SECA-affiliated national labs
ØMitigation of transient mode failure§ Process optimization of transitional phase
of SOFC start-up via modifications to fuel utilization, load allowance, etc.§ Resolving mini thermal cycles due to load
fluctuation

Latter Phase I/ Phase II Developments
ØEnhanced integration with colleagues for multi-physics simulation and mitigation of thermomechanical failure modes. Examples:
§Strength requirements for designated operating conditions
§Gleaming effective mass transport diffusivities for better characterizing concentration polarization
ØViable performance/reliability tools and training for industry

Thermal-Fluid Modeling of SOFC

Thermal-Fluid Modeling of SOFC
Focus of Thermal – Fluid Modeling Efforts
Porous Media Modeling Radiation Modeling• Knudsen, dispersion, diffusion-thermo (Soret) and thermo-diffusion (Dufour) mass and heat transfer effects
• Non-equilibrium heat transfer in porous electrodes to account for unequal gas and solid matrix temperatures
• Effective thermal conductivity of solid matrix of porous electrodes
• SOFC’s are high temperature systems – radiation modeling important
• Coupling between radiation and other modes of heat transfer affects reaction rates and cell output voltage
• Discrete Ordinate Method is computationally intensive –need for alternate modeling schemes

Radiation Modeling – Optical Properties
1 3 5 7 9 110
10
20
30
40
50
60
70
80
90
100
Reflectance
Transmittance
Wavelength (µm)
Per
cent
age
rati
o (%
)
1 32 4 5 6 7 8 9 100
1
2
3
4
5
Wavelength µm
Ebλ
W/m
2µ
m (1
05 )
λ ~ 1.86 µmWien’s law: (n λ T)max = 2898 µm.n ~ 1.6; T = 700 oC = 973 K; λmax = 1.86 µm
80% of fractional emissive power is contained within 1.4µm < λ < 6.1µm
Electrodes: Optically thick/opaque
Electrolyte: Weakly absorbing (κ=496.2 m-1) and optically thin (κL<0.003)
0 1 2 3 4 5 6 72
4
6
8
10
12
14
Wavelength (µm)
ε”

Radiation Modeling – Discrete Ordinate Method
0 0.005 0.01 0.015 0.02 0.025 0.03850
900
950
1000
1050
1100
1150
Distance along cathode-electrolyte wall (m)
Tem
pera
ture
(0 K )
No RadiationDO Model
• Inclusion of radiation results in ~150 oK drop in the overall temperature level of the monolith type SOFC
• Coupled radiation effects result in increase of cell voltage from 0.65 V 0.74V
0 0.005 0.01 0.015 0.02 0.025 0.03850
900
950
1000
1050
1100
1150
Distance along anode-electrolyte wall (m)
Tem
pera
ture
(0 K )
No RadiationDO Model

0 0.001 0.002 0.003 0.004 0.005 0.006850
900
950
1000
1050
1100
1150
0 0.005 0.01 0.015 0.02 0.025 0.03850
900
950
1000
1050
1100
1150
Radiation Modeling – Two-flux ApproximationT
empe
ratu
re (0 K
)
Distance along monolith cell width (m)
Tem
pera
ture
(0 K )
Methodology Cell Voltage (V) CPU time* (min)
Discrete Ordinate Method
Two-Flux Approximation
0.734
0.731
658
76
* Based on time to convergence of Fluent simulations carried out on a 2.8 GHz pentium 4 personal computer
Distance along anode-electrolyte wall (m)
Cell Length X=0.025 m
No RadiationDO Model2-Flux Approx.
No RadiationDO Model2-Flux Approx.
Cell Width Y=0.0035 m

Porous Media – Reagent Transport Modeling
Species Conservation – Reagent and Intermediate Mole Fraction:
( ) , i i ii i TT
V Y Y ST
D Dρ ρ∇ ∇⋅ = ∇⋅ ∇ − ±
r Di - effective diffusion coefficient Di,T - thermal diffusion coefficientSi - species production / depletion rate
, , ,
11 1 1
i
i k
ii
m i i dD D Dx
Dετ
α−
−= + +
Di,m - molecular diffusion ε - porosityDi,k - Knudsen diffusion τ - tortuosityDi,d - dispersion
( ) ( )2
1 ( ) - - - e
V VVV V p V g T T
Kf
Kµ
ρ ρµ ρ βε ∞∇ ⋅ = − ∇ + ∇ ⋅ ∇ +
r rrr r r r
Momentum Conservation - Forchheimer and Brinkman Model:
µe - effective viscosity ε - porosityK - permeabilityf - inertia coefficient
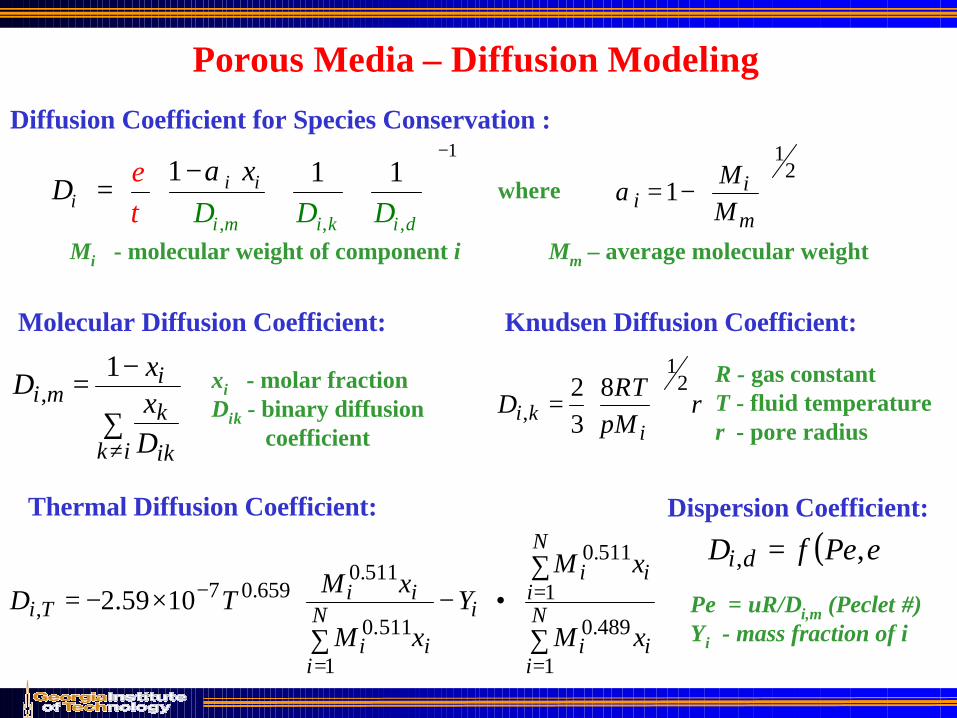
Porous Media – Diffusion Modeling
, , ,
11 1 1
i
i k
ii
m i i dD D Dx
Dετ
α−
−= + +
Diffusion Coefficient for Species Conservation :
∑
−=
≠ik ik
k
imi
Dxx
D1
,
21
1
−=
m
ii M
Mαwhere
Mi - molecular weight of component i Mm – average molecular weight
Molecular Diffusion Coefficient:
xi - molar fractionDik - binary diffusion
coefficient
Knudsen Diffusion Coefficient:
rMRT
Di
ki2
1
,8
32
=
π
R - gas constantT - fluid temperature r - pore radius
Dispersion Coefficient:
( )ε,, PefD di =
Pe = uR/Di,m (Peclet #)Yi - mass fraction of i
Thermal Diffusion Coefficient:
∑
∑•
−∑
×−=
=
=
=
−N
iii
N
iii
iN
iii
iiTi
xM
xMY
xM
xMTD
1
489.0
1
511.0
1
511.0
511.0659.07
, 1059.2

Porous Media – Energy Conservation Modeling
( ) ( ) ( )( ) ( ) phase) (Solid - 0
phase) (Gas - -
,
,
sgvseffs
iisgvgeffggp
TThTk
HSTThTkTcV
+∇⋅∇=
∆∑+∇⋅∇=⋅∇r
ρ
Energy Conservation: Non-Equilibrium Thermal Model:
Non-equilibrium thermal model necessary when:
a) Difference in solid and fluid thermal properties is non-negligibleb) Significant generation in porous media – existence of hot spotsc) Low Reynolds number or flow velocities through porous media
kg,eff - gas phase thermal conductivity ks,eff - solid phase thermal conductivityhv - volumetric heat transfer coefficient ∆Hi - enthalpy of reaction species

Research Tasks – Accomplishments & Future Work
• Thermal radiation effects were investigated by coupling of radiative heat transfer and other modes of heat transfer à significant effects on the temperature and cell voltage were found warranting more detailed analysis, including experiments.
• Accurate models of species transport physics and the effective properties for reagent transport in the porous electrodes are currently being developed.
March ‘03 May ‘03 July ‘03 Sept. ‘03
Develop and validate radiation models for different fuel cell configurations
Linking of Fluent, ANSYS & Electrochemical models
Implement porous media modeling schemes
Develop porous media transport models
Thermomechanical Failure Analysis

Major Thermomechanical Failure Modes and Mechanism
• Warpage• Cracks in seal• Cracks in electrodes• Cracks in electrolyte• Delamination of interfaces• Creep/fatigue of interconnects• ?? (industry inputs)
• Thermal mismatch• Thermal gradient (spatial)• Thermal shock (temporal)• Thermal diffusion• Mass diffusion

Modeling Methodologies
Cell Structure(L > 10-3 m)
PEN Structure(10-5 m < L < 10-3 m)
Material StructureL < 10-5 m
x
za a
• Warpage• Seal failure• Seal design• Residual stresses
• Plate and laminate theories
5 µm
anod
eca
thod
eel
ectr
olyt
e
5 µm
anod
eca
thod
eel
ectr
olyt
eelectrolyte
cathode
anode
A CB
F
D
GEelectrolyte
cathode
anode
A CB
F
D
GE
• Cracks growth• Delamination• Spalling
• Fracture mechanics• Finite element method
• Crack initiation• Plasticity• Creep
• Micromechanics• Damage mechanics

x
za a
Warpage and Stress Analysis
2 211 0 11 00 2 2
11 11 11
( )( ) ( )
2[ ( )( )]s
s s
A E h M B Nw x a x
B D aE h A E h+ −
= −− + +
Deflection due to temperature change
0 50 100 150 200 250 300-0.2
0.0
0.2
0.4
0.6
0.8CathodeElectrolyteAnode
sE
(GPa)
(GPa)
xσ
Max. cell stress vs. seal stiffness
0 50 100 150 200 250 300100
101
102
103
104
Max
. Def
lect
ion
(µm
)
Es (MPa)(GPa)
Max. deflection vs. seal stiffness
cathode
anode
electrolyte
cathode
anode
electrolyte
( )x zσ (MPa)
0500T C∆ = −LSM + YSZ
Ni + YSZ
YSZ

0 50 100 150 200 250 300
0.0
0.2
0.4
0.6
0.8
uniform anodegraded anode
sE
(GPa)
(GPa)
xσ
Max. stress in anode
0 50 100 150 200 250 300-0.2
0.0
0.2
0.4
0.6
0.8
uniform anodegraded anode
sE
(GPa)
(GPa)
xσ
Max. stress in cathode
0 50 100 150 200 250 300100
101
102
103
104
uniform anodegraded anode
Max
. Def
lect
ion
(µm
)
Es (GPa)
Effect of Graded Anode
anode
cathode
electrolyte
Porosity in anode
10%
50%
Max. cell stress vs. seal stiffness
Max. deflection vs. seal stiffness
0 50 100 150 200 250 300-0.2
0.0
0.2
0.4
0.6
0.8uniform anodegraded anode
sE
(GPa)
(GPa)
xσ
Max. stress in electrolyte

Finite Element Analysis
Deformed shape
In-plane normal stress (σx)
Shear stress (σxy)
Out-of-plane normal stress (σy)Finite element mesh
anode
cathode
electrolyte
Single cell

2a
h
2
21.2235
1c
E ha
συ
= −
222( ) 1.22351
(1 )[1 0.9021(1 )] (1 )T Eh h
GT a
αυ υ α υ
∆ ∆ = − − + − ∆ ∆ +
0 200 400 600 800 1000 1200 1400 1600 18000.0
0.5
1.0
1.5
2.0
2.5
3.00 100 200 300 400 500 600 700 800
h = 5 µm
h = 10 µm
h = 20 µm
h = 30 µm
h = 40 µm
h = 50 µm
Temperature Change (oC)
Compressive Stress in the Electrolyte Layer (MPa)
Crit
ical
Fla
w S
ize
(mm
)Blister vs. Edge Delamination
Relationships between processing temperature, electrolyte layer thickness and critical flaw size
anode
electrolyte h
21.028 ( )1Eh
G T αυ
= ∆ ∆−
0 1 2 3 40
5
10
15
20
25
30
35
Flaw Size (mm)
Ene
rgy
Rel
ease
Rat
e (J
/m^2
)h = 5 µm
h = 20 µm
h = 10 µm
Comparison of energy release rate between edge and blister delamination

Effective Properties of Porous Electrodes0 0
20 0 0
2(1 )(5 7)2(5 7) (13 2 15 )
c EE
cν
ν ν ν− −
=− + − −
5 µm
anod
eca
thod
eel
ectro
lyte
5 µm
anod
eca
thod
eel
ectro
lyte
2 20 0 0 0
20 0 0
2(10 9 7) (25 6 19)2(5 7) (15 2 13)
cc
ν ν ν νν
ν ν ν− − + + −
=− + + −
00
0 0
91 3
KE
K µ=
+
0 00
0 0
1 2 32 2 3
KK
µν
µ−
=+
Input:Properties and volume fractions of Ni, LSM and YSZ and porosity
Output:Effective properties of Ni/YSZ and LSM/YSZ
0.00 0.05 0.10 0.15 0.20 0.25 0.300
40
80
120
160
200
240
Pore Volume Fraction
Effe
ctiv
e M
odul
us (G
Pa)
Young's modulus
Shear modulus
Experimental data (E. Lara-Curzio from ORNL) Model prediction

0 5 10 15 20 25 300
100
200
300
400
500
5%20%30%
Fracture Toughness 2(J/m )cG
(J sec)
q
Thermal Shock Induced Microcrack Initiation
22sU Nbπ γ=
Temp Distribution
Surface Energy
Strain Energy
( )0s bd U U
da+
=Griffith Fracture Criterion
q = rate of heat generation (J/sec)
Gc = Fracture toughness of the material
b = crack size
N = number of cracks per unit volume
k = Thermal conductivity
α = Coefficient of linear thermal expansion
r0 = A length parameter characterizes the
spatial non-uniformity of the heat source.
2 2 30
0
3 (1 )16(1 )1
2 9(1 2 ) (1 )ckr GNb
qE b
π π ννα ν ν
−−= + − +
2 2
2 2 3 20
(1 2 )6 (1 )b
q EU
k rα ν
ν π−
=−
020 0
( , ) erf erf4 4
q r rT r t T
rk r r tπ κ
= − + +
( )2
3 20
0
( ) expq r
frc rρ π
= −
rHeating Source
( )2
3 2 23 2 200
( , )exp
44
T t q rT
t r tc r t κρ π κ
• ∂ −= = ∂ ++
x

Failure Analysis Activities for the Next 6 Months
1.1 Obtain fracture mechanics parameters for cohesive, interfacial and impinging cracks.
1.2 Model spalling phenomenon and thermal expansion induced stress during thermal transients and shock.
1.3 Identify and quantify crack path selection and crack propagation.
1.4 Implement temperature gradient as driving force for cracking. Investigate the individual and combined influences of electrochemical and mechanical load stress, as well as temperature gradients on crack initiation and propagation. Review and utilize/adapt, where appropriate, existing, available fracture mechanics models in order to advance the state-of-the-art.
1.5 Evaluate and validate the accuracy of developed fracture mechanics models using either experimental data or modeling results from PNNL/NETL/ORNL or other SECA members.

GT Project Summary
Major Accomplishments of the First 4 months• “Slice technique” model/code to simulate the polarization
curve, and reformate stream analysis model.• Radiation models and porous models for thermal/fluid analysis.• Models for cell deflection, thermal stresses, buckling induced
delamination and thermal shock induced microcracking.
Focus for the Next 6 Months• Enhance, improve, test and validate the models developed
during the first 4 months. • Integrate these models into a common computational testbed
vehicle (a model cell) for validation.• Transfer GT’s modeling modules to the PNNL/NETL
simulation platform.


![An Integrated Approach to System Modeling Using a ...hv/articles/Modelling/p307-fishwick.pdf · the usual object oriented modeling approach within SE [16, 79], specific modeling methods](https://static.fdocuments.in/doc/165x107/5faaf2ef6a58cc4d6662294c/an-integrated-approach-to-system-modeling-using-a-hvarticlesmodellingp307-fishwickpdf.jpg)