MODELING OF THE RAIL FREIGHT TRAFFIC BY THE METHOD OF ...
11
TRANSPORT PROBLEMS 2019 Volume 14 Issue 2 PROBLEMY TRANSPORTU DOI: 10.20858/tp.2019.14.2.7 Keywords: freight traffic; operator company; oligopolistic market; Cartesian ovals; Pascal's limaçon; influence areas Oleg CHISLOV*, Viktor BOGACHEV, Vyacheslav ZADOROZHNIY, Oleg DEMCHENKO, Vladimir KHAN Rostov State Transport University (RSTU) Rostovskogo Strelkovogo Polka Narodnogo Opolcheniya Sq., 2, 344038, Rostov-On-Don, Russia Taras BOGACHEV Rostov State University of Economics Bolshaya Sadovaya, 69, 344002, Rostov-on-Don, Russia *Corresponding author. E-mail: [email protected] MODELING OF THE RAIL FREIGHT TRAFFIC BY THE METHOD OF ECONOMIC-GEOGRAPHICAL DELIMITATION IN THE REGION OF THE SOUTH-EASTER COAST OF THE BALTIC SEA Summary. The results of further research on the creation of a mathematical model of railway freight traffic carried out in a regional transport and technological system are presented. The proposed logistic approach is applied to the issues of optimizing the management of transportation directed to ports located on the southeast coast of the Baltic Sea. Built on the basis of a comprehensive assessment of the transport infrastructure of the region under consideration and the performance of the operating company, the mathematical model provides ample opportunities to address issues of regulating of transportation. The method of economic and geographical delimitation of the «influence areas» of loading stations is significantly developed both in terms of using the geometric properties of higher order algebraic curves and in terms of a deeper approach to studying the transportation process. The results of the research can serve as one of the basis for improving the economic efficiency of the functioning of international transport corridors in the framework of multimodal transport. 1. INTRODUCTION Currently, research is actively conducted using methods of mathematical modeling, the results of which can be used to regulate the promotion of multimodal freight traffic to port railway stations [1, 2, 3]. For example, in [4], the main factors that need to be considered when choosing the locations of internal ports for their effective functioning are highlighted. These factors are the entire infrastructure related to the transportation process, the proximity of suppliers and customers, political and tax considerations, current legal norms and, of course, the international trade environment. In [5], operations performed by internal ports are studied, and the life cycle of these operations is determined. Also their roles are explored in international transport corridors and ways to function effectively are suggested on Canada-connected transcontinental rail routes, especially, in Asian directions. In [6], a set of ranking indicators and criteria related to the analysis of the operating conditions of the «dry port» are studied, taking into account the experience available for the internal ports of the Danube. The attraction potential of a transport hub is estimated by its spatial accessibility indices, taking into account the territorial features of the location and the availability of communication routes. The potential of the node is also taken into account in connection with the level of transport flows directed to it from the economic centers of the region. The analytical model of routing of cargo traffic based on
Transcript of MODELING OF THE RAIL FREIGHT TRAFFIC BY THE METHOD OF ...

TRANSPORT PROBLEMS 2019 Volume 14 Issue 2 PROBLEMY TRANSPORTU DOI: 10.20858/tp.2019.14.2.7
Keywords: freight traffic; operator company; oligopolistic market; Cartesian ovals; Pascal's limaçon; influence areas
Oleg CHISLOV*, Viktor BOGACHEV, Vyacheslav ZADOROZHNIY, Oleg DEMCHENKO, Vladimir KHAN Rostov State Transport University (RSTU) Rostovskogo Strelkovogo Polka Narodnogo Opolcheniya Sq., 2, 344038, Rostov-On-Don, Russia Taras BOGACHEV Rostov State University of Economics Bolshaya Sadovaya, 69, 344002, Rostov-on-Don, Russia *Corresponding author. E-mail: [email protected]
MODELING OF THE RAIL FREIGHT TRAFFIC BY THE METHOD OF ECONOMIC-GEOGRAPHICAL DELIMITATION IN THE REGION OF THE SOUTH-EASTER COAST OF THE BALTIC SEA
Summary. The results of further research on the creation of a mathematical model of railway freight traffic carried out in a regional transport and technological system are presented. The proposed logistic approach is applied to the issues of optimizing the management of transportation directed to ports located on the southeast coast of the Baltic Sea. Built on the basis of a comprehensive assessment of the transport infrastructure of the region under consideration and the performance of the operating company, the mathematical model provides ample opportunities to address issues of regulating of transportation. The method of economic and geographical delimitation of the «influence areas» of loading stations is significantly developed both in terms of using the geometric properties of higher order algebraic curves and in terms of a deeper approach to studying the transportation process. The results of the research can serve as one of the basis for improving the economic efficiency of the functioning of international transport corridors in the framework of multimodal transport.
1. INTRODUCTION
Currently, research is actively conducted using methods of mathematical modeling, the results of which can be used to regulate the promotion of multimodal freight traffic to port railway stations [1, 2, 3]. For example, in [4], the main factors that need to be considered when choosing the locations of internal ports for their effective functioning are highlighted. These factors are the entire infrastructure related to the transportation process, the proximity of suppliers and customers, political and tax considerations, current legal norms and, of course, the international trade environment. In [5], operations performed by internal ports are studied, and the life cycle of these operations is determined. Also their roles are explored in international transport corridors and ways to function effectively are suggested on Canada-connected transcontinental rail routes, especially, in Asian directions. In [6], a set of ranking indicators and criteria related to the analysis of the operating conditions of the «dry port» are studied, taking into account the experience available for the internal ports of the Danube. The attraction potential of a transport hub is estimated by its spatial accessibility indices, taking into account the territorial features of the location and the availability of communication routes. The potential of the node is also taken into account in connection with the level of transport flows directed to it from the economic centers of the region. The analytical model of routing of cargo traffic based on

78 О. Chislov, V. Bogachev, V. Zadorozhniy, T. Bogachev, O. Demchenko, V. Khan the principles of the theory of stocks and explaining how closely the organization of freight traffic is related to the characteristics of the relationship of the sender and the recipient is presented in [7].
Analysis of the content of the above works gives an idea of the relevance of studies of the entire complex of processes occurring in various regional transport systems. We also note that the distribution of cargo traffic is fraught with difficulties caused by the collision of commercial interests not only of competing modes of transport but also of individual transport enterprises. The sharply increased concentration of wagon flows entering through a very limited number of transshipment bases on the sea coasts, as well as in the internal industrial areas, found insufficient capacity of the existing transport hubs.
In this paper, we consider the southeastern region of the Baltic Sea coast, which for more than three centuries has been one of the key icons of Russia's foreign trade. The main goods supplied are oil products, gas, coal, wood, mineral fertilizers and metals. Stable, and even more so, progressive traditional Russian export is one of the eternal conditions for the stability of the European market as a whole. In connection with the above, the development of methods for organizing freight transport and managing railway rolling stock of operators operating in this region seems to be a very relevant area of transport and logistics research.
The following seaports in the Baltic Sea basin are considered: Big Port St. Petersburg, Primorsk, Vysotsk, Vyborg, Ust-Luga, Kaliningrad (Fig. 1). They are served by the Oktyabrskaya and Kaliningrad railways – branches of the JSC «Russian Railways». The peculiarities of these ports include their natural competition with the ports of the Baltic States (Lithuania, Latvia, Estonia, Finland), as well as the fact that the port of Kaliningrad, being in the same area, which is an enclave, is connected to the main part of Russian territory by marine ferry Ust-Luga – Baltiysk.
JSC «First Cargo Company» (Freight One) [8], being one of the largest private operators in the world, provides its clients with a full range of services related to railway cargo transportation and logistics. In July 2013, the company began to use its own locomotives, and, in 2015, one of the strategic directions of its business began to be expressed in the form of customer service using the technology of third-party logistics (3PL).
NLMK group is a leading international manufacturer of high-quality steel products with a vertically integrated business model. Taking the advantages of a flexible production chain, a balanced product range, an efficient sales system and an extensive sales geography, the company is able to respond in a timely manner to constantly changing market conditions.
The information provided on the business policies pursued by the above companies gives rise to the natural assumption that the mathematical models developed in this paper, by their nature and results, may be in demand in the freight market in the considered region.
Fig. 1. The volume of cargo transshipment for the 1st quarter of 2018 in the considered region of the Baltic Sea basin, ths. tons

Modeling of the rail freight traffic by the method of… 79 2. PRELIMINARY ANALYSIS OF COST INDICATORS OF FREIGHT TRANSPORTATION IN THE REGION
In this paper, the approach developed by the authors in transport and logistics research [9, 10] is applied to the issues of optimizing the management of freight railway traffic flows to ports located on the southeast coast of the Baltic Sea. JSC Freight One as part of its interaction with the NLMK group of companies is considered as the object of research. The cargo is sheet steel, which is manufactured by the NLMK group of companies and delivered in the freight cars of JSC Freight One from four loading stations: Novolipetsk (1), Vorsino (2), Cherepovets-1 (3) and Revda (4) to the station-ports, for example, the Big Port of St.Petersburg, Ust-Luga, Vysotsk, Vyborg, Primorsk.
According to [11], the cost of transporting wagon from any loading station to any unloading station is calculated taking into account the distance that has been traveled by this wagon. The corresponding statistics for the above stations are shown in Table 1.
Table 1
The cost of transporting wagon from loading stations to ports
Operator company Loading ststions
Saint Peterburg Uct-Luga Vysotsk Vyborg Primorsk
l, km с,
thousand roubles
l, km с,
thousand roubles
l, km с,
thousand roubles
l, km с,
thousand roubles
l, km с,
thousand roubles
JSC Freight
One
1 Novolipetsk 1546 123,9 1611 128,9 1700 129,6 1670 129,63 1663 128,9 2 Vorsino 1262 107,7 1090 96,8 1416 116,8 1386 113,58 1379 113,5 3 Cherepovets1 489 61,5 625 69,5 643 71,8 613 69,57 606 69,5 4 Revda 2126 155,4 2262 159,8 2280 159,9 2250 159,6 2243 159,5
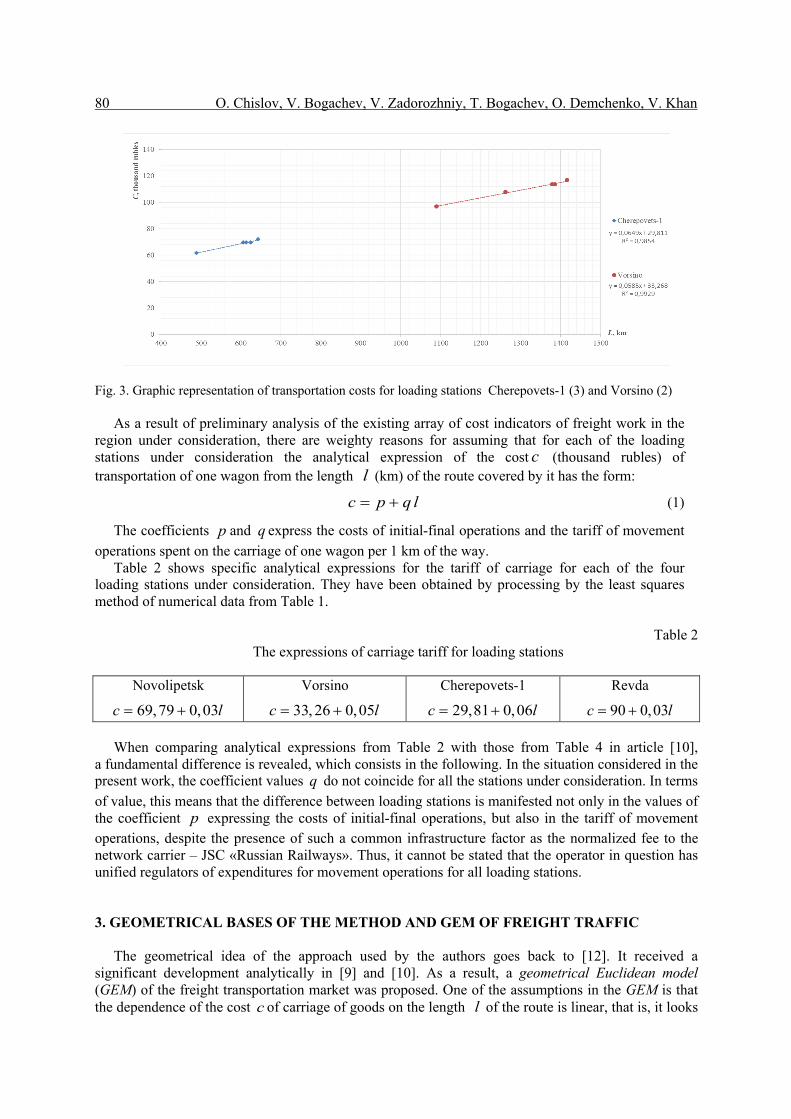
Depicted graphically in Figs. 2 and 3, statistical data suggest that for each of the four loading stations under consideration, the dependence of the cost c (thousand rubles) of transporting one wagon from the length l (km) of the route covered by it is linear. It should be noted that this type of dependence is manifested for very different locations and lengths of the ranges of transportation. Therefore, we can conclude that it is very stable, in general.
Fig. 2. Graphic representation of transportation costs for loading stations Novolipetsk (1) and Revda (4)
80 О. Chislov, V. Bogachev, V. Zadorozhniy, T. Bogachev, O. Demchenko, V. Khan
Fig. 3. Graphic representation of transportation costs for loading stations Cherepovets-1 (3) and Vorsino (2) As a result of preliminary analysis of the existing array of cost indicators of freight work in the
region under consideration, there are weighty reasons for assuming that for each of the loading stations under consideration the analytical expression of the cost (thousand rubles) of transportation of one wagon from the length (km) of the route covered by it has the form:
(1)
The coefficients and express the costs of initial-final operations and the tariff of movement operations spent on the carriage of one wagon per 1 km of the way.
Table 2 shows specific analytical expressions for the tariff of carriage for each of the four loading stations under consideration. They have been obtained by processing by the least squares method of numerical data from Table 1.
Table 2
The expressions of carriage tariff for loading stations
Novolipetsk
Vorsino
Cherepovets-1
Revda
When comparing analytical expressions from Table 2 with those from Table 4 in article [10], a fundamental difference is revealed, which consists in the following. In the situation considered in the present work, the coefficient values do not coincide for all the stations under consideration. In terms of value, this means that the difference between loading stations is manifested not only in the values of the coefficient expressing the costs of initial-final operations, but also in the tariff of movement operations, despite the presence of such a common infrastructure factor as the normalized fee to the network carrier – JSC «Russian Railways». Thus, it cannot be stated that the operator in question has unified regulators of expenditures for movement operations for all loading stations.
3. GEOMETRICAL BASES OF THE METHOD AND GEM OF FREIGHT TRAFFIC
The geometrical idea of the approach used by the authors goes back to [12]. It received a significant development analytically in [9] and [10]. As a result, a geometrical Euclidean model (GEM) of the freight transportation market was proposed. One of the assumptions in the GEM is that the dependence of the cost of carriage of goods on the length of the route is linear, that is, it looks
cl
c p q l= +
p q
69,79 0,03с l= + 33,26 0,05с l= + 29,81 0,06с l= + 90 0,03с l= +
q
p
c l

Modeling of the rail freight traffic by the method of… 81 like (1). In this model, the real situation is «idealized» in the sense that all transport routes are assumed to be the straight. Thus, their lengths are Euclidean distances between the beginnings and the ends of the routes. We give a brief description of the theoretical basis of GEM.
We first consider the case of a duopoly. The delimitation between the «influence areas» of the two subjects of the transportation process (duopolists) will be determined by the cost of transporting goods from the duopolist to the destination. The destination can be, in principle, at any point of the plane. Let
be the distance between the locations of duopolists; and are the costs of initial-final operations and the cost of movement operations per 1 km of the route, respectively, spent (for example, on one wagon) by the duopolist ( ). Without loss of generality, we will assume that the 1st and 2nd duopolists are located, respectively, at the points of the plane and . Then, the curve delimiting their «influence areas» is written by the equation
(2)
It is known [13] that equation (2) defines an algebraic curve on a plane, which generally has a fourth order. This curve is the Descartes oval, whose foci are located at the points
and . In particular, this curve may turn out to be Pascal's limaçon (see also [14]).
We put and further (again, without loss of generality) assume that . Let us transform equation (2) to the equivalent form:
(3)
We will perform transformations of equation (3) using a system of analytical calculations. The result will be the equation
(4)
Note that equations (3) and (4) are equivalent if we assume the fulfillment of the inequality
We give some geometric explanations about the curve given by the implicit equation (4). For the
sake of brevity, we will consider the cases when (recall that, when moving from equation (2) to equation (3), an assumption was made). Note that if we consider the values and , contained in Table 2, in pairs, then all pairs satisfy both of these inequalities.
Let and (that is, ). Then, the curve under consideration has the fourth order and is actually the Descartes oval. If , then the order of the curve is reduced by at least two orders of magnitude. In this case, depending on the relationship among the values of the parameters , and , the shape of the curve can vary significantly. Namely, a curve is a right branch of a hyperbola (that is, a curve of second order) if . It becomes a straight line ray if . Finally, if , then the curve is an empty set.
Note that the order of the curve defined by equation (4) can also decrease significantly in cases when . This happens if and only if equality (that is ) holds. In such cases, the specified curve is a circle (a second order curve).
Let us give the comments on the «influence areas» received by participants in a duopoly.
L ip 0> iq 0>
i i 1,2=( )O 0, 0 ( )A L, 0
( )22 2 21 1 2 2p q x y p q x L y .+ + = + - +
( )O 0, 0 ( )A L, 0
2 1p p p= - p 0³
2 2 2 2 2 2 2 2 2 2 2 2 2 2 22 1 1 2 2 2 22 pq x 2xL L y q x q y p q x 2q xL q L q y .- + + = + - - + - -
( ) ( ) ( ) ( )( )() ( ) ( )( ) ( )
( )( )( ) ( )
2 22 2 4 2 2 2 3 2 2 2 2 2 2 2 2 2 2 21 2 2 1 2 1 2 2 2 1 2
22 2 2 2 2 2 2 2 2 2 2 2 2 2 2 42 2 1 2 2 2 2 1 2
22 2 2 2 2 2 2 2 2 2 2 2 2 22 2 1 2 2 2
q q x 4q L q q x 2 q q x y 4 p q 2 p q L q q
4q L x 4q L q q xy 8 p q L 4 p q L q L x q q y
4 p q 2 p q L q q y 4 p q L p q L 0 .
- + - + - - + + - -
- + - + - + + - -
- + + - - + + =
2 2 2 2 2 2 2 2 2 2 2 21 1 2 2 2 2q x q y p q x 2q xL q L q y 0 .+ - - + - - ³
1 2q q³
2 1p p³ ip iq
1 2q q> 2 1p p> p 0>
1 2q q=
p L 2q
20 p Lq< <
2p Lq= 2p Lq>
1 2q q> 2 1p p= p 0=

82 О. Chislov, V. Bogachev, V. Zadorozhniy, T. Bogachev, O. Demchenko, V. Khan
If , then, regardless of the values of and , the «influence area» of the 1st duopolist is a bounded set on the plane, and the «influence area» of the 2nd is not bounded. Indeed, as noted above, if , then the demarcating curve of the indicated «influence areas» is actually the Descartes oval, and if , then it is a circle. Both curves are bounded sets on the plane. From an economic point of view, the «inequality» in the «influence areas» is explained by the fact that the cost of movement operations for the 2nd duopolist is lower than for the 1st one. Therefore, in spite of the fact that it may even have more expenses for initial-final operations than for the 1st duopolist, the 2nd duopolist turns out to be more competitive in transportation for fairly long distances.
Let us proceed to the construction of GEM freight traffic. Analytical expressions for transportation costs obtained in section 2 for each of the four loading stations (see Table 2) allow creating the GEM of the oligopolistic market within the framework of the operator company JSC Freight One and the region under consideration. In economic terms, loading stations can be presented as oligopoly participants who compete with each other not in an antagonistic form but with the goal of more efficient use of the company's resources.
Recall that the cost of transporting goods from loading stations to their destination is an indicator of how in the GEM differentiates between the «influence areas» of these stations. For a given loading station, considered in a single transport space along with a group of other loading stations, the «influence area» of this station is the area on a geographical map, bounded by a line determined by the cost parameters of the transportation process. Moving the cargo in question to unloading stations located in the «influence area» of this loading station is more advantageous from economic and infrastructural points of view than moving them from other loading stations belonging to the specified group of stations. In the previous section, it was shown that in the case of a duopoly, the «influence areas» of the two stations under consideration are delimited by the line, which is a certain Descartes oval. Accordingly, in an oligopolistic situation, the boundary of the «influence area» of each of the four loading stations will be a combination of three components. Each of them is a part of the Descartes oval, which, in the case of a duopoly, delimits the station in question from any one of the three other loading stations. Note that these components are not necessarily to be the connected sets on the plane.
On a flat geographical map of the region in question, we introduce a Cartesian coordinate system with a start, for example, at the location of the Novolipetsk station. Such a choice is of no fundamental importance and is carried out for the conditional «linking» of the model of the oligopolistic market under construction to the real territory. In this case, it is taken into account that the specified loading station is the base for the NLMK group of companies. The abscissa and ordinate axes are located, respectively, in the direction from west to east and from south to north.
Figs. 4–7 show four fragments of the oligopolistic market. These markets are created by the four loading stations considered in this paper. Each of the fragments refers to one of these stations. The images of the fragments were obtained using a system of analytical calculations based on equation (2) and the expressions for the cost of transportation from Table 2. We give some comments about the results obtained.
For each pair of loading stations, Novolipetsk – Vorsino, Novolipetsk – Cherepovets-1, Novolipetsk – Revda, Vorsino – Cherepovets-1, Vorsino – Revda and Cherepovets-1 – Revda, the curves that divide their «influence areas» in a duopolistic situation are painted in red, blue, green, black, yellow and brown colors, respectively (see Figs. 4–7).
Furthermore, one of the components of the «influence area» boundary of the Novolipetsk station, obtained in an oligopolistic situation (see Figs. 4 and 8), consists of two disconnected parts of the hyperbola. This hyperbola is marked in green and represents a curve that in the duopolistic situation delimits the «influence areas» of the loading stations of Novolipetsk and Revda. A similar remark can be made for the «influence area» obtained in the oligopolistic situation for Revda station (see Figs. 7 and 8).
It is noteworthy that the loading station Novolipetsk does not fall into its own «influence area» (see Fig. 4). It falls into the «influence area» of another loading station – Vorsino (see Fig. 6). This
1 2q q> 1p 2p
2 1p p>
2 1p p=

Modeling of the rail freight traffic by the method of… 83 result is a consequence of the fact that the costs of initial-final operations at Novolipetsk station are significantly higher than the costs of initial-final operations at Vorsino station (see Table 2). Another reason is that these stations are quite close to each other. Below, in section 4, we indicate one of the possible ways to increase the «influence area» of station Novolipetsk to such an extent that it falls into this area (see Fig. 9).
Fig. 4. «Influence area» of Novolipetsk station Fig. 5. «Influence area» of Cherepovets-1 station
Fig. 6. «Influence area» of Vorsino station Fig. 7. «Influence area» of Revda station
The complete territorial picture of the oligopolistic market created by the four loading stations is described, generally speaking, by curves. On each of Figs. 4–7, three of these curves are present.
For the convenience of visual perception of the «influence areas» of all four loading stations, we do not give in Fig. 8 full images of all six curves.
24С 6=

84 О. Chislov, V. Bogachev, V. Zadorozhniy, T. Bogachev, O. Demchenko, V. Khan
Fig. 8. The picture of freight transportation market in the GEM for JSC «Freight One» in oligopolistic case 4. ANALYSIS AND POSSIBLE CHANGES OF GEM
Let us discuss the questions that naturally arise in connection with the GEM, which was built in the previous section.
First, we draw attention to the fact that the Big Port of St. Petersburg, Ust-Luga and Vyborg (as well as the port stations Vysotsk and Primorsk, which are not depicted in Figs. 5, 6 and 8), proved to be located precisely in the «influence area» of the loading station Cherepovets-1. This result can be viewed as a natural confirmation of the correctness the GEM, as these ports are located closer to the loading station than, for example, to Vorsino station (see Table 1).
Furthermore, note that none of the port stations located on the southeastern coast of the Baltic Sea considered in the present work fell into the «influence area» of the loading stations of Novolipetsk and Revda. The economic interpretation of this result is as follows. With the high costs that these stations spend on initial-end operations for the carriage of goods, they are inferior to Vorsino and Cherepovets-1 in that part of the Baltic Sea coast, which is considered in this paper. However, as can be seen from Fig. 8, low cost (compared with the other two loading stations) of movement operations allows the stations of Novolipetsk and Revda to be more competitive when transporting goods over fairly long distances.
Let us now pay attention to the fact that in building the GEM of the freight transportation market, the fact that in the existing railway network the connection between two stations can be carried out not only along straight sections of the route is not taken into account. Therefore, for the constructed GEM, it is necessary to conduct some additional studies about its possible adjustment. As a result of possible refinements, the geometrical routing model (GMM) of the freight transportation market will turn out, which may differ somewhat from the «ideal» model.

Modeling of the rail freight traffic by the method of… 85
First of all, it is natural to check those port stations that in the GEM turned out to be located close to the curves separating the «influence areas» of the loading stations. Such as the Ust-Luga port station got into the «influence area» of the loading station Cherepovets-1 and located close to the «influence area» of the Vorsino loading station (Figs. 5, 6 and 8). We will carry out some additional calculations in which we will proceed from a real life transport network, the shortest train route from the station Cherepovets-1 to the station Ust-Luga is 625 km and from the station Vorsino – 1090 km (see Table 1). We use the above analytical expressions for the dependence of the cost (thousand rubles) of carriage on the length (km) of the route covered (see Table 2). Then, we get
and
.
Thus, the inequality holds . Consequently, the location of the port-station of Ust-Luga in relation to the loading stations of Cherepovets-1 and Vorsino in GMM is the same as in the GEM. From the point of view of the fact that this port belongs to the «influence area» of the considered loading stations, no GEM adjustment is required.
Let us also consider the issue of increasing the «influence areas» of loading stations. In the context of the research carried out in the present work, such a change for any of the loading stations under consideration can be achieved by reducing the costs of initial-final or movement operations.
Consider, for example, the Novolipetsk loading station. Fig. 9 shows the image of the «influence area» of this station, which is obtained by reducing the coefficient in formula (1) (that is, the cost of initial-final operations) from a value of to (compare with Figs. 4, 6 and 8).
Fig. 9. «Influence area» of Novolipetsk station after the change
Note that, in principle, the nature of the pattern of the transportation process in the region in question has not changed (compare Figs. 4, 7 and 8 with Fig. 9). Namely, the «influence areas» of Novolipetsk and Revda stations remained as the non-bounded regions.
cl
Ch. 1с 29,81 0,06 625 67,31- = + × =
V .с 33,26 0,05 1090 87,76= + × =
Ch. 1 V .с с- <
p69,79 49,79

86 О. Chislov, V. Bogachev, V. Zadorozhniy, T. Bogachev, O. Demchenko, V. Khan 5. CONCLUSION
As far as we know, for the first time in the course of transport and logistics research, classical algebraic curves of higher orders proved to be in full demand. These are the ovals of Descartes and, in particular, Pascal's limaçon. This is quite natural if we proceed from the actual mathematical formulation of the problem of optimizing the processes of freight transportation.
The method of economic and geographical delimitation of the «influence areas» of loading stations developed by the authors has been significantly developed both in terms of using the geometric properties of these algebraic curves and in terms of a more in-depth approach to the ongoing research of the transportation process. Appeal to the analytical, computational and graphical capabilities of computer mathematics systems allows you to build informative and visual models of the oligopolistic freight market.
Built on the basis of a comprehensive assessment of the transport infrastructure of the region under consideration as well as the performance of the operating company, the mathematical model provides ample opportunities to address issues of regulating railway freight traffic and optimizing them. The results of the research can serve as a basis for improving the economic efficiency of the functioning of international transport corridors in the framework of multimodal transport. Acknowledgements
The research is conducted with a support of the Russian Foundation for Basic Research (#17-20-04236 ofi m RJD). References 1. Zhang, Y.Z. & Wang, J.Q. & Hu, Z.A. Optimization Model of Transportation Product Selection
for Railway Express Freight. Journal of Engineering Science and Technology Review. 2016. No. 9(5). P. 104-110.
2. Knoop, V. & Hoogendoorn, S. An Area-Aggregated Dynamic Traffic Simulation Model. European Journal of Transport and Infrastructure Research. 2015. No. 15(2). P. 226-242.
3. Wang, X. & Meng, Q. & Miao, L. Delimiting port hinterlands based on intermodal network flows: Model and algorithm. Transportation Research Part E: Logistics and Transportation Review. 2016. Vol. 88. P. 32-51.
4. Gooley, T.B. The Geography of Logistics. Logistics Management and Distribution Report January. 1998. P. 63-65.
5. Harrison, R. International Trade, Transportation Corridors, and Inland Ports: Opportunities for Canada. Pacific-Asia Gateway and Corridor Research Consortium. P. 1-13. Available at: http://www.gateway-corridor.com/roundconfpapers/documents/Harrison_Robert_Winnipeg. pdf.
6. Dinu, O. & Burciu, S. & Oprea, C. & Ilie, A. Inland waterway ports nodal attraction indices relevant in development strategies on regional level. IOP Conference Series: Materials Science and Engineering. 2016. DOI:10.1088/1757-899X/145/8/082008.
7. Combes, F. & Tavasszy, L.A. Inventory theory, mode choice and network structure in freight transport. European Journal of Transport and Infrastructure Research. 2016. No. 16(1). P. 38-52.
8. Первая грузовая компания. Available at: http://www.pgkweb.ru [In Russian: First Freight Company].
9. Богачев, В.А. & Богачев, Т.В. Использование информационных технологий при изучении математических дисциплин. Комплексный анализ. Теория операторов. Математическое моделирование. Владикавказ: Изд-во ВНЦ РАН. 2006. [In Russian: Bogachev, V.A. & Bogachev, T.V. The use of information technology in studying mathematical subjects. Complex analysis. Operator theory. Mathematical modeling. In: Vladikavkaz: EASTERN SCIENTIFIC CENTRE of Russian Academy of Sciences].

Modeling of the rail freight traffic by the method of… 87 10. Chislov, O.N. & Bogachev, V.A. & Zadorozhniy, V.M. & Bogachev, T.V. Economic-
geographical method delimiting wagon flows in the region considered: model and algorithm. Transport Problems. 2018. Vol. 14. No. 2. P. 39-48.
11. Прейскурант № 10-01 «Тарифы на перевозки грузов и услуги инфраструктуры, выполняемые российскими железными дорогами». Available at: http://doc.rzd.ru/doc/public/ru%3Fid%3D6188%26layer_id%3D5104%26STRUCTURE_ID. [In Russian: Price list № 10-01 «Tariffs for the transportation of goods and infrastructure services performed by Russian railways»].
12. Крыньский, Х.Э. Математика для экономистов. Москва: Статистика. 1970. 580 p. [In Russian: Krynsky, H.E. Mathematics for economists. Moscow: Statistics].
13. Виноградов, И.М. Математическая энциклопедия: т. 2. Москва: «Советская Энциклопедия». 1979. P. 79-80. [In Russian: Vinogradov, I.M. Mathematical Encyclopedia: Vol. 2. Moscow: Soviet Encyclopedia].
14. Виноградов, И.М. Математическая энциклопедия: т. 4. Москва: «Советская Энциклопедия». 1984. P. 226-227 [In Russian: Vinogradov, I.M. Mathematical Encyclopedia: Vol. 4. Moscow: Soviet Encyclopedia].
Received 23.11.2017; accepted in revised form 05.06.2019