Modeling of diurnal pattern of air temperature in a tropical environment: Ile-Ife …€¦ · ·...
19
Vol.:(0123456789) 1 3 Model. Earth Syst. Environ. (2017) 3:1421–1439 DOI 10.1007/s40808-017-0374-0 ORIGINAL ARTICLE Modeling of diurnal pattern of air temperature in a tropical environment: Ile-Ife and Ibadan, Nigeria Akinnubi R.T. 1 · Adeniyi M.O. 2 Received: 22 July 2017 / Accepted: 20 August 2017 / Published online: 5 September 2017 © The Author(s) 2017. This article is an open access publication model that incorporated the night time inversion variables gave the best estimation of the diurnal weather patterns of T a when compared with other existing models for a tropical environment. Keywords Air temperature · Surface energy balance · Fourier series analysis · Mean bias error · Cooling inversion List of symbols t Current time T a Current air temperature T amax Maximum daily air temperature o C T amin Minimum daily air temperature o C T amax(j + 1) Maximum daily air temperature o C of next day T amin(j + 1) Minimum daily air temperature o C of next day t s Sunset time T sun Sunset temperature o C L Night length Time coefficient LSH Time of maximum solar height DL Day length N Hour after sunset b Slope of exponential curve Introduction Surface energy balance (SEB) describes the energy exchange between the earth’s surface and the atmosphere. The equa- tion of SEB finds application at local scales from point measurement to synoptic scale (models), and most impor- tantly in climate models (CMs) (Pandey and Vanita 2016; Prasanta et al. 2016; Shiferaw et al. 2016). The way this energy exchange affect the climate is not well understood Abstract Modeling of diurnal pattern of air temperature (T a ) is essential in the parameterization of turbulent heat fluxes in climate models. However, climate models still simulate the nocturnal stable boundary layer surface T a with biases across the globe. This paper therefore validated five different diurnal T a models (Ephrath, Hirotaka, de Wit, Par- ton and Fourier series models) used for estimating hourly T a from daily maximum, daily minimum, and daily mean air temperature. It also developed an improved fourier series parameterization approach for T a using surface layer obser- vations from Nigerian micrometeorological experimental (NIMEX) site. The overall performance of the Ephrath, Hirotaka, de Wit and Parton models revealed a large devia- tion from the measured data during the early hours of the morning and late hours of the nighttime. The original fou- rier series model showed better performance for unstable air temperature parameterizations while the stable T a was strongly overestimated. The performance of the model was improved with the inclusion of the atmospheric cool- ing rate that accounts for the temperature inversion which occurs during the nocturnal boundary layer condition. The mean bias error and root mean square error in estimated T a by the modified fourier series model reduced by 4.13 and 3.01 °C, respectively during the transition period from dry to wet stable atmospheric conditions. The existing mod- els simulated night time T a with high biases and could not accurately capture the strong cooling inversion associated with a humid tropical region. The modified Fourier series * Akinnubi R.T. [email protected] 1 Department of Physics, Adeyemi College of Education, P.M.B. 520, Ondo, Ondo, Nigeria 2 Department of Physics, University of Ibadan, Ibadan, Nigeria
-
Upload
dinhkhuong -
Category
Documents
-
view
214 -
download
0
Transcript of Modeling of diurnal pattern of air temperature in a tropical environment: Ile-Ife …€¦ · ·...

Vol.:(0123456789)1 3
Model. Earth Syst. Environ. (2017) 3:1421–1439 DOI 10.1007/s40808-017-0374-0
ORIGINAL ARTICLE
Modeling of diurnal pattern of air temperature in a tropical environment: Ile-Ife and Ibadan, Nigeria
Akinnubi R.T.1 · Adeniyi M.O.2
Received: 22 July 2017 / Accepted: 20 August 2017 / Published online: 5 September 2017 © The Author(s) 2017. This article is an open access publication
model that incorporated the night time inversion variables gave the best estimation of the diurnal weather patterns of Ta when compared with other existing models for a tropical environment.
Keywords Air temperature · Surface energy balance · Fourier series analysis · Mean bias error · Cooling inversion
List of symbolst Current timeTa Current air temperatureTamax Maximum daily air temperature oCTamin Minimum daily air temperature oCTamax(j + 1) Maximum daily air temperature oC of next dayTamin(j + 1) Minimum daily air temperature oC of next dayts Sunset timeTsun Sunset temperature oCL Night length� Time coefficientLSH Time of maximum solar heightDL Day lengthN Hour after sunsetb Slope of exponential curve
Introduction
Surface energy balance (SEB) describes the energy exchange between the earth’s surface and the atmosphere. The equa-tion of SEB finds application at local scales from point measurement to synoptic scale (models), and most impor-tantly in climate models (CMs) (Pandey and Vanita 2016; Prasanta et al. 2016; Shiferaw et al. 2016). The way this energy exchange affect the climate is not well understood
Abstract Modeling of diurnal pattern of air temperature (Ta) is essential in the parameterization of turbulent heat fluxes in climate models. However, climate models still simulate the nocturnal stable boundary layer surface Ta with biases across the globe. This paper therefore validated five different diurnal Ta models (Ephrath, Hirotaka, de Wit, Par-ton and Fourier series models) used for estimating hourly Ta from daily maximum, daily minimum, and daily mean air temperature. It also developed an improved fourier series parameterization approach for Ta using surface layer obser-vations from Nigerian micrometeorological experimental (NIMEX) site. The overall performance of the Ephrath, Hirotaka, de Wit and Parton models revealed a large devia-tion from the measured data during the early hours of the morning and late hours of the nighttime. The original fou-rier series model showed better performance for unstable air temperature parameterizations while the stable Ta was strongly overestimated. The performance of the model was improved with the inclusion of the atmospheric cool-ing rate that accounts for the temperature inversion which occurs during the nocturnal boundary layer condition. The mean bias error and root mean square error in estimated Ta by the modified fourier series model reduced by 4.13 and 3.01 °C, respectively during the transition period from dry to wet stable atmospheric conditions. The existing mod-els simulated night time Ta with high biases and could not accurately capture the strong cooling inversion associated with a humid tropical region. The modified Fourier series
* Akinnubi R.T. [email protected]
1 Department of Physics, Adeyemi College of Education, P.M.B. 520, Ondo, Ondo, Nigeria
2 Department of Physics, University of Ibadan, Ibadan, Nigeria

1422 Model. Earth Syst. Environ. (2017) 3:1421–1439
1 3
especially in West Africa where studies on land–atmospere interactions are still scarce (Mauder et al. 2006; Foken et al. 2006). One of such interaction whose poor parmeterizations in CMs has affected weather and climate change predictions is the nocturnal inversion process during stable atmospheric boundary layer condition at calm nighttime (Stull 1988; Foken et al. 2006). The energy balance of the soil–atmos-phere interface is expressed as
where QS is the net radiation (Wm−2), QH is the sensible heat flux density (Wm−2), QE is the latent heat flux density (Wm−2), QG is the ground heat flux density (Wm−2). Here QS and QG are positive downward, QH and QE are positive upward. To solve Eq. (1) numerically at any time interval of interest in CMs, the values of some climate variables such as air temperature, wind speed and surface temperature are needed since they are the fundamental parameters for esti-mating the turbulent sensible and latent heat fluxes in the CMs. Several diurnal temperature cycle (DTC) meteoro-logical models generate diurnal data of climatic variables from their mean daily values using the analogy between their cycles during the day and trigonometric functions (Jury and Horton 2003; Saito and Šimůnek 2009). Once the values of climate variables are obtained at any given time, they can be further used in parameterization formulae to calcu-late the turbulent heat fluxes (Saito et al. 2006). Neverthe-less, standard data at time intervals of interest required for most sophisticated studies and simulations are not readily available and even when available they are very expensive, thereby constituting a restraint on research at micro-scale levels. Thus, diurnal changes in these variables need to be calculated from available daily average values using mete-orological models (Ephrath et al. 1996; Balyani et al. 2017).
The shape of the diurnal temperature curve has been modeled with a variety of method with varying degrees of complexity. These methods include linear models (Parton and Logon 1981), simple curve fitting models based on sine or exponential analysis (Isikwue et al. 2011) and more com-plex energy budget models (Goudrian and Waggoner 1972; Lemon et al. 1972). Studies revealed that some of these models had been modified to account for the decay of air temperature at nighttime, while others are yet to be corrected (Ephrath et al. 1996; Parton and Logon 1981). The linear and simple curve models have an advantage in that they are easy to use and often require only daily minimum and maximum temperature. Reicosky et al. (1989) examined five such existing methods, three of which are used in an existing soybean growth model for calculating hourly air temperature from daily extremes. John and Schroll (1997) also developed an empirical model based on normalized TQ using beta func-tion distribution analysis and compared with other existing methods. In addition, Julia et al. (2001) examined different
(1)QS − QH − QE − QG = 0,
Ta models for different synoptic stations over the Mediterra-nean belt. They concluded that all methods worked well for daytime, but had limited success on nighttime stable atmos-pheric condition. In West Africa, Isikwue et al. (2011) only employed Fourier series analysis in modeling the hourly air temperature variation over Lagos and Abuja, but no inter-comparison with other existing models was carried out and the diurnal behavior of the simulated Ta was not properly investigated. They concluded that the variation in hourly air temperature in the two stations was dominated by the first harmonics, thus it fluctuates by one cycle with a period of 24 h (Lidija 2007; Atsu and David 2000).
The above mentioned works developed and compared models for modeling air temperature values on hourly basis. However, there is dearth of information on studies that com-pare the performance of different air temperature models in order to obtain the best models for this region. The aim of this paper is to evaluate the performance of different air temperature models along with the modified Fourier series model under stable nighttime and unstable daytime atmos-pheric conditions, based on the NIMEX (Nigeria Micro-meteorological Experiment) dataset in order to select the one(s) most suited to fit parameters of harmonics for the finite period at a specific location using hourly air tempera-ture data.
Materials and methods
Experimental sites
Nigeria Micrometeorological Experiment (NIMEX) (Jegede et al. 2004) was conducted at Ile Ife (Latitude 7°33′N and longitude 4°33′E) in Nigeria during the transition period from dry to wet season (Fig. 1). The period of intensive observation was from February 19th through to March 9th [day of the year (DOY) 55 through DOY 68, using Julian days notation] in 2004. This site is located in the humid equatorial region of West Africa and the climatic region is Aw class according to Kӧppen classification (Essenwanger 2001). This site is at an attitude of 288 m above sea level and its vegetation can be characterized as fallow bush-land. The ground surface of the site is flat and homogenous. The soil is loamy sand and it is at its permanent wilting condi-tion at the beginning of the experiment (Jegede et al. 2004; Mauder et al. 2006). The maximum and minimum air tem-peratures during the period of the experiment were 46.33 and 20.04 °C, respectively and the mean annual rainfall amount is 1225 mm (Otunla and Oladiran 2013).
Another phase of NIMEX-experiment was carried out at Ibadan at the experimental field of lower atmospheric physics unit (7°25′N, 3°53′E), University of Ibadan, Ibadan in Nigeria. The period of intensive observation was from

1423Model. Earth Syst. Environ. (2017) 3:1421–1439
1 3
Fig. 1 Sketch showing the position of the measurement site (Ile-Ife) in Nigeria

1424 Model. Earth Syst. Environ. (2017) 3:1421–1439
1 3
February 22nd through to March 31th (DOY 54–DOY 90) in 2006 (Fig. 2). The site is located at about 78 km from Ile-Ife. The site comprises of an area of 850 m2 of flat ter-rain at an elevation of 220 m above sea level. The soil type is loamy sand with bulk density of 1600 kgm−3 at 0.05 m depth (Adeniyi et al. 2012a). The ground surface of the target area was bare during the measurement period. The topography of the terrain surrounding the site can be clas-sified as undulating low land with few high places which are easily sighted from the site (Otunla and Oladiran 2013). The maximum and the minimum air temperature during the period of the experiment were 38.07 and 24.02 °C, respec-tively and the annual rainfall amount is 1280 mm (calculated over 50 years) (Otunla and Oladiran 2013). Simple visual test according to Foken (2003) was used on daily basis to check the quality of the basic meteorology variables (slow response) (Mauder and Foken 2004). In this research work, we are only concerned with air temperature measured during the transition period from dry to wet season.
Modeling of the diurnal pattern of air temperature
Existing air temperature models
The models selected for this study meet the following crite-ria: Firstly, all input data required for the parameterization approach are available in our data set and other weather sta-tions. Secondly, the parameterization approach are widely used (Julia et al. 2001), and they gave good results for daily to diurnal air temperature conversion. And lastly, few input parameters are required for the implementation of the mod-els, which makes them simple. Basically, all existing models stated in Table 1 below, were developed for high latitude cli-matic regions (Julia et al. 2001), and not for humid tropical region. For this reason, a new diurnal air temperature model based on the concept of Fourier series is therefore, corrected to account for the strong cooling inversion associated with equatorial climatic region.
However, application of some existing models requires that some parameters are recalculated to accurately reflect the diurnal trends of climatic variables for this region. And some adjustments were made to rise and fall time during the daylight hours. The nighttime temperature coefficient (b) that reflects the steepness of the exponential decline in temperature after sunset for Parton and Logan model (1981) was estimated as 3.2 for the two locations in this region. The value is slightly higher than ones obtained by Parton and Logan (1981) and Wann et al. (1985). The argument of the sinusoidal model of Saito and Šimůnek (2009) shows that the highest temperature is assumed to occur at 1 pm and the lowest at 1am, but for this region, the time of highest temperature for Ife and Ibadan was 2.00 pm during NIMEX period (Akinnubi and Adeniyi 2010). Moreover, in a study
on earlier period (1997–2001) than NIMEX at Ibadan, the time of maximum air temperature value extends beyond 2.00 pm (Adeniyi et al. 2012b; Adeniyi and Ogunsola 2012).
Modified fourier series model
In this research work, the fourier series model was employed to estimate the diurnal trends of air temperature using avail-able maximum and minimum air temperature. Fourier series model is represented by the following equation (Panofsky and Brier 1960; Isikwue et al. 2011)
Ci is the amplitude of the ith harmonic; Ci =√
A2i+ B2
i, tm
is the time at which its ith harmonic is at maximum is the phase angle and P is the period of observation. Ta is mean air temperature given by
Tamin = daily minimum air temperature, Tamax = daily maxi-mum air temperature.
The fourier coefficients and phase angle are expressed as
The preliminary investigation of the original fourier series analysis using the NIMEX data revealed that the strong cool-ing inversion associated with a tropical environment at night-times (stable atmospheric condition) could not be captured by the model. After sunset, a strong cooling inversion profile is expected to occur, in which temperature of the atmosphere increases with height (Fritz et al. 2008). The overnight radi-ative cooling of the surface air results in a nocturnal tem-perature inversion that leads to thermally stable condition near the earth surface. So, the original Fourier series model was modified by introducing an exponential height depend-ent function [exp(−z/H)] and atmospheric cooling rate (γ)
(2)Ta = Ta +
N∑
i=1
Ci cos[
2�
24(t − tm) − �
]
,
(3)tm =p
360arc sin
(
A
C
)
,
(4)Ta =Tamin + Tamax
2,
(5)Ai =2
N
N∕2∑
i=1
Ta sin
(
2�
pit
)
,
(6)Bi =2
N
N∕2∑
i=1
Ta cos
(
2�
pit
)
,
(7)� = arc tan
[
bi
ai
]
.

1425Model. Earth Syst. Environ. (2017) 3:1421–1439
1 3
Fig. 2 Sketch showing the position of the measurement site (Ibadan site) in Nigeria

1426 Model. Earth Syst. Environ. (2017) 3:1421–1439
1 3
which account for the temperature inversion at nighttime in humid tropical region as shown in Eq. (8). The [exp(−z/H)] explains the variation of temperature with height during the stable condition. This term is also analogous to the varia-tion of atmospheric pressure with height according to the Barotropic Law of hydrostatic equilibrium (Berberan-Santos et al. 1996). The barometric formula relates the pressure p (z) of ideal gas of molecular mass m at some height z to its pressure p(0) at height z = 0. Since pressure and temperature have a direct relationship (Berberan-Santos et al. 1996), the variation of atmospheric temperature with height is assumed to be equal to variation of atmospheric pressure with height during stable nighttime condition so that
The atmospheric scale height (H) represents the vertical distance above the soil surface at which the density or pressure of the atmosphere decreases by exactly 1/e or (2.718)−1 (Stull 1988; Rummalls and Oke 2000). And it can be calculated as
where M is the mean molecular mass of dry air (4.80 × 10⁻²⁹ kg), g = 9.80 ms−2, Ta is the mean air tempera-ture in Kelvin (K) for stable period and K is the Boltzmann’s constant (1.38 × 10⁻²³ JK−1).
The atmospheric cooling rate (γ) is computed using (Var-ghese et al. 2003).
where g is gravitational acceleration, Cv is the specific heat of air at constant pressure, and ∆p is change in atmospheric
(8)Ta = Ta +
N∑
i=1
Ci cos[
2�
24(t − tm) − �
]
e
(
−z
M
)
�.
(9)H =KTa
Mg,
(10)� =Δ�
Δt=
g
Cv
ΔQs
Δp,
pressure during the night time, ∆QS = change in net radiation during nighttime. The net flux at any level is calculated as the algebraic sum of both the downward and upward com-ponents of shortwave and long wave radiation flux density (Foken et al. 2006). The divergence of the net flux at atmos-pheric level (z) represents the rate of energy loss per unit volume of the atmosphere, or the cooling rate.
Data analysis
To evaluate the efficiency of the models, their results are compared to the measured dataset using statistical means namely the mean bias error (MBE) (average deviation between parameterized and measured data) and the RMSE (average positive distance between parameterized and meas-ured data) (Evans et al. 1993; de Miguel et al. 2001). The MBE and root mean square error (RMSE) were calculated as follows
where n is the number of observation.
Results and discussion
Diurnal variation of the atmospheric scale height
Figures 3 and 4 represent the diurnal variations of atmos-pheric scale height for Ile-Ife and Ibadan study sites, respec-tively. The diurnal value of H slightly varies for different
(11)MBE =∑ (Ta(Estimated) − Ta(Observed)
n,
(12)RMSE =
√
∑ (Ta(Estimated) − Ta(Observed)2
n,
Table 1 Existing diurnal air temperature models
Models Expressions Reference(s)
Parton modelTa(daytime) = T
min+
(
Tmax
− Tmin
)
× sin[
�
2
(
t−t1
tn−t1
)]
Parton and Logan (1981)
Ta(nighttime) = T
min+ (T
sun− T
min) × e
−bN
L
Ephrath modelTa(daytime) = T
min+(
Tmax
− Tmin
)
sin
(
�
(
t−LSH+DL
2
)
DL+2P
)
Ephrath et al. (1995)
Ta(nighttime) =
Tmin(J+1)− Tsun × exp(
−l
�
)
+(Ts− Tmin(J+1))×exp(−ta−ts
�)
1−exp(
−l
�
)
De wit modelTa(daytime) =
(Tmax+Tmin)2
−(Tmax−Tmin)
2cos
[
�
(
t−ts
tmax−t1
)] De Wit et al. (1978)
Ta(nighttime) =
(Tmax+Tmin)2
+(Tmax−Tmin)
2cos
[
�
(
t−tn
t1−tn
)]
Hirotaka modelTa= T̄ + A
tcos
[
2𝜋(
t−13
24
)]
Saito and Šimůnek (2009)

1427Model. Earth Syst. Environ. (2017) 3:1421–1439
1 3
atmospheric conditions. This diurnal variation is under-standable from the classical definition of the scale height which is positively correlated to temperature. In Fig. 3, the diurnal variation of the scale height is also clear, sug-gesting its relation to the boundary-layer processes. It was found that the scale height moved upward in the morning to arrive at the maximum height around 1200 h LT. The magnitude of H was found to be higher during the unstable atmospheric condition, with corresponding mean value of 7.8 km at mean air temperature of 27 °C. During the stable condition (Ta > Ts), the value of H (6.6 km) was not as high as that of the daytime value. For both Ile Ife and Ibadan sites, the mean daily value of H ranged from 7.7 to 7.8 km. This implies that the estimated value of H for different DOYs was almost constant. The mean value for both sites was 7.8 km (Tables 2, 3).
Diurnal variation of the atmospheric cooling rate
Figures 5 and 6 represent atmospheric cooling rate for stable case for Ile Ife and Ibadan, respectively. The diurnal trend of atmospheric cooling rate was best represented by a polyno-mial of order 8, which is of the form (Figs. 5, 6).
where i = 1, 2,….. 24, having 1 h interval through the whole day.
For Ile Ife site, the values of coefficients were—9.4228E7, 1.22208E7, −691223.67, 22336.18,−450.56, 5.80983, −0.00477, 2.1489E-4 and −4.3132E-7, respectively, the
(13)
Y = A + B1X1
i+ B2X
2
i+ B3X
3
i+ B4X
4
i
+ B5X5
i+ B6X
6
i+ B7X
7
i+ B8X
8
i,
40 80 120 160 200 240
7.5
7.6
7.7
7.8
7.9
8.0)mK(thgiehgnilacscirehpsomtA
Time of Day(Hours)
Fig. 3 Diurnal variation of atmospheric scale height for Ile-Ife site, DOY 55–DOY 70, 2004
20 40 60 80 100 1207.5
7.6
7.6
7.7
7.8
7.8
7.8
7.9
8.0)mK(thgiehelacScirehpsomtA
Time of the days(Hours)
Fig. 4 Diurnal variation of atmospheric scale height for Ibadan site, DOY 54–DOY 60, 2004
Table 2 Atmospheric scaling depth (km) and Atmospheric cooling rate estimated for NIMEX site, Ile-Ife
DOY Atmospheric scaling depth (Km)
Atmospheric cool-ing rate (Kday−1)
55 7.80 0.20656 7.80 0.22657 7.70 0.33558 7.80 0.31859 7.70 0.42560 7.70 0.40361 7.80 0.04262 7.70 0.05563 7.80 0.09464 7.70 0.11065 7.70 0.08266 7.70 0.09367 7.70 0.06368 7.70 0.05569 7.70 0.03170 7.70 0.026
Table 3 Atmospheric scaling depth (km) and atmospheric cooling rate estimated for NIMEX site, Ibadan
DOY Atmospheric scaling depth (Km)
Atmospheric cool-ing rate (Kday−1)
54 7.70 0.04855 7.70 0.16756 7.70 0.07080 7.80 0.07581 7.70 0.18282 7.70 0.03683 7.80 0.08884 7.70 0.05085 7.80 0.08386 7.80 0.07187 7.80 −0.00288 7.70 0.10889 7.70 0.09690 7.70 0.076

1428 Model. Earth Syst. Environ. (2017) 3:1421–1439
1 3
polynomial has R2 value of 0.72 and residual sum of square of 0.0425.
For Ibadan site, the values of the coefficients were −564953.036, 63334.8032, −3090.84556, 85.7743, −148,067, and 0.01628, −1.1145E-4, 4.33751E-7 and −7.3555E-10, respectively, the R2 value was 0.70 and resid-ual sum of square was 0.0162.
In Fig. 5, the magnitude of the radiation cooling rate in wet period varied from 0.017 kday−1 (DOY 55) to maximum value of 0.450 kday−1 (DOY 58), after which it decreases to 0.001 kday−1 for DOY 68 (dry day). This was due to the low soil moisture content observed during the stable condi-tion for dry days (Foken et al. 2006). In Fig. 6, the magni-tude of γ drastically reduced for days without rainfall. The least value was obtained for DOY 87 (0.035 kday−1)while higher value of 0.163 kday−1 was obtained for DOY 81(wet day).The mean cooling rate for Ile-Ife site was 0.161 kday−1, while that of Ibadan was 0.138 kday−1 (Tables 2, 3). The mean γ for wet days was 0.250 kday−1, while days without rainfall had a value of 0.0128 kday−1 for Ile-Ife site. For Ibadan site, days with rain had a mean value of 0.078 kday−1 while days without rain had a value of 0.025 kday−1 The mean daily values of γ for Ile-Ife site for DOY 55, DOY 56 and DOY 57 were 0.206, 0.226 and 0.335 kday−1, respec-tively, while DOY 61, DOY 62 and DOY 63 were 0.042,
0.055 and 0.094 kday−1, respectively. For Ibadan site, DOY 54, DOY 55 and DOY 56 had daily mean values of 0.048, 0.167 and 0.070 kday−1, respectively, while DOY 56, DOY 84 and DOY 88 had daily mean values of 0.071, −0.002 and 0.108 kday−1, respectively. These results reveal that the strongest radiation cooling occurs during wet stable atmos-pheric condition than dry stable period. The value of cooling rate for nighttime condition obtained for Ibadan was slightly higher than the value obtained for Ile-Ife site. This implies that the atmospheric cooling rate is affected by elevation above sea level, solar elevation and geographical location. High elevation sites are associated with low diurnal solar elevation (giving rise to a shadow effect), which caused low radiative cooling at nocturnal boundary layer condition (Rummalls and Oke 2000). Ibadan site elevation (220 m) is lower than that of Ile-Ife (288 m), while its solar elevation is higher when compare to Ile-Ife site (Jegede et al. 2004; Mauder et al. 2006; Rummalls and Oke 2000). This assertion supports the reason why the nocturnal cooling rate of Ibadan was higher than that of Ile-Ife site.
Comparison of the fourier series and modified fourier series models for stable atmospheric condition
The simulated stable air temperature from the original Fou-rier series model and modified Fourier series model were compared with the observations for wet and dry days for Ile-Ife and Ibadan study sites in Figs. 7(a, b) and 8(a, b), respec-tively. The stable conditions of the nocturnal boundary layer for these sites start from 1800 Hr LT to 2359 Hr LT. The Ta was strongly overestimated by the original Fourier series during the stable atmospheric condition for DOYs 55, 56 and 57 in 2004 for Ile-Ife study site. The overestimated val-ues ranged from 10 to 15 °C (Fig. 7a). The large deviation was also observed for DOY 62. This was due to the heavy rainfall that drastically reduced the night-time Ta value. The inclusion of cooling rate constant estimated using Eq. 10 affected the diurnal variation of the air temperature during the stable nighttime condition for the two locations. The modified Fourier series model showed a better agreement for stable nighttime conditions for both wet and dry days (Fig. 7b). For Ibadan site in 2006, the results of the modified Fourier model is approximately the same as the measured data, but a slight overestimation of Ta of about 2–3 °C was observed for DOY 83 and DOY 84, respectively. The cool-ing term had slight effect on the diurnal variation of Ta for DOY 85 (Fig. 8b) due to the slight increase in wind speed. It was also observed from the figures that the performance of the modified model was better during wet days at Ile-Ife than Ibadan site. This can be attributed to the slight diurnal variations of the inversion height observed across the trop-ics (Liu 1990).
54 56 58 60 62 64 66 68 70 72
0.0
0.1
0.2
0.3
0.4
0.5dK(etargnilooccirehpsomtA-1 )
DOY, 2004
Fig. 5 Atmospheric cooling rate variations for night-time case at Ile-Ife from DOY 55 to DOY 70, 2004
80 82 84 86 88 90
0.00
0.05
0.10
0.15
0.20
etargnilooccirehpsomtA(kd
-1 )
DOY, 2006
Fig. 6 Atmospheric cooling rate variations for nighttime case at Ibadan site from DOY 55 to DOY 56 and DOY 80–DOY 90, 2006

1429Model. Earth Syst. Environ. (2017) 3:1421–1439
1 3
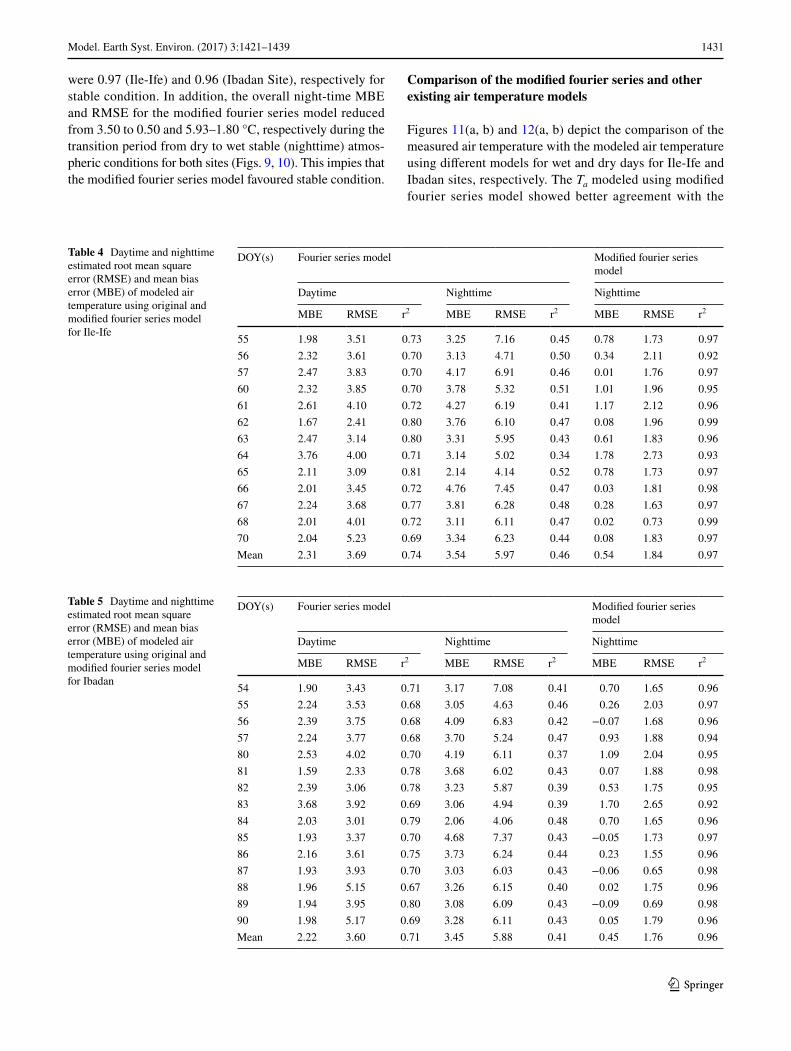
Figures 9 and 10 show the scatter plots of the measured and estimated Ta from original fourier series and modi-fied fourier series models during stable nighttime con-dition. The scatter in the graphs was reduced drastically, especially for small values of Ta simulated by the modified fourier series model. This was due to the inclusion of the cooling rate constant to the original model for nighttime conditions. The original fourier series model had a good performance for daytime conditions, with high r2 values and low MBE and RMSE values, whereas the performance of the model was poor during the stable nighttime condi-tions, with low r2 values and high MBE and RMSE values (Table 4). The ranges of r2, MBE and RMSE for daytime
conditions (original fourier series model)at Ile-Ife site were 0.69–0.81, 1.67–3.76 and 2.41–5.23 °C, respectively, while that of nighttime conditions were 0.34–0.52, 2.14–4.76 and 4.14–7.45 °C, respectively (Tables 4, 5). Also, the ranges of r2, MBE and RMSE for daytime conditions (original fourier series model) at Ibadan site were 0.67–0.80, 1.59–3.68 and 2.33–5.17 °C, respectively, while that of nighttime condi-tions were 0.37–0.48, 2.06–4.68 and 4.06–7.37 °C, respec-tively (Tables 4, 5). The modified Fourier series model for nighttime conditions had low MBE and RMSE values, rang-ing from −0.07 to 0.78 and 0.65–2.73 °C respectively, with high r2 values, ranging from 0.92 to 0.99 (Tables 4, 5) at both sites. The mean r2 value of the modified Fourier model
Fig. 7 a Comparisons of meas-ured air temperature with mod-eled air temperature for stable nighttime atmospheric condition using fourier series and modi-fied fourier series models at Ife site for DOYs 55–57(wet days), 2004. b Comparisons of measured air temperature with modeled air temperature for stable nighttime atmospheric condition using fourier series and modified fourier series models at Ife site for DOYs 60–62 (dry days), 2004
20
30
40
50
60
70
MEASURED DATA MODIFIED FOURIER SERIES MODELORIGINAL FOURIER SERIES MODEL
ERUTAREPMET
RIA(O C)
TIME OF THE DAY(HOURS)24222018 24222018 24222018
20
30
40
50
60
70 MEASURED DATA MODIFIED FOURIER SERIES MODELORIGINAL FOURIER SERIES MODEL
ERUTAREPMET
RIA(O C)
TIME OF THE DAY(HOURS)24222018 24222018 24222018
(a)
(b)

1430 Model. Earth Syst. Environ. (2017) 3:1421–1439
1 3
Fig. 8 a Comparisons of meas-ured air temperature with mod-eled air temperature for stable nighttime atmospheric condition using Fourier series and modi-fied Fourier series models at Ibadan site for DOYs 55–57 (wet days), 2006, b comparisons of measured air temperature with modeled air temperature for stable nighttime atmospheric condition using fourier series and modified fourier series models at Ibadan site for DOYs 83–85 (dry days), 2006
20
25
30
35
40
45
50
55
60
65
70
75 MEASURED DATA MODIFIED FOURIER SERIES MODELORIGINAL FOURIER SERIES MODEL
ERUTAREPMET
RIA(O C)
TIME OF THE DAY(HOURS)24222018 24222018 24222018
20
25
30
35
40
45
50
55
60
65
70
75 MEASURED DATA MODIFIED FOURIER SERIES MODELORIGINAL FOURIER SERIES MODEL
ERUTAREPMETRIA
(O C)
TIME OF THE DAY(HOURS)24222018 24222018 24222018
(a)
(b)
20 22 24 26 28 30 32 34 36 38 402022242628303234363840
Modified Fourier series modelN=114r2 = 0.97RMSE = 0.82OCMBE= 0.56OC
Fouries series modelN=114r2 = 0.40RMSE = 5.97OCMBE= 3.66OC
Modified Fourier series model Fourier series model
erutarepmeTriA
detaluclaC(o C)
Measured Air Temperature(oC)
Fig. 9 Scatter plot showing the stable measured Air Temperature and estimated Air temperature for Ile-Ife, 2004
24 26 28 30 32 34 36 38 40
24
26
28
30
32
34
36
38
40
Modified Fouries series modelN=114r2 = 0.98RMSE = 1.10OCMBE= 0.78OC
Fouries series modelN=114r2 = 0.42RMSE = 4.81OCMBE = 3.02OC
FOURIER SERIES MODEL MODIFIED FOURIER SERIES MODEL
erutarepmeTriAdetaluclaC(o C )
Measured Air temperature(oC)
Fig. 10 Scatter plot showing the stable measured air temperature and estimated air temperature for Ibadan Site, 2006
1431Model. Earth Syst. Environ. (2017) 3:1421–1439
1 3
were 0.97 (Ile-Ife) and 0.96 (Ibadan Site), respectively for stable condition. In addition, the overall night-time MBE and RMSE for the modified fourier series model reduced from 3.50 to 0.50 and 5.93–1.80 °C, respectively during the transition period from dry to wet stable (nighttime) atmos-pheric conditions for both sites (Figs. 9, 10). This impies that the modified fourier series model favoured stable condition.
Comparison of the modified fourier series and other existing air temperature models
Figures 11(a, b) and 12(a, b) depict the comparison of the measured air temperature with the modeled air temperature using different models for wet and dry days for Ile-Ife and Ibadan sites, respectively. The Ta modeled using modified fourier series model showed better agreement with the
Table 4 Daytime and nighttime estimated root mean square error (RMSE) and mean bias error (MBE) of modeled air temperature using original and modified fourier series model for Ile-Ife
DOY(s) Fourier series model Modified fourier series model
Daytime Nighttime Nighttime
MBE RMSE r2 MBE RMSE r2 MBE RMSE r2
55 1.98 3.51 0.73 3.25 7.16 0.45 0.78 1.73 0.9756 2.32 3.61 0.70 3.13 4.71 0.50 0.34 2.11 0.9257 2.47 3.83 0.70 4.17 6.91 0.46 0.01 1.76 0.9760 2.32 3.85 0.70 3.78 5.32 0.51 1.01 1.96 0.9561 2.61 4.10 0.72 4.27 6.19 0.41 1.17 2.12 0.9662 1.67 2.41 0.80 3.76 6.10 0.47 0.08 1.96 0.9963 2.47 3.14 0.80 3.31 5.95 0.43 0.61 1.83 0.9664 3.76 4.00 0.71 3.14 5.02 0.34 1.78 2.73 0.9365 2.11 3.09 0.81 2.14 4.14 0.52 0.78 1.73 0.9766 2.01 3.45 0.72 4.76 7.45 0.47 0.03 1.81 0.9867 2.24 3.68 0.77 3.81 6.28 0.48 0.28 1.63 0.9768 2.01 4.01 0.72 3.11 6.11 0.47 0.02 0.73 0.9970 2.04 5.23 0.69 3.34 6.23 0.44 0.08 1.83 0.97Mean 2.31 3.69 0.74 3.54 5.97 0.46 0.54 1.84 0.97
Table 5 Daytime and nighttime estimated root mean square error (RMSE) and mean bias error (MBE) of modeled air temperature using original and modified fourier series model for Ibadan
DOY(s) Fourier series model Modified fourier series model
Daytime Nighttime Nighttime
MBE RMSE r2 MBE RMSE r2 MBE RMSE r2
54 1.90 3.43 0.71 3.17 7.08 0.41 0.70 1.65 0.9655 2.24 3.53 0.68 3.05 4.63 0.46 0.26 2.03 0.9756 2.39 3.75 0.68 4.09 6.83 0.42 −0.07 1.68 0.9657 2.24 3.77 0.68 3.70 5.24 0.47 0.93 1.88 0.9480 2.53 4.02 0.70 4.19 6.11 0.37 1.09 2.04 0.9581 1.59 2.33 0.78 3.68 6.02 0.43 0.07 1.88 0.9882 2.39 3.06 0.78 3.23 5.87 0.39 0.53 1.75 0.9583 3.68 3.92 0.69 3.06 4.94 0.39 1.70 2.65 0.9284 2.03 3.01 0.79 2.06 4.06 0.48 0.70 1.65 0.9685 1.93 3.37 0.70 4.68 7.37 0.43 −0.05 1.73 0.9786 2.16 3.61 0.75 3.73 6.24 0.44 0.23 1.55 0.9687 1.93 3.93 0.70 3.03 6.03 0.43 −0.06 0.65 0.9888 1.96 5.15 0.67 3.26 6.15 0.40 0.02 1.75 0.9689 1.94 3.95 0.80 3.08 6.09 0.43 −0.09 0.69 0.9890 1.98 5.17 0.69 3.28 6.11 0.43 0.05 1.79 0.96Mean 2.22 3.60 0.71 3.45 5.88 0.41 0.45 1.76 0.96

1432 Model. Earth Syst. Environ. (2017) 3:1421–1439
1 3
measured data for both wet and dry days (Fig. 11a). The modified fourier series model was relatively close to the measured value during the stable period than the unsta-ble period although, the model showed an overestimation (4–6 °C) of Ta during the early hour of the night for DOY 55 for Ibadan site (Fig. 12a). It was also observed from Table 6 that the first harmonic dominates the periodic component in the hourly average air temperature of all the sites since it has the highest contribution of 93 and 92% for Ile-Ife and Ibadan sites, respectively. This implies that the contribution of the second and third harmonics for each site is negligible, thus the information about them is discarded. The bulk of the total variance is contained in the first harmonic term. This result is in agreement with the work of Kothandara-man (2007) in which the application of harmonic analysis to daily mean air, water temperature records indicated that the first harmonic accounted for a major portion of the total variance in the record.
The sinusoidal Hirotaka model proposed by Saito and Šimůnek (2009) overestimated Ta by 5–6 °C during the late hour of the night (DOY 56) for Ile-Ife. The modeled Ta by Hirotaka model was close to the observed data in the morn-ing (800Hr LT) on DOY 55 (Ile-Ife). The performance of the Hirotaka model was very poor for DOY 56 (Fig. 11a). This is due to the drastic drop in the observed maximum and mini-mum air temperature. The peak of the modeled Ta was out of phase with the observed at midday on DOY 60, though the modeled Ta was strongly underestimated in the morning. The overall result revealed that Hirotaka model underestimated Ta by 6–8 °C during the unstable atmosphere condition at Ile-Ife. For Ibadan site, the Hirotaka model overestimated Ta by about 5–6 °C in the morning on DOY 55, and during the mid-day, the peak of the maximum Ta was underestimated by about 3–4 °C. However, the model performed relatively better during the nighttime for DOY 83, although a slight overestimation of Hirotaka modeled Ta by about 3–4 °C still
Fig. 11 a Wet days compari-sons of measured air tempera-ture with modeled air tempera-ture using different models at Ile-Ife site for DOYs 55–57, 2004. b Dry day comparisons of measured air temperature with modeled air temperature using different models at Ile-Ife site for DOYs 60–63, 2004
0 20 40 60 80
20
22
24
26
28
30
32
34
36
Measured data Hirotaka modell Ephrath Model de Wit model Modified Fourier model Parton model
Air T
empe
ratu
re(o C
)
Time of the day(hours)
DOYs 55-57
0 10 20 30 40 50 60 70 8020
22
24
26
28
30
32
34
Measured data Hirotaka modell Ephrath Model de Wit model Modified Fourier model Parton model
Air Te
mpera
ture(o C)
Time of the day(hours)
(a)
(b)

1433Model. Earth Syst. Environ. (2017) 3:1421–1439
1 3
occurred during the evening hours. For DOY 82, the mod-eled Ta was very close to the measured data for both the unstable and stable atmospheric conditions. Similar behav-iour was observed for DOY 84, though with slight underes-timation during the morning hours (600–1000Hr LT). The performance of the model was better during the dry days than wet days for unstable atmospheric condition.
At Ile-Ife site, the de Wit model strongly overestimated measured Ta for both stable and unstable conditions by about 5–7 and 4–5 °C, respectively during the dry period (Fig. 11b). The modeled Ta was slightly overestimated by 2 °C during the midday for DOY 60 and other days followed
the same pattern. At Ibadan site, the performance of the model was very poor for both unstable and stable atmos-pheric condition for DOY 85. For DOY 84 (dry day), the modeled Ta was strongly overestimated by about 6–7 °C dur-ing the unstable period, while it was overestimated by about 4–5 °C for stable period (Fig. 12b). But during the wet days (DOY 56 and DOY 57), the nighttime values of the mod-eled Ta almost approximated the measured value, while the daytime modeled Ta was still overestimated by about 3–4 °C in the morning. It is obvious from Figs. 11 and 12, that the performance of this model was better during wet period than dry period.
Fig. 12 a Wet days comparison of measured air temperature with modeled air temperature using different models at Ibadan site on DOYs 55–57, 2006. b Dry days comparison of measured air temperature with modeled air temperature using different models at Ibadan site on DOYs 83–85, 2006
0 10 20 30 40 50 60 70 80
Measured data Hirotaka modell Ephrath Model de Wit model Modified Fourier model Parton model
Air T
empe
ratur
e(o C)
Time of the day(hours)
wet composite
5
10
15
20
25
30
35
40
45DOYs 55-57
0 10 20 30 40 50 60 70 80
22
24
26
28
30
32
34
Measured data Hirotaka modell Ephrath Model de Wit model Modified Fourier model Parton model
Air Te
mpera
ture(o C)
Time of the day(hours)
(a)
(b)
Table 6 Parameters of the first three harmonic functions for Ile-Ife and Ibadan study sites using the fourier series model
Location(s) Term(s) Amplitude Phase a b %variance
Ile-Ife 1 2.89 0.95 1.86 2.28 932 2.82 0.06 1.11 −1.56 203 8.20 017 −0.17 0.12 10
Ibadan 1 2.83 0.09 1.05 2.20 912 2.80 −0.21 −0.65 −0.77 233 2.80 −0.49 0.14 −1.32 5

1434 Model. Earth Syst. Environ. (2017) 3:1421–1439
1 3
The Ephrath model strongly overestimated Ta by about 4–6 °C during the daytime, especially in the morning (Fig. 11a). The peak of the estimated Ta was generally out of phase with the observed value for all the selected days. For DOY 56 at Ile-Ife site, the model performed better for night-time situation, while for DOY 62, the model showed a strong underestimation during the early hours of the day by about 10–15 °C. At Ibadan site, the modeled Ta was rela-tively close to the measured value for DOY 55, DOY 83 and DOY 85 during the nighttime, though a slight underestima-tion by about 2–3 °C was observed for dry days (Fig. 11a, b). The performance of the model during daytime situation was generally poor, especially for early hours in dry days for Ephrath model. This model simulated Ta well on dry days for nighttime only.
The modeled Ta by the Parton model was relatively close to the observed data for nighttime situation, except for the strong overestimation observed in the morning hours on DOYs 55 and 57 for Ile-Ife site. The peak of the maximum Ta was almost in phase with measure data (Fig. 11a). At Ibadan site, Parton model slightly underestimated Ta by 2–3 °C dur-ing the late hours of the day for DOY 56 (Fig. 12b). The Parton model seems to model Ta better at midday for wet periods (Fig. 12b). For DOY 84, the model showed an unu-sual behaviour with the measured Ta during the midday, with strong underestimated of about 10–12 °C. This implies that the Parton modeled Ta was affected by atmospheric condi-tions. Generally, the model performance was good for unsta-ble condition during dry days than wet days at Ibadan site.
Figure 13 represents the composite of diurnal variations of Ta simulated by different models for wet and dry days,
Fig. 13 a Wet composite comparisons of measured air temperature with modeled air temperature using different models at Ile-Ife site for DOYs 55–57, 2004. b Dry composite comparisons of measured air temperature with modeled air temperature using different models at Ile-Ife site for DOYs 59–70, 2004
2 4 6 8 10 12 14 16 18 20 22 2422
24
26
28
30
32
34
Measured data Hirotaka modell Ephrath Model de Wit model Modified Fourier model Parton model
Air Te
mpera
ture(o C)
Time of the day(hours)
DOYs 55-57
0 2 4 6 8 10 12 14 16 18 20 22 24 26
22
24
26
28
30
32
34 Measured data Hirotaka modell Ephrath Model de Wit model Modified Fourier model Parton model
Air T
empe
ratu
re(o C)
Time of the day(hours)
DOYs 59-70
(a)
(b)

1435Model. Earth Syst. Environ. (2017) 3:1421–1439
1 3
respectively for Ile-Ife site while, Fig. 14 represents simi-lar variations at Ibadan. The working principles of Parton, Ephrath, Hirotaka and de Wit models are similar to the Fou-rier series model; which according to the modification is now a physically-based model. The performance of these models are better for daytime Ta parameterization on dry days than wet days. Although, some large deviations were still simulated by de Wit and Parton models during the morning and early night-time on wet and dry days, respec-tively. The Hirotaka model performs better at midday but accumulated large overestimates in the late afternoon and early night-time. In general, the performance of some exist-ing models revealed large deviations from the measured data in the morning and late hours of the night-time. Therefore, it can be concluded that these existing models could not accu-rately capture the strong cooling inversion associated with a humid tropical region. The performances of the models are good on some specific days however, on the average the existing models simulated Ta with high bias during stable condition. The biggest cause of error in these models is the
occurrence of temperature extreme at time far removed from the time assumed by the models. In other word, the assumed fixed Tmin and Tmax for this region violated some assumptions of some existing models. Another potential error encoun-tered by some models is the inability to capture properly the strong tropical cooling inversion at night. The modified Fourier series model which accounted for cooling inversion in the tropics showed a better result for dry and wet compos-ite diurnal variations for the two sites.
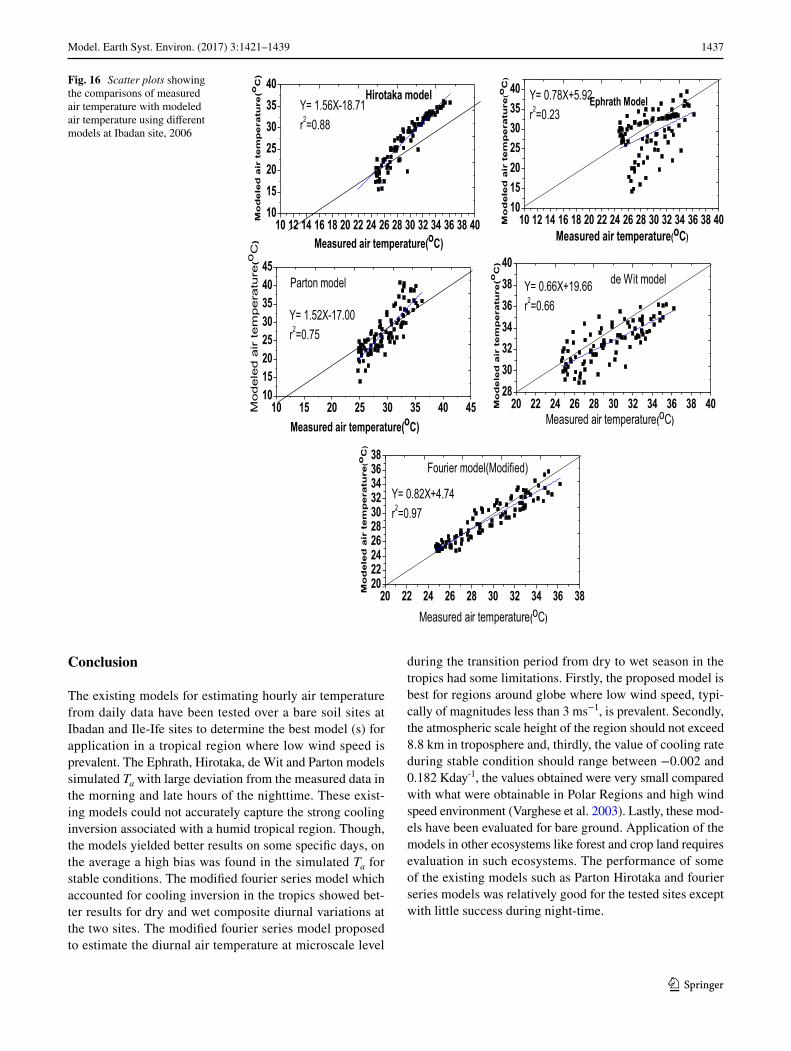
The comparisons of scatter plots of hourly estimated Ta versus measured Ta are shown in Figs. 15 and 16 for Ile-Ife and Ibadan sites, respectively. The diagonal line on the fig-ures represents the ideal match between the estimated and measured values of Ta. The modified fourier series model estimated better values of Ta than the other models because the model parameters of the fourier series are more depend-ent on the location. The modified fourier series model had small scatter (Fig. 15) and the mean values of r2 were 0.97 and 0.98 for Ile-Ife and Ibadan sites, respectively. The lin-ear fit gave slopes close to 1.00 of 0.82 (Ibadan) and 0.79
Fig. 14 a Wet days composite comparison of measured air temperature with modeled air temperature using different models at Ibadan site for DOYs 55–57, 2006. b Dry days com-posite comparison of measured air temperature with modeled air temperature using different models at Ile-Ife site for DOYs 80–92, 2006
0 2 4 6 8 10 12 14 16 18 20 22 24 26
Measured data Hirotaka modell Ephrath Model de Wit model Modified Fourier model Parton model
Air Te
mpera
ture(o C)
Time of the day(hours)
10121416182022242628303234363840
0 2 4 6 8 10 12 14 16 18 20 22 24 26
24
26
28
30
32
34
Measured data Hirotaka modell Ephrath Model de Wit model Modified Fourier model Parton model
Air Te
mpera
ture(o C)
Time of the day(hours)
(a)
(b)

1436 Model. Earth Syst. Environ. (2017) 3:1421–1439
1 3
(Ile-Ife), respectively, while the values of the intercept (4.94) were almost the same for the two sites. The Ephrath model had a large scatter with high RMSEs of 4.76 °C (Ile-Ife) and 3.76 °C (Ibadan) for wet days, respectively, and almost the same large errors were also obtained for dry days for two sites. The r2 value obtained for Ibadan site was 0.33 while that of Ile-Ife was 0.53. So, it can be seen that the performance of the Ephrath model at Ibadan site was very poor (Table 3). The linear fit gave slopes ranging from 0.78 to 1.22 and intercept ranging from −7.66 to −5.93, respec-tively. The scatter plots reveal partly strong underestimation for small values of Ta. Furthermore, for Hirotaka model, the graphs revealed small scatter, with r2 value of 0.88 obtained at Ile-Ife study site. For Ibadan, the scatter was moderate with r2 value of 0.68 for dry periods. The average slopes for the two sites were 1.56 and 1.22, respectively. de Wit model had r2 value of 0.82 with the slope less than one for dry days at Ibadan site (Fig. 15). The linear regression of the de Wit model showed tendency towards underestimation during the night-time for both sites. The Parton model had a small scat-ter as well as high r2 value of 0.82 (Fig. 16) with intercepts ranging from −7.83 to −17.00 °C for dry days at Ibadan site, its performance during wet days was also better.
Table 7 shows the overall statistical estimates of Ta (mean bias error and relative RMSE) obtained for Ibadan and Ile-Ife study sites, respectively. Comparing the RMSE and MBE of Ta, small errors were observed for modified fourier series model (which varied from −0.01 to −1.79 °C for MBE; 1.23 to 1.76 °C for RMSE for wet and dry days for both sites). Ephrath and de Wit models gave high RMSE values of 3.76–4.76 °C for wet days; 4.27–4.87 °C for dry days and 2.98–5.92 °C for wet days; 2.98–4.95 °C for dry days, respectively for both sites. The modified Fourier series model gave high coefficient of determination (r2) ranging from 0.95 to 0.98 at Ile-Ife site. The Parton model also showed a good performance for both sites, with average RMSE values of 2.54 and 2.08 in Ile-Ife and Ibadan sites, respectively, and corresponding r2 value ranging from 0.75 to 0.82. The modified fourier series model gave the best result with respect to the existing models considered. This is because it gave the least error values at both sites and parameterized the air temperature value better. The more substantial decrease in error term of original fourier series model resulted from the incorporation of the atmosphere scaling height and cooling rate estimated for the locations, which affect the diurnal variation of the air temperature.
Fig. 15 Scatter plots showing the comparisons of measured air temperature with modeled air temperature using different models at Ile- Ife site, 2004
10 15 20 25 30 35 4010152025303540
20 25 30 35 4020
25
30
35
40
20 22 24 26 28 30 32 34 36 38 402628303234363840
20 22 24 26 28 30 32 34 36 38 402022242628303234363840
20 22 24 26 28 30 32 34 3610152025303540
erutare
pmet
riadele
do
M(o
C)
Measured air temperature(oC)
Y= 1.22X-9.09r2=0.64
Hirotaka model
Mo
del
ed a
ir t
emp
erat
ure
(oC
)
Measured air temperature(oC)
Ephrath ModelY= 1.22X-7.65r2=0.64
Y= 0.47X-18.63r2=0.68
erutare
pmet
riadele
do
M(o
C)
Measured air temperature(oC)
de Wit model
Y= 0.79X+4.74r2=0.98
erutare
pmet
riadele
do
M(o
C)
Measured air temperature(oC)
Fourier model(modified)
Y= 1.22X-7.83r2=0.74
Mo
del
ed a
ir t
emp
erat
ure
(oC
)
Measured air temperature(oC)
Parton model
1437Model. Earth Syst. Environ. (2017) 3:1421–1439
1 3
Conclusion
The existing models for estimating hourly air temperature from daily data have been tested over a bare soil sites at Ibadan and Ile-Ife sites to determine the best model (s) for application in a tropical region where low wind speed is prevalent. The Ephrath, Hirotaka, de Wit and Parton models simulated Ta with large deviation from the measured data in the morning and late hours of the nighttime. These exist-ing models could not accurately capture the strong cooling inversion associated with a humid tropical region. Though, the models yielded better results on some specific days, on the average a high bias was found in the simulated Ta for stable conditions. The modified fourier series model which accounted for cooling inversion in the tropics showed bet-ter results for dry and wet composite diurnal variations at the two sites. The modified fourier series model proposed to estimate the diurnal air temperature at microscale level
during the transition period from dry to wet season in the tropics had some limitations. Firstly, the proposed model is best for regions around globe where low wind speed, typi-cally of magnitudes less than 3 ms−1, is prevalent. Secondly, the atmospheric scale height of the region should not exceed 8.8 km in troposphere and, thirdly, the value of cooling rate during stable condition should range between −0.002 and 0.182 Kday-1, the values obtained were very small compared with what were obtainable in Polar Regions and high wind speed environment (Varghese et al. 2003). Lastly, these mod-els have been evaluated for bare ground. Application of the models in other ecosystems like forest and crop land requires evaluation in such ecosystems. The performance of some of the existing models such as Parton Hirotaka and fourier series models was relatively good for the tested sites except with little success during night-time.
Fig. 16 Scatter plots showing the comparisons of measured air temperature with modeled air temperature using different models at Ibadan site, 2006
10 12 14 16 18 20 22 24 26 28 30 32 34 36 38 4010152025303540
10 12 14 16 18 20 22 24 26 28 30 32 34 36 38 4010152025303540
20 22 24 26 28 30 32 34 36 38 4028303234363840
20 22 24 26 28 30 32 34 36 3820222426283032343638
10 15 20 25 30 35 40 451015202530354045
Y= 1.56X-18.71r2=0.88
erut
are
pm
etri
ad
ele
do
M(o
C)
Measured air temperature(oC)
Hirotaka model Y= 0.78X+5.92r2=0.23
Mo
dele
d a
ir t
em
pera
ture
(oC
)
Measured air temperature(oC)
Ephrath Model
Measured air temperature(oC)
Y= 0.66X+19.66r2=0.66
Mo
dele
d a
ir t
em
pera
ture
(oC
)
de Wit model
Fourier model(Modified)
Y= 0.82X+4.74r2=0.97
erut
are
pm
etri
ad
ele
do
M(o
C)
Measured air temperature(oC)
Y= 1.52X-17.00r2=0.75
erut
are
pm
etri
ad
ele
do
M(o
C)
Measured air temperature(oC)
Parton model

1438 Model. Earth Syst. Environ. (2017) 3:1421–1439
1 3
Acknowledgements The authors appreciate the cooperation of the other members of The Nigerian Micrometeorological Experiment (NIMEX-1) group, for making the NIMEX-1 project a reality. The NIMEX-1 project was sponsored by International Programmes in the Physical Sciences (IPPS), Sweden, African Regional Centre for Space Sciences and Technology Education, Ile-Ife, Nigeria and National Space Research and Development Agency, Abuja, Nigeria.
Open Access This article is distributed under the terms of the Creative Commons Attribution 4.0 International License (http://crea-tivecommons.org/licenses/by/4.0/), which permits unrestricted use, distribution, and reproduction in any medium, provided you give appro-priate credit to the original author(s) and the source, provide a link to the Creative Commons license, and indicate if changes were made.
References
Adeniyi MO, Ogunsola OE (2012) Assessment of the performance of the drag and bulk transfer method in estimating sensible and latent heat fluxes in a tropical station. Theor Appl Climatol 107:511–518
Adeniyi MO, Oshunsanya SO, Nymphas EF (2012a). Validation of analytical algorithms for the estimation of soil thermal properties using de-Vries model. Am J Sci Ind Res 3(2):103–114
Adeniyi MO, Nymphas EF, Oladiran EO (2012b) Characteristics of total solar radiation in an urban tropical environment. Int J Phys Sci 7(30):5154–5161. doi:10.5897/IJPS09.253
Akinnubi RT, Adeniyi MO (2010) Investigation of the surface energy budget at NIMEX_3 site, Ibadan, using Bowen ratio energy bal-ance method. Int J Eng Math Intell 1:1–3
Atsu SS, David BA (2000) Harmonic analysis of global irradiation. Renew Energy 20(4):435–443
Balyani S, Younes K, Fardin G, Maryam N, Ali B (2017) Modeling the spatial structure of annual temperature in Iran. Model Earth Syst Environ 3(2):581–593
Berberan-Santos M, Bodunov EN, Pogliani L (1996) On the barometric formula. Am J Phys 65:404
de Wit CT, Goudriaan, van Laar HH (1978) Simulation, respiration and transpiration of crops. In: Simulation monographs. Pudoc, Wageningen, p 141
de Miguel A, Bilbao J, Aguiar R, Kambezidis H, Negro E (2001) Dif-fuse solar irradiation model evaluation in the north Mediterranean belt area. Sol Energy 70:143–153
Ephrath JE, Goudriaan J, Marani A (1996) Modelling diurnal patterns of air temperatures, radiation, wind speed and relative humidity by equations for daily characteristics. Agric Syst 51:377–393
Essenwanger OM (2001) Classification of climates, world survey of climatology 1C, general climatology. Elsevier, Amsterdam, p 102
Evans M, Hastings N, Peacock B (1993) Statistical distributions. Wiley, New York, pp 56–67
Foken T (2003) Angewande meteorologie. Mikrometeorologische methoden. Springer, Heidelberg, p 289
Foken T, Wimmer F, Mauder M, Thomas C, Liebethal C (2006) Some aspects of the energy balance closure problem. Atmos Chem Phys 6:4395–4402
Fritz BK, Hoffmann WC, Lan Y, Thompson SJ, Huang Y (2008) Low-level atmospheric temperature inversions: characteristics and impacts on aerial applications. Agric Eng Int CIGR Ejournal, Manuscript PM 08 001, Vol X
Goudrian J, Waggoner PE (1972) Simulating both aerial micro-climate and soil temperature above the foliar canopy. Neth J Agric Sci 20:104–124
Isikwue BC, Agada OI, Utah EU, Okeke FN (2011) Application of harmonic analysis in the preliminary prediction of air temperature over Lagos and Abuja, Nigeria. Br J Environ Change 1(3):53–65
Jegede OO, Okogbue EC, Balogun EE (2004) Proceedings of the workshop and the Nigeria Micro-meteorological experiment (NIMEX—1 15 July, 2004), Ile-Ife, Nigeria
John SE, Schroll ER (1997) An empirical model of diurnal temperature pattern. Agron J 89:542
Julia B, Argimiro H. Harry DK (2001) Air temperature model evalu-ation in the North Mediterranean Belt area. Appl Meteorol 41:872–880
Jury WA, Horton R (2003) Soil Physics, sixth ed. Wiley, New YorkKothandaraman V (2007) Air-water temperature relationship in the
Illinois River. JAWRA 8(1):38–45Lemon E, Stewart DW, Shawcroft RW (1972). The variation of air tem-
perature in a cornfield. Science (Washington DC) 174:371–373Lidija C (2007) Harmonic analysis of the seasonal cycle in temperature
over the Biokovoarea (Croata). Int J Clim 15(10):1151–1159Liu FH (1990) Climatological study of temperature inversion layers
in the northern hemispheric troposphere. Climatological notes, vol. 39, pp 1–80
Table 7 Summary of the Overall Root Mean Square Error (RMSE) and Mean Bias Error (MBE) of modeled air temperature using different models for Ile-Ife and Ibadan
Location(s)
Models Wet period Dry period
MBE (oC) RMSE (oC) r2 MBE (oC) RMSE (oC) r2
Ile-Ife Hirotaka model 0.24 1.15 0.64 −2.07 4.29 0.88 Epthrath model −4.97 4.76 0.67 3.26 4.87 0.33 de Wit model −3.76 4.92 0.68 −3.31 2.98 0.68 Fourier series model (modified) −0.04 1.23 0.97 0.71 1.76 0.97 Parton model 1.12 2.54 0.74 −1.57 4.08 0.72
Ibadan Hirotaka model −1.24 2.15 0.68 −4.23 4.79 0.68 Epthrath model −2.97 3.76 0.71 0.26 1.87 0.56 de Wit model 3.76 5.92 0.66 −3.31 4.98 0.82 Fourier series model (modified) −0.24 0.94 0.96 −1.36 1.61 0.95 Parton model 0.76 1.54 0.82 −2.57 3.08 0.82

1439Model. Earth Syst. Environ. (2017) 3:1421–1439
1 3
Mauder M, Foken T (2004) Documentation and instruction manual of the eddy covariance software package TK2. Arbeitsergebnisse. Univ Bayreuth Abt Mikrometeorol 26:44 (Print, ISSN 1614–8916; Internet, ISSN 1614–8926)
Mauder M, Jegede OO, Okogbue EC, Winmer F, Foken T (2006) Sur-face energy balance measurement at a tropical site in West Africa during the transition from dry to wet season. Theor Appl Climatol 88:171
Otunla TA, Oladiran OA (2013) Evaluation of soil thermal diffusivity algorithms at two equatorial sites in West Africa. Ann Geophys 56(1):R0101. doi:10.4401/Ag-617
Pandey PK, Vanita P (2016) Evaluation of temperature-based Pen-man–Monteith (TPM) model under the humid environment. Model Earth Syst Environ 2:152. doi:10.1007/s40808-016-0204-9
Panofsky HA, Brier GW (1960) Some applications of statistics to mete-orology. Penn. State University, College of Earth and Mineral Sciences, 1968, University Park
Parton WJ, Logan JA (1981) A model for diurnal variation of soil and air temperature. Agric Meteorol 23:205–216
Prasanta D, Somenath D, Shyamal K, Ansar K (2016) Momentum flux and energy flux associated with internal gravity waves excited by the Assam-Burma hills in India. Model Earth Syst Environ 2:62. doi:10.1007/s40808-016-0118-6
Reicosky DC, Winkelman LJ, Baker JM, Barker DG (1989) Accu-racy of hourly air temperature calculated from daily minima and maxima. Agric Meteorol 46:193–209
Rummalls KE, Oke TR (2000) Dynamics and controls of the near-surface heat island of Vancouver, British Columbia. Phys Geogr 21:281–304
Saito H, Šimůnek J (2009) Effects of meteorological models on the solution of the surface energy balance and soil temperature vari-ations in bare soils. Hydrology 373(3–4):545–561
Saito H, Šimunek J, Mohanty BP (2006) Numerical analysis of coupled water, vapor, and heat transport in the vadose zone. Vadose Zone J 5:784–800
Shiferaw E, Chaemiso A, Abebe S, Murlidhar P (2016) Assessment of the impact of climate change on surface hydrological processes using SWAT: a case study of Omo-Gibe river basin, Ethiopia Model. Earth Syst Environ 2:205
Stull RB (1988) An introduction to boundary layer meteorology. Klu-wer Academic Publishers, Norwell, p 670
Varghese S, Vasudeva Murthy AS, Narasimha R (2003) A fast, accurate method for computation of infrared fluxes and cooling rates in the atmosphere down to the surface. J Atmos Sci 60:2869–2886
Wann M, Yen D, Gold HJ (1985) Evaluation and calibration of three models for daily cycle of air temperature. Agric Forest Meteorol 34(2–3):121–128


![Diurnal and Nocturnal Animals. Diurnal Animals Diurnal is a tricky word! Let’s all say that word together. Diurnal [dahy-ur-nl] A diurnal animal is an.](https://static.fdocuments.in/doc/165x107/56649dda5503460f94ad083f/diurnal-and-nocturnal-animals-diurnal-animals-diurnal-is-a-tricky-word-lets.jpg)