Tutorial for using Titan2D 4.0.0, online simulation tool ...
Upload
jggalarzazCategory
view
23download
2
MODELING LAHARS USING TITAN2D FOR THE SOUTHERN DRAINAGE OF VOLCÁN COTOPAXI:
IMPACT ON THE CITY OF LATACUNGA
By
Rebecca Williams 1st September 2006
A thesis submitted to the Faculty of the Graduate School of
the State University of New York at Buffalo in partial fulfillment of the requirements for the
degree of
Master of Science
Department of Geology

Acknowledgements I would like to thank Dr M. Sheridan for the guidance, support and inspiration he has
given to me over the course of the last two years.
Thank you to Dr M. Bursik and Dr C. Renschler for all advice and kind words.
To K. Dalbey and Dr A. Patra I remain indebted for all the help they provided with
Titan2D.
Logistical support was provided by the Instituto Geofísico, Quito for the fieldwork.
Thank you to P. Mothes and Dr M. Hall for sharing their knowledge on Volcán Cotopaxi.
Thank you also to Mayor Oswaldo Navas Ramos for providing data and information
about Latacunga and Defensa Civil.
Pablo Samaniego, Diego Barba and Daniel Andrade V. of the Instituto Geofísico, Quito
provided data from the seismic and AFM instruments, and from preliminary fieldwork
for Chapter 3. I gratefully acknowledge the assistance of Mario Guzman with the GPS
surveying in July 2005.
Funding was provided by NSF grants EAR-0087665, EAR-0439093, ITR-0121254 to
M.F. Sheridan.
Thank you to all of those at UB, both the Department of Geology and the Tae Kwon Do
team for making it fun. To Bettina and Jorge, my family away from home, I thank you
with all my heart. Most of all, I would like to thank Adam Stinton for all his love and
support from the last two years. I couldn’t have done it without you.
ii

Contents
Acknowledgements ii
Contents iii
List of Figures vi
List of Tables viii
Foreword ix
Abstract x
Chapter 1 Introduction 1
1.1 Background on Volcán Cotopaxi 2
1.1.1 Recent Activity 3
1.1.2 Lahar Activity 4
1.1.3 Current Activity 7
1.2 The Río Cutuchi 7
1.3 The City of Latacunga 8
Chapter 2 The 1877 Lahar 11
2.1 Flow Characteristics 11
2.2 Lahar Effects 12
2.3 Lahar Deposits 13
2.4 Previous Work on the 1877 Lahar 16
2.4.1 Barberi et al., 1992 17
2.5 The Possibility for an 1877-Style Event in the Future 18
iii

Chapter 3 The 2005 Vazcún Valley Lahar: Evaluation of the TITAN2D
Two-Phase Flow Model Using an Actual Event. 22
3.1 Two-Phase Titan2D 22
3.1.1 Pitman-Le Two Phase Model 22
3.1.2 Titan2D Toolkit 23
3.2 Vazcún Valley Lahar 23
3.3.1 Background 23
3.3.2 General Description of the Lahar 25
3.3 Methods 27
3.4.1 Field Data Collection 27
3.4.2 DEM Generation 29
3.4.3 Simulation Variables 29
3.4 Results 30
3.5 Discussion 30
3.5.1 Flow Simulations and Inundation Areas 31
3.5.2 Velocity 31
3.5.3 Flow Thickness 33
3.5.4 Run-up Heights 33
3.6 Conclusions 33
Chapter 4 Simulating Potential Lahars using Titan2D for the Río Cutuchi 37
4.1 Topographic data 38
4.2 Simulation Variables 39
4.2.1 Volumes 40
iv

4.2.2 Solid Fraction 40
4.2.3 Internal Friction Angle 40
4.2.4 Bed Friction Angle 41
4.3 Results 41
4.2.1 Effect of Solid Fraction 42
4.2.2 Effect of Bed Friction 42
Chapter 5 Map of Probabilistic Lahar Inundation for the City of Latacunga 46
5.1 Introduction 46
5.2 Probabilistic Inundation Map 46
5.2.1 Eruptive Scenarios and Historical Data as a guide
to linking particular lahar volumes to VEI values. 48
5.2.2 Eruption Frequency 49
5.2.3 Generation of the Probability Map 54
5.3 Map of Probabilistic Lahar Inundation for the City of
Latacunga 56
Chapter 6 Discussion: Assessing the Vulnerability of Latacunga 60
6.1 Impact on the City of Latacunga by Large Scale Events 60
6.2 Impact on the City of Latacunga by Moderate Scale Events 63
6.3 Impact on the City of Latacunga by Small Scale Events 64
6.4 Implications for Hazard Assessment 65
6.5 Conclusion 67
References 69
v

List of Figures 1 Summit glacier of Volcán Cotopaxi 3
2 Topographic Map showing Cotopaxi, the Río Cutuchi and Latacunga 6
3 Location of Volcán Cotopaxi, the Río Cutuchi and the study area 9
4 Volcán Cotopaxi and the Rio Cutuchi 10
5 Debris Fan north of Mulaló. Note the barren landscape and the
abundant boulders from the 1877 lahar. 14
6 Excavated remains of the textile factory buried by the 1877 lahar. 15
7 Basic stratigraphic column of two sections seen at textile factory. 16
8 Deposits of the 1877 lahar seen at the textile factory 17
9 Model results from Barberi et al., (1992) for an 1877-size lahar 19
10 Probability of occurrence of an 1877 style eruption 20
11 Buildings built upon 1877 (and older) lahar deposits 21
12 Map of the Vazcún Valley showing the location of important
features mentioned in the text 24
13 Granulometry of the three lahar samples showing the relative
proportions of gravel, sand and silt+clay. 27
14 Photographs of the February 2005 Vazcún Valley Lahar 28
15 Final timesteps for simulations of 70,000 m3 for a) 40% solid fraction
and b) 60% solid fraction 32
16 Velocity vs time plots for a) 70,000 m3 simulations and b) 50,000 m3
each for 40, 50, 60 and 70% solid fractions 34
vi

17 Cross section taken at the El Salado Baths from a) GPS data and
b) Titan2D simulation. 35
18 Cross sections of a section of the channel that experienced
superelevation from a) the GPS data and b) the Titan2D simulation. 36
19 Preliminary inundation map for the Latacunga Valley for various
scale lahars 43
20 Investigating the effects on inundation by varying solid fraction for
a) 60 x 105 m3 and b) 60 x 106 m3. 44
21 Investigating the effect on inundation by varying bed friction for
a) 60 x 105 m3 and b) 60 x 106 m3. 45
22 Probability Tree 47
23 Map of probabilistic lahar inundation for the city of Latacunga 58
24 Detailed look at the Probabilistic Lahar Inundation map for the city centre 61
25 Bridges from the city of Latacunga across the Rio Cutuchi to the
Pan American Highway 63
26 Hospital IESS built up to the limits of the Rio Cutuchi 65
vii

List of Tables
1 Summary of recent activity 4
2 Summary of input parameters used in simulations 30
3 Summary of results 30
4 Summary of SRTM height performance 39
5 Summary of input parameters for all runs 39
6 Historical eruptive frequency and associated lahar information 50
7 Probability of occurrence of a particular size lahar based on
association with a VEI-size eruption. 55
viii

Foreword
This research is centered on assessing the impacts of lahars on the city of Latacunga,
Ecuador using the Titan2D model and comprises the main bulk of this thesis. It should
be noted that Chapter 3 consists of a distinct research project which describes the model
and provides a field evaluation so that confidence can be placed in the results of the thesis
study. Chapter 3 was co-authored with A. J. Stinton and M. F. Sheridan and is to be
submitted to the Journal of Geothermal and Volcanological Research.
ix

Abstract
Lahars triggered by mobilization of deposits from volcanic explosions have occurred at
Volcán Cotopaxi, Ecuador on the average of once every century over the last two
millennia. Lahars from Cotopaxi may flow down three main drainages, impacting a
present day population of around 3 million inhabitants. Río Cutuchi, the main drainage
to the south of Cotopaxi, headwaters on the flanks of Rumiñahui and Cotopaxi
Volcanoes. This river flows southwards through several communities, including the city
of Latacunga (population 52,000). Its path is generally parallel to the Pan American
highway. Many small scale lahars have followed this drainage, as well as some large
scale historical flows, such as the great 1877 debris flow that severely impacted the
population along the Río Cutuchi. This study used the Titan2D model to simulate lahars
of various volumes that correspond to actual deposits along the Río Cutuchi in the
vicinity of Latacunga. The purpose was to investigate the hazard that lahars might
present to the current population should Cotopaxi become active again and produce
debris flows. The study area is restricted to the region adjacent to Latacunga where
detailed field data are compared with the model results. Simulations utilized topographic,
stratigraphic, and historical inundation data collected in the field in the summer of 2005
to determine probabilistic lahar inundation zones for the debris flows of various sizes.
These inundation zones have been analyzed in conjunction with infrastructure data for
Latacunga so that the impact of various scale lahars on the city can be assessed.
x

Chapter 1 Introduction
1. Introduction
Lahars, or volcanic debris flows, are high-sediment concentration flows that occur on
volcanic terrains. They may be a primary phenomenon that occurs during an eruption or
less predictably, a post-eruptive phenomenon or even unrelated to an eruption. Lahar
formation requires an adequate water source, an abundant unconsolidated debris supply,
steep slopes and substantial relief, and a triggering mechanism (Vallance, 2000). Lahars
may be initiated by torrential rains, or rapid melting of snow or ice caps on the volcano’s
peak. They can also form by flank collapse of large volcanoes if there is sufficient pore
or hydrothermal water available.
Lahars are particularly dangerous to communities near volcanoes. As the flows of
sediment and water travel down the volcano flanks, they incorporate a large quantity of
sediment and rock fragments, making lahars very destructive. These gravity driven flows
descend valleys, but their large volume enables them to overflow their banks to cover
lateral areas of low gradient. This results in distal communities being unexpectedly
inundated, sometimes with catastrophic consequences.
Previous catastrophic lahars have been well documented; for example the mudflow at
Nevado Del Ruiz, Colombia in 1985 (Voight, 1988; Pierson et al., 1990; Tanguy et al.,
1998,) and lahars following the eruption of Mt. Pinatubo, Philippines in 1991 (Pierson et
al., 1992; Rodolfo, 1989; Arboleda and Martinez 1996).
1

The common occurrence of lahars and their effects on volcanic communities demonstrate
the need to consider the hazards on individual drainage systems for specific volcanoes.
In this way, accurate inundation zones and hazard maps can be generated so that
catastrophic events can be reduced. This study will concentrate on a portion of the Río
Cutuchi drainage system on the south flanks of Volcán Cotopaxi, Ecuador. This area
contains many communities, some of which are situated on terraces formed by lahars in
recent geological history. Potential lahars are simulated using the two-phase Titan2D
model (Pitman and Le, 2005) to create a probabilistic study of inundation areas for the
city of Latacunga, Ecuador.
1.1 Background on Volcán Cotopaxi
Cotopaxi is one of the highest active volcanoes on earth with a summit elevation of 5911
m (Global Volcanism Program, 2005) and is considered to be Ecuador’s most dangerous.
It is a composite volcano with 3000 m of relief. Its upper flanks have slopes of around
25-30˚ and their snow and ice fields cover approximately 20 km2 with a volume of 1.0
km3 (Mothes et al., 1998) (present day glacier seen in Figure 1). The lower flanks are
incised by valleys forming three main drainages: to the north the Ríos Pita and
Esmeraldas, to the southwest the Río Cutuchi and Pastaza and the Río Tambo and
Tamboyacu-Napo to the east. The volcano’s eruptive history began around 0.5 Ma ago,
dominated by rhyolitic magmatism. The current andesitic phase of volcanism began
around 4100 years ago, resulting in the present cone (Mothes, 2006).
2

1.1.1 Recent Activity
Recent activity produced plinian eruptions and associated small volume pyroclastic flows
and surges (Barberi et al., 1995). Such activity resulted in the melting of the summit ice
Figure 1: Summit glacier of Volcán Cotopaxi, Climbing Refugio (yellow building) for scale.
and snow caps producing mudflows. Barberi et al. (1995) have estimated that Cotopaxi
experienced an average recurrence of one explosive, lahar-triggering event every 117
years over the last two millennia. Activity at Volcán Cotopaxi is summarized in Table 1.
3

1.1.2 Lahar Activity
Two types of lahar occur commonly at Volcán Cotopaxi (Andrade et al., 2005). Primary
lahars are those generated from pyroclastic flows and the melting of the volcano’s ice
cap. Secondary lahars occur when heavy rains remobilize ash deposits following an
eruption. The Río Cutuchi has experienced primary lahars in 4500 yrs BP and in the
years 1742, 1743, 1744, 1766, 1768, 1855 and 1877 AD.
Age Principal Eruptions
Sub-plinian - plinian
tephra falls Pyroclastic
Flows Lahars Lava Flows VEI 1880 AD 1 1 2-3 1877 2 1 yes many yes 4 1853 - 1854 2 1 yes many 1 3-4 1768 1 1 yes many 1? 4 1766 1 1 yes many 3 1744 1 1 yes many 4 1743 1 1 yes many 3-4 1742 3 2 yes 2 groups 4 1532 -34 2 2 yes 2 groups 1 3-4 900 yBp 4 3 yes many 3-4 1000 yBp 2 2 yes 2 groups >4 1180 yBp 1 1 yes many 3-4 1210 yBp 1 1 yes 2 groups 1 4 1770 yBP 1 1 ? many several 4 1880 yBP 1 1 yes 2 groups 1 >4 1880-2000 yBP 1 1 yes many 4 ~2000 yBP 1 1 yes ? 4 TOTAL 26 22 >14 times >20 times >7 times
Table 1: Summary of recent activity. (Mothes, 2006).
The enormous Chillos Valley lahar (CVL) was an ash-flow generated debris flow from
Volcán Cotopaxi that formed about 4500 years BP. The CVL was generated by a
rhyolitic ash flow that followed a small sector collapse on the north and northeast sides of
Cotopaxi (Mothes et al., 1998). This flow melted part of the volcano’s ice caps and the
torrents transformed into a debris flow on the flanks. The lahar descended river systems
on the N-NE flanks and flowed as far as the Pacific Ocean, 326 km from the volcano.
4

Flows also reached over 130 km east into the Amazon Basin. Although the larger portion
of the CVL flowed down the northern drainages the smaller, southern portion still
devastated a wide swath (Figure 2). Once the CVL filled the deep canyons of the Río
Cutuchi, the flow spread as it passed downstream and into the Latacunga Valley. Here,
the flow widths reached 3-5 km beyond its channel walls, over a 25 km stretch with
depths of 20 m (Mothes et al., 1998). The flow extended downstream beyond Latacunga,
flooding 160 km2 from the Latacunga Valley down to Panzaleo. The overall volume of
the CVL is estimated to be around 3.8 km3 (Mothes et al., 1998).
The Chillos Valley Lahar is not typical of the recent activity at Cotopaxi. Historical
events are characterized by smaller eruptions with scoria flows that melt the glacier
creating lahars. Near the volcano, lahar deposits are dark grey, clast-supported, well-
packed breccias, with a thickness of 1-3 meters (Mothes, 2006). They may include
blocks up to 8 m across; however, it is more common to see clasts in the range of 2-20
cm (Mothes, 2006). Most clasts are andesitic, possibly fragments of fresh lava blocks
and some scoria. Hyperconcentrated stream-flow deposits occur in distal areas of the
drainage system.
In 1742 there were three eruptions which produced lahars that caused destruction to
haciendas, livestock, and people in the Latacunga Valley (Mothes, 1991). Similarly,
eruptions in 1766 and 1768 created lahars that inundated major drainages, causing
damage to local communities. The last catastrophic eruption of Volcán Cotopaxi
occurred in 1877. This eruption and its associated lahar, which caused widespread
5

damage and the deaths of over 300 people (Major and Newhall, 1989), are discussed in
detail in Chapter 2 as it is considered the eruption scenario for future events.
Many communities surrounding Cotopaxi are built on deposits from the CVL and other
lahars and are at great risk from future flows.
Figure 2: Topographic map showing Cotopaxi, the Río Cutuchi and Latacunga (adapted from Barberi et
al., 1995) and magnified section showing map of Latacunga Valley and the major streams draining the
southwest side of Cotopaxi to form the Río Cutuchi. The extent of the CVL deposits are shown. (adapted
from Mothes et al., 1998).
6

1.1.3 Current Activity
January 2001 saw renewed activity at Volcán Cotopaxi (Molina et al., 2006). Long-
period (LP) seismic events increased, followed by a swarm of tremors in November. In
June of 2002 very long-period (VLP) events accompanied the LP signals, which began to
occur directly under the volcano. Temporal changes between the VLP and LP events
continued until September 2003 when the VLP signal disappeared leaving the LP signal
to dominate. Rivero et al., (2006) proposed that injections of new magma occurred in
March 2003, Oct 2004 and April-May 2005 indicated by increased fumarolic activity at
the summit. Activity at Cotopaxi is also suggested by a thermal anomaly (Ramon et al.,
2006.). This renewed activity has led scientists to consider the possibility of an eruption
and what that might mean for the large population now living in Cotopaxi’s shadow.
This study has arisen out of a need to consider a variety of eruption scenarios in light of
the recent activity and the large population centers along the main drainages of the
volcano.
1.2 The Río Cutuchi
The Río Cutuchi is the river system considered for this study. It is the principle river
southwest of Cotopaxi (see Figure 3). Its headwaters are in the south of Rumiñahui
(Figure 3), a heavily eroded dormant volcano to the west of Cotopaxi and has tributaries
covering the entire west flanks of Volcán Cotopaxi. Mothes et al. (1995) state that
historical accounts and stratigraphic studies show that the majority of the small debris
flows from Cotopaxi since 1532 flowed down the west and southwest tributaries of the
Río Cutuchi.
7

The source region for the Río Cutuchi has been continuously blanketed by tephra falls
from eruptive activity of Cotopaxi over the last 2000 years (Barberi et al., 1995). These
deposits supply the loose debris for lahar flow generation. As previously mentioned,
Cotopaxi has abundant summit ice and snow caps which would supply the water source
needed for lahar generation. It is feared that torrential rain or rapid melting of these ice
caps will cause mobilization of the unconsolidated debris and once again lahars, in the
source region of the Río Cutuchi.
The Ríos Pita and Cutuchi flow southward along the 50 km wide Inter-Andean Valley.
The towns and cities within this area have been severely affected by lahars from Cotopaxi
on several occasions since the arrival of the Spanish Conquistadors in 1532 (Mothes et
al., 1998). Many towns are built upon the CVL deposits (Figure 1), and even younger
terraces. Latacunga alone is home to around 52,000 people (Censos 2001). Apart from
cities and people, the infrastructure of the area is also at risk. The Pan-American
Highway runs alongside the Río Cutuchi in many places and a large lahar could cause
damage to this major road.
1.3 The City of Latacunga
Latacunga is the principle city in Cotopaxi Province. It is a sprawling town that is the
economic centre for the surrounding towns and villages. The official population
currently stands at around 52,000 people. It is the location for the regions principal
hospitals, police force, markets and is also home to the Civil Defense for the Cotopaxi
Province. This city, as previously mentioned, is also built on the banks and into the
8

Figure 3: Location of Volcán Cotopaxi, the Río Cutuchi and the study area (highlighted with pink box).
The inset shows the geographical location of Volcán Cotopaxi and Latacunga in Ecuador.
9

channel of the Río Cutuchi (Figure 4). Historically, the city has been destroyed five
times by lahars and suffered heavily in the 1877 event, as discussed in Chapter 2. It is
located 60 – 70 km from the volcano summit.
Figure 4: Left) The city of Latacunga with the Río Cutuchi channel in the foreground and Volcán
Cotopaxi in the background. Right) Building within the channel limits.
1.4 Objectives and Purpose of the Study
This study evaluates the potential effects of lahars on the city of Latacunga in the event of
a future eruption of Cotopaxi Volcano. The study uses a new modeling technique, the
two-phase Titan2D model, to simulate potential lahars in the Rio Cutuchi to create
probability maps of lahar inundation. These maps are used to consider the detailed effect
a potential lahar would have on the vital resources and lifelines of the city. This is a
scientific analysis using a computational model that has inherent uncertainties. It is not a
10

professional planning or risk document but may serve as an example for those who have
these types of responsibilities.
This study also presents an evaluation of the two-phase Titan2D model. Comparisons are
made between observations from an actual lahar that occurred in February 2005 and
simulations of this flow. The study area chosen for this evaluation is the Vazcún Valley
at Volcán Tungurahua, Ecuador. This example was chosen for the fine resolution 5m
DEM that was created using GPS data and the opportunity to make detailed observations
of inundation area and flow height in the field.
11

Chapter 2 The 1877 Lahar
2. The 1887 Lahar
The 1877 eruption has been chronicled by Sodiro (1877) and Wolf (1878) and has been
extensively studied by several groups (Barberi et al., 1992; Aguilera et al., 2004; Mothes
1991, 2006). A series of strong detonations started the event at 10 am on June 26th. A
plume of gas and ash rose above the volcano associated by a rain of ash and pyroclastic
flows described by Wolf (1878) as “a potful of boiling rice which began to pour out” of
the crater. This has been interpreted as a ‘boiling over’ scoria flow rather than a
pyroclastic flow that occurred due to column collapse. The eruption is considered to be
of magnitude VEI 4 (Mothes, 2006). These flows traveled over the ice cap, including the
western drainage ice cap which is thought to have had an area of 5.3 km2 and a volume of
0.260 km3 (Mothes, 2006). This triggered large floods along all three main drainages,
which beyond the glacier mixed with pyroclastic and ice blocks causing intense erosion
and gullying, rapidly evolving the flood into debris flows (Aguilera et al., 2004).
2.1 Flow Characteristics
The flows are estimated to have had discharges of 50,000 – 60,000 m3s-1 with velocities
in excess of 20 ms-1 (Mothes, 2006). Sodiro (1877) noted that “the road between Mulaló
and Latacunga was full of travelers, and given the great velocity of the lahar, many
people, some on galloping horses, were overcome by the advancing wave, and thus
disappeared”. Lahar heights have been estimated to be up to 35-40 m (Mothes, 2006)
although eye witness accounts give heights closer to 50 m (Sodiro, 1877) and 100 m
(Wolf, 1878).
12

2.2 Lahar Effects
The lahar caused devastation in the Chillos and Latacunga valleys destroying textile
factories, haciendas, towns, bridges and indigenous communities. Wolf (1878) was so
moved by the events that he wrote “…on this terrible day hundreds of people and
thousands of animals lost their lives and Cotopaxi changed the countryside into deserts of
sand and stones and destroyed in one hour the work of many generations”. This barren
landscape described by Wolf is still evident today in the area around Mulaló (Figure 3).
Here, fields strewn with boulders remain unfarmed due to the poor quality of the land.
Some attempt has been made to grow eucalyptus trees, with little success (Figure 5).
The lahar that flowed down the volcano’s north flank arrived at the port of Esmeraldas on
the Pacific coast some 18 hours later carrying within it “cadavers and pieces of houses
and furniture from the Chillos Valley”. The lahar that traveled down the southern
drainages reached the city of Latacunga, some 43 kilometers from the crater, in less than
an hour (Barberi et al., 1992).
At the north of Latacunga the three-story textile factory, located on the east bank of the
Río Cutuchi, was buried by deposits (Figure 6). This site has been excavated and was
covered in some “seven meters of volcanic mud and sand” and debris including lahar
encased machinery, masonry and the remains of a 7 or 8 year old boy (Museum of the
Central Bank of the Equator). This site provided the excellent exposures of the 1877
lahar deposit, as discussed later in this chapter.
13

Figure 5: Debris Fan north of Mulaló. Note the barren landscape and the abundant boulders from the
1877 lahar.
2.3 Lahar Deposits
Deposits near the volcano, in the Mulaló (Figure 3) region, are characterized by a base of
ashfall/lapilli/pumice marker beds, with an overlying debris flow deposit with no
bedding, although some breaks in the deposit are visible. Ceramics are common at the
base of the flow which mainly consists of polylithic clasts that are sub-angular to sub-
rounded. Red scoria clasts are common in the 1877 deposits, which tend to be the upper
most unit in much of the Latacunga Valley.
14

Textile Factory
Figure 6: Excavated remains of the textile factory buried by the 1877 lahar. The location of the textile
factory is shows in adjacent topographic map. This is the location of the two stratigraphic columns seen in
figure 7.
At the textile factory site in Latacunga, the main unit in the deposit tends to be poorly
sorted, clast-supported with a pale brown, fine sand matrix (Figure 7). It is polylithic
with an abundance of large red scoria clasts and black lithic (juvenile?) clasts which
range from sub centimeter to 20 cm in size. Ceramic tiles occur within the deposit
(Figure 8a) as well as some boulders which reach up to 60 cm in size. The second unit is
similar but has a smaller range of clast sizes (<10 cm). The third unit seen here is a
15

matrix supported, sandy unit with some normal grading. The fourth unit is a very fine
grain, laminated unit that is fairly unconsolidated.
Figure 7: Basic stratigraphic column of two sections seen at textile factory; for location see figure 6.
These sections are located adjacent to each other in the excavated section (figure 8), the south facing
section is seen in fig 8b and the west facing section is adjacent to it, in the egde of fig 8b. Note the
inconsistency of the deposit, which may be a factor of the flow interacting with walls, rooms and other
features of the factory
These deposits show different pulses of flow, indicating that the flow was not steady but
had several waves. The very fine, laminated units could be from ‘swashing’ of a watery
flow within the building (Figure 8c). There is no imbrication seen in the deposit
indicating that there was no internal shear. The majority of the clasts appeared to be
eroded material, with little to no pumice or other juvenile ‘source’ material, indicating
that the flow experienced extreme bulking. Whilst the textile factory presents well
preserved sections (Figure 8b) that are obviously related to the 1877 event, the deposits
seen here are likely to not be typical of the deposits from this event.
16

Figure 8: a) Red ceramic tile in lahar deposit. b) Section of deposit from textile wall (base of photo) to
top (unknown if top of deposit), correlates to north facing stratigraphic column in Figure 7 c) Very fine,
laminated units.
The flow will have interacted with the building, causing sorting, reworking and other
atypical behaviors. Further downstream, the deposits show a transition from clast-rich
debris flows to hyperconcentrated stream-flows (Mothes, 1991).
2.4 Previous work on the 1877 lahar.
The extent of the deposits for the 1877 lahar are the basis for the lahar hazard zone
published in the Mapa Regional de Peligros Volcanicos Potenciales del Volcán Cotopaxi
– zona sur (Hall et al., 2004). A VEI 4 eruption could produce an 1877 size lahar and is
considered the typical eruption style for Volcán Cotopaxi (Andrade et al., 2005).
Some work has been made on numerical modeling 1877 size lahars for the northern and
southern drainages (Barberi et al., 1992, Aguilera et al., 2004). Aguilera et al. (2004)
modeled lahars with initial volumes of 35 - 80 x 106 m3 for the northern drainages with
17

the 60 x 106 m3 simulations reproducing the maximum heights attained by the lahar in
this valley. Barberi et al. (1992) simulated flows with volumes of 45, 90 and 150 x 106
m3 that reproduced maximum heights actually reached by the 1877 lahar.
2.4.1 Barberi et al., 1992: Reconstruction and numerical simulation of the 1877
lahar.
The numerical model employed in this study is based on mass and momentum balance
laws for a channeled flow (Takahashi, 1978, 1980; Barberi et al., 1991; Macedonio &
Pareschi, 1992). The equations assume a homogenous flow and constant volume. Input
parameters are volume, solid concentration and topography. Topographic data is derived
from digitizing cross sections with 1 km spacing from 1:25,000 and 1:50,000 topographic
maps and from a field survey.
Barberi et al. 1992, made comparisons with 1985 Nevado Del Ruiz lahar, 1980 Mt St
Helens lahar and the 1877 Cotopaxi lahar to infer hydrograph shapes which give
information on volume of water and solid fraction. The size of the glacier was also taken
into consideration for volume estimates, which came to be 45 x 106, 90 x 106 and 150 x
106 m3, using a solid volume fraction of 70%. They concluded that the results showed
that the numerical model was able to simulate the debris flow along a meandering valley
successfully. Historical data was reproduced by the model such as lahar height,
discharge, and arrival time. From this they concluded that an 1877-style lahar would
strike Latacunga one and a half hours after lahar generation, with a 10 m high lahar wave
with a maximum discharge of 9100 m3s-1 (Figure 9).
18

igure 9: a) Maximum flow height and b) discharge along Río Cutuchi – Río Pastaza for a lahar being
.5 The possibility for an 1877-style event in the future.
robability of a recurrence of
smaller than the 1877 lahar.
F
generated by an 1877-like eruption (from Barberi et al., 1992)
2
Aguilera et al. (2004) and Barberi et al. (1992) discuss the p
an 1877-style event. Both papers recognize that the volume of lahar is heavily dependent
on glacier size, which has changed since the last event. Today’s glaciers on Cotopaxi are
generally considered to be 2/3 the size of the 1877 ice cap (Barberi et al., 1992; Aguilera
et al., 2004). This would mean that the maximum potential lahars may be somewhat
19

The second factor to consider is the recurrence probability of an 1877 size eruption.
Barberi et al. (1992) used stratigraphic information (Barberi et al., 1995) from the last
2).
P = 1 – exp (-Te/Tr) (1)
ce rate.
ion of time. Using
is information, the probability for recurrence of an 1877 size event occurring in 2006 is
2,000 years to consider a recurrence interval using the Poissonian probabilistic
Figure 10: Probability of occurrence of an 1877 style eruption (From Barberi et al., 199
distribution of repose time (Equation 1; Wickmann, 1976).
Where Te is the exposure time (repose) and Tr is the recurren
Figure 10 reports these results as the probability of eruption as a funct
th
0.64. The third factor to consider is not the probability of lahar generation, but of the
effect a similar size lahar would have today. The population distribution in the 1877
Latacunga Valley was considerably different than it is today. In 1991 it was estimated
20

that 20,500 people lived in the zones of highest risks (Mothes, 1991) and that homes,
industries, hospitals, schools, the Pan American Highway and other infrastructures have
been built on top of lahar deposits (Figure 11). Population expansion and building
growth continues to occur in these zones today and into the channel itself (Figure 4). It is
therefore important to consider the increased risk that communities are in today com
to that in 1877 when assessing the effect of an 1877 size lahar in the future.
new
pared
igure 11: Buildings
F built upon 1877 (and older) lahar deposits.
21

Chapter 3 The 2005 Vazcún Valley Lahar: Evaluation of the
TITAN2D Two-Phase Flow Model Using an Actual Event.
This chapter co
udy presents an evaluation of the two-phase Titan2D model which incorporates the
DEM
ade.
r
nsists of a separate study to that carried out at Latacunga, Ecuador. This
st
Pitman-Le two-phase debris flow model (Pitman and Le, 2005) into the existing Titan2D
computational toolkit (Patra et al., 2005). An introduction to the model used in this study
and for the Rio Cutuchi simulations is given. Comparisons are made between Titan2D
simulations and recorded features of an actual event: The February 2005 Vazcún Valley
Lahar. The Vazcún Valley drains from the northern slopes of Volcán Tungurahua, which
lies approximately 80km south of Volcán Cotopaxi.
This location was chosen due to the small confined nature of the lahar. A detailed
topographic survey, on the 1m scale, was attained in the field. This enabled a 5 m
to be derived (discussed later) which allowed for high resolution comparisons to be m
Other, well researched lahars may have large quantities of published data but lack the
high resolution topographic data attainable at the Vazcún Valley. Detailed surveys, such
as that undertaken in the Vazcún Valley so soon after the lahar, are not possible at othe
larger scale and better studied locations.
3.1 Two-Phase Titan2D
3.1.1 Pitman-Le Two-Phase Model
thin layer model for geophysical mass flows
and fluid. It is derived from mass and
The Pitman-Le model is a depth averaged,
which contain a mixture of solid material
22

momentum balance laws based on a Coulomb constitutive description of dry granular
material pioneered by Savage and Hutter (1989) and the ‘two-phase’ or ‘two fluid
models commonly used in engineering. This hyperbolic system describes the motion o
the two constituent phases and is fully explained in Pitman and Le (2005).
3.2.2 Titan2D toolkit
’
f
his mathematical model has been integrated into the existing Titan2D toolkit (Patra et
eviously been successfully used to simulate dry avalanches over
l and
of which
cún Valley Lahar
.3.1 Background
cán Tungurahua is one of Ecuador’s most
. At 5023 m.a.s.l., Volcán Tungurahua towers above the surrounding
e 12).
T
al., 2005), which has pr
realistic 3-D terrain (Sheridan et al., 2005). Titan2D utilizes adaptive grids, parallel
processing and is integrated with the open-source GRASS Geographical Information
System (GIS). Input parameters include initial pile volume, starting location, interna
bed friction angles, solid fraction and a base topography in the form of a Digital
Elevation Model (DEM). It is able to produce simulations which output a variety of
results including flow run-out, flow inundation area, velocity and flow depth, all
can be animated.
3.3 The 2005 Vaz
3
Located in the Eastern Cordillera, Vol
dangerous volcanoes
landscape and in particular the city of Baños (pop. 18,000, el. 1800 m.a.s.l)(Figur
Since October 1999, Tungurahua has been in a state of near-continuous eruption
characterized by small-moderate ash emission. Lahars have been a common occurrence
23

Figure 12: Map of the Vazcún Valley showing the location of important features mentioned in the text.
24
sert shows location of the Vazcún Valley on Volcán Tungurahua
In

.in several drainages around the volcano – 59 events between November 1999 and March
e
.3.2 General description of the lahar
witness accounts, video footage and written
10
ne of
ion
d the
s,
l
2002 (Sorenson et al., 2003). The flows have resulted in the temporary closure of the
main Baños-Riobamba highway and nearly inundated the popular El Salado baths in th
Vazcún Valley (Figures 12 and 14a). These lahars were caused by heavy rain
remobilizing the ashfall deposits on the steep upper slopes of the volcano.
3
The following description is based on eye
communications with scientists from Instituto Geofísico, Quito, and Civil Defense
officials from the City of Baños. On February 12th, 2005, a lahar traveled the entire
km length of the Vazcún Valley. As with previous lahars at Tungurahua, this flow
resulted from the remobilization of recent ashfall deposits by heavy rain. This was o
the largest events to have occurred in the Vazcún Valley since the current period of
activity began in October 1999. The lahar was first recorded by the Retu seismic stat
(see location on Figure 12) at 17h59 local time. Approximately 13 minutes later, at
18h12, the lahar was first recorded on the Vazcún Acoustic Flow Monitor (AFM) an
instrument quickly became saturated. A further 16 minutes later, at 18h28, personnel
from the Civil Defense reported the arrival of the first lahar wave at the El Salado bath
approximately 1 km outside of the city of Baños. The lahar continued in a series of pulses
until approximately 19h10 when the last recognizable signal is seen on the AFM record.
Based on the time of first detection by the seismic and AFM instruments, mean velocities
for the lahar were calculated at 7 m s-1 for the stretch between the Retu seismic station
and the Vazcún AFM, and 3.1 m s-1 for the section between the Vazcún AFM and the E
25

Salado baths. A volume of approximately 70,000 m3 was estimated from the AFM
records. After the event, scientists from Instituto Geofísico measured a series of cross-
channel profiles in the vicinity of the EL Salado baths. Analysis of these profiles
suggested a maximum flow rate of 100-104 m3 s-1, and a volume of 54,000 m3.
Granulometry (Figure 13) of several samples of the deposit/veneer left behind shows that
the majority (50-65%) of the lahar sediment comprised sand-size particles, a result of the
source material being recent ashfall deposits. The samples also contained a large
proportion of gravel-sized particles, many of which are rounded. This would suggest that
the lahar has undergone a significant amount of bulking. Assuming that the gravel-sized
particles represent the entrained material then the lahar has bulked by approximately
35%.
Although the 2005 Vazcún Valley Lahar is small when compared to lahars at other
volcanoes (e.g., Nevado del Ruiz, 1985; Mt. Pinatubo, 1991-6; Mount St. Helens, 1980),
it still presents a significant hazard to people and buildings located within or very close to
the channel of the Río Vazcún. This particular flow came to within a few tens of
centimeters of inundating the El Salado Baths, destroyed a small footbridge across the
channel and piled several large boulders greater than 1 m in diameter against the base of
the pier of the main highway bridge out of Baños (Figure 14).
26

Figure 13: Granulometry of the three lahar samples showing the relative proportions of gravel, sand and
silt+clay.
3.4 Methods
3.4.1 Field Data Collection
In July 2005, five months after the event, evidence of the lahar (e.g. high flow marks)
was still easily visible. As a result, a detailed survey of 1.6 km of the Vazcún Valley was
completed using Differential GPS. More than 1500 data points with x, y, and z values
27

Figure 14: A) Photograph of the El Salado baths in the Vazcún Valley. At the weekends, it is estimated
that more 300 people visit the baths per day. B) The 2005 Vazcún Valley Lahar came to within a few tens
of centimeters of inundating the El Salado baths. Photograph shows lahar at peak stage height. Photograph
courtesy of Defensa Civil de Baños. C) Looking downstream towards the new footbridge replacing the one
destroyed by the lahar. Foreground shows area outside of channel inundated by the lahar. D) Meter-scale
boulders piled up at the foot of the central support pier for the main road out of Baños. Note also splash/tide
marks on both bridge piers.
were collected at intervals of approximately 5 m, with smaller spacing in areas of
importance as identified in the field. Points were collected along the edges of the river
28

channel, along terraces and other breaks in slope, and also along the flow limit where
visible.
3.4.2 Generation of Digital Elevation Model
The GPS survey data was processed and interpolated to create a digital elevation model
(DEM) with 5x5 m cells. A pre-existing DEM with 10x10 m cells was created by
Sorenson et al. (2003). This DEM was resampled to create 5x5 m cells and then merged
with the newly created GPS-derived DEM. This was a necessary step because, despite
having a 10x10 m cell size, the original source for the pre-existing DEM was a 1:50,000
scale topographic sheet with 40 m contour intervals. Consequently, the river channel and
terraces are not well represented in the original 10 m DEM. Merging the two DEMs
allows for potentially more accurate simulations.
3.4.3 Simulation Variables
Table 2 summarizes the range of input variables used in the simulations. The two end-
member volumes are the two different values derived from the AFM records and the
cross sections. Solid fractions cover the range of values that define debris flows (Sharp
and Nobles, 1953; Pierson, 1980, 1985, Scott, 1988) as this parameter of the actual event
is unknown, although considered to be on the higher end of the scale. Bed friction and
internal friction angles were chosen based on previous work using Titan2D simulations.
Sheridan et al. (2005) showed that simulations are not sensitive to internal friction angles
so previously used angles are acceptable in this case. The simulations are, however,
sensitive to bed friction angles but assessing this parameter is outside the scope of this
29

Parameter Value
Volume m3 50,000 and 70,000 Solid Fractions (0-1) 0.4, 0.5, 0.6, 0.7 Internal Friction Angle (°) 25 Bed Friction Angle (°) 10
Table 2: Summary of input parameters used in simulations.research
and is an ongoing project. The bed friction angle used is within the range of values often
used for glacial and fluvial deposits (Stinton et al., 2004).
3.5 Results
Figures 15-19 show results generated by the Titan2D simulations for the February 2005
Vazcún Valley Lahar. A summary of these results are shown in Table 3.
Field Data Simulation output
Velocity: Upper Channel (ms-1) 7 5.8-8.9 Velocity: Lower Channel (ms-1) 3.1 1.1-2.6 Flow Thickness (m) 2.8 2.9 Run Up Height (m) 5.5 6.7
Table 3: Summary of results.
3.6 Discussion
The performance of the Titan2D model in simulating the 2005 Vazcún Valley Lahar was
evaluated by considering a variety of properties, each discussed here. Comparisons were
made between model outputs and field-recorded inundation areas, velocities, flow
thicknesses and run up heights.
30

3.6.1 Flow simulations and Inundation Areas.
Flows were simulated using a variety of solid fraction ratios and the two end-member
volume estimates (50,000 m3 and 70,000m3). Figure 15 shows the final time steps for
two simulations of 70,000m3 with different solid fractions of 40% (Figure 15a) and 60%
(Figure 15b). The 60% solid fraction flow behavior was closest to that of the actual flow,
and is used for the pile height and run-up height comparisons. The AFM-calculated
volume of 70,000 m3 is considered the more reliable estimate and it behaved closest to
the actual flow in the simulation and is therefore used in the later comparisons rather than
the 50,000 m3 volume. Both flows were predictably constrained to the channel and
produced inundation areas that match the inundation areas mapped in the field.
3.6.2 Velocity
The Titan2D model predicted velocities that are within 17-27% of the recorded velocity
in the upper part of the channel. Velocities in the lower part of the channel were
underestimated but were accurate to within 17-67% of the velocities recorded for this
section. It should be noted that errors in the recorded velocities have not been
determined.
Velocities are commonly used in model evaluations but comparisons of such simulations
are difficult. The average velocities recorded here are computed by considering the
velocity of various computational cells which range from 0 ms-1 to values way above the
mean. Average velocities from simulations are reported for simplicity. It is therefore
clear that these values will not be the same as velocities seen when watching the flow or
recorded by devices that record the arrival of the flow front.
31

Figure 15: Final timesteps for simulations of 70,000 m3 for a) 40% solid fraction and b) 60% solid
fraction. Note the confinement of the flow to within the channel.
32

3.6.3 Flow Thickness
Flow thickness at measured at El Salado baths were compared with Titan2D calculated
flow thickness in the same section of the channel (Figure 17). Titan2D overestimated
flow thickness in this section by 0.11 m, which is within 4% of the measured flow
thickness. Flow thickness is a good parameter for comparisons as no averaging is
required and it is not highly dependent on boundary conditions.
3.6.4 Run-up Heights
Titan2D simulations display super-elevation around bends in the channel the same way
an actual flow does. Figure 18 shows profiles across the simulated flow and the actual
flow in a section of the channel that has undergone superelevation. Field cross sections
show superelevation of 5.5 m and the Titan2D simulations produced a run-up height of
6.65 m. The simulated flow had a run-up within 21% of the actual flow.
3.7 Conclusions
The purpose of this study was to evaluate the performance of the two-phase Titan2D flow
model in simulating an actual event whose flow features were observed and studied in
detail. The simulations yielded by the two-phase Titan2D are in close agreement with the
behavior of the 2005 Vazcún Valley Lahar. The model was able to effectively simulate
flow depth, run-up heights, inundation area and to some extent, the average velocity of
the flow.
33
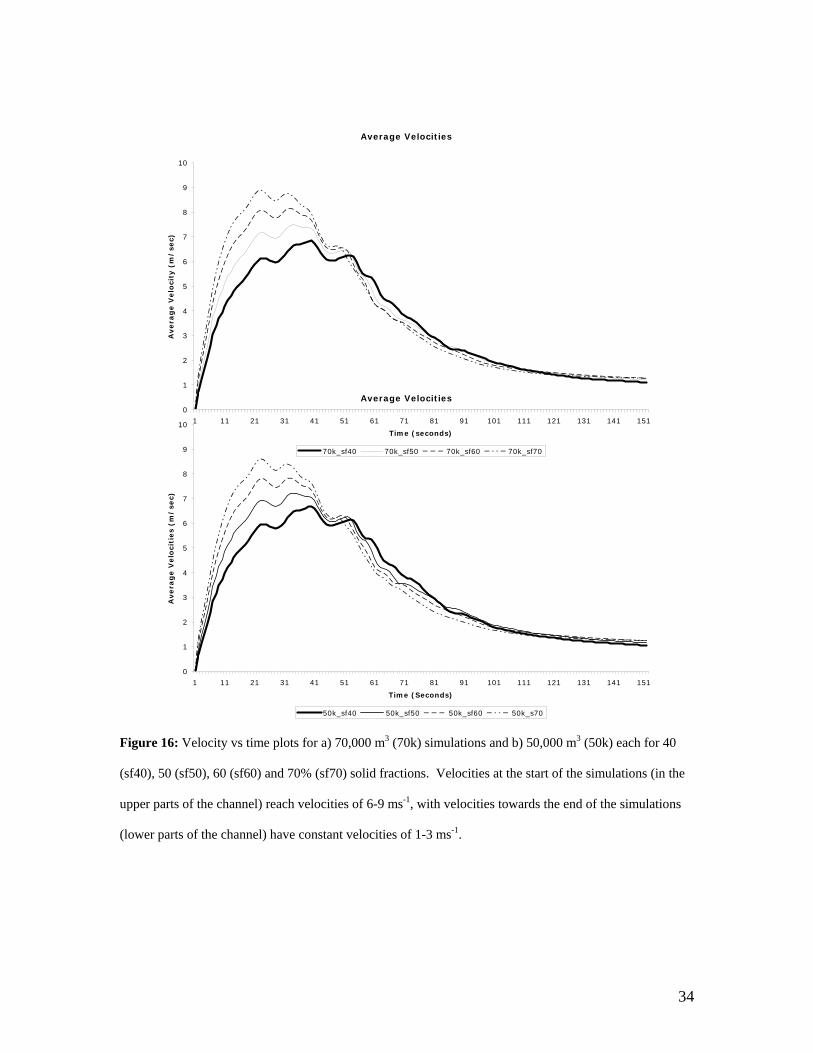
Velocity vs time plots for a) 70,000 m3 (70k) simulations and b) 50,000 m3 (50k) each for 40
f40), 50 (sf50), 60 (sf60) and 70% (sf70) solid fractions. Velocities at the start of the simulations (in the
pper parts of the channel) reach velocities of 6-9 ms-1, with velocities towards the end of the simulations
Average Velocities
0
1
2
3
4
5
6
7
8
9
10
1 11 21 31 41 51 61 71 81 91 101 111 121 131 141 151
Time (seconds)
Avera
ge V
elo
city
(m
/se
c)
70k_sf40 70k_sf50 70k_sf60 70k_sf70
Average Velocities
41 51 61 71 81 91 101 111 121 131 141 151
Time (Seconds)
0
1
2
3
4
5
6
7
8
9
10
1 11 21 31
Avera
ge V
elo
citi
es
(m/
sec)
50k_sf40 50k_sf50 50k_sf60 50k_s70
Figure 16:
(s
u
(lower parts of the channel) have constant velocities of 1-3 ms-1.
34

Lahar Cross-section from GPS Data, West of El Salado Baths
1895
1896
1897
1898
1899
1900
1901
1902
1903
9844932984493498449369844938984494098449429844944984494698449489844950
Northing
Ele
vati
on
(m
)
ELEVATION
S
line indicates underlying topography, the dashed line indicates maximum flow height. Flow edges see
the GPS profile are actual flow extents measured in the field.
Cross Section from Titan2D Simulation, West of El Salado Baths
1895
1896
1897
1898
1899
1900
1901
1902
1903
0 5 10 15 20 25 30 35 40
Distance Across Profile (m)
Ele
vati
on
(m
)
Elevation Elev+PH
olid
n in
Figure 17: Cross section taken at the El Salado Baths from a) GPS data and b) Titan2D simulation.
35

Figure 18: Cross sections of a section of the channel that experienced superelevation from a) the GPS
data and b) the Titan2D simulation. Again, solid lines represents underlying topography and the dashed
line represents maximum flow height. Flow edges in the GPS profile are actual flow extents measured
in the field.
Cross section from GPS data
1894
1896
1898
1900
1902
1904
1906
1908
984492898449309844932984493498449369844938984494098449429844944
Northing
Elev
atio
n (m
)
ELEVATION
Cross Section from Titan 2D simulation.
1906.00
1908.00
1894.00
1896.00
1898.00
1900.00
1902.00
1904.00
0.00 5.00 10.00 15.00 20.00 25.00 30.00 35.00 40.00 45.00
Distance across profile (m)
Ele
vati
on
(m
)
El+PH ELEVATION
36

Chapter 4 Simulating Potential Lahars using Titan2D for the Río
Cutuchi
Previous works on simulating lahars for Volcán Cotopaxi have concentrated on
recreating the 1877 event (Barberi et al., 1992; Aguilera et al., 2004). The aim of this
study is to consider a variety of ‘what if’ scenarios and does not attempt to constrain its
alysis to one size event. With this in mind, a modeling technique that could
easily be applied to a variety of volumes was needed.
hazard an
been used to m
developm
the most widely used application for lahar hazard assessment is LaharZ. The
asis of this model is the application of two scaling relationships that relate the volume of
Titan2D is a thin-layer, depth-averaged geophysical mass flow model that has previously
odel dry avalanches and pyroclastic flows (Patra et al., 2005). A new
ent, the two-phase model based on the two-fluid Pitman Le model (2005) is
now available for use on debris flows. This model has been evaluated using an actual
event, the February 2005 Vazcún Valley Lahar (as described in Chapter 3) and was
considered the best model available for this study.
Titan2D has several advantages over other models that are in existence such as FLO-2D
(O’Brian et al., 1992), LaharZ (Iverson et al., 1998) and DAMBRK (Fread 1988, Costa
1997) in that it was designed specifically with debris flows in mind (FLO-2D and
DAMBRK are primarily stream flow models) and is based on geophysical laws.
Currently,
b
37

the lahar to the cross-sectional area and planimetric area. The output is inundation are
and flow depth. The Titan
a
2D model is based on first principles of physics (Iverson,
istical relationships. The model outputs
is
this DEM matches the actual stream network, mainly the Rio
e when the stream network is derived, and
1997; Savage and Hutter, 1989) rather than stat
include travel time and velocity (momentum), flow thickness and inundation areas. This
aids in improvements in warning systems as expected inundation times can be derived.
The Titan2D model requires several user-defined input parameters including 3D
topography, volumes, solid fraction, internal friction angle and bed friction angle.
4.1 Topographic Data
Titan2D requires topographic data in the form of a digital elevation model (DEM) stored
in the Geographic Information System (GIS) freeware, GRASS (http://grass.itc.it). Th
study utilizes a DEM acquired by the Shuttle Radar Topography Mission (SRTM). This
dataset is freely available from the SRTM website as a 90 meter grid. Whilst this is
somewhat of a coarse resolution, the DEM is correct for the study area: the stream
network derived from
Cutuchi. SRTM data has been analyzed for height error and the results are summarized
in Table 4. Confidence is placed in this DEM over other datasets available. These other
datasets are 30 meter and 50 meter DEMs which have been digitized from topographic
maps at the 1:50,000 scale. These DEMs are not correct for the city of Latacunga as they
do not place the Rio Cutuchi in the right plac
contain many artifacts that are related to the topographic maps and the digitizing process.
38

Africa Australia Eurasia Islands N. America S. America Absolute Geolocation Error 11.9 7.2 8.8 9.0 12.6 9.0 Absolute Height Error 5.6 6.0 6.2 8.0 9.0 6.2 Relative Height Error 9.8 4.7 8.7 6.2 7.0 5.5 Long Wavelength Height Error 3.1 6.0 2.6 3.7 4.0 4.9 Table 4: Summary of SRTM height performance. All quantities represent 90% errors in meters
(Rodriguez et al., 2005)
4.2 Simulation Variables.
Table 5 summarizes the range of input variables used in the simulations, which are
iscussed in detail in the following section. The simulated flows were all initiated in the
e (°)
d
Run Volume m3 Solid Fractions Internal Friction Angle (°) Bed Friction Angl
1a 10 x 10 0.65 25 10 4
2a 60 x 104 0.65 25 10 5
4a 60 x 103a 10 x 10 0.65 25 10
4b 60 x 105 0.70 25 10
4d 60 x 105 0.65 25 14
5a 10 x 106 0.65 25 10
6b 60 x 106 0.70 25 10
6d 60 x 106 0.65 25 14
7
5 0.65 25 10
4c 60 x 105 0.75 25 10
4e 60 x 105 0.65 25 17
6a 60 x 106 0.65 25 10
6c 60 x 106 0.75 25 10
6e 60 x 106 0.65 25 17 7a 10 x 10 0.65 25 10
Table 5: Summary of input parameters for all runs. Note that some volumes have varied solid fractions
and bed frictions so that the effect of these parameters could be investigated.
same location in the Rio Cutuchi several kilometers above the city of Latacunga. This
allows a detailed look at the effect of flows on the city without the consumption of large
amounts of computational time. Starting flows at the source is not possible at this time
39

d th l a involved in these simulations. Flows were started ue to e very ong w ll-time
w eachin ac that
ave
he aim of this study was to consider a range of ‘what if’ scenarios and not to attempt to
ic flow. A starting volume of 60 x 106 m3 was based on
). To
rder of magnitude were used ranging from 104 to 107 m3.
4 Solid Fra
Solid fractions for debris flows are considered to have in excess of 60% solid fraction (by
volume) and 80% by weight (Costa, 1984, 1988; Pierson and Costa, 1987). The initial
solid fraction value used (0.65) in the simulations is the m n value for the volum
p ortions typ ebris flows p and Nobles, 1953; Pierson, 1980, 1985, Scott,
1988). To consider the solid fraction used in previous studies (Barberi et al., 1992) and
to account for the full range of possible fractions, certain simulations used 0.7 and 0.75
.2.3 Internal Friction Angle
upstream of the city to e the fl had stabilized before r g Lat unga sonsure o
original pile shape would h no effect on inundation area.
4.2.1 Volumes
T
recreate any particular histor
volumes previously estimated for the 1877 lahar (Barberi et al., 1991; Mothes, 2006
ensure a range of volumes that will cover all possible events, two volume values for each
o
.2.2 ction
edia e
rop ical of d (Shar
solid fraction by volume.
4
The internal friction angle was chosen to be consistent with the successful 2005 Vazcún
Valley Lahar simulations, described in Chapter 3
40

4.2.4 Bed Friction Angle
The initial bed friction angle (10°) was the same as that used for the 2005 Vazcún Valley
imulations. This angle is used for the majority of the simulations; however, the effect of
tion angles was also tested for the Rio Cutuchi. Two other values were
2 ough 8a. Due to the early
evelopmental stage of the two-phase model, initiating a flow that would travel the
difficult. Problems were faced with pile shape and height, DEM
ut
d a
ersion of the data from the original grass sites files, but no
formation was lost in the process. It shows that volumes of less than 6 million m3 are
el and do not inundate large areas of the city. Larger
therefore not reported here.
s
different bed fric
chosen for the bed friction angle so that the range of angles (9°-17°) for fluvial deposits
(Stinton et al., 2004) could be considered.
4.3 Results
Successful simulation outputs were obtained for runs a thr
d
Latacunga Valley was
size, number of computational mesh points, memory crash and extremely long
computational time. Here, successful runs are defined as simulations for which an outp
was achieved. The simulations output grass sites files (for use in the GIS GRASS) an
text file readable in excel. Results are reported here as an inundation map (Figure 19).
This map shows the discrete point-data sets imported from the GRASS .sites files
overlayed on a topographic map for the area. This map was compiled within ArcGIS,
which required some conv
in
mostly contained with the chann
volumes overbank the channel in Latacunga. The volume in run 1a was too small to be
effectively simulated by the Titan2D model and is
41

The simulations show that a lahar passing through Latacunga would likely have a low
olid fraction was considered for two different volumes (60 x 105 m3 and 60 x 106 m3)
variable held constant. Figure 20 shows the inundation areas produced for
average velocity of <1 ms-1 to 2 ms-1 (refer to Chapter 3 on why average velocity should
be considered with caution) and with a low flow height of <1 m to 3 m. This is most
likely due to the low-gradient and broad width of the valley at this location.
4.3.1 Effect of solid fraction.
S
with all other
the range of solid fractions for both volumes. Whilst there is some change on the cell-
scale, there is little overall effect on inundation area when solid fraction is changed.
4.3.2 Effect of bed friction.
The same two volumes were also used to consider the effect of bed friction. The model is
known to be sensitive to bed friction and therefore a suitable value must be considered
carefully for successful simulations.
Figure 21 shows the effect of bed friction on inundation area for both volumes. The
smaller volume shows an increase in inundation area with increasing bed friction.
However, the larger volume shows little change of inundation area with changing friction
values.
42

Figure 19: Preliminary inundation map for the Latacunga Valley for various scale lahars.
43

a)
b)
3 and b) 60 x
106 m3. Note that there is very little change in overall area of the flow. For the higher solid fraction,
slightly more of the flow appears the be constrained to the Rio Cutuchi, this however, does not greatly
impact the overall flow inundation area.
Figure 20: Investigating the effects on inundation by varying solid fraction for a) 60 x 105 m
44

a)
b)
Figure 21: Investigating the effect on inundation by varying Bed friction for a) 60 x 105 m3 and b) 60 x
106 m3. Similarly to the solid fraction, changing bed friction has very little effect on the general inundation
area.
45

Chapter 5 Map of Probabilistic Lahar Inundation for the City of
Latacunga
5.1 Introduction
This study uses a two-step approach in assessing the impact on Latacunga by various
scale lahars in the event of a future eruption of Volcán Cotopaxi. Firstly, inundation
maps produced using simulations in Titan2D are used to generate probabilistic inundation
maps for the city. This considers not only the probability of a certain size lahar
inundating a particular area, but also the probability of such a size lahar occurring. The
ond step is to make a detailed analysis of the city with regards to the location of
hospitals, population centers, schools, major roadways and bridges etc. Combining this
analysis with probabilistic inundation will allow vulnerability to be realistically
quantified.
5.2 Probabilistic Inundation Map
The probability of a particular size lahar occurring is key to understanding the likelihood
of inundation for the city of Latacunga. This probability was derived from linking a
certain size lahar to a Volcanic Explosivity Index (VEI) value based on eruption
scenarios and historical data and then calculating the eruption frequency for each VEI.
Therefore, using a simple probability function (Equation 2) the conditional probability of
inundation by lahar was calculated.
sec
Pc = (Pi | Pe) (2)
46

Where Pc is the conditional probability of inundation by lahar, Pi is the probability o
47
f
inundation by a flow thicker than 10 cm (0 or 100%) and Pe is the probability of a
ing based on eruptive frequency (0 to 100%). The logic
=0 0.712 I =0.712
VEI 2
N =0
,
N = no inundation). Pe is based on historical data for Cotopaxi and is discussed later in this chapter.
particular size eruption occurr
tree illustrated in figure 22.
Pe Pi
I =0 1 VEI 5 0
N =0 0 I =0.102 1 VEI 4 0 N =0 0.102 I =0.169 1 Pc 0.169 VEI 3 0 N 1 0 0.0169 I =0.0169 1 VEI 1 0 N =0 Figure 22: Probability Tree. Where Pc is the conditional probability for inundation, Pe is the discrete probability of eruption, and Pi is the binary probability of an individual cell being inundated (I = inundated

5.2.1 Eruptive Scenarios and Historical Data as a guide to linking particular laha
volumes to VEI values.
Andrade et al., (2005) considered four likely eruptions scenarios for Volcán Cotopaxi
which are based on a series o
r
f VEI-sized eruptions. The first considers a small event
activity. This type of activity would likely
ty at Volcán
ld involve small-moderate ash emissions and
small lava flows. This may result in the gene ate size primary or
ited areas of the province.
violent
cenario considers locally important ash
eruptions fitting
riod which caused moderate sized lahars
long the main drainages of the volcano.
uld affect distal
ars
f great volume are expected to occur as a result of the interaction between the
yroclastic flows and the summit glaciers. These lahars would cause devastation along
e main drainages of the volcano and may take hundreds of kilometers to dilute to
(VEI 1-2) which is typified by Strombolian
become the ‘background’ activity in the event of the initiation of activi
Cotopaxi. It is predicted that scenario 1 wou
ration of small to moder
secondary lahars that would not reach the inhab
Scenario 2 takes into account a moderate event (VEI 2-3) characterized by
Strombolian to Vulcanian activity. This s
emissions, pyroclastic flows and lava flows of little extension. Historic
this scenario include the 1853-1854 eruptive pe
that represent a direct threat to the population a
The third scenario considers a great event (VEI 4) similar to that of the 1877 eruption.
Activity would be Vulcanian to Sub-Plinian with ash emissions that wo
communities. Pyroclastic flows (most likely of a ‘boiling-over’ nature) are likely to
occur, which would simultaneously descend several or all flanks of the volcano. Lah
o
p
th
48

hyperconcentrated stream flow. Andesitic lava flows are predicted in the crater but
would not extend below 3500 m. This scenario occurred frequently in the past,
km
tive
s
s
able
iebert
kin
particularly in the years 1742, 1744, 1768 and 1877.
Scenario 4 is a very large event of VEI 4-5 and corresponds to a Plinian eruption. This
highly explosive activity would result in ash accumulation of 1 -1.5 meters up to 10
from the summit. The column would collapse to form pyroclastic flows that could reach
up to 20-25 km from the crater. Consequent lahars would be greater than any recorded in
historical times and would approach the size of the Chillos Valley Lahar.
A simple table is reported here (Table 6, part II) as a guide to the link between erup
size and lahar size. This data, and published volumes for the 1877 and CVL lahar
(Mothes, 1991; Barberi et al, 1992; Mothes et al., 1998; Aguilera et al., 2004) are
combined with the eruption scenarios outlined by Andrade et al., (2005) to associate a
VEI to the range of lahar volumes used in the simulations (Table 7).
5.2.2 Eruption Frequency
Eruption frequency for each value of VEI (1-5) was calculated for all historical eruption
(since 1532) based on data presented by Siebert and Simkin (2002), summarized in T
6 part I. These eruption frequencies are presented in Table 7 for each VEI. It is
important to note that eruption frequency data differs depending on the source (S
and Simkin, 2002; Barberi et al., 1992; Mothes 1991, 2006) and therefore the probability
of occurrence is likely to differ depending on which source is used. Siebert and Sim
49

50
art ISiebert L, Simk 2
in T ( 002-)
Start: Year S MoD St a Stop: y c uption a mage VEI tart: y op: Ye r MoD Pla e of Er Tephra Lav Da
1942 217 1942 Ce219 nt ter erupti - mage (La propert , etc) 3? ral cra on Explosive - - - Da nd, y
1940 . . nt ter erupti sive - - 2 . . . . . . . . . . Ce ral cra on Explo - - - - - -
1939 . nt ter erupti sive - - 2 202 . . . . . . . Ce ral cra on Explo - - - - - -
1931 . . nt ter erupti sive - - 2 . . . . . . . . . . Ce ral cra on Explo - - - - - -
1926 . . nt ter erupti sive - - 2 . . . . . . . . . . Ce ral cra on Explo - - - - - -
1922 . . nt ter erupti sive - - 2 . . . . . . . . . . Ce ral cra on Explo - - - - - -
1908 . . ntral crater erupti sive - - 1 . . . 1914 . . . Ce on Explo - - - - - -
1907 . . ntral crater erupti sive - - 2 06 . . . . . . . . Ce on Explo - - - - - -
1906 821 1906 Ce919 ntral crater erupti sive - - 2 on Explo - - - - - -
1905 . . ntral crater erupti sive - - 2 . . . . . . . . . . Ce on Explo - - - - - -
1903 1 ntral crater erupti sive + Pyr clastic Flows hars 3 926 1904 2 . . Ce on Explo o - - - - La
1895 . . ntral crater erupti sive - - 2 . . . . . . . . . . Ce on Explo - - - - - -
1886 . . ntral crater erupti sive - - 2 01 . . . . . . . . Ce on Explo - - - - - -
1885 . ntral crater erupti sive + Pyr clastic Flows hars 2 723 . . . . . . . Ce on Explo o - - - - La
1883 . . ntral crater erupti sive + Pyr clastic Flows hars 2 12 . . . . . . . . Ce on Explo o - - - - La
1883 . . ntral crater erupti sive + Pyr clastic Flows hars 2 08 . . . . . . . . Ce on Explo o - - - - La
1882 . 0 ntral crater erupti sive - - 2 01 . 1882 3 . . Ce on Explo - - - - - -
1880 . 0 ntral crater eruption sive + Pyr clastic Flows hars 3 02 . 1880 7 . . Ce Explo o - - - - La
1879 226 1879 Ce619 ntral crater eruption sive + Pyr tic ? - - 2 Explo oclas Flows - - - - - -
1878 823 1878 Ce824 ntral crater eruption sive + Pyroclastic - - 2 Explo Flows - - - - - -
1877 . ntral crater eruption Explosive + Pyroclastic s talities, Damage, s 4 01 . 1877 902 Ce Flow - - - - Fa Lahar
1870 . . ntral crater eruption sive - - 2 - - - - - - . . . 1876 . . . Ce Explo
1869 . 0 ntral crater eruption sive - - 3 - - - - - - Explo07 . 1869 8 . . Ce
P

1868 815 1868 816 Central crater eruption Explosive - - - - - - - - 2
1867 . . . . . . . . . . . . Central crater eruption Explosive - - - - - - - - 2
1866 tion e 921 1866 926 Central crater erup Explosiv - - - - - - - - 2
1863 . . . . . . . . . . . . Central crater eruption Explosive + Pyroclastic Flows - - - - Lahars 2
1860 . . . . 1862 . . . . Central crater eruption Explosive - - - - - - - - 2
1859 . . . . . . . . . . . . Central crater eruption Explosive - - - - - - - - 2
1858 11 . . 1858 12 . . Central crater eruption Explosive + Pyroclastic Flows - - - - Lahars 2
1857 . . . . . . . . . . . . Central crater eruption Explosive - - - - - - - - 2
1856 10 . . 1856 12 . . Central crater eruption Explosive + Pyroclastic Flows - - - - Lahars 2
1856 05 . . . . . . . . . . Central crater eruption xplosive + Pyroclastic Flows - - - ahars E - L 2
1855 11 . . . . . . . . . . Central crater eruption xplosive + Pyroclastic Flows - - - ahars E - L 2
1854 914 . . . . . . . . Central crater eruption Explosive + Pyroclastic Flows - - - - Lahars 2
1854 403 . . . . . . . . Central crater eruption Explosive + Pyroclastic Flows - - - - Lahars 2
1853 Pyroclastic Flows lows 913 1853 915 Central crater eruption Explosive + Lava F Lahars 3
1852 . . . . . . . . . . . . Central crater eruption Explosive - - - - - - - - 2
1851 06 . . . . . . . . . . Central crater eruption Explosive - - - - - - - - 2
1850 . . . . . . . . . . . . Central crater eruption Explosive + Pyroclastic Flows - - - - Lahars 2
1845 04 . . . . . . . . . . Central crater eruption Explosive - - - - - - - - 2
1844 . . . . . . . . . . . . Central crater eruption Explosive - - - - - - - - 2
1803 , Lahars 104 1803 105 Central crater eruption Explosive + Pyroclastic Flows - - - - Damage 3
1768 404 . . . . . . . . Central crater eruption Explosive + Pyroclastic Flows - - - - Fatalities, Damage, Lahars 4
1766 210 1766 12 . . Central crater eruption Explosive + Pyroclastic Flows e, Lahars - - - - Damag 3
1750 0902a 1750 0904a Central crater eruption Explosive - - - - - - - - 2
1747 . . . . 1749 . . . . Central crater eruption Explosive - - - - - - - - 2
1746 02 . . . . . . . . . . Central crater eruption Explosive - - - - - - - - 2
1744 05 . . 1744 12 . . Central crater eruption Explosive + Pyroclastic Flows lows? e, Lahars Lava F Damag 4
1743 Pyroclastic Flows 927 1743 1004 Central crater eruption Explosive + - - - - Lahars 2
51

1743 04 . . . . . . . . . . Central crater eruption Explosive + Pyroclastic Flows e, Lahars - - - - Damag 4 1742 1209 . . . . . . . . Central crater eruption + Radial Fissure Eruption + Pyroclastic Flows ies, Damage, Lahars Explosive - - - - Fatalit 3?
1742 615 1742 07 . . + Pyroclastic Flows ies, Damage, Lahars Central crater eruption Explosive - - - - Fatalit 4
1740 . . . . 1741 . . . . Central crater eruption Explosive - - - - - - - - 2
1738 . . . . . . . . . . . . Central crater eruption Explosive + Pyroclastic Flows s - - - - Lahar 2
1698 . . . . . . . . . . . . Central crater eruption Explosive + Pyroclastic Flows ies, Damage, Lahars - - - - Fatalit 3?
1534 06 . . 1534 07 . . Central crater eruption Explosive + Pyroclastic Flows - - - - Damage, Lahars 4
1533 10 . . 1533 11 . . Central crater eruption Explosive - - - - Lahars 2
1532 1115 . . . . . . . . Central crater eruption Explosive - - - - Damage, Lahars? 3
1400w lows? . . . . . . . . . . . . Central crater eruption Explosive Lava F - - - -
1260w lows? . . . . . . . . . . . . Central crater eruption Explosive Lava F - - - -
1130u Pli an . . . . . . . . . . . . Central crater eruption Explosive + Pyroclastic Flows - - - - - - - - ni
0950x . . . . . . . . . . . . Central crater eruption Explosive - - - - - - - -
0770u Pli an . . . . . . . . . . . . Central crater eruption Explosive - - - - - - - - ni
0760m . . . . . . . . . . . . Central crater eruption Explosive - - - - - - - -
0740u + Pyroclastic Flows Pli an . . . . . . . . . . . . Central crater eruption Explosive - - - - - - - - ni
0550x . . . . . . . . . . . . Central crater eruption Explosive - - - - - - - -
0370x . . . . . . . . . . . . Central crater eruption Explosive - - - - - - - -
0180v Pli an . . . . . . . . . . . . Central crater eruption Explosive - - - - - - - - ni
0140s . Pli an . . . . . . . . . . . Central crater eruption Explosive - - - - - - - - ni
0110s . . . . . . . . . . . . Central crater eruption Explosive - - - - - - - -
0070w Pli an . . . . . . . . . . . . Central crater eruption Explosive - - - - - - - - ni
-0080w entral crater eruption Explosive - - - - - - . . . . . . . . . . . . C - -
- 0230x . . . . . . . . . . . . Central crater eruption Explosive - - - - - - - -
- 1510w . . . . . . . . . . . . Central crater eruption Explosive - - - - - - - -
-2220v . . . . . . . . . . . . Central crater eruption Explosive - - - - - - - -
- e, Lahars 2640x . . . . . . . . . . . . Central crater eruption Explosive + Pyroclastic Flows - - - - Fatalities, Damag
52

Part II Mothe 91 VEI s, 19
3? Year tensity Areas Where Lahars Arrived In
2
2
2
2
2
1914 Small
1 1912 Small
2
2
2 19 te 06 Modera
3 19 05 Small
2 19 03 Small
2
2 1886 Moderate
2 1885 Moderate Latacunga
2
2
3
2 1880 Moderate Information Not Available
2 1879 Small
4 1878 Small Information Not Available
2 1877 Large Latacunga + Valle De Los Chillos + Rio Napa
3
2
2
2
2 1866 Moderate Latacunga
2 1863
2 1860
2 1859
2 1858
2 1857
2 1856 Small Rio Napa
2
2
2 1854 Moderate Latacunga
3
2 1853 Moderate Information Not Available
2
53

2
2
2 1845 Small Information Not Available
3
4 18 3 oderate formation Not Available 0 M In
3 1768 arge atacunga + Valle De Los Chillos + Rio Napa L L
1766 arge atacunga + Information Not Available L L
2 17 8 mall 5 S
2
2
4 1746 Moderate atacunga L
2 1744 arge atacunga + Valle De Los Chillos + Rio Napa L L
4 17 3 oderate atacunga 4 M L
3? atacunga 1742 Large L4 1742 Moderate atacunga L
2 1742 Large Latacunga
2
3?
4
2 15 4 oderate 3 M
3
3 Table 6: His l req har information. (2002) is chosen here as it the most comprehensive, detailed history for Volcán
Cotopaxi.
5.2.3 Generation of the Probability Map
The final step in generating the probability map is combining the probability values
reported in Table 7 with the inundation map (for flow thicknesses > 10 cm) produced
from ulations (Figure 19).
First, the inu da on files were interpolated to produce an even grid for realistic, easy
interpretatio ecause the point data output by Titan2D represents a central point
of the surrounding cells in the refined mesh which may be of a different size than the
torica eruptive f uency and associated la
is
the Titan2D sim
n ti
n. This is b
54
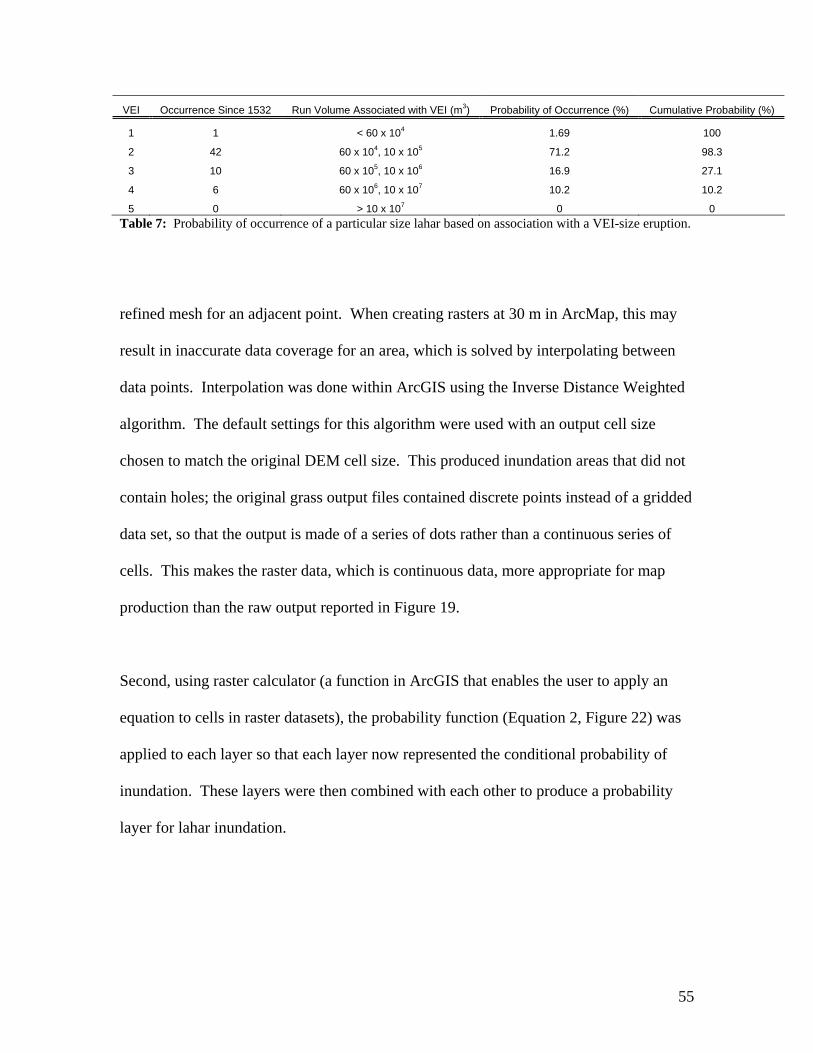
VEI Occurrence Since 1532 un Volume Associated with VEI (m3) Probability of Occurrence (%) Cumulative Probability (%) R
1 1 < 60 x 104 1.69 100
2 5 71.2 98.3
3 10 60 x 105, 10 x 106 16.9 27.1
4 7 10.2 10.2
5 0 0
42 60 x 104, 10 x 10
6 60 x 106, 10 x 10
0 > 10 x 107
Table 7: Pr it curre association with a VEI-size eruption.
refined me r e When creating rasters at 30 m in ArcMap, this may
result in inaccurate data coverage for an area, which is solved by interpolating between
data points. Interpolation was done within ArcGIS using the Inverse Distance Weighted
algorithm. The default settings for this algorithm were used with an output cell size
chosen to ma DEM cell size. This produced inundation areas that did not
contain holes; the original grass output files contained discrete points instead of a gridded
an a continuous series of
ap
han the raw output reported in Figure 19.
ArcGIS that enables the user to apply an
as
d with each other to produce a probability
yer for lahar inundation.
obabil y of oc nce of a particular size lahar based on
sh fo an adjac nt point.
tch the original
data set, so that the output is made of a series of dots rather th
cells. This makes the raster data, which is continuous data, more appropriate for m
production t
Second, using raster calculator (a function in
equation to cells in raster datasets), the probability function (Equation 2, Figure 22) w
applied to each layer so that each layer now represented the conditional probability of
inundation. These layers were then combine
la
55

This p s p d
m p layer and cadastral data to produce the final ‘Map of Probabilistic Lahar Inundation
for the City of Latacunga’ so that the
on for the City of Latacunga
his final map (figure 23) required four inputs to be combined in a GIS: the probability
detailed survey of the city of Latacunga was completed using handheld GPS and
ta sets allow for a detailed analysis and discussion of
rability of the city of Latacunga to various scale lahars in the event of a future
eruption.
robability layer ha been combined with a topogra hic map layer, a detaile street
a
vulnerability of Latacunga can be assessed.
5.3 Map of Probabilistic Lahar Inundati
T
of lahar inundation layer, a topographic map, a detailed street map of Latacunga and a
shapefile of cadastral data for the city.
The topographic map, a 1:50,000 topographic map with 40 m contour intervals, was
scanned and georectified. The map was originally produced by the Instituto Geografico
Militar (IGM), Quito in 1990.
The street map of Latacunga was provided by city authorities in the form of an AutoCAD
file. This was then imported into ArcGIS and georectified using a combination of GPS
data points and anchor points from the topographic map. This map provides a level of
detail not available from the topographic map that is useful for vulnerability analysis.
A
included a study of the location of schools, clinics, hospitals, utilities, municipal
buildings and places of population concentration (such as large factories, prisons and
markets). The accuracy of these data points was tested against the topographic map and
only data points with a five satellite reception were used.
The combination of these da
the vulne
56

The probability of inundation is calculated for each of the three VEI classes of eruptions
at Cotopaxi that would likely produce lahars reaching Latacunga. The results are
displayed on two maps to incorporate both the likely minimum and maximum volumes of
hars associated with these eruptions. Figure 23A shows the lower limit of expected
t of
la
inundations for the three VEI classes and Figure 23B shows the upper limi
inundations caused by the maximum expected volumes for each VEI class. The
discussion of the vulnerability of the city of Latacunga uses the maximum limit of
inundation.
57

Figure 23a: Map of probabilistic lahar inundation for the city of Latacunga for the lower limit of expected
volumes. Medical clinics are represented as crosses, hospitals as H’s, municipal buildings as circles,
schools and colleges as flags, the electric substation as a lightening bolt, the airport and military base as a
airplane and places of population concentrations as triangles. A detailed look at the city center and these
buildings is presented in Chapter 6.
58

Figure 23b: Map of probabilistic lahar inundation for the city of Latacunga for the upper limit of expected
lahar volumes. Symbols are the same as for figure 23a.
59

Chapter 6 Discussion: Assessing the Vulnerability of Latacunga
The Map of Probabilistic Lahar Inundation for the City of Latacunga provides the basis
for assessing the vulnerability of the city in the event of a lahar. This map is comprises
of four layers in a GIS, two of which can be queried for information on probability of
lahar inundation at a point or the location of important features in the city. It is using this
GIS that has enabled for the study presented here. Figure 24 shows a detailed section of
this map for the city center of Latacunga.
6.1 Impact on the City of Latacunga by Large Scale Events
A large scale event is characterized by an eruption of VEI 4 or higher, as discussed in
Scenario 3. This size event is similar to the 1877 eruption for which lahar volumes of 60
million m3 and 100 million m3 are here used. The majority of the city of Latacunga and
the adjacent town of San Felipe face a 10% conditional probability of inundation if a
lahar were to occur from this size eruption. Damage could be caused to most major
structures including all of the schools, all of the clinics and hospitals, the military base
and airport, the electric substation and the office of Civil Defense. Also affected by this
inundation zone is the prison, which has a capacity for 160 prisoners and the Plaza Rafael
Cajio Market which has hundreds of traders and customers every day, many of whom
travel from villages across the Cotopaxi Province. These large centers of population
concentration would be difficult to evacuate in an emergency.
60

igure 24: Detailed look at the Probabilistic Lahar Inundation map for the city centre. Maximum limits of
undations shown.
F
in
61

A flow of this size could have a devastating effect on the infrastructure of the city. The
Pan American highway may be covered by the thickest part of the flow outside of the
channel itself, inhibiting access to the city by emergency vehicles. It is likely all four
bridges connecting the city could endure structural damage and would likely not be a safe
route for evacuation.
The probabilistic inundation area for a large event will affect the entire business district
for the city and the majority of the residential areas, endangering the lives of the 52,000
inhabitants. The widespread effect of such an inundation is important for evacuation
procedures and the rescue efforts in the event of a disaster. Access to survivors would be
limited due to the destruction of all major roads into the city. The ability to care for
survivors would also require a substantial amount of outside assistance as all essential
facilities such as electricity, medical care and the local military base are all within the
10% probability zone.
Extreme events as discussed in scenario 4 would inundate an area greater than that
considered in scenario 3, but would have a conditional probability of less than 10% for
inundation. The lack of occurrence of Plinian eruptions in historic times makes the
probability tend towards 0%, however, reporting a 0% value would be irresponsible as it
is not certain that an event of this size might never occur.
62

B
eruption of VEI 3, as discussed in Scenario
unga and the majority of the adjacent town of
of inundation if an eruption of this size
were to occur. Damage to 50% of the schools, the prison, 50% of the clinics and one out
of the two hospitals could occur. The substation, the Pan American highway and other
Figure 25: Bridges from the city of Latacunga
across the Rio Cutuchi to the Pan American
Highway. Down the left a) Bridge 5 de Julio b)
ridge Felix Valencia c) Bridge Benjamin Tepan and
d) Bridge Av Ruminahui.
6.2 Impact on the City of Latacunga by Moderate Scale Events
A moderate scale event is characterized by an
2. Approximately half of the city of Latac
San Felipe faces a 27% conditional probability
63

major roadways could also be devastated. The southern-most bridge connecting the city
(Figure 25 d) is the smallest of all of the bridges and would likely only allow small
discharges to pass under and could be overtopped by a lahar of the size considered here.
This would disrupt evacuation for the lower third of the City. If this bridge were to
become blocked by debris, unexpected inundation may occur for larger areas than
predicted due to the channel being restricted at this point. Downstream from this
particular bridge is the Hospital IESS. Whilst this hospital lies just outside of the 27%
probable inundation zone, it should be noted that the boarder of the grounds reach to the
limits of the Rio Cutuchi (Figure 26) and therefore should also be considered at risk from
a moderate event, particularly in the event of channel overbanking caused by the Av.
Ruminahui Bridge.
6.3 Impact on the City of Latacunga by small scale events.
A small scale event is characterized by an eruption of VEI 1-2, as discussed in Scenario
1. It is unlikely that an eruption of this size w
of Latacunga. Any flows that did reach this d be small, possible
hyperconcentrated stream flow and restricted to the channel or parts of the valley that are
open and wide where the channel is ill-defined. An area such as this does occur to the
north of Latacunga and there is a 98% chance that the areas immediately surrounding the
channel will be inundated by a flow greater than 10 cm thick. This would have a minimal
impact on this low population density area although some disruption may be caused to
the Pan American Highway.
ill generate a lahar that would reach the city
distal community woul
64

Figure 26: Hospital IESS built up to the limits of the Rio Cutuchi (in foreground).
6.4 Implications for hazard assessment
The Probabilistic Inundation Map for the City of Latacunga presented here portrays a
different scenario than that displayed in the current hazard map (Hall, 2004). In reality,
hazard zones are not defined by lines as they often are on classic hazard maps. Having a
delineated risk zone portrays a false impression of the hazardous phenomena to the
decision makers and policy holders. Is it realistic that one side of a street is at risk of
destruction whilst the other is considered safe? Whilst the answer may be obvious to the
volcanological community, such questions are not well handled by decision making
authorities or the general public. This can either lead to a false sense of security or fear
r those in designated safe or risk zones or mistrust of the maps produced and the advice fo
65

given by scientists. A probability map, such as figure 24, does not depict risk zones with
lines. It presents the gradations of probability of inundation in the event of a future
eruption and does not require a decision on where it is safe and where there is risk. In
this way, decision making authorities and the general public are able to consider the risk
they face based upon the data. They will be able to make educated decisions on whether
this level of risk is acceptable for them as an individual, or as a city authority,
themselves. Not only does this allow for the individual person or city to take
responsibility for their own protection from hazardous phenomena, but it also relieves the
scientist from shouldering that responsibility themselves. The eruptions at Montserrat
(1995-present) and the legal difficulties now faced by scientists who were forced into
decision making positions, has highlighted the need for this shift in responsibility
(Dunkley, 2006).
ul tool for considering mitigation plans for the
the
e
With this in mind, this map provides a usef
city of Latacunga. It is clear that many of the essential resources of the city lie within
27% probability region. The Civil Defense responsible for the city of Latacunga are
preparing for an eruption in light of the recent activity at Volcán Cotopaxi. They have
made plans for several ‘refugios’ on the high ground surrounding Latacunga and San
Felipe. However, how the refugees seeking shelter at the refugios will be provided for in
terms of clean water, electricity, food and medical attention is uncertain. The city is also
making plans for a new hospital to be built on higher ground considered in the ‘safe’
zone. However, the finances for such an undertaking are limited and city authorities hav
relied on a land donation for the location of the new hospital. Unfortunately, the donated
66

plot is on the west side of the Rio Cutuchi and Pan American highway with Latacunga on
the east. It is unlikely, therefore, that this new institution would be accessible for the
majority of the Latacunga population.
Currently, there is no land development zoning in place for the city. Building continues
in high risk areas, often without any control by the authorities. The vulnerabili
city to a lahar could be dramatically reduced by restricting building, in particul
density residential and business districts, in high risk areas. Similar land use zoning is
implemented in many cities around the world, for example, the coastal region of Hilo,
Hawaii is reserved for parkland only to reduce the vulnerability to tsunamis.
6.5 Conclusion
ty of the
ar high
conclusion, it is clear that an eruption greater than VEI 3 could produce lahars that
ity
r
In
would impact the city of Latacunga. There is a 27% chance that a future eruption could
devastate large areas of the city including all vital resources.
This study utilized historical data, computer simulations and a detailed survey of the c
of Latacunga to assess this impact and several important implications from this work
have been identified. Whilst this study is very detailed and concentrated on a particula
city in one drainage of Volcán Cotopaxi, the methods explored herein are transferable to
other cities in the region and to other cities on volcanoes. Studies such as these require
time and careful consideration and therefore should not be neglected until a time of
volcanic crisis. With the increase in computational power and availability of detailed
data, studies such as this will become easier in the future and will provide a key insight
67

into the impact of volcanological phenomena on cities located in the shadow of a
volcano.
68

References
Aguilera, E., Pareschi, M. T., Rosi, M., Zanchetta, G., 2004. Risk from lahars in the
northern valleys of Cotopaxi Volcano (Ecuador), Natural Hazards: 33 (2).
Andrade, D., Hall, M., Mothes, P., Troncoso, L., Eissen, J.-P., Samaniego, P., Egred, J.,
Ramon, P., Rivero, D., Yepes, H., 2005. Los peligros volcánicos asociados con
el Cotopaxi, Corporación Editora Nacional, Quito.
Arboleda, R.A. and Martinez M, 1996. 1992 Lahars in the Pasig-Potrero River System.
In: Fire and mud: eruptions and lahars of Mount Pinatubo, Philippines, C.G.
Newhall, and R.S. Punongbayan (eds), Philippine Institute of Volcanology and
Seismology, Quezon City, Philippines and University of Washington Press,
United States, 1115 p
Barberi, F., Macedonio, G., Pareschi, M.T., 1991. Numerical simulation of past lahars:
implication for hazard assessment. International Conference on Active
Volcanoes and Risk Mitigation, Napoli 1991. 27 August-1 September, Naples,
Italy.
Barberi, F., Caruso, P., Macedonio, G., Pareschi, M.T., Rosi, M., 1992. Reconstruction
and numerical simulation of the lahar of the 1877 eruption of Cotopaxi Volcano
(Ecuador). Acta Vulcanologica 2: 35-44.
Barberi F, Coltelli M, Frullani A, Rosi M, Almeida E, 1995. Chronology and dispersal
characteristics of recently (last 5000 years) erupted tephra of Cotopaxi
(Ecuador): implications for long-term eruptive forecasting. Journal of
Volcanology and Geothermal research 69: 217-239.
69

Costa, J.E., 1984. Physical geomorphology of debris flows. In: Costa, J.E. and Fleisher,
P.J., eds., Developments and applications of geomorphology: Springer-Verlag,
Berlin. P. 269-317.
Costa, J. E., 1988. Rheologic, geomorphic, and sedimentologic differentiation of water
floods, hyperconcentrated flows, and debris flows. In: V. R. Baker et al. (eds),
Flood Geomorphology, John Wiley & Sons, New York, pp. 113–122.
Costa, J.E., 1997. Hydraulic modeling for lahar hazards at Cascades volcanoes,
Environmental & Engineering Geoscience, 3 (1).
Dunkley, P., 2006. Problems and lessons learned at the Soufrière Hills Volcano,
Montserrat. Cities on Volcanoes 4, IAVCEI, Quito, 2006. 23 – 27 January,
Quito, Ecuador.
Fread, D.M., 1988, The National Weather Service DAMBRK Model: Theoretical
background/user documentation. Hydraulic Research Laboratory, National
Weather Service, Silver Spring, MD, 320 p
Hall, M., Mothes, P., Samaniego, P., Yepes, H., Andrade, D., 2004. Mapa regional de
los peligros volcánicos potenciales del volcan Cotopaxi, Zona Sur. Esc 1:50,000.
Instituto Geofisico, Esc. Politecnica Nacional, Quito.
Iverson, R.M., 1997. The physics of debris flows. Reviews of Geophysics 35, 245-296.
Iverson, R.M., Schilling, S.P., Valance, J.W., 1998. Objective delineation of lahar
inundation zones. Geol. Soc. Am. Bull. 110, 972– 984.
Macedonio, G., Pareschi, M.T., 1992. Numerical simulations of some lahars from Mt St
Helens. Journal of Volocanology and Geothermal Research. 54: 65-80.
70

Major, J.J., Newhall, C.G., 1989. Snow and ice perturbation during historical volcanic
eruptions and formation of lahars and floods. Bulletin of Volcanology. 52: 1-27.
Molina, I., Kumagai, H., Garcia, A., Nakano, M., Mothes, P., 2006. Source process of
very-long-period events accompanying long-period signals at Cotopaxi Volcano,
Ecuador. Cities on Volcanoes 4, IAVCEI, Quito, 2006. 23 – 27 January, Quito,
Ecuador.
Mothes, P., 1991. Lahars of Cotopaxi Volcano, Ecuador: Hazard and risk evaluation.
In: McCall, G.J.H., Laming, D.J.C., Scott, S.C. edits., Geohazrds: Natural and
man-made. Chapman and Hall, London, pp. 53-64
Mothes, P., Hall, M., Janda, R.J., 1998. The enourmous Chillos Valley Lahar: an ash-
flow generated debris flow from Cotopaxi Volcano, Ecuador. Bulletin of
Volcanology. 59: 233-244.
Mothes, P., 2006. Cotopaxi Volcano and the surrounding valleys. Intra-meeting Field
Trip Guide. Cities on Volcanoes 4, IAVCEI, Quito, 2006. 23 – 27 January,
Quito, Ecuador.
Mothes, P., Hall, M., Andrade, D., Samaniego, P., Pierson, T., Ruiz, A.G., Yepes, H.,
2006. Character, Stratigraphy and Magnitude of historical lahars—Cotopaxi
Volcano, Ecuador. Cities on Volcanoes 4, IAVCEI, Quito, 2006. 23 – 27
January, Quito, Ecuador.
O’Brian, J.S., Julien, P.Y., Fullerton, W.T., 1992. Two-dimensional waterflood and
mudflow simulation. Journal of Hydraulic Engineering. 119: 244-261
71

Patra, A.K., Bauer, A.C., Nichita, C., Pitman, E.B., Sheridan, M.F. and Bursik, M., 2005
Parallel Adaptive Numerical Simulation of Dry Avalanches over Natural Terrain.
Journal of Volcanology and Geothermal Research 139: 1-2.
Pierson, T. C., 1980. Erosion and deposition by debris flows at Mt.Thomas, North
Canterbury, New Zealand. Earth Surf. Processes. 5: 227–247.
Pierson, T., 1985. Initiation and flow behavior of the 1980 Pine Creek and Muddy River
lahars, Mount St. Helens, Washington. GSA Bulletin. 96: 1056-1069
Pierson, T., Janda, R.J., Thouret, J.C., Borrero, C.A., 1990. Perturbation and Melting of
Snow and Ice by the 13 November 1985 Eruption of Nevado del Ruiz, Colombia,
and Consequent Mobilization, Flow and Deposition of Lahars. Journal of
Volcanology and Geothermal Research. 41: 17-66
Pierson, T.C., Janda, R.J., Umbal, J.V., Daag, A.S., 1992. Immediate and Long-Term
Hazards from Lahars and Excess Sedimentation in Rivers Draining Mt. Pinatubo,
Philippines. U.S. Geol. Surv. Water-Resources Investigations Report 92-4039,
35p, includes map.
Pierson, T. C., and J. E. Costa, 1987. A rheologic classification of subaerial sediment-
water flows, in Debris Flows/Avalanches:Process, Recognition, and Mitigation,
Rev. Eng. Geol., vol. 7, edited by J. E. Costa and G. F. Wieczorek, pp. 1–12,
Geol. Soc. of Am., Boulder, CO.
Pitman, E.B., Le L., 2005. A two-fluid model for avalanche and debris flows.
Philosophical Transactions of the Royal Society A: Mathematical, Physical and
Engineering Sciences. 363: 1471-2962
72

Ramon, P., Rivero, D., Boker, F., Yepes, H., 2006. Thermal monitoring using a portable
IR camera. Results on Ecuadorian volcanoes. Cities on Volcanoes 4, IAVCEI,
Quito, 2006. 23 – 27 January, Quito, Ecuador.
Rivero, D., Troncoso, L., Barba, D., Ramon, P., Yepes, H., 2006. Anomalous activity at
Cotopaxi studied with integrated seismic, thermal and visual observations. Cities
on Volcanoes 4, IAVCEI, Quito, 2006. 23 – 27 January, Quito, Ecuador.
Rodolfo, K.S., 1989. Origin and early evolution of lahar channel at Mabinet, Mayon
volcano, Philippines. Geological Society of American Bulletin. 101: 414-426.
Rodriguez, E., C.S. Morris, J.E. Belz, E.C. Chapin, J.M. Martin, W. Daffer, S. Hensley,
2005. An assessment of the SRTM topographic products. Technical Report JPL
D-31639, Jet Propulsion Laboratory, Pasadena, California, 143 pp.
Savage, S. B., and K. Hutter, 1989. The motion of a finite mass ofgranular material
down a rough incline. J. Fluid Mech., 199: 177–215,.
Scott, K.M., 1988. Origins, behavior, and sedimentology of lahars and lahar-runout
flows in the Toutle-Cowlitz River system, Mount St. Helens, Washington. U.S.
Geological Survey Professional Paper 1447-A, 74 p
Sharp, R. P., and L. H. Nobles, 1953. Mudflow of 1941 at Wrightwood, southern
California, Geol. Soc. Am. Bull. 64: 547–560.
Sheridan M.F., Bonnard C., Carreno R., Siebe C., Strauch W., Navarro M., Calero J.C.,
Trujillo N.B., 1999. Report on the 30 October 1998 Rock Fall/Avalanche and
breakout flow of Casita Volcano, Nicaragua, Triggered by Hurricane Mitch.
Landslide News. No 12.
73

Sheridan M.F., Stinton A.J., Patra A., Pitman E.B., Bauer A., Nichita C.C., 2005.
Evaluating Titan2D mass-flow model using the 1963 Little Tahoma Peak
avalanches, Mount Rainier, Washington. Journal of Volcanology and Geothermal
Research 139: 89-102.
Siebert L., and Simkin T., 2002. Volcanoes of the World: an Illustrated Catalog of
Holocene Volcanoes and their Eruptions. Smithsonian Institution, Global
Volcanism Program, Digital Information Series, GVP-3,
(http://www.volcano.si.edu/world/).
Sodiro, L., 1877. Relacion sobre la erupcion del Cotopaxi acaecida el dia 26 de junio de
1877. Imprenta Nacional, Quito, Ecuador. 40p.
Sorenson, O., W.I. Rose and D. Jaya, 2003, Lahar hazard modeling at Tungurahua
Volcano, Ecuador. Geophysical Research Abstracts, Vol. 5, 02352.
Stinton, A.J., Sheridan, M.F., Patra, A., Dalbey, K., and Namikawa, L.M., 2004.
Integrating variable bed friction into Titan2D mass-flow model: application to the
Little Tahoma Peak avalanches, Washington, Acta Volcanologica. 16, 153-163
Tanguy, J.C., Ribiere, C., Scarth, A., Tjetjep, W.S., 1998. Victims from volcanic
eruptions; a revised database. Bulletin of Volcanology. 60(2): 137– 144.
Takahashi, T., 1978. Mechanical characteristics of debris flow. J.Hydraul. Div. Am.
Soc. Civ. Eng., 104: 1153–1169.
Takahashi, T., 1980. Debris flow on prismatic open channel. J. Hydraul.Div. Am. Soc.
Civ. Eng. 106: 381–396
Vallance JW, 2000. Lahars. In: Encyclopedia of Volcanoes, H Sigurdsson (Ed in
Chief), Academic Press, United States: pp 601.
74

Voight, B., 1990. The 1985 Nevado del Ruiz volcano catastrophe: anatomy and
retrospection. Journal of volcanology and geothermal research. 44: 349—386.
Wickmann, 1976. Markov Models for Repose-Period Patterns. Springer-Verlag, 135-
161.
Wolf, T., 1878. Memoria sobre el Cotopaxi y su ultima erupcion acaecida el 26 de junio
de 1877. Imprenta del Comercio, Guayaquil, Ecuador. 64pp.
Censos 2001, Instituto Nacional de Estadistica y Censos, 2005 http://www.inec.gov.ec
Accessed February 8th 2005, 10:14pm EST
Global Volcanism Program. http://www.volcano.si.edu/world/volcano.cfm?vnum=1502-
05=&VErupt=Y&VSources=Y&VRep=Y&VWeekly=Y Accessed March 9,
2005, 9.35pm
75