Examining the impact of lahars on buildings using ... · S. R. Mead et al.: Examining the impact of...
17
Nat. Hazards Earth Syst. Sci., 17, 703–719, 2017 www.nat-hazards-earth-syst-sci.net/17/703/2017/ doi:10.5194/nhess-17-703-2017 © Author(s) 2017. CC Attribution 3.0 License. Examining the impact of lahars on buildings using numerical modelling Stuart R. Mead 1,2,3 , Christina Magill 1 , Vincent Lemiale 2 , Jean-Claude Thouret 4 , and Mahesh Prakash 2 1 Risk Frontiers, Department of Environmental Science, Macquarie University, Sydney, Australia 2 Commonwealth Scientific and Industrial Research Organisation, Clayton 3168, Victoria, Australia 3 Volcanic Risk Solutions, Institute of Agriculture and Environment, Massey University, Private Bag 11 222, Palmerston North, New Zealand 4 Université Clermont Auvergne, CNRS, IRD, OPGC, Laboratoire Magmas et Volcans, 63000 Clermont-Ferrand, France Correspondence to: Stuart R. Mead ([email protected]) Received: 29 August 2016 – Discussion started: 2 September 2016 Revised: 5 April 2017 – Accepted: 14 April 2017 – Published: 17 May 2017 Abstract. Lahars are volcanic flows containing a mixture of fluid and sediment which have the potential to cause signif- icant damage to buildings, critical infrastructure and human life. The extent of this damage is controlled by properties of the lahar, location of elements at risk and susceptibil- ity of these elements to the lahar. Here we focus on under- standing lahar-induced building damage. Quantification of building damage can be difficult due to the complexity of lahar behaviour (hazard), varying number and type of build- ings exposed to the lahar (exposure) and the uncertain sus- ceptibility of buildings to lahar impacts (vulnerability). In this paper, we quantify and examine the importance of lahar hazard, exposure and vulnerability in determining building damage with reference to a case study in the city of Are- quipa, Peru. Numerical modelling is used to investigate lahar properties that are important in determining the inundation area and forces applied to buildings. Building vulnerabil- ity is quantified through the development of critical depth– pressure curves based on the ultimate bending moment of masonry structures. In the case study area, results suggest that building strength plays a minor role in determining over- all building losses in comparison to the effects of building exposure and hydraulic characteristics of the lahar. 1 Introduction Lahars, defined as gravity-driven flows containing a mixture of volcanic sediment and water (Vallance and Iverson, 2015), have caused severe damage to infrastructure and buildings (e.g. de Bélizal et al., 2013; Pierson et al., 2013; Ettinger et al., 2015; Jenkins et al., 2015) in addition to being responsi- ble for a large proportion of volcanic fatalities (Auker et al., 2013). Assessing the extent of potential lahar damage can be difficult due to the complexity of flow behaviour, vary- ing number of elements (e.g. buildings and bridges) exposed to lahars and a lack of knowledge on the structural capac- ity of these elements to withstand damage-causing compo- nents of the lahar flow. Using the common definitions of Varnes (1984), we define the damaging components of la- har flow (e.g. velocity, depth and pressure) as the hazard, en- vironmental characteristics of exposed elements (e.g. build- ing locations and orientations) as the exposure and the abil- ity of exposed elements to withstand the hazard (e.g. build- ing strength) as vulnerability. Lahar-induced damage is con- trolled by the interactions of these factors; however, the im- portance of each component can vary. Here we focus on quantifying and examining the role of hazard, exposure and vulnerability in determining lahar-induced building damage. Post-event field assessments of building damage can elicit information relating lahar hazard to structural damage. How- ever, these assessments tend to only record information on substantial damage, are affected by terrain changes during Published by Copernicus Publications on behalf of the European Geosciences Union.
Transcript of Examining the impact of lahars on buildings using ... · S. R. Mead et al.: Examining the impact of...

Nat. Hazards Earth Syst. Sci., 17, 703–719, 2017www.nat-hazards-earth-syst-sci.net/17/703/2017/doi:10.5194/nhess-17-703-2017© Author(s) 2017. CC Attribution 3.0 License.
Examining the impact of lahars on buildings using numericalmodellingStuart R. Mead1,2,3, Christina Magill1, Vincent Lemiale2, Jean-Claude Thouret4, and Mahesh Prakash2
1Risk Frontiers, Department of Environmental Science, Macquarie University, Sydney, Australia2Commonwealth Scientific and Industrial Research Organisation, Clayton 3168, Victoria, Australia3Volcanic Risk Solutions, Institute of Agriculture and Environment, Massey University,Private Bag 11 222, Palmerston North, New Zealand4Université Clermont Auvergne, CNRS, IRD, OPGC, Laboratoire Magmas et Volcans,63000 Clermont-Ferrand, France
Correspondence to: Stuart R. Mead ([email protected])
Received: 29 August 2016 – Discussion started: 2 September 2016Revised: 5 April 2017 – Accepted: 14 April 2017 – Published: 17 May 2017
Abstract. Lahars are volcanic flows containing a mixture offluid and sediment which have the potential to cause signif-icant damage to buildings, critical infrastructure and humanlife. The extent of this damage is controlled by propertiesof the lahar, location of elements at risk and susceptibil-ity of these elements to the lahar. Here we focus on under-standing lahar-induced building damage. Quantification ofbuilding damage can be difficult due to the complexity oflahar behaviour (hazard), varying number and type of build-ings exposed to the lahar (exposure) and the uncertain sus-ceptibility of buildings to lahar impacts (vulnerability). Inthis paper, we quantify and examine the importance of laharhazard, exposure and vulnerability in determining buildingdamage with reference to a case study in the city of Are-quipa, Peru. Numerical modelling is used to investigate laharproperties that are important in determining the inundationarea and forces applied to buildings. Building vulnerabil-ity is quantified through the development of critical depth–pressure curves based on the ultimate bending moment ofmasonry structures. In the case study area, results suggestthat building strength plays a minor role in determining over-all building losses in comparison to the effects of buildingexposure and hydraulic characteristics of the lahar.
1 Introduction
Lahars, defined as gravity-driven flows containing a mixtureof volcanic sediment and water (Vallance and Iverson, 2015),have caused severe damage to infrastructure and buildings(e.g. de Bélizal et al., 2013; Pierson et al., 2013; Ettinger etal., 2015; Jenkins et al., 2015) in addition to being responsi-ble for a large proportion of volcanic fatalities (Auker et al.,2013). Assessing the extent of potential lahar damage canbe difficult due to the complexity of flow behaviour, vary-ing number of elements (e.g. buildings and bridges) exposedto lahars and a lack of knowledge on the structural capac-ity of these elements to withstand damage-causing compo-nents of the lahar flow. Using the common definitions ofVarnes (1984), we define the damaging components of la-har flow (e.g. velocity, depth and pressure) as the hazard, en-vironmental characteristics of exposed elements (e.g. build-ing locations and orientations) as the exposure and the abil-ity of exposed elements to withstand the hazard (e.g. build-ing strength) as vulnerability. Lahar-induced damage is con-trolled by the interactions of these factors; however, the im-portance of each component can vary. Here we focus onquantifying and examining the role of hazard, exposure andvulnerability in determining lahar-induced building damage.
Post-event field assessments of building damage can elicitinformation relating lahar hazard to structural damage. How-ever, these assessments tend to only record information onsubstantial damage, are affected by terrain changes during
Published by Copernicus Publications on behalf of the European Geosciences Union.

704 S. R. Mead et al.: Examining the impact of lahars on buildings using numerical modelling
the event which alter exposure and often rely on a priori as-sumptions of building strength and vulnerability (Ettinger etal., 2015). Pre-event assessments are affected by the lack ofreliable hazard intensity measures (van Westen et al., 2006;Ettinger et al., 2015), differences in spatial and temporalscales, uncertainty surrounding site-specific lahar triggers(Di Baldassarre and Montanari, 2009) and a lack of structuralinformation on building stock (Ettinger et al., 2015). Theseissues are reflected in the relative lack of studies on hazardimpact in urban areas (Jenkins et al., 2015) and often resultin a reliance on expert judgement to develop vulnerabilitymodels for lahars and flash floods (Ettinger et al., 2015).
The physical vulnerability of buildings, defined as the sus-ceptibly of a building to damage with respect to the hazard(Künzler et al., 2012), is a function of building characteristicssuch as size, shape, age, construction materials, structural in-tegrity, maintenance and build quality (Martelli, 2011; Kün-zler et al., 2012; Ettinger et al., 2015). Information on thesebuilding properties is often lacking and hard to collect ona large scale. This commonly leads to the simplification ofvulnerability into a measure that can provide a relative indi-cation of vulnerability and consequent damage (Künzler etal., 2012). Studies simplifying vulnerability as a relative in-dex use a combination of qualitative and quantitative metricsobtained through building surveys, interpretation of remotesensing data and GIS techniques to map and analyse vulner-ability on a large scale (e.g. Lavigne, 1999; Künzler et al.,2012; Galderisi et al., 2013; Thouret et al., 2013, 2014; Et-tinger et al., 2015). These methods can be applied to under-stand and highlight spatial patterns in vulnerability; however,as a relative measure, they cannot provide guidance on abso-lute damage for any specific event.
A direct estimation of damage caused by specific eventsrequires quantified relationships describing a building’s re-sponse to the hazard. Buildings can be damaged through anumber of mechanisms including (i) direct damage resultingfrom static and dynamic forces imposed by the flow, (ii) dam-age to foundations through erosion and scour, (iii) buoyancyeffects of the flow causing structures to float, (iv) direct dam-age from larger debris (missiles) within the flow and (v) indi-rect damage caused by chemical and biological actions suchas seeping induced weakness of mortar (Kelman and Spence,2004). All these actions, apart from chemical and biologicaleffects, are related directly to lahar depth, velocity or a com-bination of depth and velocity. Thus, a common approachin determining building damage thresholds for a particularbuilding type is to relate damage to hazard intensity mea-sures of depth and/or velocity (e.g. Zanchetta et al., 2004;Custer and Nishijima, 2015; Jenkins et al., 2015). However,building typologies are affected by socio-economic, culturaland institutional conditions (Künzler et al., 2012), and hazardintensities (flow depth and velocity) are affected by build-ing environmental factors such as local elevation, distancefrom main channels and orientation (Thouret et al., 2014).This results in complex interactions between hazard, expo-
sure and vulnerability. These issues cause direct vulnerabilityrelationships to be site-specific and require detailed investi-gation of the regions at risk to examine the relative effectsand role of hazard, exposure and vulnerability on buildingloss.
We attempt to quantify and examine the components thatdetermine building damage in a small area within the cityof Arequipa, Peru. A relative index of vulnerability on acity-block scale was developed for Arequipa in Thouret etal. (2013, 2014). The studies by Thouret et al. (2013, 2014)highlighted two groups of vulnerability indicators (buildingcharacteristics and the physical setting) that play an impor-tant role in determining vulnerability within Arequipa. In thisstudy, we separate the building characteristics (i.e. vulnera-bility) from the physical setting (i.e. exposure) to examine theeffect of hazard (flow rate and rheology), exposure (buildingorientation and location) and vulnerability (building type)components on building loss within Arequipa. Physical vul-nerability of buildings is explicitly separated from exposurethrough the development of a building damage model thatis dependent on flow velocity, depth and sediment concen-tration. Simulations of lahar flow using smoothed particlehydrodynamics are used to examine how flow characteris-tics and the physical setting of city blocks affects forces onbuildings and the consequent damage. While, for reasons ex-plained earlier, damage functions presented here are neces-sarily specific to Arequipa, the hazard modelling approachand vulnerability model development are described in detailto support risk assessment in other regions affected by lahars.
2 Case study: Quebrada Dahlia, Arequipa, Peru
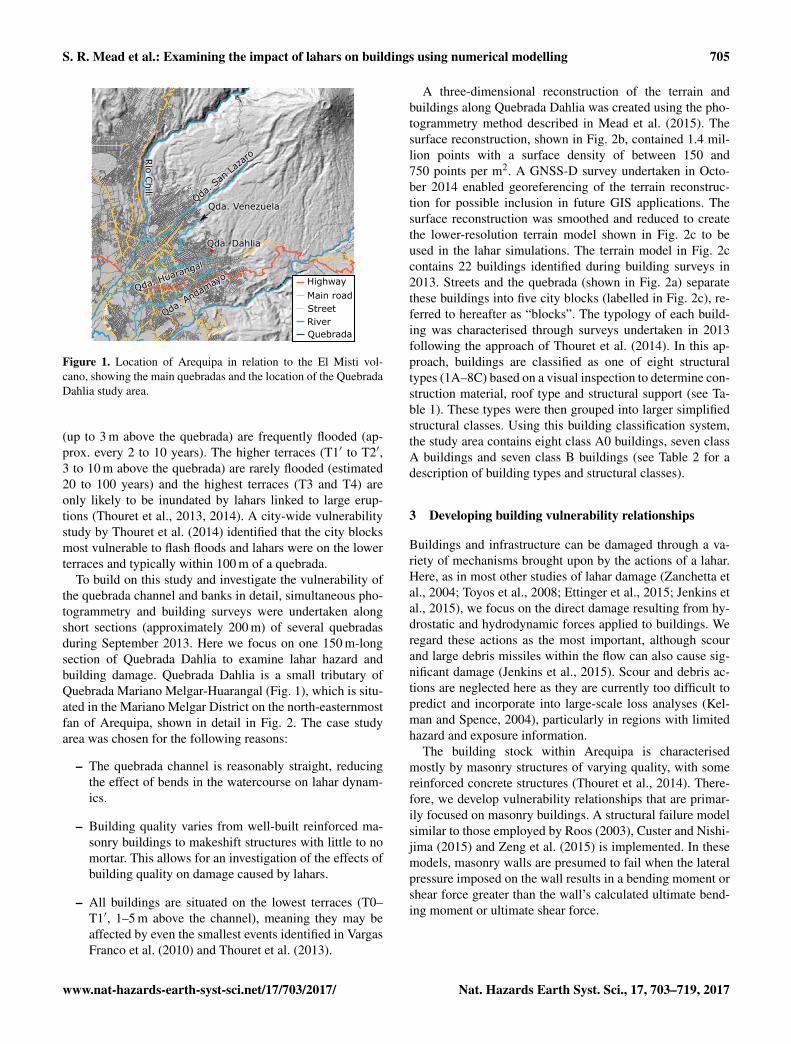
The central business district of Arequipa, the second largestcity in Peru, is situated 17 km south-west of the summit ofEl Misti (Fig. 1), a steep stratovolcano with a history of ex-plosive eruptions. Rapid population growth since 1960 hasresulted in an expansion of the city towards the ring plainand steep slopes of El Misti (Thouret et al., 2013). Are-quipa is drained by several ravines (locally called quebradasor torrenteras), shown in Fig. 1, that have been shaped bylahars and floods originating from the volcano on volcan-oclastic fans north-east of the city. These quebradas are nor-mally dry but carry water sporadically during the Decemberto March rainy season (Vargas Franco et al., 2010; Martelli,2011; Thouret et al., 2013; Sandri et al., 2014). Flash floodsand hyperconcentrated flows occur relatively frequently inthe quebradas, with return periods between 2 and 10 years(Vargas Franco et al., 2010; Thouret et al., 2013). Previousstudies of lahar hazard and vulnerability for Arequipa iden-tified seven alluvial terraces (T0, T1, T1′, T2, T2′, T3 andT4) based on stratigraphy and local elevation above the que-brada and the Rio Chili valley (Martelli, 2011; Thouret et al.,2013, 2014). The likelihood of inundation by a lahar or flashflood decreases with each terrace. Terrace levels T0 and T1
Nat. Hazards Earth Syst. Sci., 17, 703–719, 2017 www.nat-hazards-earth-syst-sci.net/17/703/2017/
S. R. Mead et al.: Examining the impact of lahars on buildings using numerical modelling 705
Qda. DahliaQda. Dahlia
Rio
Chili
Rio C
hili
Qda. S
an La
zaro
Qda. S
an La
zaro
Qda. VenezuelaQda. Venezuela
Qda. Huarangal
Qda. Huarangal
Qda. Andam
ayo
Qda. Andam
ayo Highway
Main roadStreetRiverQuebrada
Figure 1. Location of Arequipa in relation to the El Misti vol-cano, showing the main quebradas and the location of the QuebradaDahlia study area.
(up to 3 m above the quebrada) are frequently flooded (ap-prox. every 2 to 10 years). The higher terraces (T1′ to T2′,3 to 10 m above the quebrada) are rarely flooded (estimated20 to 100 years) and the highest terraces (T3 and T4) areonly likely to be inundated by lahars linked to large erup-tions (Thouret et al., 2013, 2014). A city-wide vulnerabilitystudy by Thouret et al. (2014) identified that the city blocksmost vulnerable to flash floods and lahars were on the lowerterraces and typically within 100 m of a quebrada.
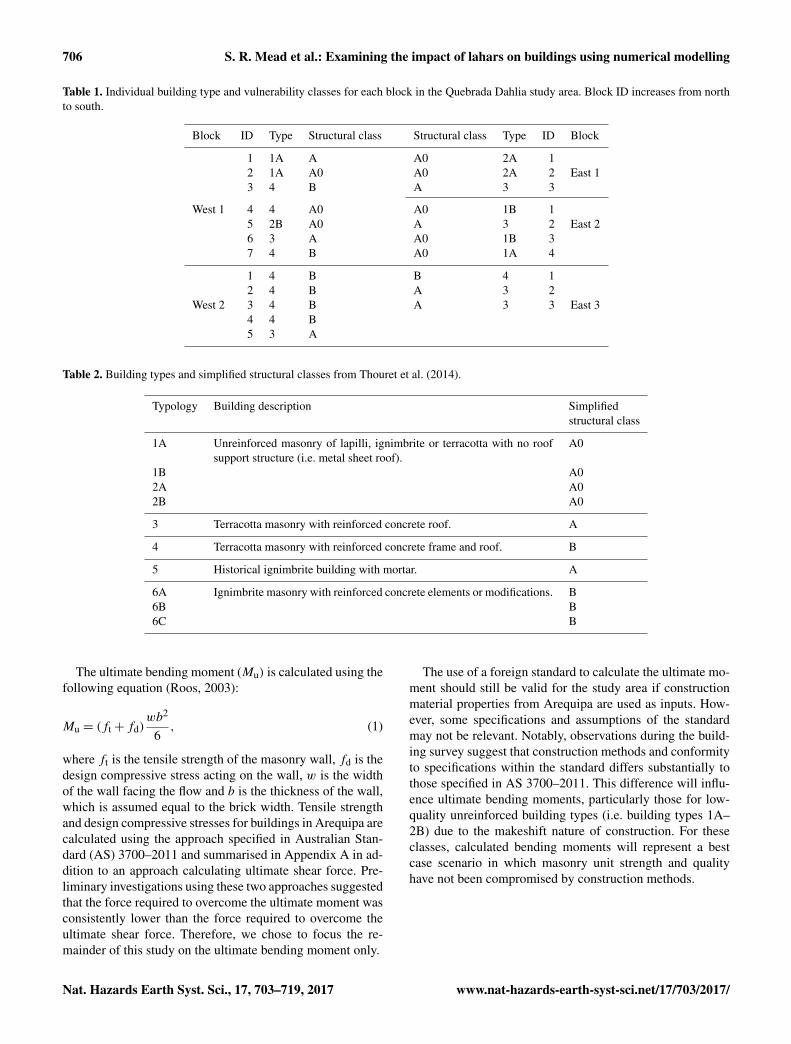
To build on this study and investigate the vulnerability ofthe quebrada channel and banks in detail, simultaneous pho-togrammetry and building surveys were undertaken alongshort sections (approximately 200 m) of several quebradasduring September 2013. Here we focus on one 150 m-longsection of Quebrada Dahlia to examine lahar hazard andbuilding damage. Quebrada Dahlia is a small tributary ofQuebrada Mariano Melgar-Huarangal (Fig. 1), which is situ-ated in the Mariano Melgar District on the north-easternmostfan of Arequipa, shown in detail in Fig. 2. The case studyarea was chosen for the following reasons:
– The quebrada channel is reasonably straight, reducingthe effect of bends in the watercourse on lahar dynam-ics.
– Building quality varies from well-built reinforced ma-sonry buildings to makeshift structures with little to nomortar. This allows for an investigation of the effects ofbuilding quality on damage caused by lahars.
– All buildings are situated on the lowest terraces (T0–T1′, 1–5 m above the channel), meaning they may beaffected by even the smallest events identified in VargasFranco et al. (2010) and Thouret et al. (2013).
A three-dimensional reconstruction of the terrain andbuildings along Quebrada Dahlia was created using the pho-togrammetry method described in Mead et al. (2015). Thesurface reconstruction, shown in Fig. 2b, contained 1.4 mil-lion points with a surface density of between 150 and750 points per m2. A GNSS-D survey undertaken in Octo-ber 2014 enabled georeferencing of the terrain reconstruc-tion for possible inclusion in future GIS applications. Thesurface reconstruction was smoothed and reduced to createthe lower-resolution terrain model shown in Fig. 2c to beused in the lahar simulations. The terrain model in Fig. 2ccontains 22 buildings identified during building surveys in2013. Streets and the quebrada (shown in Fig. 2a) separatethese buildings into five city blocks (labelled in Fig. 2c), re-ferred to hereafter as “blocks”. The typology of each build-ing was characterised through surveys undertaken in 2013following the approach of Thouret et al. (2014). In this ap-proach, buildings are classified as one of eight structuraltypes (1A–8C) based on a visual inspection to determine con-struction material, roof type and structural support (see Ta-ble 1). These types were then grouped into larger simplifiedstructural classes. Using this building classification system,the study area contains eight class A0 buildings, seven classA buildings and seven class B buildings (see Table 2 for adescription of building types and structural classes).
3 Developing building vulnerability relationships
Buildings and infrastructure can be damaged through a va-riety of mechanisms brought upon by the actions of a lahar.Here, as in most other studies of lahar damage (Zanchetta etal., 2004; Toyos et al., 2008; Ettinger et al., 2015; Jenkins etal., 2015), we focus on the direct damage resulting from hy-drostatic and hydrodynamic forces applied to buildings. Weregard these actions as the most important, although scourand large debris missiles within the flow can also cause sig-nificant damage (Jenkins et al., 2015). Scour and debris ac-tions are neglected here as they are currently too difficult topredict and incorporate into large-scale loss analyses (Kel-man and Spence, 2004), particularly in regions with limitedhazard and exposure information.
The building stock within Arequipa is characterisedmostly by masonry structures of varying quality, with somereinforced concrete structures (Thouret et al., 2014). There-fore, we develop vulnerability relationships that are primar-ily focused on masonry buildings. A structural failure modelsimilar to those employed by Roos (2003), Custer and Nishi-jima (2015) and Zeng et al. (2015) is implemented. In thesemodels, masonry walls are presumed to fail when the lateralpressure imposed on the wall results in a bending moment orshear force greater than the wall’s calculated ultimate bend-ing moment or ultimate shear force.
www.nat-hazards-earth-syst-sci.net/17/703/2017/ Nat. Hazards Earth Syst. Sci., 17, 703–719, 2017
706 S. R. Mead et al.: Examining the impact of lahars on buildings using numerical modelling
Table 1. Individual building type and vulnerability classes for each block in the Quebrada Dahlia study area. Block ID increases from northto south.
Block ID Type Structural class Structural class Type ID Block
1 1A A A0 2A 12 1A A0 A0 2A 2 East 13 4 B A 3 3
West 1 4 4 A0 A0 1B 15 2B A0 A 3 2 East 26 3 A A0 1B 37 4 B A0 1A 4
1 4 B B 4 12 4 B A 3 2
West 2 3 4 B A 3 3 East 34 4 B5 3 A
Table 2. Building types and simplified structural classes from Thouret et al. (2014).
Typology Building description Simplifiedstructural class
1A Unreinforced masonry of lapilli, ignimbrite or terracotta with no roofsupport structure (i.e. metal sheet roof).
A0
1B A02A A02B A0
3 Terracotta masonry with reinforced concrete roof. A
4 Terracotta masonry with reinforced concrete frame and roof. B
5 Historical ignimbrite building with mortar. A
6A Ignimbrite masonry with reinforced concrete elements or modifications. B6B B6C B
The ultimate bending moment (Mu) is calculated using thefollowing equation (Roos, 2003):
Mu = (ft+ fd)wb2
6, (1)
where ft is the tensile strength of the masonry wall, fd is thedesign compressive stress acting on the wall, w is the widthof the wall facing the flow and b is the thickness of the wall,which is assumed equal to the brick width. Tensile strengthand design compressive stresses for buildings in Arequipa arecalculated using the approach specified in Australian Stan-dard (AS) 3700–2011 and summarised in Appendix A in ad-dition to an approach calculating ultimate shear force. Pre-liminary investigations using these two approaches suggestedthat the force required to overcome the ultimate moment wasconsistently lower than the force required to overcome theultimate shear force. Therefore, we chose to focus the re-mainder of this study on the ultimate bending moment only.
The use of a foreign standard to calculate the ultimate mo-ment should still be valid for the study area if constructionmaterial properties from Arequipa are used as inputs. How-ever, some specifications and assumptions of the standardmay not be relevant. Notably, observations during the build-ing survey suggest that construction methods and conformityto specifications within the standard differs substantially tothose specified in AS 3700–2011. This difference will influ-ence ultimate bending moments, particularly those for low-quality unreinforced building types (i.e. building types 1A–2B) due to the makeshift nature of construction. For theseclasses, calculated bending moments will represent a bestcase scenario in which masonry unit strength and qualityhave not been compromised by construction methods.
Nat. Hazards Earth Syst. Sci., 17, 703–719, 2017 www.nat-hazards-earth-syst-sci.net/17/703/2017/
S. R. Mead et al.: Examining the impact of lahars on buildings using numerical modelling 707
East 1
East 2
East 3
West 1
West 2
(a)
(b) (c)
Figure 2. Overview of the Quebrada Dahlia study area, Are-quipa, (a) aerial image with black outline showing study area,dashed outline showing channel banks and transparent lines show-ing streets in the area, (b) photogrammetric reconstruction of thesurface and (c) individual buildings and building blocks identifiedfrom building surveys.
4 Critical depth–pressure curves
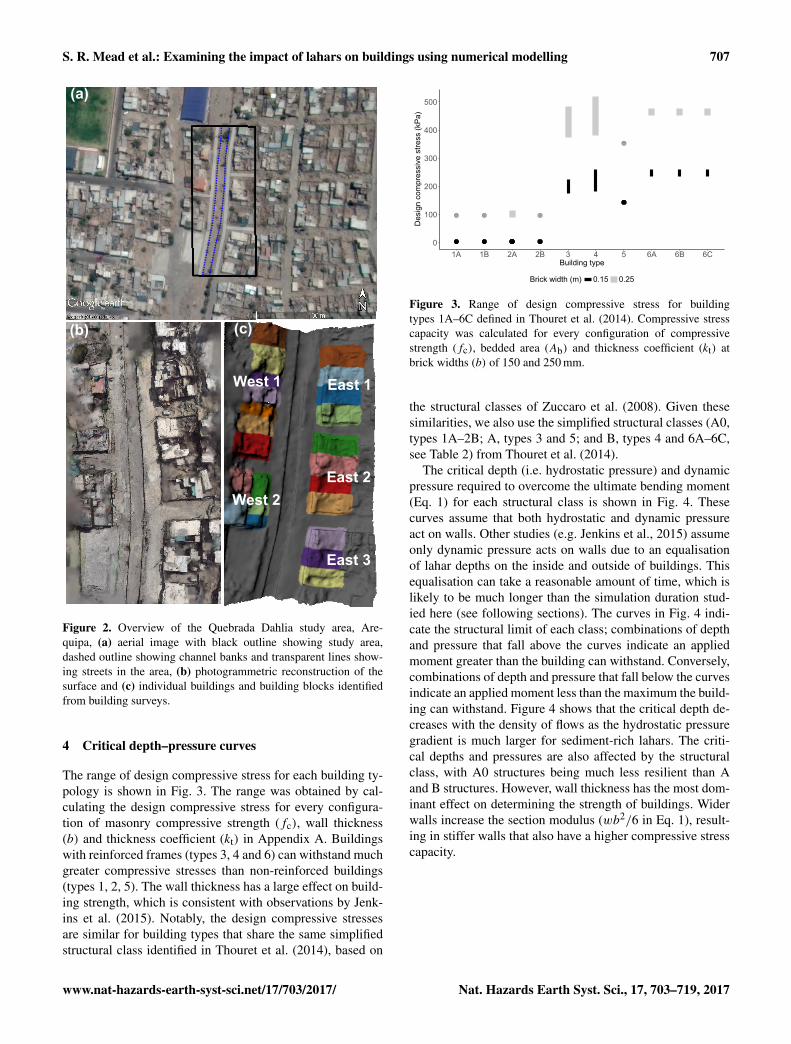
The range of design compressive stress for each building ty-pology is shown in Fig. 3. The range was obtained by cal-culating the design compressive stress for every configura-tion of masonry compressive strength (fc), wall thickness(b) and thickness coefficient (kt) in Appendix A. Buildingswith reinforced frames (types 3, 4 and 6) can withstand muchgreater compressive stresses than non-reinforced buildings(types 1, 2, 5). The wall thickness has a large effect on build-ing strength, which is consistent with observations by Jenk-ins et al. (2015). Notably, the design compressive stressesare similar for building types that share the same simplifiedstructural class identified in Thouret et al. (2014), based on
Figure 3. Range of design compressive stress for buildingtypes 1A–6C defined in Thouret et al. (2014). Compressive stresscapacity was calculated for every configuration of compressivestrength (fc), bedded area (Ab) and thickness coefficient (kt) atbrick widths (b) of 150 and 250 mm.
the structural classes of Zuccaro et al. (2008). Given thesesimilarities, we also use the simplified structural classes (A0,types 1A–2B; A, types 3 and 5; and B, types 4 and 6A–6C,see Table 2) from Thouret et al. (2014).
The critical depth (i.e. hydrostatic pressure) and dynamicpressure required to overcome the ultimate bending moment(Eq. 1) for each structural class is shown in Fig. 4. Thesecurves assume that both hydrostatic and dynamic pressureact on walls. Other studies (e.g. Jenkins et al., 2015) assumeonly dynamic pressure acts on walls due to an equalisationof lahar depths on the inside and outside of buildings. Thisequalisation can take a reasonable amount of time, which islikely to be much longer than the simulation duration stud-ied here (see following sections). The curves in Fig. 4 indi-cate the structural limit of each class; combinations of depthand pressure that fall above the curves indicate an appliedmoment greater than the building can withstand. Conversely,combinations of depth and pressure that fall below the curvesindicate an applied moment less than the maximum the build-ing can withstand. Figure 4 shows that the critical depth de-creases with the density of flows as the hydrostatic pressuregradient is much larger for sediment-rich lahars. The criti-cal depths and pressures are also affected by the structuralclass, with A0 structures being much less resilient than Aand B structures. However, wall thickness has the most dom-inant effect on determining the strength of buildings. Widerwalls increase the section modulus (wb2/6 in Eq. 1), result-ing in stiffer walls that also have a higher compressive stresscapacity.
www.nat-hazards-earth-syst-sci.net/17/703/2017/ Nat. Hazards Earth Syst. Sci., 17, 703–719, 2017

708 S. R. Mead et al.: Examining the impact of lahars on buildings using numerical modelling
Class A0: Unreinforced masonry with no roof support
Class A: Ingnimbrite/terracotta masonry with roof support
Class B: Reinforced masonry with roof support
NFHCFDF
Flow type
Figure 4. Critical depth and dynamic pressures for failure of structural classes A0, A and B for brick widths of 0.15 m (top) and 0.25 m(bottom). Shading of the lines indicate flow type and density, dotted lines and dashed lines represent the minimum and maximum forcesrequired. Densities are for a Newtonian flow (NF, ρ = 1000 kg m−3), hyperconcentrated flow (HCF, ρ = 1500 kg m−3) and debris flow (DF,ρ = 1915 kg m−3).
5 Lahar numerical modelling and results
5.1 Lahar rheology and implementation in smoothedparticle hydrodynamics
Lahar flow behaviour varies depending on the sediment con-centration and composition of the flow. At very low con-centrations of sediment, lahars will flow in a similar mannerto water. At higher concentrations, interactions between thesediment and water cause a non-linear response to stressesapplied to the flow. This non-linearity in the stress–strain re-lationship requires the use of rheology models that captureboth the linear (i.e. water-like, called Newtonian) and non-linear (called non-Newtonian) shear response. Here we im-plement a generalised quadratic rheology model to simulatelahar flows along the case study area. The quadratic rheologymodel can be expressed as follows (Julien and Lan, 1991;O’Brien et al., 1993; Jan and Shen, 1997):
τ = τy +µγ +αγ2, (2)
where τ is the shear stress, τy the yield strength,µ the viscos-ity, γ the shear rate, and α is the turbulent-dispersive param-eter, a coefficient that combines the effects of turbulence anddispersive stresses caused by sediment collisions. This model
follows the general form of the Herschel–Bulkley equationcommonly used to describe non-Newtonian lahar behaviour(Manville et al., 2013).
Commonly used lahar models such as the Pitman andLe (2005) model in Titan2D (Patra et al., 2005) or laharZ(Iverson et al., 1998) are able to delineate hazard zones orlahar inundation areas on a large scale. However, the reduceddimensions of these models (e.g. through depth-averaging inTitan2D) means they are unsuitable for the detailed mod-elling of lahar flow in urban environments required for thisstudy. Instead, we implement the quadratic rheology modelusing three-dimensional smoothed particle hydrodynamics(SPH) to simulate lahar flows along the case study area.SPH is a Lagrangian method that tracks the physical motionof interpolation points (commonly referred to as particles)through space. It is well suited to modelling free surface fluidflows, predicting and tracking the motion of dynamic objectswithin the flow (e.g. Cleary et al., 2012, 2015; Prakash et al.,2014) and modelling complex flooding scenarios involvinginteractions with buildings (e.g. Mead et al., 2015). The SPHmethod used here is described in Cleary and Prakash (2004)and Prakash et al. (2014). Non-Newtonian lahar rheologywas implemented in SPH using an apparent Newtonian vis-cosity (η). Assuming the fluid is isotropic, constitutive equa-
Nat. Hazards Earth Syst. Sci., 17, 703–719, 2017 www.nat-hazards-earth-syst-sci.net/17/703/2017/
S. R. Mead et al.: Examining the impact of lahars on buildings using numerical modelling 709
tions for rheology can be written as a generalised Newtonianfluid in terms of the apparent viscosity:
τ = ηγ . (3)
When the apparent viscosity is constant the fluid is Newto-nian with a viscosity of η. Non-Newtonian fluids can be mod-elled using Eq. (3) by developing relationships for η basedon constitutive equations (Mitsoulis, 2007). Using this ap-proach, the apparent viscosity for the quadratic rheology is
η =τy
γ+µ+αγ . (4)
To reduce computational time we use the viscosity regular-isation approach of Papanastasiou (1987), described in Mit-soulis (2007) and Minatti and Paris (2015). Regularisation isrequired as the apparent viscosity approaches infinity at lowstrain rates when using Eq. (4), reducing the simulation timestep and significantly increasing computational cost. Usingthe Papanastasiou (1987) approach, the regularised viscosityused in simulations is
η =τy
γ
(1− e−cγ
)+µ+αγ, (5)
where c is the viscosity scaling parameter. Larger values ofc result in a better approximation of the constitutive equa-tion (Eq. 4), while smaller values result in smaller appar-ent viscosities and larger simulation time steps. Here we setc = 200, a value which yielded the best balance betweensimulation speed and accuracy in validation simulations thatcompared flow down an inclined plane with analytical solu-tions.
5.2 Lahar simulations
Static and dynamic pressures acting on the buildings in theQuebrada Dahlia study area were determined for 12 differentinundation scenarios. We use the same SPH particle spac-ing (12.5 cm) of previous simulations by Mead et al. (2015).This resolution provided the best balance between compu-tational time and resolution of fine-scale features that canaffect the flows. Inundation scenarios were designed to ex-plore a wide range of flow types and velocities in order toinvestigate the effect of rheology and velocities on flow dy-namics and forces exerted on buildings. Simulations were runfor three different flow types (Newtonian, hyperconcentratedstreamflow and debris flow) at constant flow rates of 25, 50,75 and 100 m3 s−1.
The flow rates were chosen to produce scenarios rang-ing from minimal (25 m3 s−1) to extreme (100 m3 s−1) over-bank flooding. The ratio between inertial and gravitationalforces, expressed through the Froude number, was kept be-low 1 (subcritical flow) for each flow rate by varying the in-flow area. Froude number consistency was used here as in-ertial and gravitational forces are dominant controls on en-vironmental flows such as these. Flow types were selected to
represent the characteristics of the most commonly occurringflows in Arequipa – flash flood, hyperconcentrated stream-flow and fine-grained, matrix-supported debris flow (Thouretet al., 2013). Rheology of flash flood flows was consideredto be completely Newtonian with a viscosity of water (i.e.τy,α = 0, µ= 0.001 and density (ρ)= 1000). Rheologicalparameters for hyperconcentrated and debris flows (Table 3)were chosen using the dimensionless ratio between disper-sive and viscous stresses explained in Julien and Lan (1991).Values for yield strength (τy), viscosity (µ) and the turbulent-dispersive coefficient (α)were taken from the experiments ofGovier et al. (1957) and Bagnold (1954), reported in Julienand Lan (1991). For a hyperconcentrated streamflow, we pre-sumed a particle concentration by volume (Cv) of approx-imately 30 %, consisting mostly of finer particles, meaningviscous stresses are still relatively important. Debris flowscenarios were assumed to contain larger particles at a highervalue Cv of approximately 55 %. The particle concentrationacts to increase density, viscosity and the dispersive stresscoefficient in hyperconcentrated and debris flow rheologiescompared to a fully Newtonian water flow. The higher par-ticle concentration of the debris flow (compared to a hyper-concentrated flow) also results in a much higher dispersivestress coefficient, meaning that dispersive stresses will havemore importance in determining flow behaviour.
Computational cost limits the length of simulations to thefirst 45 s of lahar flow for each scenario. The flow was notestablished and constant by 45 s, so these simulations do notrepresent the forces exerted on buildings by a steady flowrate. Instead, the scenarios considered here are more repre-sentative of the higher velocity and depth surges or waves ina lahar.
5.3 Flow behaviour
Figure 5 displays snapshots of velocity and dynamic pressuremagnitudes for each flow type at a flow rate of 75 m3 s−1.Snapshots were taken at 15 s intervals and dynamic pressurewas calculated as ρv2/2, where v is the velocity magnitude.Lahars mostly followed the developed channel of QuebradaDahlia for the first 15 s before overtopping the bank andspreading outwards. Channel and overbank pressures and ve-locity profiles are similar for Newtonian and hyperconcen-trated flows, but the velocity of overbank flow is much lowerfor the debris flow rheology. This lower velocity is presum-ably caused by increased friction in the debris flow due tothe higher viscosity and dispersive coefficients. The dynamicpressure differs between each rheology as a result of the var-ied densities (and lower velocity for debris flows); however,the maximum pressure is still similar between rheologies asmaximum velocities are mostly confined to the channel.
The highest dynamic pressures in Fig. 5 are present alongthe centre of the channel, with much lower pressures nearthe buildings. The velocity magnitude may therefore not ac-curately represent the pressure forces acting perpendicular to
www.nat-hazards-earth-syst-sci.net/17/703/2017/ Nat. Hazards Earth Syst. Sci., 17, 703–719, 2017

710 S. R. Mead et al.: Examining the impact of lahars on buildings using numerical modelling
Table 3. Density, particle concentration and rheology coefficients for hyperconcentrated streamflow and debris flow simulations, taken fromGovier et al. (1957), Julien and Lan (1991).
Flow type Density Particle concentration Yield strength Viscosity Dispersive stress(kg m−3) by volume (%) (τy , Pa) (µ, Pa s) coefficient (α)
Hyperconcentrated 1500 30.3 0.94 0.0137 1.28× 10⁻⁵
streamflowFine-grained, matrix 1915 55.5 0.672 0.0485 0.00224-supported debris flow
Figure 5. Evolution of dynamic pressure and velocity magnitudesfor a 75 m3 s−1 flow along Quebrada Dahlia for a Newtonian flow(NF), hyperconcentrated flow (HCF) and debris flow (DF). Arrowsindicate northerly (green) and easterly (red) directions.
the walls of each building. The critical strength of a wall isdetermined from the forces acting normal (perpendicular) tothe structure; therefore it is important to calculate dynamicpressure from velocity normal to the wall. The section ofQuebrada Dahlia studied here runs in a north–south directionand the buildings have walls that are oriented either parallelor perpendicular to the channel, so an initial understandingof the perpendicular forces acting on walls can be interpretedfrom the north–south (N–S) and east–west (E–W) velocitycomponents. Figure 6 shows the dynamic pressure calculatedfrom directional velocity components at 40 s for a flow rate of75 m3 s−1. Figure 6 shows a consistent pattern for all rheolo-gies where the pressure is dominated by the streamwise (N–S) velocity. The pressure applied to walls facing the stream(∼E–W direction, third column of Fig. 6) is much lower thanthe pressure applied to walls perpendicular to the stream.Higher pressures for E–W velocities are observed along crossstreets splitting each city block; however, the pressure thatacts perpendicular (N–S) to these walls is minimal. Theseobservations indicate that pressure calculated from the mag-nitude of velocity, which is often assumed to be acting per-pendicular to walls (e.g. Zanchetta et al., 2004; Jenkins etal., 2015), can be much higher than actual pressure acting onwalls and the use of velocity magnitudes could therefore leadto an overestimation of building damage.
In order to accurately estimate normal forces on walls, wecalculate pressures from the velocity normal to each block.The normal velocity of fluid near each block face (e.g. northand west faces of the East 3 block) is calculated using thedot product of simulated velocity vectors and the directionvector of the block face. This normal velocity (vn) is aver-aged across the face and used to calculate a “normal” pres-sure using ρv2
n/2. Figure 7 compares the dynamic pressurescalculated from velocity magnitude and normal velocity forthe West 2 block (see Fig. 2c) for Newtonian, hyperconcen-trated and debris flow types. The pressures are measured forwalls oriented approximately parallel to the quebrada (la-belled “parallel”) and north-facing walls that are orientedapproximately perpendicular to the quebrada (labelled “per-pendicular”). The pressures exerted on parallel walls by thenormal velocity are up to five times lower than velocity mag-nitude pressures. The pressure applied to perpendicular wallsalso differs between normal velocity and magnitude, with the
Nat. Hazards Earth Syst. Sci., 17, 703–719, 2017 www.nat-hazards-earth-syst-sci.net/17/703/2017/

S. R. Mead et al.: Examining the impact of lahars on buildings using numerical modelling 711
Figure 6. Directional components of dynamic pressure for a75 m3 s−1 flow along Quebrada Dahlia for a Newtonian flow (NF),hyperconcentrated flow (HCF) and debris flow (DF). Maximumpressure is 25 kPa for magnitude and N–S pressures, 1 kPa for E–Wpressure.
timing of peak pressure also affected. This further demon-strates the importance of considering normal velocity ratherthan velocity magnitude when estimating dynamic pressures(and consequently damage).
Pressures acting on each block in the study area, calculatedusing the technique explained in the previous paragraph, areshown in Fig. 8 for a flow rate of 75 m3 s−1. Blocks East1 and West 1 do not have walls facing perpendicular to theflow and therefore have no pressures recorded in that orien-tation. The pressure for each block generally follows a sim-ilar pattern through time with a well-defined peak pressureand a lower, steady background pressure. The rise of pres-sure to its peak value and reduction to its background valueoccurs over the space of approximately 20 s for each block.This time frame is too short to allow for an equalisation ofhydrostatic pressure between the inside and outside of build-ings, confirming that both hydrostatic and dynamic pressuresare acting on walls during lahar surges. The timing of thepeak is delayed for downstream blocks and the magnitudeof the peak for each block varies. The differences in peakpressure are caused by exposure effects such as orientationand elevation of each block relative to the quebrada. Walls
p
Figure 7. Comparison of mean pressure magnitude (grey lines) andmean normal pressure (black lines) on block West 2 in the paralleland perpendicular orientations for a 75 m3 s−1 flow along QuebradaDahlia.
-1
p
Figure 8. Mean normal pressures applied to each city block in theperpendicular and parallel orientations for a 75 m3 s−1 flow.
facing perpendicular to the stream are generally exposed tohigher dynamic pressures than parallel walls, but this effectappears to vary and could be dependent on cross-street eleva-tions (cross streets leading away from Qda. Dahlia increasein elevation at different rates).
In terms of rheology, hyperconcentrated flows mostly dis-played the highest dynamic pressures acting on parallelwalls. The higher density (compared to Newtonian flows) isresponsible for the larger dynamic pressures (see Jenkins etal., 2015). This effect is moderated by the yield strength ofthe hyperconcentrated flows which cause the velocity to be
www.nat-hazards-earth-syst-sci.net/17/703/2017/ Nat. Hazards Earth Syst. Sci., 17, 703–719, 2017

712 S. R. Mead et al.: Examining the impact of lahars on buildings using numerical modelling
A0AB
Class
Figure 9. Critical depth–pressure curves for building classes A0, A and B subjected to Newtonian flow. Peak normal pressures and corre-sponding depths applied to each city block are plotted as points for each flow rate.
A0AB
Class
Figure 10. Critical depth–pressure curves for building classes A0, A and B subjected to a hyperconcentrated flow. Peak normal pressuresand corresponding depths applied to each city block are plotted as points for each flow rate.
Nat. Hazards Earth Syst. Sci., 17, 703–719, 2017 www.nat-hazards-earth-syst-sci.net/17/703/2017/

S. R. Mead et al.: Examining the impact of lahars on buildings using numerical modelling 713
A0AB
Class
Figure 11. Critical depth–pressure curves for building classes A0, A and B subjected to a debris flow. Peak normal pressures and correspond-ing depths applied to each city block are plotted as points for each flow rate.
lower than Newtonian flows near perpendicular walls. Debrisflow pressures are much lower than both Newtonian and hy-perconcentrated flows as the yield strength and dilatant rhe-ology components limit overbank flow velocities.
6 Application of critical depth–pressure curves
Depth at the maximum value of pressure acting on blockwalls for each scenario is used to determine whether individ-ual buildings in the study area can withstand the bending mo-ment applied by hydrostatic and dynamic pressure. Figures 9to 11 plot the peak pressure and “surge depth” (depth atthe time of peak pressure) for Newtonian, hyperconcentratedand debris flows alongside critical depth–pressure curves forvulnerability classes A0, A and B with a wall thickness of150 mm (results for 250 mm wall thicknesses are provided inthe Supplement). The hazard variables of flow rate and la-har rheology appear to influence building damage, althoughthe size of the effect is difficult to determine since most sce-narios place depth and pressure combinations well above thecritical curves for each block. The flow depth, which affectshydrostatic pressure and bending moment location, generallyincreases with the flow rate while the dynamic pressure ap-pears to be mostly controlled by the rheology in combinationwith flow rate. The forces applied to the West 2 block, con-
taining one class A and 4 class B buildings, are lower thanthe other blocks. This is possibly due to the relative elevationand orientation of each block to the quebrada (i.e. exposure)affecting dynamic pressure and lahar depth. Debris flow sce-narios at flow rates of 25, 50 and 75 m3 s−1 indicate depthsand pressures below the critical limit for this block’s buildingclasses.
The orientation of walls to the flow direction is another el-ement of exposure that affects the normal pressure exerted onwalls. In several scenarios, perpendicular walls are subjectedto higher dynamic pressures and lower depths than parallelwalls. However, this effect appears to be conditional to therheology of the flow as the opposite is true for debris flowscenarios. These two effects demonstrate the importance ofconsidering exposure elements separately to vulnerability.
The proportion of buildings with depths and pressuresabove the critical curve for each scenario is shown in Fig. 12for 150 mm brick widths and Fig. 13 for 250 mm wall thick-nesses. Assuming a binary damage state model where dam-age is complete for depths–pressure combinations above thecurve, these proportions can be used to directly representbuilding loss. For the thinner walls, all class A0 buildings areabove the curve for all scenarios apart from the 25 m3 s−1 de-bris flow. The East 1 block is not inundated in this scenario,resulting in two undamaged class A0 buildings. Class A andB buildings are also mostly destroyed, with the exception of
www.nat-hazards-earth-syst-sci.net/17/703/2017/ Nat. Hazards Earth Syst. Sci., 17, 703–719, 2017

714 S. R. Mead et al.: Examining the impact of lahars on buildings using numerical modelling
0 %
25 %
50 %
75 %
100 %
100 75 50 25
Loss
frac
tion
100 75 50 25
Flow rate m3s−1
Newtonian Hyper concentrated Debris flow
100 75 50 25
ClassA0AB
Figure 12. Building loss fraction for all flow scenarios where build-ings are assumed to have a brick width of 0.15 m.
lower flow rate hyperconcentrated and debris flow scenarioswhere some blocks are on the edge of inundation and there-fore subjected to much lower depth–pressure combinations.Slightly fewer building losses occur with larger brick widths(Fig. 13) as the larger section modulus results in a greaterresistance to bending moments. However, most buildings arestill destroyed in Newtonian and hyperconcentrated flow sce-narios. An exception to this is the 75 m3 s−1 Newtonian flowwhere the highest pressure on the East 1 block occurs earlyin the simulation when the surge depth is low, reducing themagnitude of hydrostatic pressure and lowering the size ofthe applied moment.
The building loss results indicate that class A0 build-ings are most vulnerable, with class A buildings marginallystronger due to the roof support. Losses for type B buildingsin this area are much lower; however, this appears to be moreclosely related to building exposure than structural strengthas most type B buildings are in two blocks subjected to lowerdepth–pressure combinations for all scenarios. Overall, sim-ilarly to the observations in Jenkins et al. (2015), the datapresented here suggest that building strength (i.e. the vulner-ability component) has a minimal effect on losses, and build-ing location (i.e. exposure) relative to flow rate and type (i.e.hazard) plays a much greater role.
7 Limitations and discussion
The losses shown in Figs. 12 and 13 are estimates based onseveral assumptions that, while necessary for the estimationof building loss, could limit the accuracy of results. Firstly,the depth–pressure curves are created using ultimate bendingmoments derived from a foreign standard and do not considerproportional losses, only assuming damage is complete fordepths and pressures above the critical curve. Secondly, theflow scenarios modelled here are a subset of likely scenar-ios and do not replicate all damage-causing actions of laharflow. Finally, the maximum total pressure was assumed to bethe sum of hydrostatic and dynamic pressure and to occurwhen dynamic pressure was at its peak. These limitations arediscussed and justified in this section to highlight areas ofimprovement necessary for robust, quantitative estimation oflahar damage and vulnerability.
Newtonian Hyper concentrated Debris flow
0 %
25 %
50 %
75 %
100 %
100 75 50 25
Loss
frac
tion
100 75 50 25
Flow rate m3s−1100 75 50 25
ClassA0AB
Figure 13. Building loss fraction for all flow scenarios where build-ings are assumed to have a brick width of 0.25 m.
7.1 Depth–pressure curves
The critical depth–pressure curve is the contour where theratio of applied (pressure) moment equals the ultimate (fail-ure) moment of a given masonry wall. The calculation ofultimate bending moments followed an Australian standard(AS 3700–2011). Although bending moment calculationsare similar for all national standards and material proper-ties from Arequipa were used as inputs, the standard in-herently assumes conformance to construction and designstandards. This is demonstrated through the assumption ofa minimum mortar strength of 0.2 MPa. Page (1996) sug-gests this strength can be achieved with correct mortar com-position and laying; however, lower strengths are possible ifthere is low conformance to design standards. The makeshiftstructures that characterise class A0 buildings are likely tohave mortar bond strengths that are much lower than the im-plied minimum of 0.2 MPa. This mischaracterisation of mor-tar strengths for makeshift structures will result in an over-estimation of building strength and critical depth–pressurecurves. Additionally, the depth–pressure curves assume abinary damage state, where failure is total when the ap-plied (pressure) moment equals the ultimate (failure) mo-ment. This neglects incremental damage states that requirebuilding repair (e.g. to doors or windows) and can cause areduction in the overall building strength.
Both of these assumptions will result in an underestima-tion of loss if violated. Most of the flow scenarios causeddepths and pressures that exceeded critical curves by a largemargin and resulted in an almost total loss; conversely, flowscenarios that did not result in total or near-total losses usu-ally had depths and pressure values that were well below thecritical curves. This suggests that these assumptions are notcritical to the results shown here, but may be important toconsider in other case study areas.
7.2 Flow scenarios
The 12 flow scenarios were chosen to understand the effectof hazard properties (flow rate and rheology) on total loss.These scenarios may not represent any specific lahar eventfor Qda. Dahlia. Rather, scenarios were chosen to be repre-sentative of the range of lahar rheologies and flow rates that
Nat. Hazards Earth Syst. Sci., 17, 703–719, 2017 www.nat-hazards-earth-syst-sci.net/17/703/2017/
S. R. Mead et al.: Examining the impact of lahars on buildings using numerical modelling 715
can cause building damage in Arequipa. The chosen flowshave similar characteristics to observed lahars and lahar de-posits (Thouret et al., 2013) and are therefore reasonably rep-resentative of the lahar hazards expected in Arequipa.
However, damage caused by these hazards may not be rep-resentative as only the direct actions of hydrostatic and dy-namic pressure were considered in this study. While directactions are regarded as the most important source of damage,they are also favoured in risk assessment due to the large-scale predictability of hydrostatic and dynamic forces (Kel-man and Spence, 2004). Damage is likely to also be causedby scour and large debris missiles within the flow (Jenkinset al., 2015). In particular, boulders are often carried by la-hars at the flow front (Iverson, 1997; Doyle et al., 2011) andcan lead to significant damage (e.g. Zeng et al., 2015). How-ever, these actions are harder to predict and incorporate intolarge-scale loss analyses (Kelman and Spence, 2004). Theseunstudied actions are generally proportional to depth, pres-sure or velocity, indicating that there may be a relationshipbetween the ratio of applied to ultimate moment and damagethrough other actions. Given that only direct actions are con-sidered in this study, the curves likely form an upper boundto complete damage, and depth–pressure combinations be-low the curve may still result in complete building damagethrough other mechanisms.
7.3 Pressure actions
Both hydrostatic and dynamic pressures were consideredin bending moment calculations. Slower increases in depth,buildings with many openings and the location of buildingsrelative to the channel can also affect the equalisation of lahardepths and reduce the effect of hydrostatic pressure. How-ever, lahar depth would still be an important factor to con-sider in building damage estimation as it controls locationof the bending moment and can cause damage through otheractions (e.g. inundation damage, buoyancy, corrosion).
The applied depth at the time of maximum pressure wasused here to create the depth–pressure combinations to de-termine building loss. This surge depth was not necessarilythe maximum depth of the lahar during the simulation. Max-imum depths generally occurred at later times in the simu-lations when hydrostatic pressure may have equalised insideand outside buildings. This assumption of surge depth wasvalid for most cases, although the losses for the 75 m3 s−1
Newtonian flows indicate that this approach can be too sim-plistic at times. The complexity of lahar flows within urbanenvironments with intricate geometry and obstacles similarto the case study area means that broad generalisations andassumptions about flow dynamics, such as the assumption ofa surge depth, are often limited in their validity.
7.4 Discussion
The combination of pressures applied to each block in thestudy area created bending moments that, with few excep-tions, were much higher than the maximum moment build-ings could withstand. The limitations identified in previ-ous sections generally overestimate building strength andresilience to lahars which would result in greater damagethan predicted here. The estimated building losses (Figs. 12and 13) therefore represent the minimum expected losses foreach flow scenario with damage likely to be more severe dueto additional damage actions (e.g. boulders impacting struc-tures) and the overestimation of building quality, particularlyfor class A0 buildings.
When inundated, blocks in this study area are subjectedto depths and pressures higher than the strongest structuralclass buildings can withstand. Specific improvements to re-duce vulnerability, such as adding roof support and utilisingreinforced frames comprised of equally spaced RC columnswill increase the overall strength of buildings by reducing theslenderness ratio (Eq. A6). Wider masonry units (wall thick-ness) and stronger mortar joints will also increase the over-all building strength by increasing wall stiffness and there-fore resistance to bending moments. However, this increasedstructural strength appears to only reduce losses in very lowflow rate scenarios where there is proportionally less inun-dation. This suggests that, while each component of risk hasa role in determining overall building losses, the variabilityin individual losses appears to be predominantly caused byflow dynamics (i.e. lahar hazard) and building exposure (e.g.proportion of building types and orientation within blocks).
8 Conclusion
Development of fragility functions in the form of criticaldepth–pressure curves for building classes within Arequipahas helped to provide insight into possible building lossesand their cause. Building vulnerability is largely controlledby social, cultural and institutional factors (Künzler et al.,2012), so the depth–pressure curves are necessarily specificto Arequipa building typologies. However, given sufficientdata on building strength, depth–pressure curves can be gen-erated through the same approach as in Appendix A and usedto quantify masonry building loss in terms of flow depth andpressure in other regions.
Estimated building losses (Figs. 12 and 13) are caused bythe intersection of lahar hazard (flow rate, flow type) withbuilding exposure (location, proportion of building types andorientation within blocks) and vulnerability (building typeand strength). The almost total simulated building loss forall scenarios indicates that substantial losses can be expectedin the event of inundation. Furthermore, lahar depths andpressures obtained from simulations were much greater thanmost of the buildings in the study area could withstand, even
www.nat-hazards-earth-syst-sci.net/17/703/2017/ Nat. Hazards Earth Syst. Sci., 17, 703–719, 2017

716 S. R. Mead et al.: Examining the impact of lahars on buildings using numerical modelling
if retrofitting to improve structural strength was undertaken.This suggests that, in this study area at least, exposure andlahar hazard have a larger role in determining building lossthan vulnerability.
Data availability. Source code and data used in this publication areavailable from the Zenodo repository doi:10.5281/zenodo.155144(Mead, 2016).
Nat. Hazards Earth Syst. Sci., 17, 703–719, 2017 www.nat-hazards-earth-syst-sci.net/17/703/2017/
S. R. Mead et al.: Examining the impact of lahars on buildings using numerical modelling 717
Appendix A: Calculating ultimate bending moment andshear force
The ultimate bending moment (Mu) and ultimate shear force(Vu) are calculated using the following equations (Roos,2003):
Mu = (ft+ fd)wb2
6(A1)
Vu = fvwb, (A2)
where ft is the tensile strength of the masonry wall, fd is thedesign compressive stress acting on the wall, w is the widthof the wall facing the flow and b is the thickness of the wall.The shear strength of the masonry wall (fv) is related to thetensile and compressive stress through (Roos, 2003)
fv = 0.5ft+ 0.5fd. (A3)
The tensile strength is assumed to be 0.2 MPa as, accordingto AS 3700–2011, the tensile strength should be no greaterthan this value without testing. The wall thickness, b, is be-tween 150 and 250 mm for terracotta bricks (Martelli, 2011)and is assumed to be similar for ignimbrite bricks observedin the study area. The design compressive stress, fd, canbe determined by calculating the vertical forces (i.e. build-ing weight) acting on the walls. This can be estimated frombuilding properties such as number and weight of floors,weight of the masonry and building design (e.g. Roos, 2003).However, such detailed building data are lacking here andcarries considerable uncertainty for a heterogeneous urbanarea with varied construction materials, building ages and de-signs such as Arequipa. Instead we use the design compres-sive capacity (fo), specified in AS 3700–2011, to determinethe design compressive stress:
fo = φfcAb (A4)fd = kfo, (A5)
where fc is the characteristic compressive strength of themasonry, φ is the capacity reduction factor, Ab is the bed-ded area of the masonry (brick width× length) and k is areduction factor based on the wall design. The characteris-tic compressive strength is determined using the unconfinedcompressive strength tests of Martelli (2011) on building ma-terials sourced from Arequipa. Presuming the mortar is ofrelatively low quality (M2), the characteristic compressivestrengths (according to AS 3700–2011) are 3.8 MPa for ig-nimbrite masonry and between 3.5 and 4.54 MPa for terra-cotta masonry. The slenderness reduction factor, k, describesthe susceptibility to buckling. Following AS 3700–2011, thisfactor is calculated as
k = 0.67− 0.02(Srs− 14) (A6)
for buildings with a reinforced concrete roof or floor (i.e. ty-pologies 3–6C), and
k = 0.67− 0.025(Srs− 10) (A7)
for buildings with other roof or floor supports (typologies 1–2). This factor requires a calculation of the slenderness ratio,Srs:
Srs =avH
ktb, (A8)
where H is the height between floors or supports, takenas 2.8 m for reinforced concrete type buildings and 3 m fornon-reinforced buildings (Martelli, 2011). The vertical slen-derness coefficient, av, is determined from the lateral sup-port along the top edge of the wall. Walls with roof support(types 3–6) have a coefficient of 1, while unsupported walls(types 1A–2B) act as a cantilever and have a coefficient of2.5. Considering the thinnest bricks, the slenderness coeffi-cient is negative for building types 1A–2B as the design isout of the range of those considered in AS 3700–2011. Ac-knowledging the low strength of these frequently makeshiftstructures, the slenderness coefficient is therefore set to 0.01.The thickness coefficient, kt, takes into account the strengthof supporting columns. This coefficient is set to 1 for non-reinforced frame buildings and is dependent on the spacingand thickness of reinforced beams within the masonry for re-inforced buildings. Estimates of the spacing and thicknesssuggest that the coefficient will be between 1.4 and 2 fortype 6A–6C buildings and between 1 and 1.2 for type 4 build-ings. The large spacing between reinforced columns and theirrelative width, pictured in Thouret et al. (2014), is responsi-ble for the much lower coefficients assigned to type 4 build-ings.
www.nat-hazards-earth-syst-sci.net/17/703/2017/ Nat. Hazards Earth Syst. Sci., 17, 703–719, 2017

718 S. R. Mead et al.: Examining the impact of lahars on buildings using numerical modelling
The Supplement related to this article is available onlineat doi:10.5194/nhess-17-703-2017-supplement.
Competing interests. The authors declare that they have no conflictof interest.
Acknowledgements. The authors would like to thank the CivilDefence office in Arequipa (Instituto Nacional de Defensa CivilINDECI), in particular the Regional office (A. Arguedas) andthe Provincial/City office (J. Vasquez) for support during fieldwork as well as the students of the department of geology of theUniversity Nacional San Aguistin in Arequipa. J.-C. Thouret’swork in Arequipa has been supported by the Labex CLERVOLC(contribution number 235), the PICS CNRS programme and theFrench Embassy in Lima.
Edited by: G. MacedonioReviewed by: two anonymous referees
References
Auker, M., Sparks, R., Siebert, L., Crosweller, H., and Ewert, J.:A statistical analysis of the global historical volcanic fatalitiesrecord, J. Appl. Volcanol., 2, 1–24, doi:10.1186/2191-5040-2-2,2013.
Bagnold, R. A.: Experiments on a gravity-free dispersion of largesolid spheres in a Newtonian fluid under shear, P. Roy. Soc. Lond.A Mat., 225, 49–63, doi:10.1098/rspa.1954.0186, 1954.
Cleary, P. W. and Prakash, M.: Discrete–element modelling andsmoothed particle hydrodynamics: potential in the environ-mental sciences, Philos. T. Roy. Soc. S A, 362, 2003–2030,doi:10.1098/rsta.2004.1428, 2004.
Cleary, P. W., Prakash, M., Mead, S., Tang, X., Wang, H., andOuyang, S.: Dynamic simulation of dam-break scenarios for riskanalysis and disaster management, International Journal of Im-age and Data Fusion, 3, 333–363, 2012.
Cleary, P., Prakash, M., Mead, S., Lemiale, V., Robinson, G., Ye,F., Ouyang, S., and Tang, X.: A scenario-based risk frameworkfor determining consequences of different failure modes of earthdams, Nat. Hazards, 75, 1489–1530, doi:10.1007/s11069-014-1379-x, 2015.
Custer, R. and Nishijima, K.: Flood vulnerability assessment of res-idential buildings by explicit damage process modelling, Nat.Hazards, 78, 461–496, doi:10.1007/s11069-015-1725-7, 2015.
de Bélizal, E., Lavigne, F., Hadmoko, D. S., Degeai, J.-P., Dipayana,G. A., Mutaqin, B. W., Marfai, M. A., Coquet, M., Mauff, B.L., Robin, A.-K., Vidal, C., Cholik, N., and Aisyah, N.: Rain-triggered lahars following the 2010 eruption of Merapi volcano,Indonesia: A major risk, J. Volcanol. Geoth. Res., 261, 330–347,doi:10.1016/j.jvolgeores.2013.01.010, 2013.
Di Baldassarre, G. and Montanari, A.: Uncertainty in river dischargeobservations: a quantitative analysis, Hydrol. Earth Syst. Sci., 13,913–921, doi:10.5194/hess-13-913-2009, 2009.
Doyle, E. E., Cronin, S. J., and Thouret, J. C.: Defining conditionsfor bulking and debulking in lahars, Geol. Soc. Am. Bull., 123,1234–1246, doi:10.1130/B30227.1, 2011.
Ettinger, S., Mounaud, L., Magill, C., Yao-Lafourcade, A.-F.,Thouret, J.-C., Manville, V., Negulescu, C., Zuccaro, G., De Gre-gorio, D., Nardone, S., Uchuchoque, J. A. L., Arguedas, A.,Macedo, L., and Manrique Llerena, N.: Building vulnerability tohydro-geomorphic hazards: Estimating damage probability fromqualitative vulnerability assessment using logistic regression,J. Hydrol., 541, 563–581, doi:10.1016/j.jhydrol.2015.04.017,2015.
Galderisi, A., Bonadonna, C., Delmonaco, G., Ferrara, F., Menoni,S., Ceudech, A., Biass, S., Frischknecht, C., Manzella, I., Min-ucci, G., and Gregg, C.: Vulnerability Assessment and Risk Mit-igation: The Case of Vulcano Island, Italy, in: Landslide Scienceand Practice, edited by: Margottini, C., Canuti, P., and Sassa, K.,Springer Berlin Heidelberg, 55–64, 2013.
Govier, G., Shook, C., and Lilge, E.: The rheological properties ofwater suspensions of finely subdivided magnetite, galena and fer-rosilicon, Trans. Can. IMM, 60, 147–154, 1957.
Iverson, R. M.: The physics of debris flows, Rev. Geophys., 35,245–296, doi:10.1029/97RG00426, 1997.
Iverson, R. M., Schilling, S. P., and Vallance, J. W.: Ob-jective delineation of lahar-inundation hazard zones,Geol. Soc. Am. Bull., 110, 972–984, doi:10.1130/0016-7606(1998)110<0972:odolih>2.3.co;2, 1998.
Jan, C.-D. and Shen, H.: Review dynamic modeling of debris flows,in: Recent Developments on Debris Flows, edited by: Armanini,A. and Michiue, M., Lecture Notes in Earth Sciences, SpringerBerlin Heidelberg, 93–116, 1997.
Jenkins, S., Phillips, J., Price, R., Feloy, K., Baxter, P., Hadmoko,D., and de Bélizal, E.: Developing building-damage scales forlahars: application to Merapi volcano, Indonesia, B. Volcanol.,77, 1–17, doi:10.1007/s00445-015-0961-8, 2015.
Julien, P. and Lan, Y.: Rheology of Hyperconcentrations, J. Hy-draul. Eng.-ASCE, 117, 346–353, doi:10.1061/(ASCE)0733-9429(1991)117:3(346), 1991.
Kelman, I. and Spence, R.: An overview of floodactions on buildings, Eng. Geol., 73, 297–309,doi:10.1016/j.enggeo.2004.01.010, 2004.
Künzler, M., Huggel, C., and Ramírez, J. M.: A risk analysis forfloods and lahars: case study in the Cordillera Central of Colom-bia, Nat. Hazards, 64, 767–796, doi:10.1007/s11069-012-0271-9, 2012.
Lavigne, F.: Lahar hazard micro-zonation and risk assess-ment in Yogyakarta city, Indonesia, GeoJournal, 49, 173–183,doi:10.1023/A:1007035612681, 1999.
Manville, V., Major, J. J., and Fagents, S. A.: Modeling laharbehaviour and hazards, in: Modeling volcanic processes: thephysics and mathematics of volcanism, edited by: Fagents, S.A., Gregg, T. K. P., and Lopes, R. M. C., Cambridge UniversityPress, Cambridge, 300–330, 2013.
Martelli, K.: The physical vulnerability of urban areas facing thethreat of inundation from lahars and flash floods: applicationto the case study of Arequipa, Peru, Université Blaise Pascal-Clermont-Ferrand II, 2011.
Mead, S.: Lahar hazard and vulnerability: Source code and data,doi:10.5281/zenodo.155144, 2016.
Mead, S., Prakash, M., Magill, C., Bolger, M., and Thouret, J.-C.:A Distributed Computing Workflow for Modelling Environmen-tal Flows in Complex Terrain, in: Environmental Software Sys-tems. Infrastructures, Services and Applications, edited by: Den-
Nat. Hazards Earth Syst. Sci., 17, 703–719, 2017 www.nat-hazards-earth-syst-sci.net/17/703/2017/

S. R. Mead et al.: Examining the impact of lahars on buildings using numerical modelling 719
zer, R., Argent, R., Schimak, G., and Hrebícek, J., IFIP Advancesin Information and Communication Technology, Springer Inter-national Publishing, 321–332, 2015.
Minatti, L. and Paris, E.: A SPH model for the simulation of freesurface granular flows in a dense regime, Appl. Math. Model.,39, 363–382, doi:10.1016/j.apm.2014.05.034, 2015.
Mitsoulis, E.: Flows of viscoplastic materials: models and compu-tations, Rheology Reviews, 2007, 135–178, 2007.
O’Brien, J., Julien, P., and Fullerton, W.: Two-Water Flood andMudflow Simulation, J. Hydraul. Eng.-ASCE, 119, 244–261,doi:10.1061/(ASCE)0733-9429(1993)119:2(244), 1993.
Page, A. W.: Unreinforced masonry structures – an Australianoverview, Bulletin of the New Zealand national society for earth-quake engineering, 29, 242–255, 1996.
Papanastasiou, T. C.: Flows of Materials with Yield, J. Rheol., 31,385–404, doi:10.1122/1.549926, 1987.
Patra, A. K., Bauer, A. C., Nichita, C. C., Pitman, E. B., Sheri-dan, M. F., Bursik, M., Rupp, B., Webber, A., Stinton, A. J.,Namikawa, L. M., and Renschler, C. S.: Parallel adaptive numer-ical simulation of dry avalanches over natural terrain, J. Volcanol.Geoth. Res., 139, 1–21, doi:10.1016/j.jvolgeores.2004.06.014,2005.
Pierson, T. C., Major, J. J., Amigo, Á., and Moreno, H.: Acute sed-imentation response to rainfall following the explosive phase ofthe 2008–2009 eruption of Chaitén volcano, Chile, B. Volcanol.,75, 1–17, doi:10.1007/s00445-013-0723-4, 2013.
Pitman, E. B. and Le, L.: A two-fluid model for avalanche and de-bris flows, Philos. T. R. Soc. A, 363, 1573–1601, 2005.
Prakash, M., Rothauge, K., and Cleary, P. W.: Modelling the impactof dam failure scenarios on flood inundation using SPH, Appl.Math. Model., 38, 5515–5534, doi:10.1016/j.apm.2014.03.011,2014.
Roos, W.: Damage to buildings, Delft Cluster, report DC1-233-9,45 pp., 2003.
Sandri, L., Thouret, J.-C., Constantinescu, R., Biass, S., and Tonini,R.: Long-term multi-hazard assessment for El Misti volcano(Peru), B. Volcanol., 76, 1–26, doi:10.1007/s00445-013-0771-9,2014.
Thouret, J.-C., Enjolras, G., Martelli, K., Santoni, O., Luque, J. A.,Nagata, M., Arguedas, A., and Macedo, L.: Combining criteriafor delineating lahar- and flash-flood-prone hazard and risk zonesfor the city of Arequipa, Peru, Nat. Hazards Earth Syst. Sci., 13,339–360, doi:10.5194/nhess-13-339-2013, 2013.
Thouret, J.-C., Ettinger, S., Guitton, M., Santoni, O., Magill, C.,Martelli, K., Zuccaro, G., Revilla, V., Charca, J., and Arguedas,A.: Assessing physical vulnerability in large cities exposed toflash floods and debris flows: the case of Arequipa (Peru), Nat.Hazards, 73, 1771–1815, doi:10.1007/s11069-014-1172-x, 2014.
Toyos, G., Gunasekera, R., Zanchetta, G., Oppenheimer, C.,Sulpizio, R., Favalli, M., and Pareschi, M. T.: GIS-assisted mod-elling for debris flow hazard assessment based on the eventsof May 1998 in the area of Sarno, Southern Italy: II. Velocityand dynamic pressure, Earth Surf. Proc. Land., 33, 1693–1708,doi:10.1002/esp.1640, 2008.
Vallance, J. W. and Iverson, R. M.: Lahars and Their Deposits,in: The Encyclopedia of Volcanoes, Second Edition, Sigurdsson,Haraldur, Academic Press, Amsterdam, 649–664, 2015.
van Westen, C. J., van Asch, T. W. J., and Soeters, R.: Landslidehazard and risk zonation – why is it still so difficult?, Bull. Eng.Geol. Environ., 65, 167–184, doi:10.1007/s10064-005-0023-0,2006.
Vargas Franco, R., Thouret, J., Delaite, G., Van Westen, C., Sheri-dan, M., Siebe, C., Mariño, J., Souriot, T., and Stinton, A.: Map-ping and assessing volcanic and flood hazards and risks, withemphasis on lahars, in Arequipa, Peru, Geol. Soc. Spec. Pub.,464, 265–280, doi:10.1130/2010.2464(13), 2010.
Varnes, D. J.: Landslide hazard zonation: a review of principles andpractice, Nat. Hazards, 3, UNESCO, Paris, France, 63 pp., 1984.
Zanchetta, G., Sulpizio, R., Pareschi, M. T., Leoni, F. M., and San-tacroce, R.: Characteristics of May 5–6, 1998 volcaniclastic de-bris flows in the Sarno area (Campania, southern Italy): rela-tionships to structural damage and hazard zonation, J. Volcanol.Geoth. Res., 133, 377–393, doi:10.1016/S0377-0273(03)00409-8, 2004.
Zeng, C., Cui, P., Su, Z., Lei, Y., and Chen, R.: Failure modes ofreinforced concrete columns of buildings under debris flow im-pact, Landslides, 12, 561–571, doi:10.1007/s10346-014-0490-0,2015.
Zuccaro, G., Cacace, F., Spence, R. J. S., and Baxter, P. J.: Impactof explosive eruption scenarios at Vesuvius, J. Volcanol. Geoth.Res., 178, 416–453, doi:10.1016/j.jvolgeores.2008.01.005,2008.
www.nat-hazards-earth-syst-sci.net/17/703/2017/ Nat. Hazards Earth Syst. Sci., 17, 703–719, 2017