MODALP: a deterministic rainfall-runoff model for large karstic areas
15
This article was downloaded by: [University of Utah] On: 11 October 2014, At: 12:06 Publisher: Taylor & Francis Informa Ltd Registered in England and Wales Registered Number: 1072954 Registered office: Mortimer House, 37-41 Mortimer Street, London W1T 3JH, UK Hydrological Sciences Journal Publication details, including instructions for authors and subscription information: http://www.tandfonline.com/loi/thsj20 MODALP: a deterministic rainfall- runoff model for large karstic areas ALPARSLAN ARIKAN a a Department of Hydrogeological Engineering, Engineering Faculty , Hacettepe University , 06532 , Beytepe , Ankara , Turkey Published online: 24 Dec 2009. To cite this article: ALPARSLAN ARIKAN (1988) MODALP: a deterministic rainfall-runoff model for large karstic areas, Hydrological Sciences Journal, 33:4, 401-414, DOI: 10.1080/02626668809491262 To link to this article: http://dx.doi.org/10.1080/02626668809491262 PLEASE SCROLL DOWN FOR ARTICLE Taylor & Francis makes every effort to ensure the accuracy of all the information (the “Content”) contained in the publications on our platform. However, Taylor & Francis, our agents, and our licensors make no representations or warranties whatsoever as to the accuracy, completeness, or suitability for any purpose of the Content. Any opinions and views expressed in this publication are the opinions and views of the authors, and are not the views of or endorsed by Taylor & Francis. The accuracy of the Content should not be relied upon and should be independently verified with primary sources of information. Taylor and Francis shall not be liable for any losses, actions, claims, proceedings, demands, costs, expenses, damages, and other liabilities whatsoever or howsoever caused arising directly or indirectly in connection with, in relation to or arising out of the use of the Content. This article may be used for research, teaching, and private study purposes. Any substantial or systematic reproduction, redistribution, reselling, loan, sub-licensing, systematic supply, or distribution in any form to anyone is expressly forbidden. Terms & Conditions of access and use can be found at http://www.tandfonline.com/page/ terms-and-conditions
Transcript of MODALP: a deterministic rainfall-runoff model for large karstic areas

This article was downloaded by: [University of Utah]On: 11 October 2014, At: 12:06Publisher: Taylor & FrancisInforma Ltd Registered in England and Wales Registered Number: 1072954 Registeredoffice: Mortimer House, 37-41 Mortimer Street, London W1T 3JH, UK
Hydrological Sciences JournalPublication details, including instructions for authors andsubscription information:http://www.tandfonline.com/loi/thsj20
MODALP: a deterministic rainfall-runoff model for large karstic areasALPARSLAN ARIKAN aa Department of Hydrogeological Engineering, EngineeringFaculty , Hacettepe University , 06532 , Beytepe , Ankara ,TurkeyPublished online: 24 Dec 2009.
To cite this article: ALPARSLAN ARIKAN (1988) MODALP: a deterministic rainfall-runoffmodel for large karstic areas, Hydrological Sciences Journal, 33:4, 401-414, DOI:10.1080/02626668809491262
To link to this article: http://dx.doi.org/10.1080/02626668809491262
PLEASE SCROLL DOWN FOR ARTICLE
Taylor & Francis makes every effort to ensure the accuracy of all the information (the“Content”) contained in the publications on our platform. However, Taylor & Francis,our agents, and our licensors make no representations or warranties whatsoever as tothe accuracy, completeness, or suitability for any purpose of the Content. Any opinionsand views expressed in this publication are the opinions and views of the authors,and are not the views of or endorsed by Taylor & Francis. The accuracy of the Contentshould not be relied upon and should be independently verified with primary sourcesof information. Taylor and Francis shall not be liable for any losses, actions, claims,proceedings, demands, costs, expenses, damages, and other liabilities whatsoeveror howsoever caused arising directly or indirectly in connection with, in relation to orarising out of the use of the Content.
This article may be used for research, teaching, and private study purposes. Anysubstantial or systematic reproduction, redistribution, reselling, loan, sub-licensing,systematic supply, or distribution in any form to anyone is expressly forbidden. Terms& Conditions of access and use can be found at http://www.tandfonline.com/page/terms-and-conditions

Hydrological Sciences - Journal - des Sciences Hydrologiques, 33, 4, 8/1988
MODALP: a deterministic rainfall-nmoff model for large karstic areas
ALPARSLAN ARIKAN Department of Hydrogeological Engineering, Engineering Faculty, Hacettepe University, 06532 Beytepe, Ankara, Turkey
Abstract A model has been developed for fractured-fissured and karstic aquifers and it consists of two main systems; one of which represents the surface drainage area and simulates the peak flows of the hydrograph while the other simulates the inflows from the adjacent closed basins that contribute to the baseflow. Each of the two systems consists of two reservoirs. The first reservoir represents the soil cover and the unsaturated zone. Its main function is to deliver the effective precipitation to the second reservoir. The second reservoir represents the saturated zone of the karst system. Since the intensity of karstification decreases with depth, a variable discharge coefficient is considered in the model. The model has been applied successfully to the Manavgat River basin in Turkey, a highly karstified area.
MODALP: modèle déterministe pluie-débit pour les grands bassins karstiques
Résumé Le modèle déterministe mis au point pour les aquifères fissurés et karstifiés comporte deux systèmes. Le premier système correspond au bassin versant défini par la topographie et assure en général la simulation des crues. Le deuxième sert à simuler les apports des bassins voisins qui participent à l'écoulement lent (débit de base) par circulation interne. Chacun de ces deux systèmes comporte deux réservoirs. Le premier réservoir correspond aux couche superficielles et à la zone non saturée. Son rôle principal est de déterminer la pluie efficace fournie au deuxième réservoir. Le deuxième réservoir correspond à la zone noyée du système karstique. Puisque le degré de karstification varie verticalement, en diminuant avec la profondeur, nous avons utilisé un coefficient de vidange variable en fonction de la hauteur d'eau contenue dans le réservoir. L'application du modèle au bassin du Manavgat en Turquie a donnée des résultats satisfaisants.
INTRODUCTION
The complex hydrological and hydrogeological structure of karst systems may be modelled through deterministic approaches. Deterministic models consist
Open for discussion until 1 February 1989. 401
Dow
nloa
ded
by [
Uni
vers
ity o
f U
tah]
at 1
2:06
11
Oct
ober
201
4

Alparslan Arikan 402
of a set of mathematical equations which mimic the response of a system and simulate its physical operation. All parameters used in these formulations should bear physical meanings. However, in the formulations describing the physical processes, certain simplifying assumptions are required. The more we know about the operation of the physical system, the more realistic the formulations will be.
The most practical approach in the precipitation-flow models which are deterministic in structure is to use a series of reservoirs (Bezes, 1976). Based on the operation of the system two types of zones may be distinguished with these reservoirs. Reservoirs for the first zone simulate the behaviour of the unsaturated zone. The objectives of the processes followed here are to evaluate the rate of infiltration by taking into account soil moisture and evaporation, and to transfer the excess water into the saturated zone. On the other hand, reservoirs for the second zone are used for the simulation of the saturated zone. In this group there may be a number of reservoirs that are linked with each other either in a parallel fashion or serially, and which provide different discharge velocities (Milanovic, 1981). Reservoirs with rapid discharge simulate peak flows while those involving slower discharge rates simulate baseflow. Transfer functions, which are based on certain assumptions and which realize transfers between the two zones, are used in ensuring the distribution among the reservoirs of the second zone.
In the model presented here, the first zone (the unsaturated zone), is simulated in a fashion similar to those described in previous models (Drogue et al, 1982). However as distinct from existing models, calculation of the real évapotranspiration (ETR) is based upon the fact that ETR shows an exponential variation. Apart from this, because of direct infiltration in karst basins, surface runoff has not been allowed in this zone.
In the second zone (the saturated zone) only one reservoir is defined, and so the problems of transfer and distribution have been eliminated. Considering the physical structure of karst systems, a variable discharge coefficient rather than a constant one has been adopted. The discharge coefficient varies exponentially between certain values depending upon the position of the water level in the reservoir. A more rapid discharge takes place when the water level in the reservoir rises, while a lower rate of discharge occurs when the water level declines. Although the saturated zone is handled as a single reservoir, it is in fact a structure consisting of almost an infinite number of reservoirs.
In extensive karstic terrains subsurface contributions may take place from closed polje systems adjacent to the main drainage system. Such contributions may be simulated by incorporating a second system to the model that is linked hydrologically to the first.
The model described in this paper is applied to simulate the streamflow of the Manavgat River basin located in the southern part of Turkey. The terrain is characterized by widespread occurrences or karstic features having highly complex hydrological and hydrogeological structures. The Manavgat River basin is surrounded by a number of closed polje systems.
Dow
nloa
ded
by [
Uni
vers
ity o
f U
tah]
at 1
2:06
11
Oct
ober
201
4

403 MODALP: a deterministic rainfall-runoff model
STRUCTURE OF THE MODEL
The model simulates the hydrological and hydrogeological behaviour of typical natural karst systems. In a karst system two zones may be distinguished (Fig. 1). At the top, the soil cover with vegetation constitutes the first
Î W T -
I
p ETR
V 1 t
@
<ïx
, i •
> f RESERVOIR
nd
>l. RESERVOIR
j
Fig. 1 Idealized geological cross section through a karstic terrain showing the reservoirs depicted in the model (not to scale). [P: Precipitation; ETR: Evapotranspiration; WT: Water Table]
zone. In this zone the soil is either unsaturated or partially saturated. In terrains where such soil cover is absent the problem is reduced to a single reservoir system. The second zone comprises the bedrock. At its top, it is highly karstic and the intensity of karstification is assumed to decrease with depth, excluding the cases of palaeokarst and thermal karst. The hydrological and/or hydrogeological regime of both zones is normally controlled by the overlying drainage basin. In nature, however, the karstic terrains are far more complex. The surface and subsurface drainage basins do not coincide in karstic areas. Due to the presence of intricate and unpredictable subsurface drainage systems, some contribution from adjacent closed drainage basins may also occur. The water divide delineating different surface drainage basins does not necessarily correspond to the groundwater divide of the karst aquifers. If so, in the model a second closed drainage basin that lies adjacent to the first is also considered in order to account for the excess water encountered in the first system. In this case the two systems are assumed to be hydraulically connected.
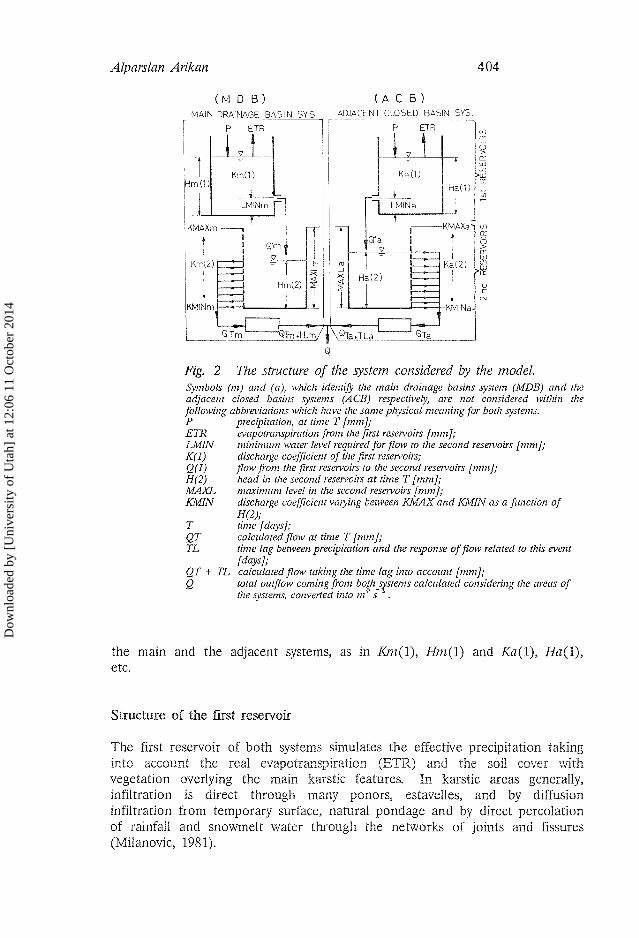
The model (Fig. 2) considers two such systems, each with two reservoirs, the first reservoir corresponding to the soil cover (unsaturated zone) and the lower reservoir to the karst aquifer. In Fig. 2 the abbreviations MDB and ACB refer to the "Main Drainage Basin System" and "Adjacent Closed Basin System", respectively. The abbreviations m and a stand for the parameters of
Dow
nloa
ded
by [
Uni
vers
ity o
f U
tah]
at 1
2:06
11
Oct
ober
201
4
Alparslan Arikan 404
(M D B )
_MAIN_ DRAINAGE BASIN SYS
P
( A C B) ADJACENT CLOSED BASIN SYS.
Fig. 2 The structure of the system considered by the model. Symbols (m) and (a), which identify the main drainage basins system (MDB) and the adjacent closed basins systems (ACB) respectively, are not considered within the following abbreviations which have the same physical meaning for both systems. P . - . -ETR LMIN K(l) Q(D H(2) MAXL KMIN
precipitation, at time T [mm]; évapotranspiration from the first reservoirs [mm]; minimum water level required for flow to the second reservoirs [mm]; discharge coefficient of the first reservoirs; flow from the first resetvoirs to the second reservoirs [mm]; head in the second reservoirs at time T [mm]; maximum level in the second reservoirs [mm]; discharge coefficient varying between UMAX and KMIN as a function of H(2); time [days]; calculated flow at time T [mm]; time lag between precipitation and the response of flow related to this event [days];
QT + TL calculated flow taking tlie time lag into account [mm]; total outflow coming from both systems calculated considering the areas of the systems, converted into m s .
T QT TL
Q
the main and the adjacent systems, as in Km(l), Hm(T) and Ka(l), Ha{\), etc.
Structure of the first reservoir
The first reservoir of both systems simulates the effective precipitation taking into account the real évapotranspiration (ETR) and the soil cover with vegetation overlying the main karstic features. In karstic areas generally, infiltration is direct through many ponors, estavelles, and by diffusion infiltration from temporary surface, natural pondage and by direct percolation of rainfall and snowmelt water through the networks of joints and fissures (Milanovic, 1981).
Dow
nloa
ded
by [
Uni
vers
ity o
f U
tah]
at 1
2:06
11
Oct
ober
201
4

405 MODALP: a deterministic rainfall-runoff model
The parameters used in the first reservoirs are as follows: H(\): head in the reservoir at time t [mm]; LMIN: the minimum water level required for flow to the second reservoir (if
#5(1) « LVMINS, this flow does not occur); K(l); discharge coefficient of the first reservoir.
Since in the model all computations are made on a daily basis, after adding the daily precipitation to H(l), ETR is subtracted (Fig. 3).
The flow into the second reservoir is calculated according to the following equation:
QX = H(l) * Kl (1)
If Kl is equal to 1.0, that is, infiltration occurs directly through the ponors, estavelles and other karstic features, then all of the water coming from precipitation during that day is delivered to the second reservoir.
•C READ P
HQ) = H Q W
ETR = ETP
01 = HQ) X K(l>
HQ)= HQ)-ETR-Q1
H(2) = H(2HQ1
QT = 0
NO ETR = 0
HQ) = 0
01 = 0
ETR= F(HQ))XETP
H(l)= HQ)-ETR
01 = 0
K(2) = WAX
K(2) = F(H(2))
QT = K(2)XH(2)
H!2) = H(2)-QT
Fig. 3 Flow chart for the model.
Dow
nloa
ded
by [
Uni
vers
ity o
f U
tah]
at 1
2:06
11
Oct
ober
201
4

Alparslan Arikan 406
If Kl is less than 1.0, the portion of precipitation that will be transferee! gradually into the second reservoir is considered as a function of H(l) and this causes a time lag. This is the case for contributions from adjacent polje systems or drainage basins.
ETR is obtained by means of ETP (potential évapotranspiration) which is calculated according to Thornthwaite's method. ETP is multiplied by a variable A, (ETR = A * ETP) to obtain ETR for two different conditions. The variable A depends on the saturation level of the soil cover. If H(l) Z LMIN, soil cover is assumed to be fully saturated, and consequently A = 1. If H(l) has a value near zero, A is assumed to have a value of 0.1 considering that évapotranspiration continues under all conditions in nature. The value of the constant A varies between its upper and lower levels following an exponential function.
Structure of the second reservoir
The main difference in this reservoir is that all computations are made taking into account the fact that the intensity of karstification decreases with depth, excluding the cases of palaeokarst and thermal karst. This fact was justified by Milanovic (1981) by using the data obtained from 146 deep boreholes in Yugoslavia. Milanovic stated that the intensity of karstification and consequently the permeability decreases with depth according to the following equation:
E = a * exp(~è * H)
where E is the degree of karstification, a and b are constants, and H is depth [m]. The discharge coefficient used in this study fully agrees with the conclusion reached by Milanovic (1981). In previous studies, the analysis of the recession curves of karst springs (flows) has yielded different recession coefficients. The consequent interpretations of the recession coefficients were made considering different physical reservoirs each of which has a different permeability. The steepest line on the recession curve, when plotted on semi-logarithmic graph paper, represents the reservoir with the highest permeability (solution channels), which means rapid discharge. The zone with the lowest permeability (microfissures) is represented by the line with the lowest slope on the semi-logarithmic hydrograph. The lines with slopes between the highest and the lowest show the zones with intermediate permeability. Bezes (1976) in his model has applied the same analysis as given above and explained the recession curve using three discharge coefficients.
In this study, instead of taking a constant coefficient for each reservoir, the discharge coefficient is assumed to change with head. This assumption reflects the physical structure of the system. The parameters used for the second reservoir are as follows: H(2): head [mm]; MAXL: maximum level in the second reservoir [mm]; KMAX: discharge coefficient when H{2) 4 MAXL;
Dow
nloa
ded
by [
Uni
vers
ity o
f U
tah]
at 1
2:06
11
Oct
ober
201
4

407 MODALP: a deterministic rainfall-runoff model
KMIN: discharge coefficient when H{2) approximates to zero; K(2): discharge coefficient varying between KMAX and KMIN as a
function of H(2) [dimensionless]. KMAX, KMIN and MAXL are to be adjusted during calibration of the model.
As stated above the discharge coefficient varies exponentially between KMAX and KMIN. The variation of K is expressed with the following equation:
K(2) = exp[(rA*H(2) + B)] (2)
where A and B are the parameters to be calculated with the help of two functions of KMAX and KMIN.
In the case of maximum level:
KMAX = exp[-(A * MAXL + B)] (3)
and when the level is zero:
KMIN= exp(-fl) (4)
The daily discharge [mm] occurring in any day is calculated as follows:
Qt = H(2) * K (5)
By substituting equation (2) in equation (5), equation (6) is obtained:
Qt = H(2) * exp[-(4 * H(2) + B)] (6)
If we compare this equation with that of Maillet (1905) and considering one-day time interval:
Qt = Qt_x * exp[-«] (7)
we can conclude that the discharge coefficient a varies linearly between KMAX and KMIN. Such a relationship suggests that the model is of a linear character.
In practical applications nonlinear systems generally exist. In such cases the user must state the proper variation of the coefficient a between KMAX and KMIN, either in an exponential or logarithmic form, which will reflect the character of the physical system.
The model starts the calculation by adding Q\ coming from the first reservoir to H(2) for every time step [one day]. Evaporation is ignored here since this reservoir simulates the deep karstic zone. The discharges calculated according to equations (2) and (5) are assigned to an array in the program. The time lag parameter TL is used to control the time lag between the observed and the calculated discharges. The calculated discharges of each system are assigned to matrices which are then superposed (added) on one
Dow
nloa
ded
by [
Uni
vers
ity o
f U
tah]
at 1
2:06
11
Oct
ober
201
4
Alparslan Arikan 408
another, taking into account the given time lag, in order to obtain the total discharges in mm. The discharges in mm are converted into m3 s"1 and plotted on the screen to observe the goodness of simulation.
SIMULATION
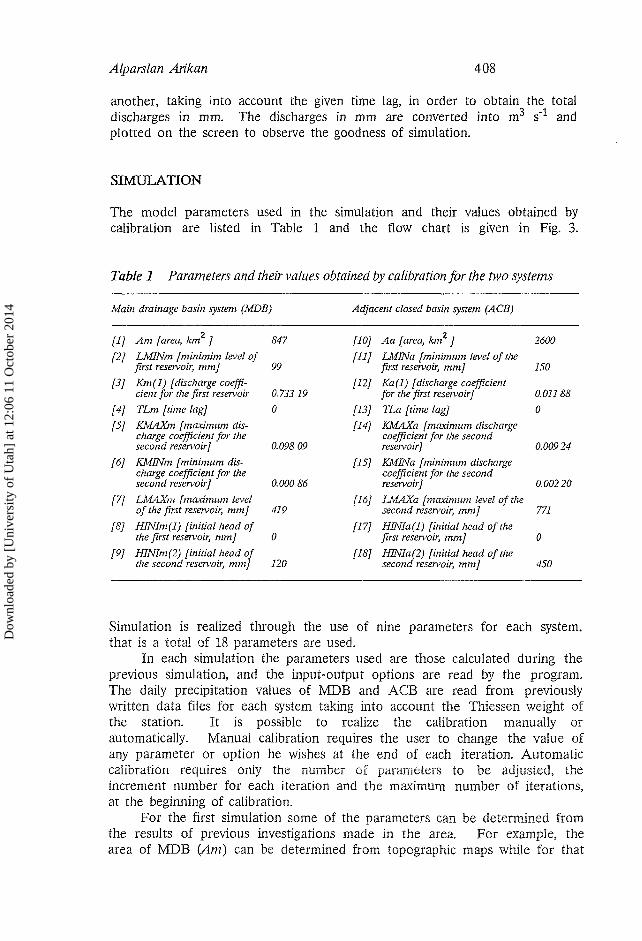
The model parameters used in the simulation and their values obtained by calibration are listed in Table 1 and the flow chart is given in Fig. 3.
Table 1 Parameters and their values obtained by calibration for the two systems
Main drainage basin system (MDB) Adjacent closed basin system (ACB)
[1] Am [area, km* ] 847
[2] LMINm [minimim level of first reservoir, mm] 99
[3] Km(l) [discharge coefficient for the first reservoir 0.733 19
[4] TLm [time lag] 0
[5] KMAXm [maximum discharge coefficient for the second reservoir] 0.098 09
[6] KMJNm [minimum discharge coefficient for the second reservoir] 0.000 86
[7] LMAXm [maximum level of the first reservoir, mm] 419
[8] HINIm(l) [initial head of the first reservoir, mm] 0
[9] HINIm(2) [initial head of the second reservoir, mm] 120
[10] Aa [area, kmc ] 2600
[11] LMlNa [minimum level of the first reservoir, mm] 150
[12] Ka(l) [discharge coefficient for the first reservoir] 0. Oil 88
[13] TLa [time lag] 0
[14] KMAXa [maximum discharge coefficient for tlte second reservoir] 0.00924
[15] KMINa [minimum discharge coefficient for the second reservoir] 0.00220
[16] LMAXa [maximum level of the second reservoir, mm] 771
[17] HWIa(l) [initial head of the first reservoir, mm] 0
[18] HINIa(2) [initial head of tlte second reservoir, mm] 450
Simulation is realized through the use of nine parameters for each system, that is a total of 18 parameters are used.
In each simulation the parameters used are those calculated during the previous simulation, and the input-output options are read by the program. The daily precipitation values of MDB and ACB are read from previously written data files for each system taking into account the Thiessen weight of the station. It is possible to realize the calibration manually or automatically. Manual calibration requires the user to change the value of any parameter or option he wishes at the end of each iteration. Automatic calibration requires only the number of parameters to be adjusted, the increment number for each iteration and the maximum number of iterations, at the beginning of calibration.
For the first simulation some of the parameters can be determined from the results of previous investigations made in the area. For example, the area of MDB (Am) can be determined from topographic maps while for that
Dow
nloa
ded
by [
Uni
vers
ity o
f U
tah]
at 1
2:06
11
Oct
ober
201
4

409 MODALP: a deterministic rainfall-runoff model
of ACB (Aa), the difference between total precipitation and total discharge, the results of tracing studies and of water budget computation can be used.
In the absence of subsurface inflow from adjacent basins, Aa is set to zero so that the program does not consider ACB. Thus, the model comprises the first system of two reservoirs only.
The second parameters LMINm and LMINa must have a proper initial value, and as the simulation proceeds, since Hm(V) will decrease due to evaporation, LMINm must be adjusted and given a higher value than the initial value in order to avoid Hm(l) decreasing down to slightly above zero for a long drought period. On the other hand, again by adjusting this parameter, the first peak flow must be simulated at the beginning of the water year. It must be kept in mind that the water level Hm(l) in the reservoir decreases down to LMINm and below during long dry periods, which will create a water deficit. The deficit water must be covered by the first rainfall events in order to reach the LMINm required for the first response on the hydrograph (Arikan & Ekmekci, 1986). Thus, an improper adjustment of LMINm will create a response in the calculated hydrograph while there is no response indeed in the observed hydrograph.
The initial values of Km(l) and Ka(l) should be taken as 1.0 and slightly less than 1.0, respectively. Km(T) is a very important parameter in simulating the peak flows. Km(l) = 1.0 means that all the water coming from precipitation infiltrates into the lower reservoir and causes sudden and high peaks on the hydrograph. Assigning low values to Km(i) causes a time lag between precipitation and flow thus preventing sudden peaks.
If the water collected in the adjacent polje systems is reaching the system through long and deep fractures and fissures, just as is the case in the study area, K(l) must take very small values. This will cause a delayed contribution by ACB and simulate the general trend of the hydrograph.
TLm is a parameter that provides a time lag between rainfall and flow additional to that created by Km(l). This parameter must have an integer value in days and is used to coincide the observed and calculated peaks for MDB.
TLa takes any value when the observed and calculated recession curves and the general trends of the observed and calculated hydrographs do not coincide.
The initial values of KMAXm and KMINm are determined through the analysis of the recession curves from the peaks, while KMAXa and KMINa are determined from the analysis of the recession curves occurring during dry periods. The initial values of LMAXm and LMAXa may be accepted as one quarter of the average annual precipitation.
HINIm(l) and HINIa{2) are the initial head values of the first and the second reservoirs, respectively. These are adjusted to obtain the flow rate at the beginning of the water year and the first peaks. In general, the parameters related to ACB are adjusted to provide a good fit between the general trends of the calculated and the observed hydrographs while those related to MDB are to simulate the peak flows. The quality of the simulation can be seen either from the graphs plotted on the screen or using the following three criteria based on the correlation coefficients between the
Dow
nloa
ded
by [
Uni
vers
ity o
f U
tah]
at 1
2:06
11
Oct
ober
201
4

Alparslan Arikan 410
calculated and the observed flow values. The first criterion is used for rainy days with precipitation exceeding 10 mm that occurred in MDB; the second criterion is for rainy days with precipitation less than 10 mm; and the third criterion is for the whole simulation period.
Due to the restrictions imposed by the hardware and software of the system used, the maximum simulation period in the model is limited to six years. At the first stage of the calibration the parameters and the input-output options are displayed. The maximum number of iterations, the number of parameters to be adjusted and their increments are all inputs required by the program.
CASE STUDY
The study area
The Manavgat River basin (Fig. 4) has been the subject of extensive and detailed geological and hydrogeological studies during the last 20 years, mostly because of the construction of the Oymapinar and the Manavgat dams. Numerous published and unpublished reports are available for the basin.
Fig. 4 Location map of the study area.
Dow
nloa
ded
by [
Uni
vers
ity o
f U
tah]
at 1
2:06
11
Oct
ober
201
4

411 MODALP: a deterministic rainfall-runoff model
Based on the results of previous investigations it is understood that the water drains into the Manavgat River not only from its surface watershed but also from the closed surface basins to the northwest and especially to the east of the Manavgat River (Yurtsever, 1979).
The surface watershed area of the Manavgat River at the Homa gauging station is about 900 km2. The recorded monthly and annual discharges are very high for such a small drainage area, and thus considerable subsurface contribution must be coming from adjacent basins (Gunay, 1981).
It has been proven by repeated dye tests (Gunay et al., 1978) that the water of the Eynif Polje supports several springs observed along the Manavgat River (Fig. 4). Various lithological units such as the Palaeozoic flysch and schists, Eocene flysch and Miocene molasse generally trend northwest-southeast, thus forming regional or local hydrogeological barriers to the groundwater flow (Eroskay et ai, 1986).
Calibration
Precipitation data were obtained from the records of the stations whose Thiessen weights are listed in Table 2. Previous multiple correlation analysis
Table 2 Precipitation recording stations used in the model and their weights
Surface drainage system: Catchment system: Station Thiessen weight Station Thiessen weight
Aydinkent 0.6 Aydinkent 0.2 Cevizli 0.4 Cevizli 0.2
Akseki 0.6
between precipitation and Homa flows has shown that precipitations recorded at the Aydinkent station influence the flow with a time lag of zero and two months, that is, precipitation that occurred in the z'th and the (i - 2)nd months influence the flow recorded in the z'th month. This conclusion shows that the precipitation occurring throughout the catchment area affects the flow of Homa gauging station within two months depending on the distance between the stations. This effect shows itself as a piston flow.
The topography and the morphology of the region show variations within short distances. Meanwhile all recording stations are located in villages or cities at lower altitudes so that the precipitation data do not represent the entire area.
The period covering the water years between 1971 and 1976 was chosen for simulation. The data of this period are in good accord with the general trend of the data for the long-term period.
Dow
nloa
ded
by [
Uni
vers
ity o
f U
tah]
at 1
2:06
11
Oct
ober
201
4

Alparslan Arikan 412
Automatic calibration was started after the manual calibration process by which the third criterion had the value of 0.86 and was repeated until the third criterion had the value of 0.92. The results of the automatic calibration and the values of the parameters used in the model are listed in Table 1. Figure 5 shows the calculated and the observed hydrographs for the water year 1970-1971, the beginning of the calibration period.
H O D f l L P / 1 9 7 0 - 7 1 U f t T E R Y E A R I | if ! j I ' | | ' I1 ' ! I' 1 | | | I III! | '(| i|"| — n r-\ f
Fig. 5 Calculated and observed hydrograph for the first water year of the calibration period.
RESULTS AND DISCUSSION
The total area of the underground drainage system is almost three times greater than that of the surface drainage area (Table 1). This conclusion supports the findings of Gunay (1981) who stated that the average precipitation over the surface drainage area is 3.5 times that of the flow.
The parameter Ka(T) has a very small value. This also confirms the findings from hydrogeological investigations. The poljes such as Eynif and Gembos that recharge the basin form temporary lakes during winter and are drained through sinkholes gradually by the end of the spring. High Km(l) values suggest that there exist large conduits (secondary porosity) for the main drainage basin. This explains the rapid effect of the daily precipitation on the flows.
In the model the time lag of each system is taken as zero. Assigning low values to Ka(l) causes a proper time lag. Since Ka(l) takes a value of 0.0199 the time required for half of the precipitation that has occurred to transfer into the second reservoir is calculated as 57 days, or about two months. This result is also justified by Ekmekci (1984) through his multiple
Dow
nloa
ded
by [
Uni
vers
ity o
f U
tah]
at 1
2:06
11
Oct
ober
201
4

413 MOD ALP: a deterministic rainfall-runoff model
cross-correlation analysis between precipitation and flow data. The model developed here has contributed valuable information to the
previous models aiming to explain the karst system. The results obtained from this study represent the dynamic structure of the karst groundwater system, which consequently will provide a good basis to the planners of the hydrotechnic construction in the region.
As in all models, there are differences between the model-computed and the observed values which may be attributed to the assumptions made in the model and also to the errors involved in the observed data. However, the calculated and the observed hydrographs show better correlation as the calibration period is increased. As a test of the calibrated model, Fig. 6 shows the hydrographs for the 1976-1977 water year which was not included in the calibration period. Clearly, the parameters were fitted with high accuracy. The correlation coefficient between the observed and calculated streamflows for 1976-1977 was found to be r = 0.92.
n O D R L P / ' 1 9 7 6 - 7 7 W A T E R Y E f I R
Fig. 6 Hydrograph for 1976-1977 water year plotted using the parameters obtained after completion of calibration.
The model may be re-constructed taking into account snowmelt effect on the flow. In addition, evaporation values used in the model could be compared with those obtained from a Class A Pan. This would further increase the accuracy of the results.
Acknowledgements This study was supported by the UNDP Project TUR/B1/004. Professor Gultekin Gunay, the Project Coordinator, encouraged the author to realize this study. I would like to express my deepest thanks to
Dow
nloa
ded
by [
Uni
vers
ity o
f U
tah]
at 1
2:06
11
Oct
ober
201
4

Alparslan Arikan 414
Professor Vedat Doyuran for his comments and revision of the text. Special thanks are due to Research Assistants, Mehmet Ekmekci, Can Denizman and Lèvent Tezcan for their assistance.
REFERENCES
Arikan, A. & Ekmekci, M. (1986) A multi-dimensional approach to rainfall-streamflow relationship in Manavgat River basin. In: Karst Water Resources (Proc. Ankara Symp., July 1985), 57-66. IAHS Publ. no. 161.
Bezes, C. (1976) Contribution à la Modélisation de Systèmes Aquifères Karstiques, Etablissement du Modèle Berner, son Application à Quatre Systèmes Karstiques du Midi de la France CERGA, Montpellier, France.
Drogue, G, Gdalia, L., Razack, M. & Guilbot, A. (1982) Application of rainfall-runoff mathematical model to compute karstic aquifers outflows. Research of the model parameters and functions significance. In: Applied Modeling in Catchment Hydrology. Water Resources Publications, Littleton, Colorado, USA.
Eroskay, S. O., Gunay, G. & Arikan, A. (1986) Effects of Oymapinar dam in the karst medium, TBTAK TBAG-625 Project (unpublished and in Turkish).
Ekmekci, M. (1984) Manavgat Mehri Havzasi Yagis Akis Arasindaki Iliskinin Istatistiksel Tekniklerle Belirlenmesi. HU Muh. Fak. Hidrojeoloji Muh. Bitirme Odevi.
Gunay, G. (1981) Investigations of karst hydrogeology of the Manavgat basin and its close vicinity (in Turkish). Affiliation thesis, Hacettepe University, Ankara.
Gunay, G., Ataman, Y. & Dogan, L. (1978) Oymapinar project Asagi Eynif Polje Dye Test, Final Report. Tech. Rep. no. 17 of UNDP/DSI Project, Ankara.
Maille, E. (1905) Essais d'Hydrologique Souterraine et Fluviale. Paris. Milanovic, P. (1981) Karst Hydrogeology. Water Resources Publications, Littleton, Colorado,
USA. Yurtsever, Y. (1979) Environmental isotopes as a tool in hydrogeological investigations of
southern karst regions of Turkey. Proc. International Seminar on Karst Hydrogeology, (Oymapinar, Antalya, 1979), 269-287. DSI Ankara.
Received 14 April 1987; accepted 9 March 1988.
Dow
nloa
ded
by [
Uni
vers
ity o
f U
tah]
at 1
2:06
11
Oct
ober
201
4