Mobilizing international resources for development: Foreign direct investment and other private...
24
Mobilizing international resources for development: Foreign direct investment and other private flows Mansoor Dailami New York February 15th, 2008 ager, International Finance, Development Prospects Group, World Ban
-
Upload
alivia-sheard -
Category
Documents
-
view
221 -
download
0
Transcript of Mobilizing international resources for development: Foreign direct investment and other private...
Mobilizing international resources for development: Foreign direct investment and other private
flows
Mansoor Dailami
New YorkFebruary 15th, 2008
Manager, International Finance, Development Prospects Group, World Bank

Summary and key issues
Private capital flows to developing countries have
been on a strong upward trend, supported by
domestic economic reforms and high growth
FDI continues to be the largest and most stable
capital flow with increasing focus on services
Private capital flows expected to decline somewhat
in the short term amid more moderate global
growth and tighter credit conditions
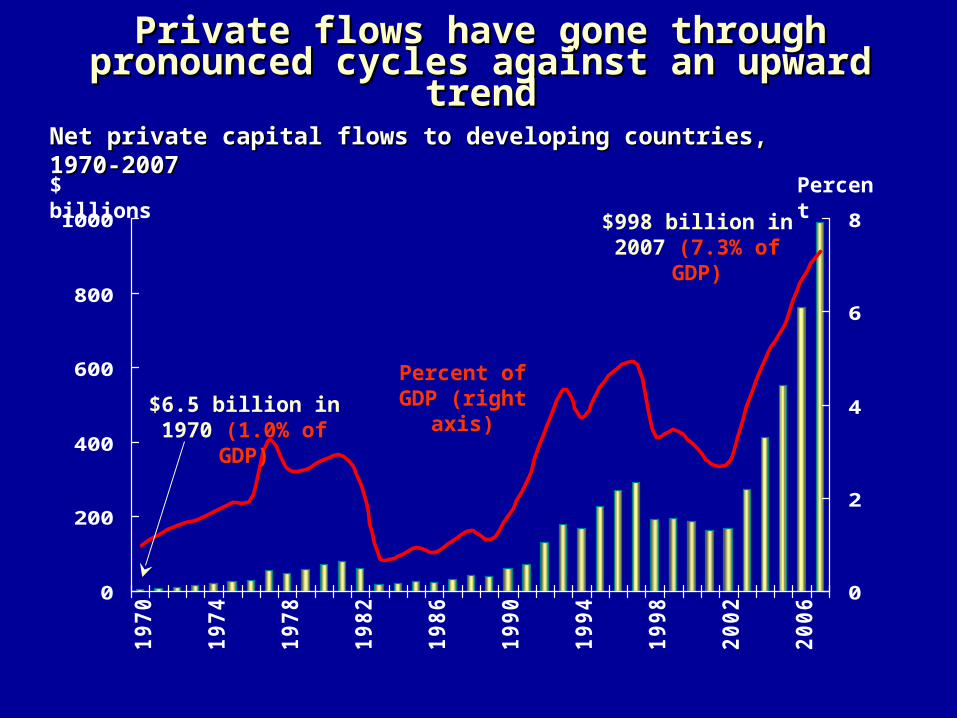
Private flows have gone through Private flows have gone through pronounced cycles against an upward pronounced cycles against an upward
trendtrend
$ billions
0
200
400
600
800
1000
1970
1974
1978
1982
1986
1990
1994
1998
2002
2006
0
2
4
6
8
Net private capital flows to developing countries, Net private capital flows to developing countries, 1970-20071970-2007
Percent of GDP (right
axis)
Percent$998 billion in
2007 (7.3% of GDP)
$6.5 billion in 1970 (1.0% of
GDP)

… … dominated by cycles in dominated by cycles in international bank lending…international bank lending…
Percent
-1
0
1
2
3
4
1970 1975 1980 1985 1990 1995 2000 2005
Net private debt flows to developing countries Net private debt flows to developing countries , , 1970-20071970-2007
Bonds
Bank loans
0
100
200
300
400
500
1991 1993 1995 1997 1999 2001 2003 2005 2007e
Corporate
Sovereign
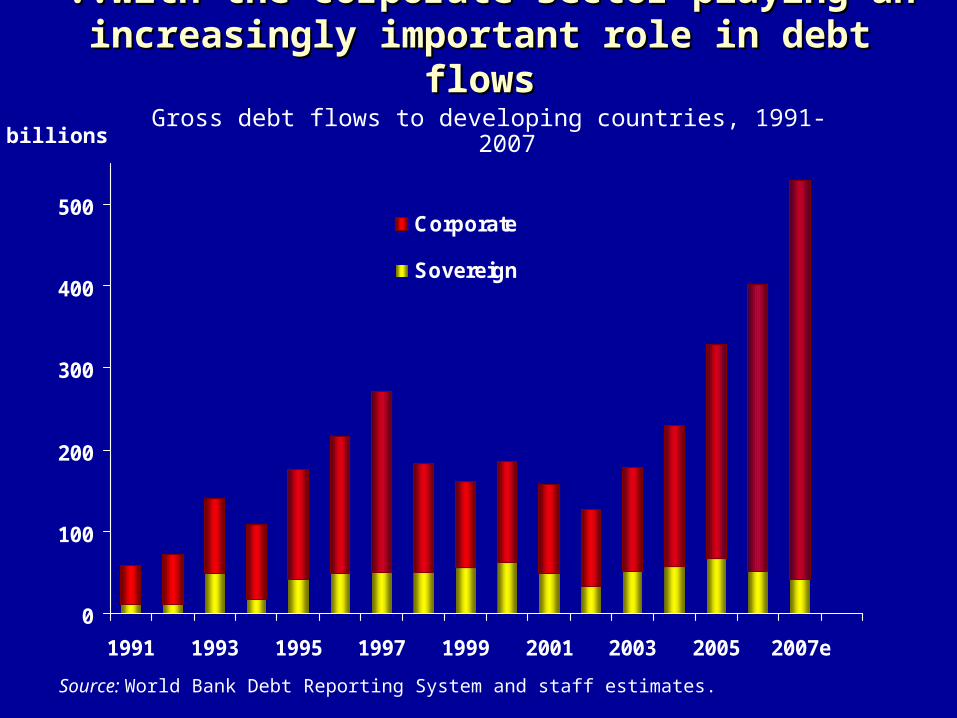
$ billionsGross debt flows to developing countries, 1991-2007
..with the corporate sector playing an ..with the corporate sector playing an increasingly important role in debt flowsincreasingly important role in debt flows
Source: World Bank Debt Reporting System and staff estimates.
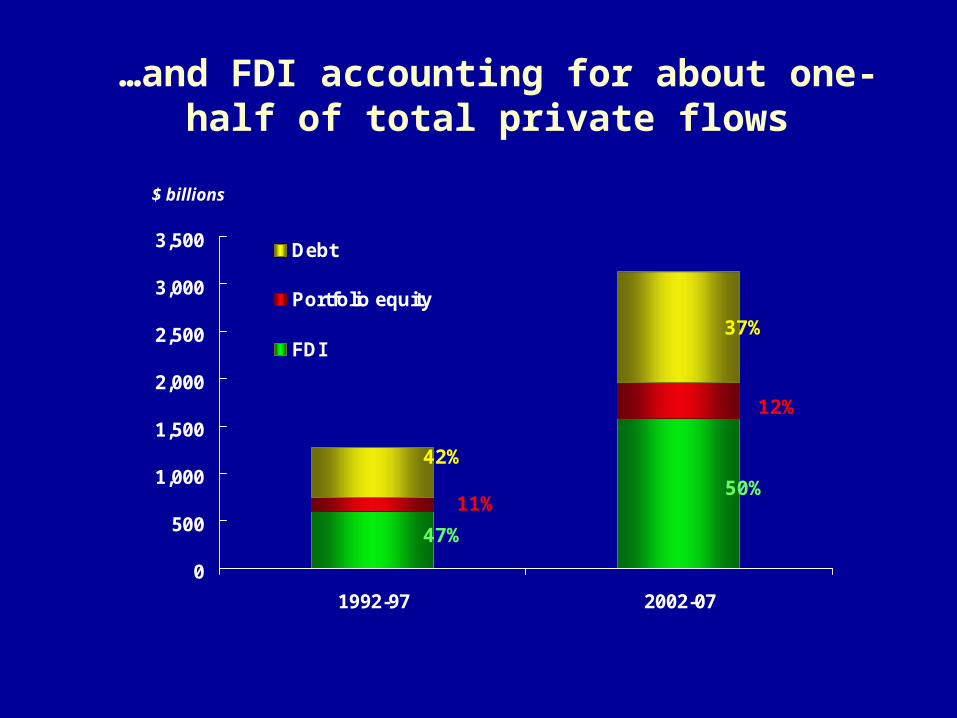
$ billions
…and FDI accounting for about one-half of total private flows
0
500
1,000
1,500
2,000
2,500
3,000
3,500
1992-97 2002-07
Debt
Portfolio equity
FDI
12%
37%
50%
42%
11%
47%
-2
0
2
4
6
8
10
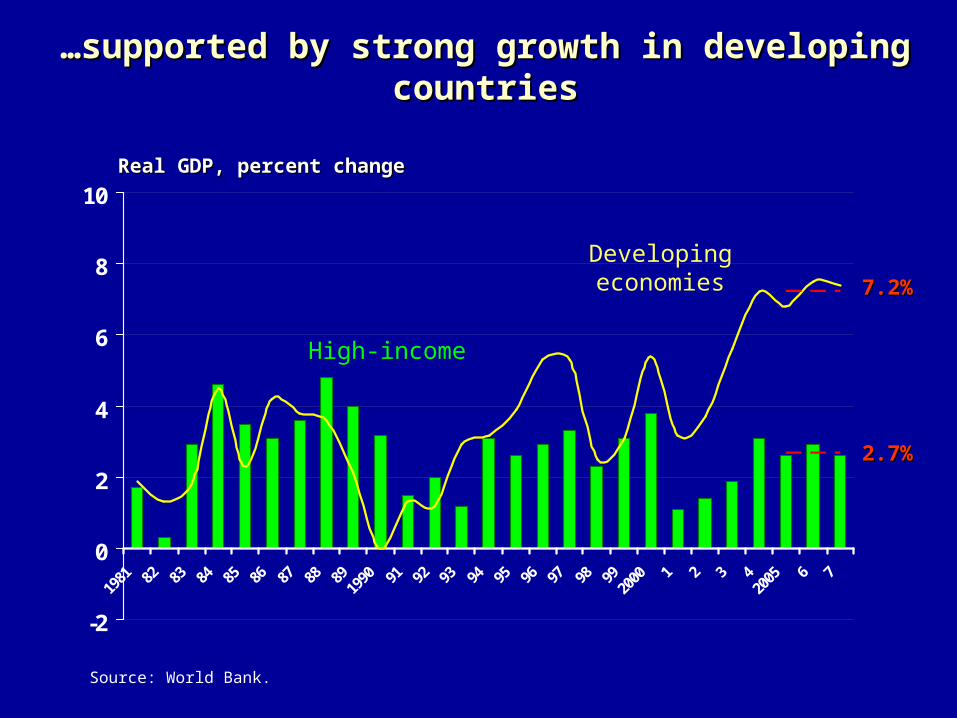
……supported by strong growth in developing supported by strong growth in developing countriescountries
Real GDP, percent changeReal GDP, percent change
Source: World Bank.
Developing economies
High-income
7.27.2%%
2.72.7%%

……and improved external payments and improved external payments positions positions
--current account surpluses in many --current account surpluses in many countriescountries
$ billions
- 3 0 0
- 1 5 0
0
1 5 0
3 0 0
4 5 0
1 9 9 0 1 9 9 2 1 9 9 4 1 9 9 6 1 9 9 8 2 0 0 0 2 0 0 2 2 0 0 4 2 0 0 6
- 4
- 3
- 2
- 1
0
1
2
3
4
Current account balance of developing countries
Percent of GDP (right
axis)
Percent$408 billion in $408 billion in
20072007
0
400
800
1200
1600
2000
2400
2800
3200
3600
4000
Oil-exportingcountries
Emerging Asia Developingcountries
1995199920052007
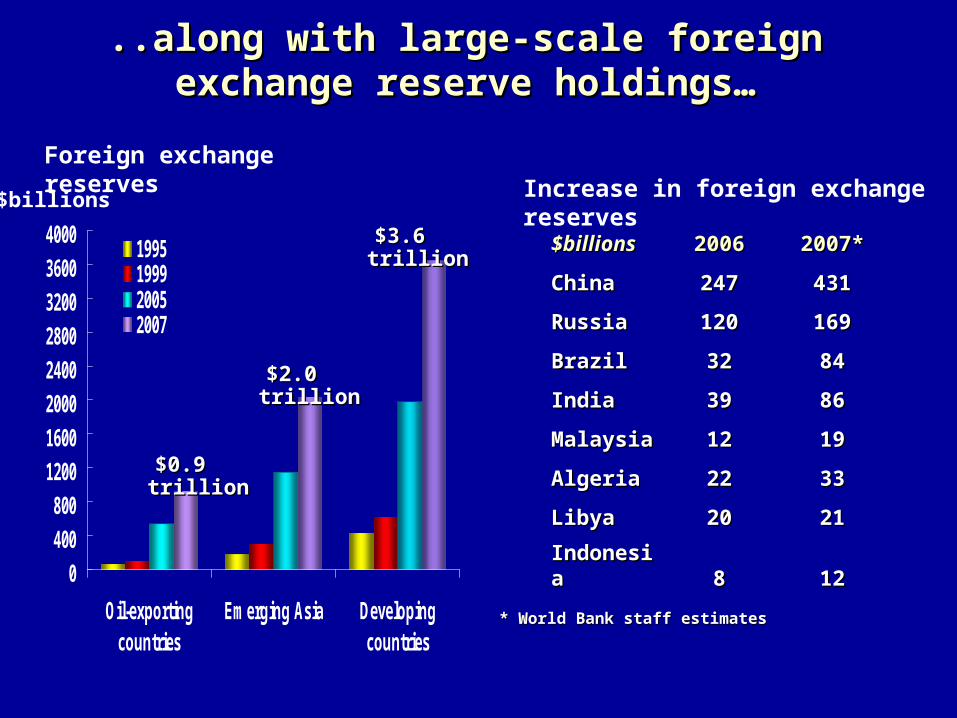
..along with large-scale foreign ..along with large-scale foreign exchange reserve holdings…exchange reserve holdings…
$billions
Foreign exchange reserves
$3.6 trillion$3.6 trillion
$2.0 trillion$2.0 trillion
$0.9 trillion$0.9 trillion
$billions$billions 20062006 2007*2007*
ChinaChina 247247 431431
RussiaRussia 120120 169169
BrazilBrazil 3232 8484
IndiaIndia 3939 8686
MalaysiaMalaysia 1212 1919
AlgeriaAlgeria 2222 3333
LibyaLibya 2020 2121
IndonesiIndonesiaa 88 1212
Increase in foreign exchange reserves
* World Bank staff estimates* World Bank staff estimates
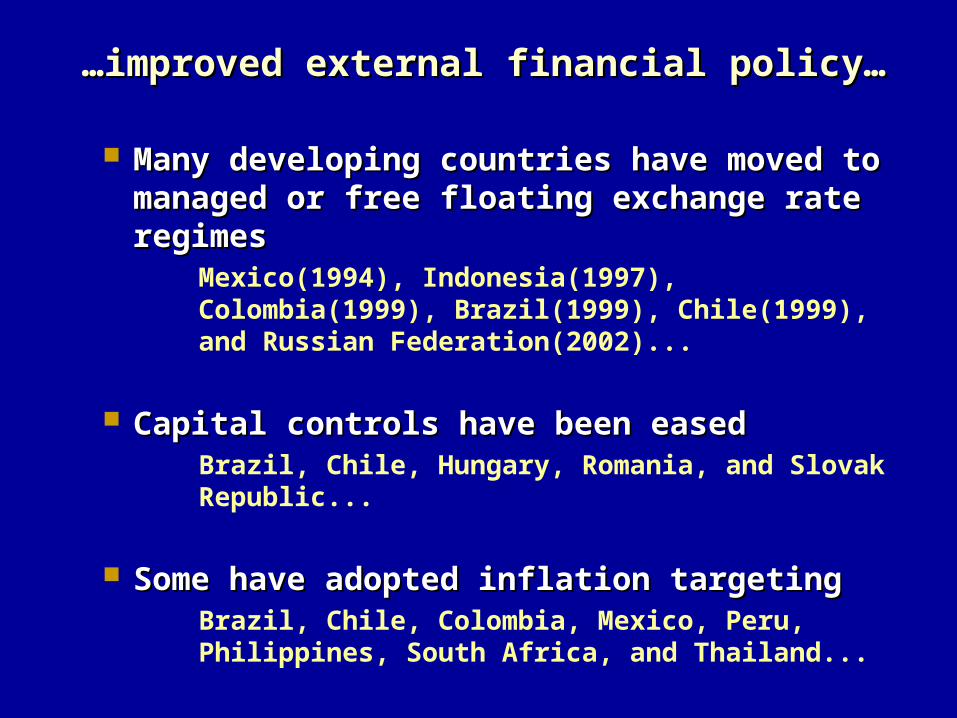
……improved external financial policy…improved external financial policy…
Many developing countries have moved Many developing countries have moved to managed or free floating exchange to managed or free floating exchange rate regimesrate regimes
Mexico(1994), Indonesia(1997), Colombia(1999), Brazil(1999), Chile(1999), and Russian Federation(2002)...
Capital controls have been easedCapital controls have been easedBrazil, Chile, Hungary, Romania, and Slovak Republic...
Some have adopted inflation targetingSome have adopted inflation targetingBrazil, Chile, Colombia, Mexico, Peru, Philippines, South Africa, and Thailand...
-10
0
10
20
30
Av. Tariffs Median Inflation Fiscal Deficit
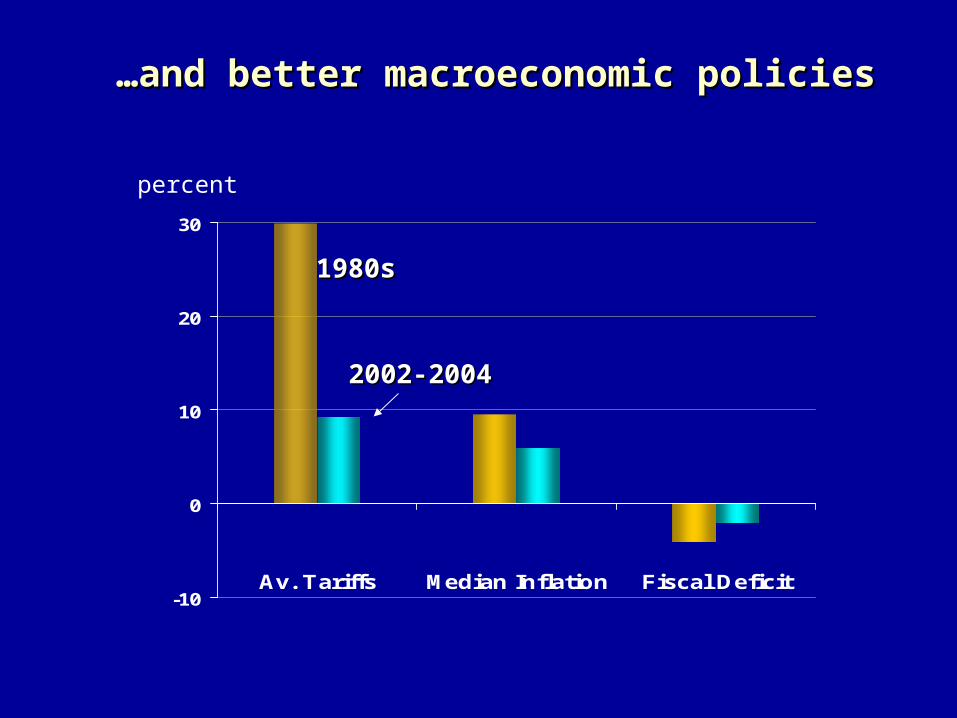
……and better macroeconomic policiesand better macroeconomic policies
percent
1980s1980s
2002-20042002-2004
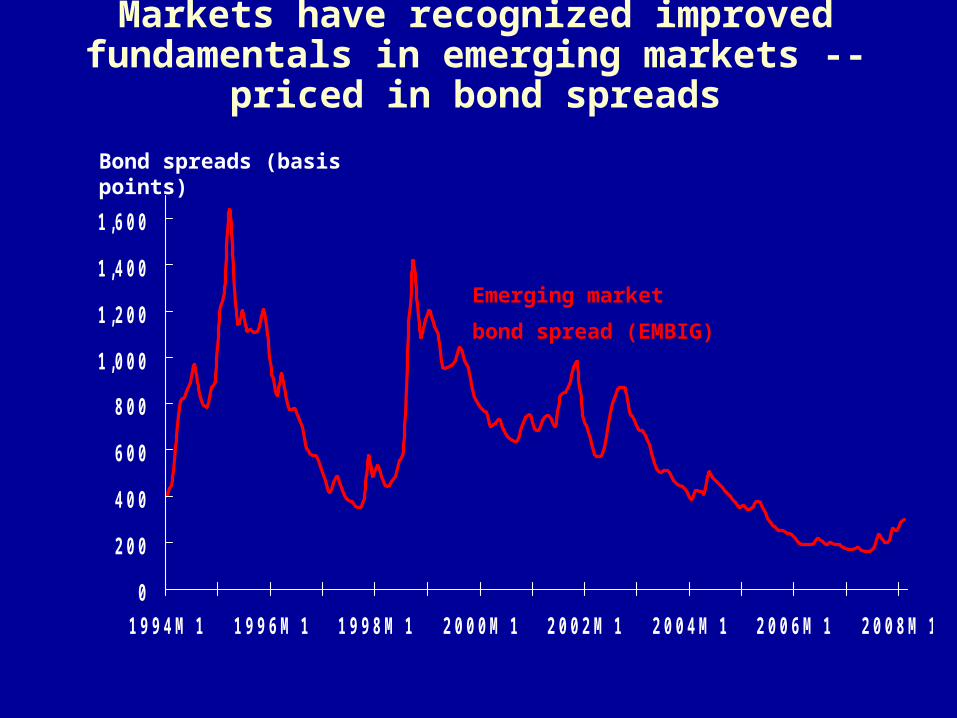
Markets have recognized improved fundamentals in emerging markets --
priced in bond spreads
0
2 0 0
4 0 0
6 0 0
8 0 0
1 , 0 0 0
1 , 2 0 0
1 , 4 0 0
1 , 6 0 0
1 9 9 4 M 1 1 9 9 6 M 1 1 9 9 8 M 1 2 0 0 0 M 1 2 0 0 2 M 1 2 0 0 4 M 1 2 0 0 6 M 1 2 0 0 8 M 1
Bond spreads (basis points)
Emerging market
bond spread (EMBIG)
Summary and key issues
Private capital flows to developing countries have
been on a strong upward trend, supported by
domestic economic reforms and high growth
FDI continues to be the largest and most stable
capital flow with increasing focus on services
Private capital flows expected to decline somewhat
in the short term amid more moderate global
growth and tighter credit conditions
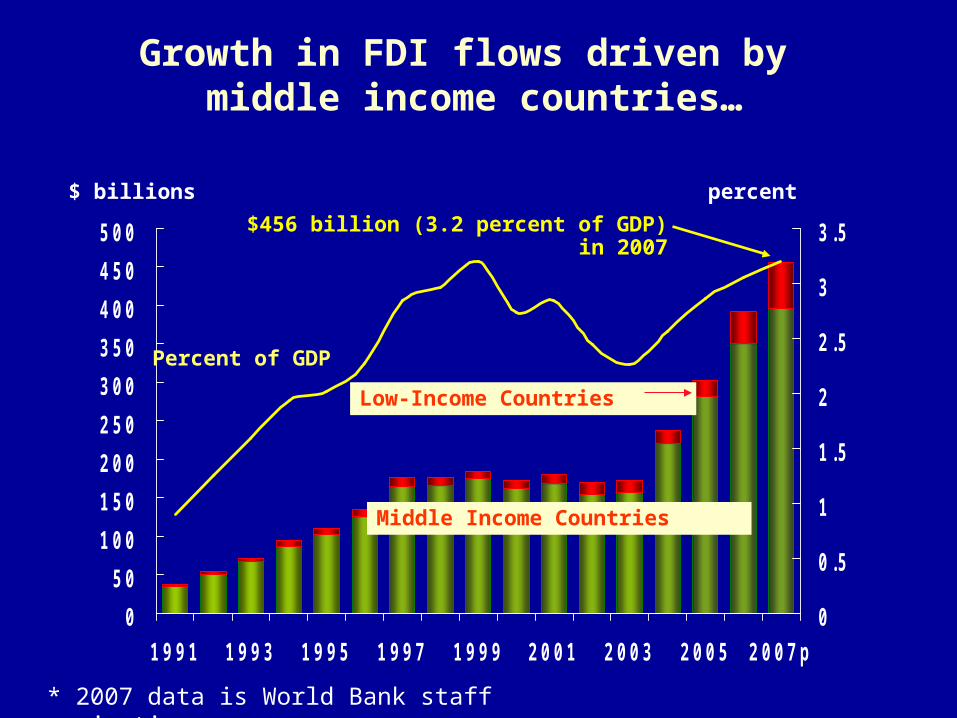
Growth in FDI flows driven by middle income countries…
0
5 0
1 0 0
1 5 0
2 0 0
2 5 0
3 0 0
3 5 0
4 0 0
4 5 0
5 0 0
1 9 9 1 1 9 9 3 1 9 9 5 1 9 9 7 1 9 9 9 2 0 0 1 2 0 0 3 2 0 0 5 2 0 0 7 p
0
0 . 5
1
1 . 5
2
2 . 5
3
3 . 5
$ billions percent
Percent of GDP
Middle Income Countries
Low-Income Countries
$456 billion (3.2 percent of GDP) in 2007
* 2007 data is World Bank staff projection
0
1 0 0
2 0 0
3 0 0
4 0 0
5 0 0
2 0 0 0 2 0 0 1 2 0 0 2 2 0 0 3 2 0 0 4 2 0 0 5 2 0 0 6 2 0 0 7 p
$ billions
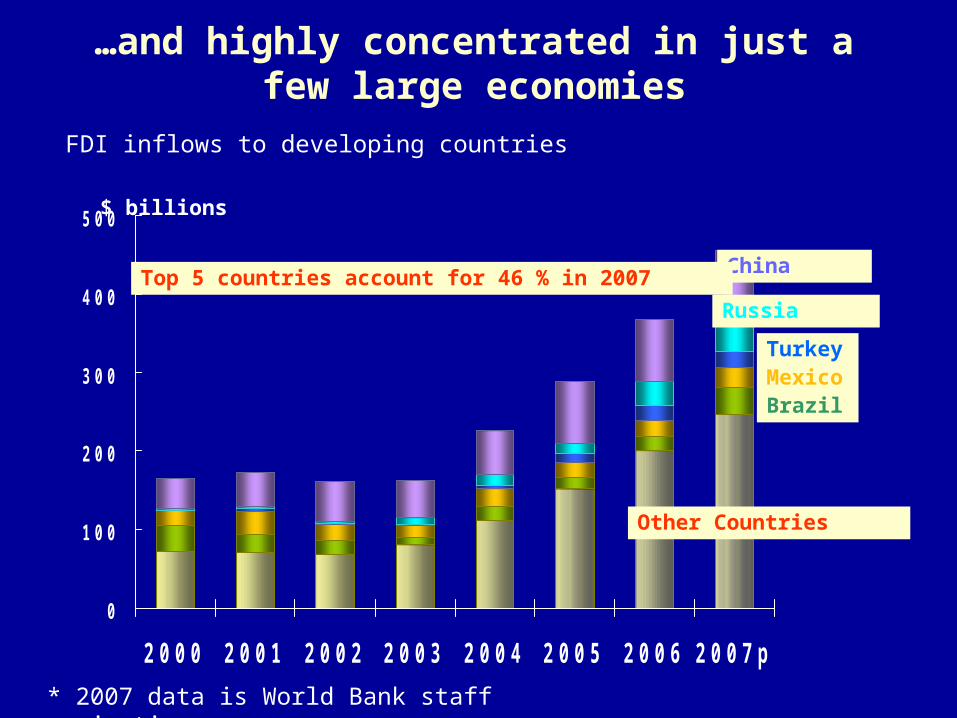
FDI inflows to developing countries
…and highly concentrated in just a few large economies
Other Countries
Russia
China
* 2007 data is World Bank staff projection
TurkeyMexic
o Brazil
Top 5 countries account for 46 % in 2007
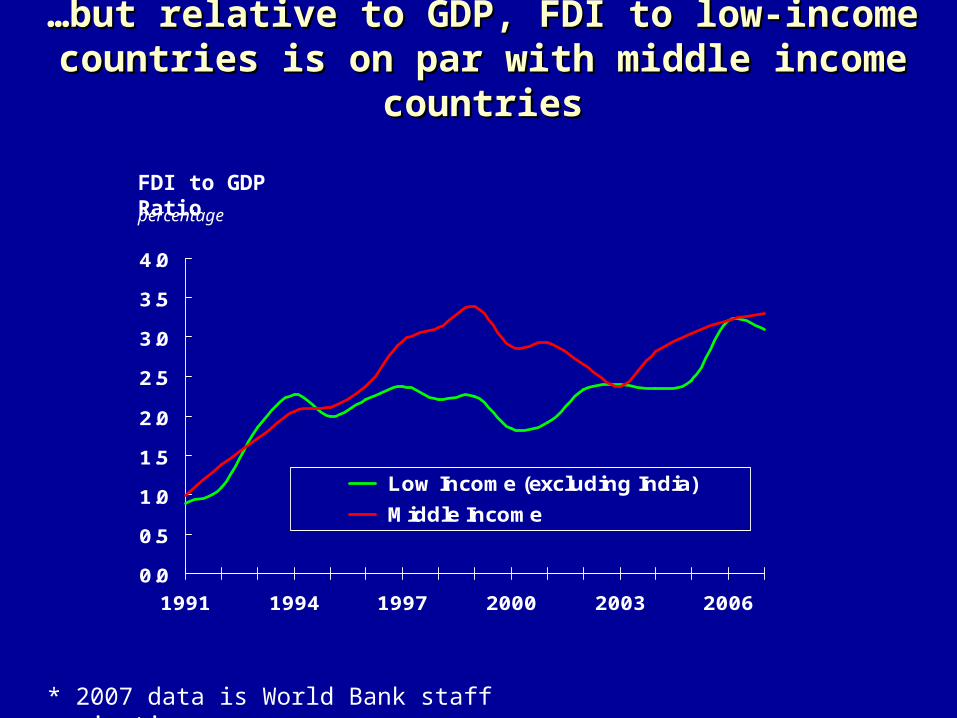
0.0
0.5
1.0
1.5
2.0
2.5
3.0
3.5
4.0
1991 1994 1997 2000 2003 2006
Low Income (excluding India)
Middle Income
percentage
FDI to GDP Ratio
……but relative to GDP, FDI to low-income but relative to GDP, FDI to low-income countries is on par with middle income countries is on par with middle income
countriescountries
* 2007 data is World Bank staff projection

FDI inflows are closely related to FDI inflows are closely related to income per capitaincome per capita
FDI per capita vs GDP per capita, 2001-06FDI per capita vs GDP per capita, 2001-06
y = 1.27x - 5.5
R2 = 0.69
-2
0
2
4
6
8
4 5 6 7 8 9 10
log(GDP per capita)
log(FDI per capita)China
Bolivia
Gambia
Azerbaijan
Equatorial Guinea
Zimbabwe
Iran
Venezuela
Oman
Chad
Romania
India
South Africa
MalawiRwanda
Central African Republic
Turkey
Congo, Dem. Rep.
Trinidad & Tobag
o
0
1 0
2 0
3 0
4 0
5 0
6 0
7 0
D e v e lo p in gC o u n t r ie s
A F R IC A L A C E C A E A P
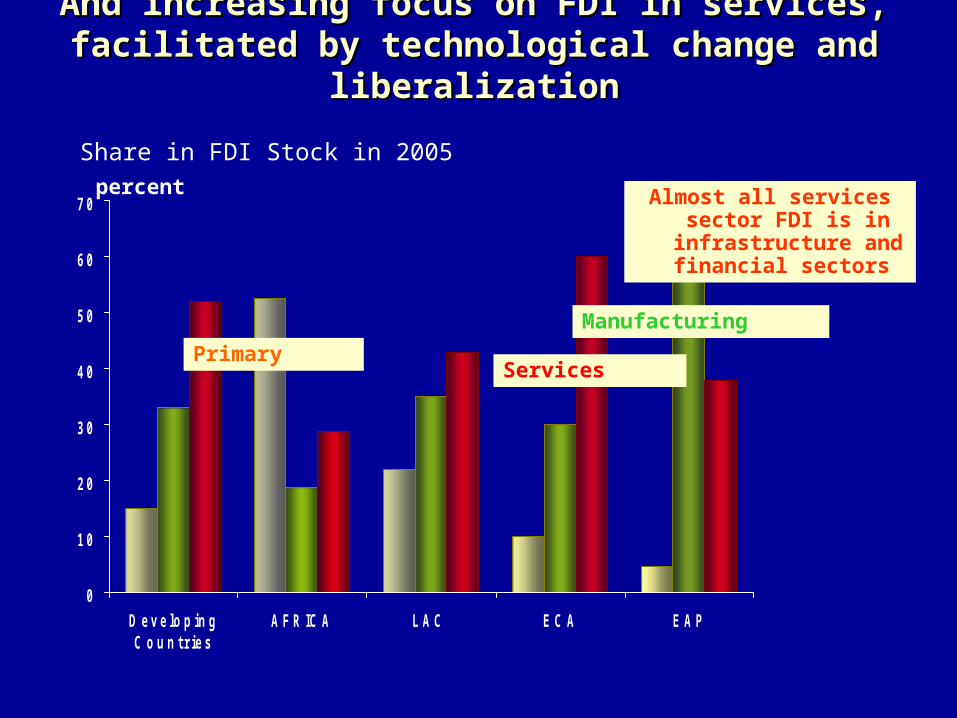
percent
Share in FDI Stock in 2005
And increasing focus on FDI in services, And increasing focus on FDI in services, facilitated by technological change and facilitated by technological change and
liberalizationliberalization
Services
Manufacturing
Primary
Almost all services sector FDI is in
infrastructure and financial sectors
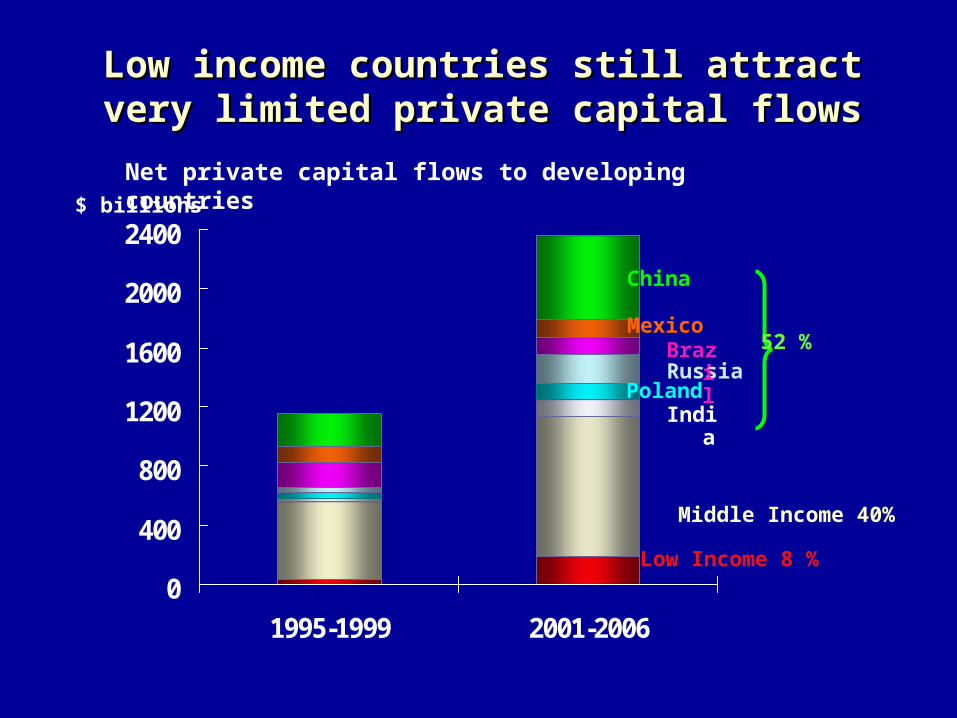
Low income countries still attract very Low income countries still attract very limited private capital flowslimited private capital flows
Russia
0
400
800
1200
1600
2000
2400
1995-1999 2001-2006
China
MexicoBraz
il
India
Middle Income 40%
Low Income 8 %
52 %
Net private capital flows to developing countries
Poland
$ billions
$ billions
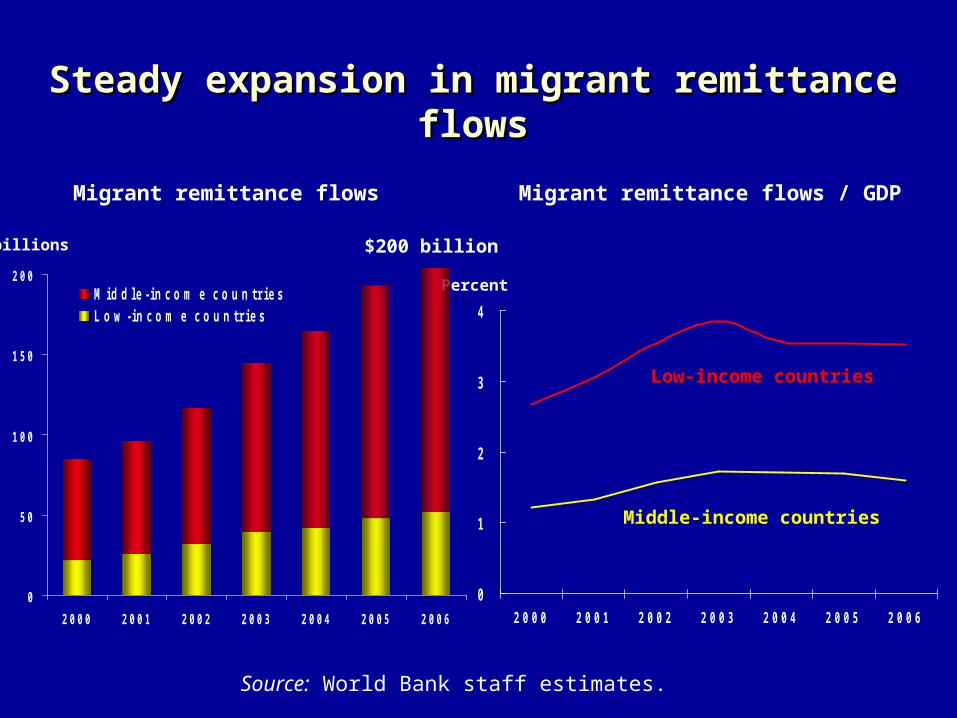
0
1
2
3
4
2 0 0 0 2 0 0 1 2 0 0 2 2 0 0 3 2 0 0 4 2 0 0 5 2 0 0 6
Percent
Migrant remittance flows Migrant remittance flows / GDP
Steady expansion in migrant remittance Steady expansion in migrant remittance flowsflows
0
5 0
1 0 0
1 5 0
2 0 0
2 0 0 0 2 0 0 1 2 0 0 2 2 0 0 3 2 0 0 4 2 0 0 5 2 0 0 6
M i d d l e - i n c o m e c o u n t r i e sL o w - i n c o m e c o u n t r i e s
Low-income countries
Middle-income countries
$200 billion
Source: World Bank staff estimates.
Summary and key issues
Private capital flows to developing countries have
been on a strong upward trend, supported by
domestic economic reforms and high growth
FDI continues to be the largest and most stable
capital flow with increasing focus on services
Private capital flows expected to decline somewhat
in the short term amid more moderate global
growth and tighter credit conditions
Global financial conditions have Global financial conditions have worsened noticeably worsened noticeably
Moderate slowdown in global growth
Tighter credit conditions
Large losses in major financial institutions
More stringent credit standards
* Impact of financial turmoil on emerging markets limited so far…

Private capital flows expected to ease…
$ billions
0
2 0 0
4 0 0
6 0 0
8 0 0
1 0 0 0
1 9 9 1 1 9 9 3 1 9 9 5 1 9 9 7 1 9 9 9 2 0 0 1 2 0 0 3 2 0 0 5 2 0 0 7 e 2 0 0 9 P
0
2
4
6
8
Net private capital flows to developing countries
Percent of GDP (right
axis)
Percent
Projected 2008-09
$998 billion in 2007 (7.3% of
GDP)
5.25%
3.5% of GDP average 1990-
02
……but long-term prospects for but long-term prospects for increased capital flows remain positiveincreased capital flows remain positive
Developing countries’ favorable Developing countries’ favorable demographic profilesdemographic profiles About 84% of world Population reside in About 84% of world Population reside in
developing worlddeveloping world
Scope for increasing investment and Scope for increasing investment and growth (Per capita investment $500 in growth (Per capita investment $500 in 2006, compared to $6000 in developed 2006, compared to $6000 in developed countries )countries ) Less than 5% of global bonds issued in recent Less than 5% of global bonds issued in recent
years originated in developing countries.years originated in developing countries.
Further room for integration in the world Further room for integration in the world economy economy