Mobile Report - Custorapages.custora.com/.../Custora_E-commerce_Pulse_Mobile_Report.pdf · ON HIS...
12
1 CUSTORA JULY 2014 BROWSING FOR SANDALS ON AN IPHONE APP. PRETENDING SHE’S A MAGICAL DOLPHIN. READING A SUMMER SALE EMAIL FROM J CREW. UPPING HIS EBAY BID FOR A GUITAR ON A KINDLE. JUST BOUGHT A NEW SOFA ON HIS MOBILE BROWSER. Mobile Report
Transcript of Mobile Report - Custorapages.custora.com/.../Custora_E-commerce_Pulse_Mobile_Report.pdf · ON HIS...

1CUSTORA
J ULY 201 4
B R O W S I N G F O R S A N D A L S O N A N I P H O N E A P P.
P R E T E N D I N G S H E ’ S A M A G I C A L D O L P H I N .
R E A D I N G A S U M M E R S A L E E M A I L F R O M J C R E W .
U P P I N G H I S E B A Y B I D F O R A G U I T A R O N A K I N D L E .
J U S T B O U G H T A N E W S O F A O N H I S M O B I L E B R O W S E R .
MobileReport

2CUSTORA
T H E E V I D E N C E surrounds us, whether it’s
commuters immersed in their tablet on the
subway, toddlers with Sesame Street apps, or
a shopper buying toilet paper on her phone to
save a little and avoid the hassle of carrying it
home. Mobile computing is doing everything
except slowing down.
And while these anecdotes add up to some-
thing meaningful on their own, we wanted to
further explore this mobile shift and learn how
it’s impacting the way people shop online.
We analyzed US e-commerce data from over
100 retailers, 70 million consumers and $10B
in transaction revenue (read more about our
methodology on page 12), and reached some
compelling findings:
Additionally, we interviewed a few marketing
professionals who work for online retailers
excelling in mobile e-commerce. These
mobile pros share insights and advice based
on their experiences from the front lines. We
also spoke with a group of online shoppers
for their perspectives on the current state of
mobile e-commerce.
1 . M O B I L E I S B O O M I N G
2 . E M A I L ? Y E S , S O C I A L ? N O
3 . A P P L E L E A D S , B U T . . .
4 . C R O S S - D E V I C E I S C O M I N G
B O N U S ! D O W N L O A D O U R D A T A
I N T R O - D U C T I O N
I N T E R V I E W K E Y
CUSTORA
ONLINE SHOPPER
E-COMMERCE MARKETER
Mobile e-commerce is now a $40 billion market,
up from $2 billion in 2010. More than a third of
visits to online stores now come from mobile
devices, up from just 3% in 2010. (pg. 3)
Email marketing does surprisingly well driving
purchases on phones and tablets; social media —
not so much. (pg. 7)
iPad reigns with 80% of tablet orders, but Samsung
and a little startup called “Amazon” are nibbling
away at the Apple with 12% and 4% and of orders
respectively as of March, 2014. (pg. 6)
Cross-device shopping isn’t quite here yet. As of
Q1 2014, 88% of customers only use one device
to make purchases. (pg. 8)
We’ve made the complete data sets for the
findings within this report available at
custora.com/mobiledata

3CUSTORA
We use the internet in different ways now than we did four
years ago. Mobile internet is faster, hardware is better, and
it’s common to use a phone or tablet frequently and in
more settings.
These shifts are reflected in e-commerce browsing: at the
start of 2010, only 3.4% of total visits to e-commerce sites
came from mobile devices (phones and tablets). Now, four
years later, 36.9% of site visits are from tablets and phones.
Mobile’s meteoric riseIn the past four years, the percentage of traffic to e-commerce sites from mobile devices (phones and tablets) jumped from 3% to nearly 37%.
SHARE (%) OF E-COMMERCE SITE VISITS BY DEVICE, 2010- Q1 2014
GROWTH
100%
50%
24.5%
4-year total growth 2010-2013 4-Year CAGR (Compound Annual Growth Rate) 2010-2013
Note: These estimates are based on US Department of Commerce figures for total US e-commerce revenue, 2010-2014, and Custora’s estimates for the share of mobile e-commerce. Read more about our methodology on page 12.
12.4%
63.1%
11.4%
17.6%
9.3%
10.6%
3.4% 5.4%0%
2010 2011 2012 2013 2014 Q1
DESKTOP
PHONE
TABLET
84.1%88.7% 73.1%96.6%
CUSTORA E-COMMERCE PULSE _ MOBILE REPORT
CUSTORA E-COMMERCE PULSE _ MOBILE REPORT DOWNLOAD
DOWNLOAD THIS DATA AT CUSTORA.COM/MOBILEDATA
In the past four years, the US mobile e-commerce market
grew 19-fold: From $2.2 billion in 2010 to $42.8 billion in
2013. 2014 is off to a strong start with $12.2 billion in
mobile e-commerce sales in Q1 alone; it’s likely that
mobile e-commerce will hit $50 billion in sales in 2014.
US mobile e-commerce is a $40 billion market
US MOBILE E-COMMERCE REVENUE
2010-2013 ($ BILLION)
$50
$2.2$12.2
$42.8
$21.2$7.9
$25
02010 2011 2012 2013 2014 (Q1)1875% 111%
4CUSTORA
VISITS
ORDERS
REVENUE
FENG CHANG
DIRECTOR BUSINESS STRATEGY &
ANALYTICS, KARMALOOP
CUSTORA
ANTHONY MARINO
CMO, THRED UP
VISHAL AGARWAL
EVP & CMO, NOMORERACK
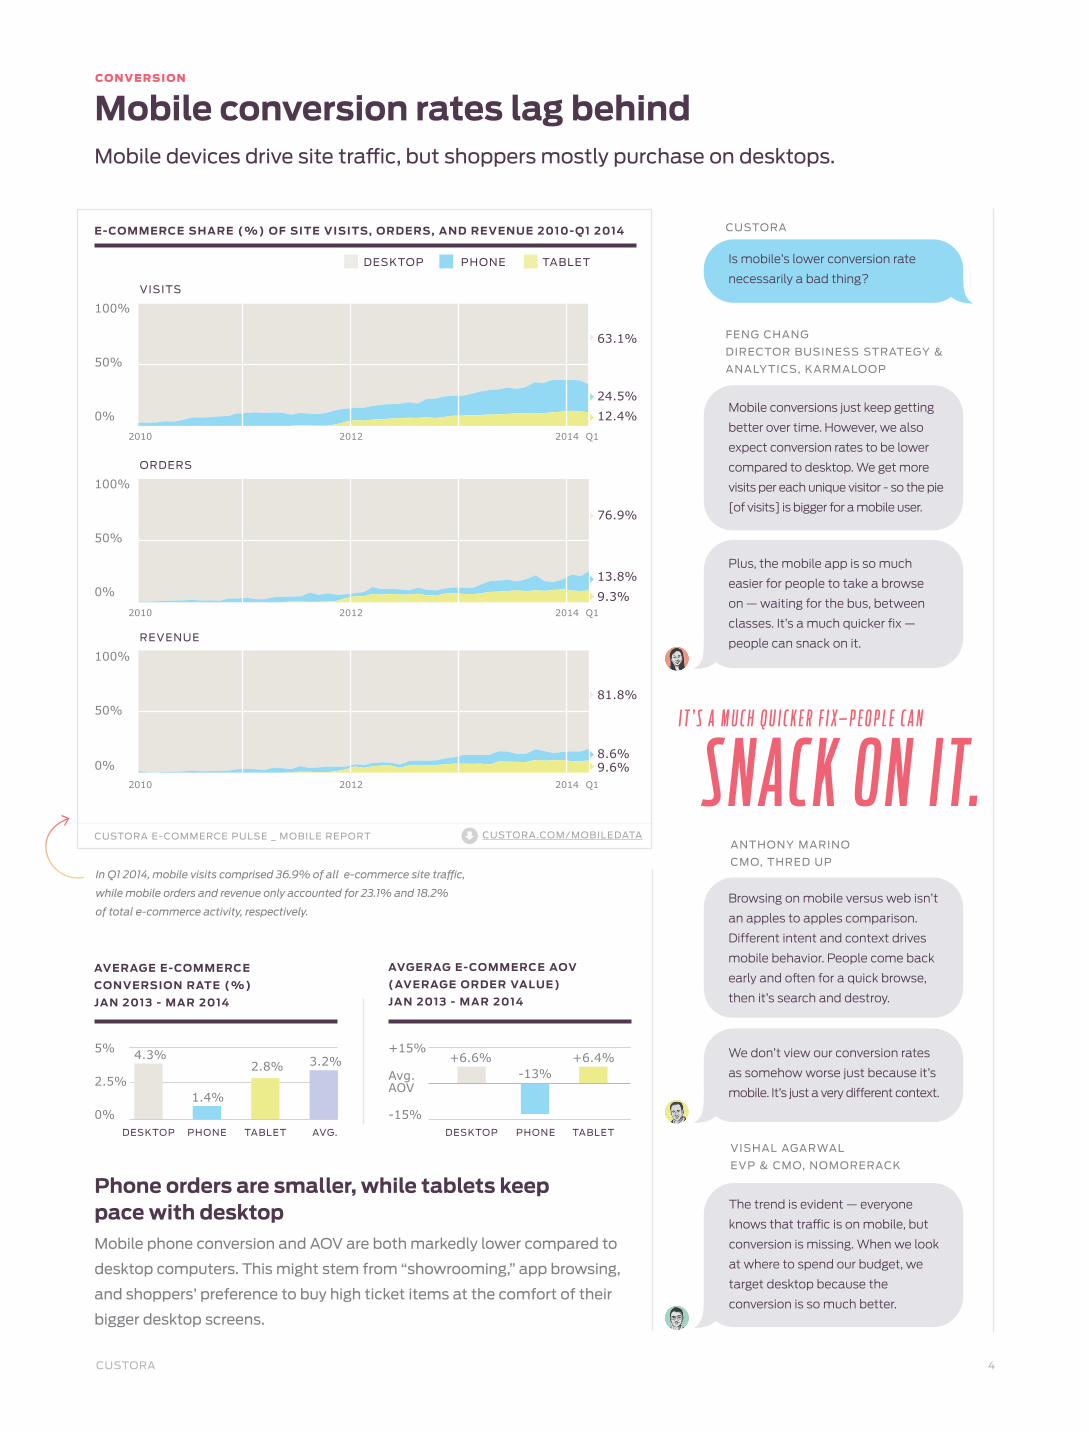
Mobile conversion rates lag behindMobile devices drive site traffic, but shoppers mostly purchase on desktops.
E-COMMERCE SHARE (%) OF SITE VISITS, ORDERS, AND REVENUE 2010-Q1 2014
In Q1 2014, mobile visits comprised 36.9% of all e-commerce site traffic,
while mobile orders and revenue only accounted for 23.1% and 18.2%
of total e-commerce activity, respectively.
Mobile phone conversion and AOV are both markedly lower compared to
desktop computers. This might stem from “showrooming,” app browsing,
and shoppers’ preference to buy high ticket items at the comfort of their
bigger desktop screens.
5% 4.3% 3.2%
1.4%
2.8%+15%
100%
100%
63.1%
76.9%
81.8%
24.5%
13.8%
8.6%
12.4%
9.3%
9.6%
100%
2.5% Avg.AOV
50%
50%
50%
0% -15%
0%
0%
0%
CONVERSION
Is mobile’s lower conversion rate
necessarily a bad thing?
Mobile conversions just keep getting
better over time. However, we also
expect conversion rates to be lower
compared to desktop. We get more
visits per each unique visitor - so the pie
[of visits] is bigger for a mobile user.
Browsing on mobile versus web isn’t
an apples to apples comparison.
Different intent and context drives
mobile behavior. People come back
early and often for a quick browse,
then it’s search and destroy.
We don’t view our conversion rates
as somehow worse just because it’s
mobile. It’s just a very different context.
The trend is evident — everyone
knows that traffic is on mobile, but
conversion is missing. When we look
at where to spend our budget, we
target desktop because the
conversion is so much better.
Plus, the mobile app is so much
easier for people to take a browse
on — waiting for the bus, between
classes. It’s a much quicker fix —
people can snack on it.
Phone orders are smaller, while tablets keep pace with desktop
2010
2010
2010
DESKTOP DESKTOP PHONE PHONETABLET TABLET AVG.
+6.6% +6.4%-13%
S N AC K O N I T.I T ’ S A M U C H Q U I C K E R F I X — P E O P L E C A N
CUSTORA E-COMMERCE PULSE _ MOBILE REPORT
AVERAGE E-COMMERCE
CONVERSION RATE (%)
JAN 2013 - MAR 2014
AVGERAG E-COMMERCE AOV
(AVERAGE ORDER VALUE)
JAN 2013 - MAR 2014
E-COMMERCE
AVG. AVERAGE ORDER VALUE (AOV)
COMPARISON 2013-Q1 2014
PHONEDESKTOP TABLET
CUSTORA.COM/MOBILEDATA
2012
2012
2012
2014 Q1
2014 Q1
2014 Q1

5CUSTORA
KHAI, AGE 27
BUSINESS DEVELOPMENT
NEW ORLEANS, LA
BEN, AGE 31
WEB DESIGNER
NEW YORK, NY
KAREN, AGE 52
RETIRED
MULLICA HILL, NJ
ERIK, AGE 46
DESIGNER
BOULDER, CO
NATASHA, AGE 32
SUSTAINABILITY CONSULTANT
BERKELEY, CA
How do you prefer to shop online?
Do you prefer shopping with
dedicated apps or in the broswer?
Do you ever shop online with your
phone? Why or why not?
Why?
I use my phone for price comparisons
when I’m in a brick and mortar store.
I’ll go to a lot of places knowing that it
will be cheaper online, but I just want
to see what it’s like in person.
Apps work better because the login
process on a mobile device is the
most frustrating part of the experi-
ence. If I can fire up the app, make
a quick purchase, without having to
login or input payment info I’ll do it.
I prefer to use my desktop computer
because of the big screen. If I am
buying something I bought before I
will use my tablet or phone because
I don’t need to see as much.
I usually don’t purchase from my
phone. For me it feels trivial and it
feels like I’m not being responsible
with my spending. Too spontaneous.
I’ve bought mainly clothing items on
my phone. Usually it’s something
I looked at on my laptop and was
trying to decide on, and then when
I’ve committed, purchased it.
Lack of familiarity with user inter-
face/company (I like to check out
reviews about the seller regarding
delivery, product returns, etc), and
I find it way easier to navigate that
information on my PC rather than
my phone.
However, my tablet is my at home
web browser and I do most of my
on-line shopping there. I’ve
purchased more things from my
tablet than I can remember.
And then there’s inputting personal
data into the system. I don’t want to
pull out my credit card on the train.
Once I’ve already purchased from
them [on a PC], it’s way easier to
purchase from them again.
I don’t think I’ve ever used my phone
to buy from a company I have never
purchased from before.
WORD ON THE STREET
What are shoppers saying about mobile commerce?
T H I N GS F R O M M Y TA B L E T R E M E M B E R.
M O R EI ’ V E P U R C H A S E D
T H A N I C A N
K
K
B N
N
E

6CUSTORA
GALAXY
NO
TE 2
iPhone and iPad dominate e-commerce. For now.
Apple’s mobile supremacy remains but continues to be challenged, most notably by Samsung and more recently, Amazon.
APPLE V. ALL
Over the last two years, Apple’s share of e-commerce
orders went down from 75.1% in January 2012 to 53.6% as of
March 2014. Samsung devices have more than quadrupled
their share of orders over the same time period — growing
from 6.9% in 2012 to 30.5% in 2014.
iPad still accounts for the biggest share of tablet
e-commerce orders, though share of orders made from
Samsung tablets increased substantially in the past year and
a half: from 1.9% in January 2012 to 12.4% as of March 2014.
Amazon has also quickly become a player, as purchases made
on Kindle Fire tablets account for 4.1% of all tablet orders.
SHARE (%) OF E-COMMERCE ORDERS BY BRAND, 2012-2014
PHONE
PHONE TABLET
TABLET
CUSTORA E-COMMERCE PULSE _ MOBILE REPORT
100%
100%
50%
50%
0%
0%2012
2012
SAMSUNG
SAMSUNG
APPLE
APPLE
OTHER
AMAZON GOOGLE OTHER
IPAD
MIN
I
IPAD
AIR
PRODUCT RELEASES
NEXU
S 7
KIND
LE
FIRE H
D
KIND
LE
FIRE H
DX
SURFACE 2
FIRE P
HO
NE
GALAXY S
4
NEXU
S 5
NEXU
S 4
GALAXY S
3
MO
TO X
IPH
ON
E 5
IPH
ON
E
5S,5C
SURFACE
30.5%
4.1%1.1%12.4%
15.9%
79.9%
2.5%
53.6%
WIN
DO
WS
PHO
NE 8
6.9%
1.9%
4.6%
93.6%
75.1%
18%
DOWNLOAD THIS DATA AT CUSTORA.COM/MOBILEDATA
2013 2014
2013 2014 Q1
Q1

7CUSTORA
Email marketing and direct traffic drive mobile purchases
Customers responding to email marketing and shoppers navigating directly to online stores (including app traffic) accounted for the highest share of purchases on phones.
MARKETING CHANNELS
When comparing the online marketing channels driving
purchases on mobile devices to those driving purchases on
desktop computers, the most notable differences are with
direct traffic, email marketing, and online search (both free/
organic and paid).
On mobile phones, email marketing generated 26.7% of
sales, compared to only 20.9% on desktop, and 23.1% on
tablet. This is a surprising data point considering the chal-
lenges of displaying email correctly on mobile devices, and
deep-linking into mobile apps.
Direct traffic also drove a larger share of purchases on mobile
phones, with a third (32.9%) of sales coming from shoppers
going straight to the source and bypassing search - organic
search drove 16% of phone sales compared to 23.5% of desktop
sales, and paid search (Search Engine Marketing / SEM) drove
13.35% of sales on phones, compared to 18% on desktop.
On tablets, however, paid search was the leading marketing
channel, driving 24.8% of sales. The difference between
SEM’s share of orders on different devices might stem from
many retailers not spending as much on mobile phone ads
and the phone’s small screen that displays a smaller number
of ads per search.
CATEGORY
AFFILIATE
PAID SEARCH (SEM)
DIRECT
DISPLAY
ORGANIC SEARCH
REFERRAL
SOCIAL
TOTAL
PHONE
0.6
13.35
32.9
0.35
26.7
16.0
9.5
0.6
100%
SHARE (%) OF CATEGORY
DESKTOP
1.15
18
21.3
1.15
20.9
23.5
13.7
0.3
100%
TABLET
1.3
24.8
22.5
0.4
23.1
15.4
12.3
0.2
100%
E-COMMERCE 2013
SHARE OF REVENUE BY CHANNEL AND PLATFORM
VISHAL
How does email marketing factor
into your mobile strategy?
We see a lot of the mobile clicks
coming from our daily emails – that
has driven traffic to the mobile web.
It’s been a very big contributor to our
mobile growth and success.
100% 100% 100%
CUSTORA E-COMMERCE PULSE _ MOBILE REPORT
I T ’ S M O R E I M PU L S I V E —W I T H M O B I L E
Y O U ’ R E O N T H E G O Y O U G E T A N E M A I L
A N D Y O U C L I C K A N D Y O U B U Y O R D O N ’ T B U Y.- V I S H A L

8CUSTORA
Cross-device shopping is coming
Only 12% of shoppers make purchases on more than one device type - but this segment is growing quickly
DESKTOP V. MOBILE
Despite the buzz around cross-device shopping and the idea that differ-
ent commerce experiences are converging, shoppers remain committed
to purchasing on just one particular device. As of Q1 2014, just 12% of
customers make purchases on more than one device type, and 76% of
customers make purchases using only their desktop.
However, these figures represent significant growth — at the
beginning of 2012, only 4% of shoppers had made purchases on more
than one device type.
FENG
What’s your current take on
cross-device shopping?
Everyone talks about it but the
data’s not there right now. There
needs to be more backend data
integration on the customer level.
We’re still looking to marry data
across mobile, desktop, and app.
There aren’t many companies that
can connect all the dots.
If we had clear data, we’d want to
know “Netta likes to be on her phone
in the evening, but checks the web
mid-day at work.” Then target her
based on her device and personalize.
For example, we’d send a push
notification in the evening, when
they’re on their phone, and then with
dynamic retargeting, retarget them
on the tablet at night.
A customer will shop on multiple
channels if they’re comfortable on
the site — the chances of someone
coming in from mobile and immedi-
ately purchasing is pretty small.
But first we’ll have to know they are
indeed that person and it’s really
hard to follow a particular customer
across platforms.
T H E DATA’ S N OT T H E R E R I G H T N OW.
E V E R Y O N E T A L K S A B O U T I T B U T
Another take on cross-device shopping
Many of the shoppers we interviewed feel more
comfortable making the first purchase with a
retailer on a desktop computer. Once trust has been
established after the first successful transaction,
they are more willing to make repeat purchases on
a mobile device. Maybe this is an early indicator of
more distributed purchasing across devices.
VISHAL
If someone has bought on desktop
they’re much more likely to convert
from mobile in the future. After a
desktop purchase, when you receive
an email on tablet or mobile you’re
much more likely to click and buy.
9CUSTORA
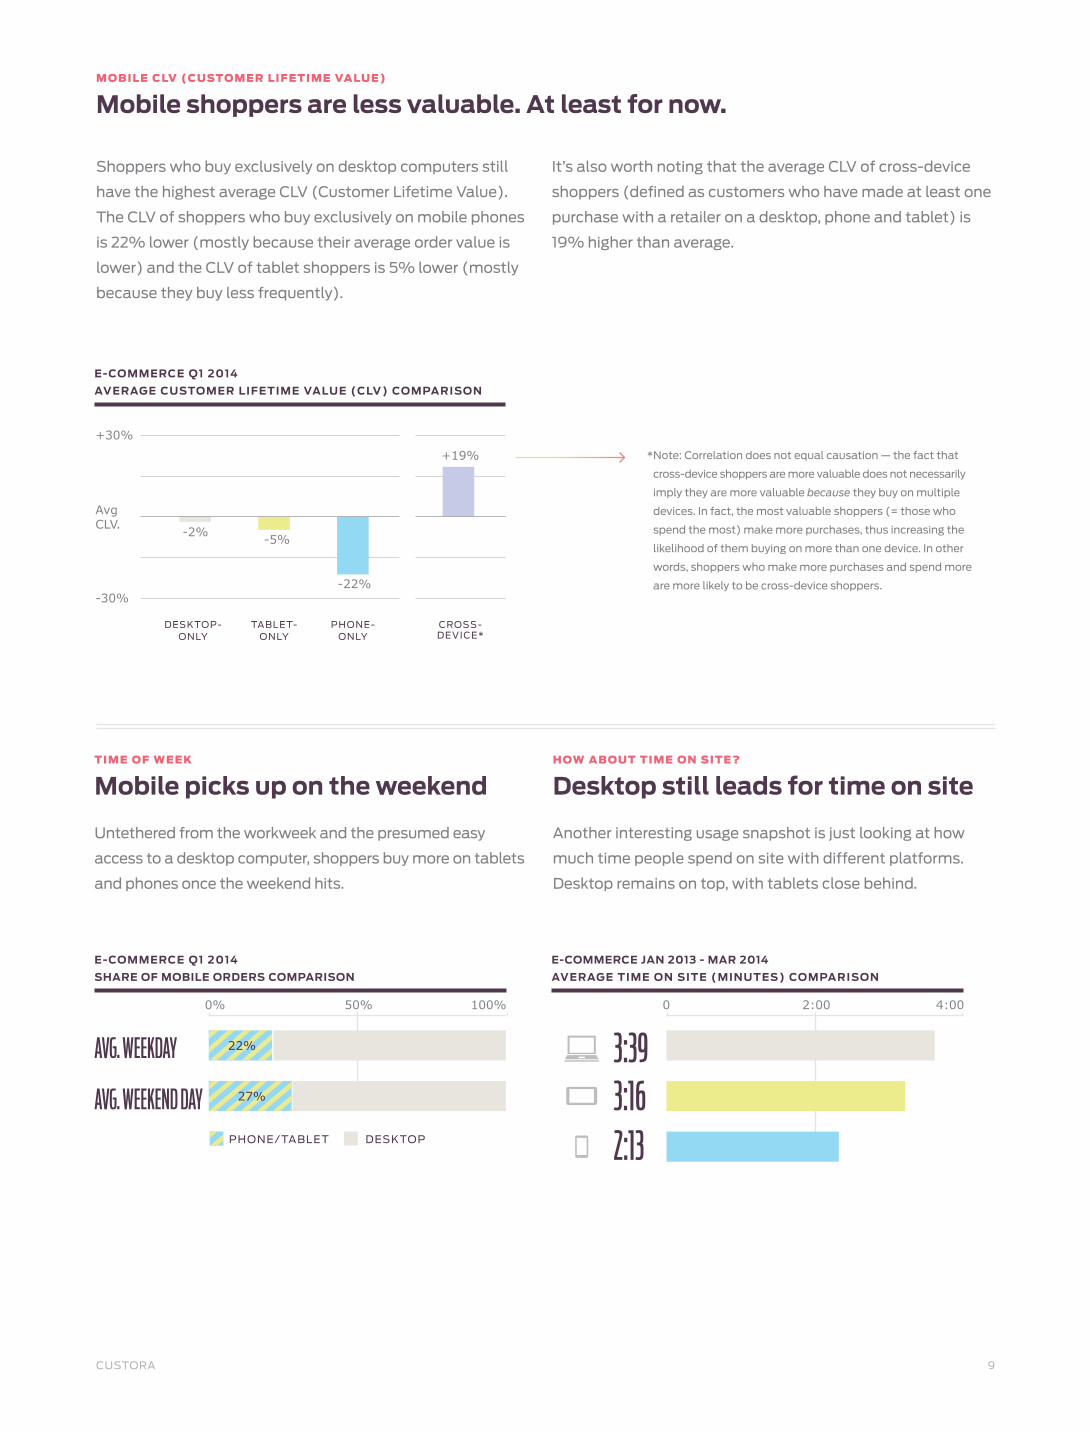
Mobile picks up on the weekend Desktop still leads for time on siteTIME OF WEEK HOW ABOUT TIME ON SITE?
2:13
3:39AVG. WEEKDAY
3:16AVG. WEEKEND DAY
00% 2:0050% 4:00100%
Untethered from the workweek and the presumed easy
access to a desktop computer, shoppers buy more on tablets
and phones once the weekend hits.
Another interesting usage snapshot is just looking at how
much time people spend on site with different platforms.
Desktop remains on top, with tablets close behind.
E-COMMERCE Q1 2014
SHARE OF MOBILE ORDERS COMPARISON
E-COMMERCE Q1 2014
AVERAGE CUSTOMER LIFETIME VALUE (CLV) COMPARISON
E-COMMERCE JAN 2013 - MAR 2014
AVERAGE TIME ON SITE (MINUTES) COMPARISON
22%
27%
DESKTOPPHONE/TABLET
Mobile shoppers are less valuable. At least for now.MOBILE CLV (CUSTOMER LIFETIME VALUE)
Shoppers who buy exclusively on desktop computers still
have the highest average CLV (Customer Lifetime Value).
The CLV of shoppers who buy exclusively on mobile phones
is 22% lower (mostly because their average order value is
lower) and the CLV of tablet shoppers is 5% lower (mostly
because they buy less frequently).
It’s also worth noting that the average CLV of cross-device
shoppers (defined as customers who have made at least one
purchase with a retailer on a desktop, phone and tablet) is
19% higher than average.
* Note: Correlation does not equal causation — the fact that
cross-device shoppers are more valuable does not necessarily
imply they are more valuable because they buy on multiple
devices. In fact, the most valuable shoppers (= those who
spend the most) make more purchases, thus increasing the
likelihood of them buying on more than one device. In other
words, shoppers who make more purchases and spend more
are more likely to be cross-device shoppers.
+30%
Avg CLV.
-30%
DESKTOP- ONLY
TABLET- ONLY
PHONE- ONLY
CROSS- DEVICE*
-5%
+19%
-2%
-22%

10CUSTORA
Advice for e-commerce retailers LOOKING AHEAD
Custora interviewed
marketers from
Nomorerack, Karmaloop,
and thredUp to collect
additional insights and
guiding principles geared
towards retailers looking to
get started with, expand,
or optimize mobile
e-commerce.
ANTHONY
ANTHONY
ANTHONY
VISHAL
FENG
VISHAL
FENG
FENG
What advice would you share with
marketers just getting started with
mobile commerce?
What’s your take: App? Mobile-only
site? Responsive design?
How do you measure success?
You just have to start. You have to
build your first product, get it into the
market, observe your users, look at
the data and then make fast changes.
Get to the core of what you want your
user to do, and then build to that. If it
doesn’t work, then rebuild. We just want to be where our users
are, which is on a range of platforms
for a range of user contexts. We add
thousands of new items every minute
to thredUP, and there are powerful
ways to showcase that unique part of
our offering on mobile.
We definitely measure Custora
metrics like CLV (customer lifetime
value), along with visits, average
order sizes (AOV), app downloads,
engagement metrics and how
those metrics change over time.
I wish I had known how important
the mobile site is. We did the
fancy route first with an iPhone
app. But for that, you have to drive
to installs. We found the day we
launched the mobile site our traffic
numbers jumped and you don’t
have to make any extra effort to
drive that traffic.
You need foresight into the under-
standing of “why we need to be here.”
For us, our core demographic is very
active on mobile and the market is
abundant with shopping apps. We
want our customer experience to be
seamless across platforms, whether
that’s mobile web, responsive, or
native apps.
Still, you need to really think to
yourself “What’s the value of a
mobile app? Why do we need an
app?” Then you need to give users
a reason to go to the app beyond
just shopping. It’s a very competitive
landscape.
Conversion is all that we judge —
we just look at dollars we spend
on a channel (in this case, mobile)
versus dollars customers spend on
that channel.
We primarily track sales and ROI in
the mobile channel.
Many people talk about “mobile
web,” “tablet app,” and others, but for
us the primary one is the mobile app.
CO N V E R S I O N I S A L LT H A T W E J U D G E
ANTHONY MARINO
CMO, THRED UP
FENG CHANG
DIRECTOR BUSINESS STRATEGY
& ANALYTICS, KARMALOOP
VISHAL AGARWAL
EVP & CMO, NOMORERACK
ILLUSTRATIONS BY SHYAMA GOLDEN

11CUSTORA
FENG
VISHAL
ANTHONY
FENG
ANTHONY
What has driven mobile wins? What’s next?
We have created mobile exclusive
sales events and products. We
incentivize shoppers to go to the
app because we looked at the data
and realized these shoppers and
sales are more valuable for us: both
for profitability and customer loyalty.
It’s common sense and the data
confirmed it.
It’s possible the sheer volume of
mobile traffic may overtake desktop
traffic so significantly that it could
negate the fact that conversions
are lower. This would make us
reevaluate our strategy and maybe
change our mobile offering.
We also constantly test and
optimize our mobile offerings and
have made big improvements on
conversion and engagement.
We are also looking into dynamic
retargeting, just like desktop –
desktop retention strategies are a
growing part of the mobile
marketing mix.
VISHAL
As of now we have mostly ridden
a wave. We haven’t tried to divert
customers to mobile; the strategy
has been to provide them a place to
interact organically.
Conversion has been so low we’d
rather focus our energy on desktop.
Advice for e-commerce retailers cont’d
We use it as a testing ground for
new features because it’s a smaller,
more engaged population.
Our goal is to continue optimizing
the mobile channel through
improving retention. We’ve also
started segmenting our push
notifications.
We want to understand channel
attribution across platform — track
at a user level what are they doing to
understand how they are interacting
across platforms.
W E US E I T A S A T EST I N G G R O U N D
F O R N E W F E A T U R E S
LOOKING AHEAD

12CUSTORA
The report’s findings are derived from data spanning over 70 million
anonymized shoppers, $10B in e-commerce revenue, and over 100
online retailers.
Mobile device, brand, and platform were obtained via the
deviceCategory, mobileDeviceBranding, and operatingSystem tags
in Google Analytics, respectively.
Desktop, mobile, and tablet users were defined as users who made
at least two orders and all of those orders were done with that
device. Cross-device users were defined as non-desktop, non-
mobile, and non-tablet users who made at least two orders. Conver-
sion rate is defined as number of orders divided by number of visits.
Customer Lifetime Value refers to the amount customers spent in
the two years after their initial purchase (initial purchase inclusive).
When customers made their first purchase less than two years prior
to data collection, their expected purchases for the remaining time
were projected using Custora’s statistical models and used in the
overall calculation. For marketing channel analysis, channel attri-
bution was set by each retailer; all retailers included in this report
used “last click” attribution.
Download the
complete data sets
for the findings
within this report at
custora.com/mobiledata
M E T H O D - O L O G Y
The Custora E-Commerce Pulse tracks key US e-commerce sta-
tistics and allows any retailer to benchmark their data in real time.
The Pulse is based on Custora’s analysis of over 70 million online
shoppers and over $10 billion in e-commerce revenue across over
100 US-based online retailers. The Pulse also leverages external
data points, such as the US Department of Commerce e-commerce
growth figures, to extrapolate growth trends within the Custora
data universe to arrive at predictions for the US industry at large.
Pulse research has been featured in The Wall Street Journal, USA
Today, Inc., Los Angeles Times, Bloomberg TV, McKinsey Insights,
AdAge, eMarketer, San Francisco Chronicle, and many other publica-
tions. Pulse data is part of the Bloomberg Professional® Platform.
A B O U T T H E P U L S E
Custora is a customer-centric marketing platform that helps
e-commerce teams acquire, retain, and segment their customers.
Custora uses best-in-class predictive analytics models to help
retailers answer questions like: What are our best performing
customer acquisition channels? How do we convert more members
to active customers? How do we increase repeat purchase rates?
How do we re-activate lost customers? What makes our most
valuable customers different? Where did I park the car?
We work with several leading e-commerce retailers, including Ann
Taylor LOFT, Bonobos, Crocs, Etsy, GUESS, Wine.com and many
more throughout Earth. To learn more about e-commerce marketing
analytics, check out Custora U for courses about segmentation,
lifecycle marketing, cohort analysis and more. Please direct inquires
A B O U T C U S T O R A
.XLS
R E Q U E S T A D E M O O F C U S T O R A
S I G N U P F O R P U L S E U P D AT E S