
MLaaS Applications in Digital Video – Supplanting Disliked ...
13
© 2020 SCTE•ISBE and NCTA. All rights reserved. 1 MLaaS Applications in Digital Video – Supplanting Disliked Content A Technical Paper prepared for SCTE•ISBE by Srilal Weerasinghe PhD Principal Engineer Charter Communications 8560 Upland Drive, Englewood, CO 80112-7138 720-699-5079 [email protected]
Transcript of MLaaS Applications in Digital Video – Supplanting Disliked ...

© 2020 SCTE•ISBE and NCTA. All rights reserved. 1
MLaaS Applications in Digital Video –
Supplanting Disliked Content
A Technical Paper prepared for SCTE•ISBE by
Srilal Weerasinghe PhD Principal Engineer
Charter Communications 8560 Upland Drive, Englewood, CO 80112-7138
720-699-5079 [email protected]

© 2020 SCTE•ISBE and NCTA. All rights reserved. 2
Table of Contents Title Page Number Introduction ............................................................................................................................................. 3
Content ................................................................................................................................................... 3 1. Machine Learning Applications in Digital Video ............................................................................... 3 2. Recommender Systems ................................................................................................................. 4
2.1. Matrix Factorization ........................................................................................................... 4 2.2. Singular Value Decomposition (SVD) ................................................................................. 5
3. Supplanting Unappealing TV Programs .......................................................................................... 7 3.1. Alternate Content Usage.................................................................................................... 7 3.2. Content Replacement – Process Steps .............................................................................. 8
4. Replacing Disliked Content – ML Automation ................................................................................. 9 4.1. Challenges in Applying Recommender Systems to Disliked content ................................... 9 4.2. Implicit Identification of Disliked content ............................................................................. 9 4.3. Data Rescaling ................................................................................................................ 10 4.4. Enhancements to Recommender Systems....................................................................... 10
5. Machine Learning in Digital Video – Additional Examples ............................................................. 11 5.1. Enhanced Rating System for Movies ............................................................................... 11 5.2. Video Content Analysis - VOD Storage and Ingest ........................................................... 11 5.3. Personalized Ads - Combine Demographic and Viewing data .......................................... 12 5.4. Codec Quantization Parameter (QP) settings ................................................................... 12
6. Benefits to Service Providers and Programmers ........................................................................... 12 Conclusion ............................................................................................................................................ 12
Abbreviations......................................................................................................................................... 13
Acknowledgements ............................................................................................................................... 13
Bibliography & References .................................................................................................................... 13
List of Figures
Title Page Number Figure 1 – Cosine Similarity between multi-dimensional vectors ............................................................... 4 Figure 2 – User-Item Rating Matrix .......................................................................................................... 5 Figure 3 – Matrix Factorization ................................................................................................................. 5 Figure 4 – SVD Decomposition ................................................................................................................ 6 Figure 5 – SVD Decomposition in Elements Form .................................................................................... 6 Figure 6 – Process Flow for Alt Content Usage in Program Replacement ................................................. 8 Figure 7 – Disliked Content Usage to Enhance Consumer Profile .......................................................... 11
List of Tables Title Page Number Table 1 – Alt Content Examples (names slightly changed) ....................................................................... 7 Table 2 – Disliked Content Rescaling ..................................................................................................... 10

© 2020 SCTE•ISBE and NCTA. All rights reserved. 3
Introduction Machine Learning as a service (MLaaS) is a burgeoning field in the digital TV space. Its goal is to create AI/ML based revenue generating products. In this study, a novel use case is presented along with machine learning based enhancements. TV viewers routinely encounter shows that they dislike, but they are unable to avoid seeing them. While the consumer opinions are highly subjective, the end-result is the same: flipping the channel, which leads to advertising revenue loss for the programmer. Although retaining viewership of the channel is highly desired, technical challenges have precluded a satisfactory solution thus far.
The selected use case is of interest because unappealing content and recommendations contrast each other (dissuade vs. persuade). This distinction also manifests in the solution structure. For example, Recommender Systems (RS) are based on user ratings of liked content. In contrast, ‘disliked content’ may be so averse to a viewer thus it is not even rated. Not having user ratings is a barrier for applying the RS model, which uses similarity measures in the latent space to determine affinity. Hence, in this study a different metric based on implicit data is used for feature vector creation. The goal is to illustrate the challenges and opportunities in developing MLaaS products for carrier-grade video.
Presented is a distributed solution* applicable to vMVPD service. Enhancements to IP content delivery pipeline and Machine learning based automation are key for replacing disliked content. Additional scopes for MLaaS applications are also discussed. *patent filing (16/167,766)
Content 1. Machine Learning Applications in Digital Video Machine Learning applications in the video delivery pipeline are ubiquitous. From content ingest to transmission to delivery, opportunities abound for applying algorithmic solutions. These would typically include ingest quality control, network and storage optimizing and a host of data analytics applications upon content delivery. For example, the manual scanning of thousands of TV ads at ingest can be automated with a classification engine [1]. Additional applications in operational and product improvement are discussed later.
Such applications in cable-tech however are internal to the enterprise. The premise of this paper is to make the case that the technology is ripe for the next stage of ML revolution. Known as MLaaS or Machine Learning as a Service, it is modeled similar to other ‘as a service’ paradigms such as SaaS and PaaS. Familiar examples are web-based emails and cloud DVR services. MLaaS goes a step further and facilitates machine learning based consumer technology applications. As an enabling technology it can create machine learning based revenue generating services for the cable operators.
In the ensuing sections we delve deeper into the problem. First, we review the functioning of general recommender systems. Then, to illustrate MLaaS, a novel application is presented along with machine learning enhancements. The selected use case is advertising revenue loss due to channel surfing. The recommender systems algorithms are applied with certain caveats. Finally, other MLaaS applications are briefly discussed.
© 2020 SCTE•ISBE and NCTA. All rights reserved. 4
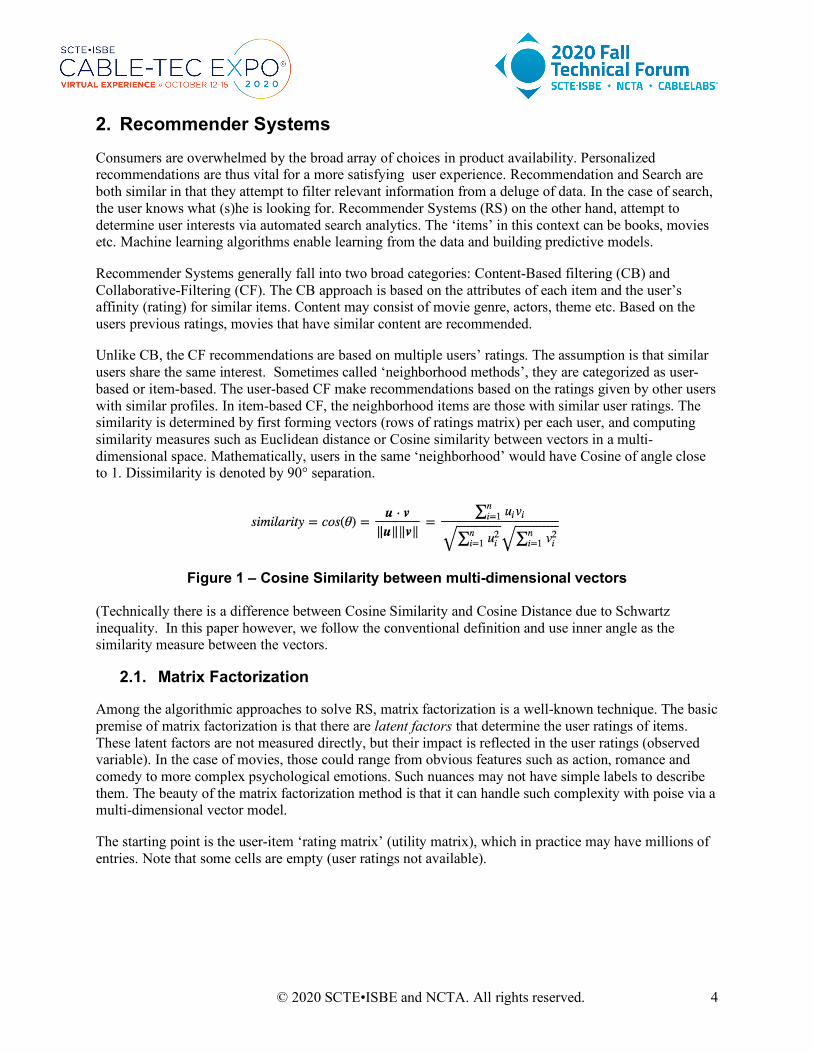
2. Recommender Systems Consumers are overwhelmed by the broad array of choices in product availability. Personalized recommendations are thus vital for a more satisfying user experience. Recommendation and Search are both similar in that they attempt to filter relevant information from a deluge of data. In the case of search, the user knows what (s)he is looking for. Recommender Systems (RS) on the other hand, attempt to determine user interests via automated search analytics. The ‘items’ in this context can be books, movies etc. Machine learning algorithms enable learning from the data and building predictive models.
Recommender Systems generally fall into two broad categories: Content-Based filtering (CB) and Collaborative-Filtering (CF). The CB approach is based on the attributes of each item and the user’s affinity (rating) for similar items. Content may consist of movie genre, actors, theme etc. Based on the users previous ratings, movies that have similar content are recommended.
Unlike CB, the CF recommendations are based on multiple users’ ratings. The assumption is that similar users share the same interest. Sometimes called ‘neighborhood methods’, they are categorized as user-based or item-based. The user-based CF make recommendations based on the ratings given by other users with similar profiles. In item-based CF, the neighborhood items are those with similar user ratings. The similarity is determined by first forming vectors (rows of ratings matrix) per each user, and computing similarity measures such as Euclidean distance or Cosine similarity between vectors in a multi-dimensional space. Mathematically, users in the same ‘neighborhood’ would have Cosine of angle close to 1. Dissimilarity is denoted by 90° separation.
Figure 1 – Cosine Similarity between multi-dimensional vectors
(Technically there is a difference between Cosine Similarity and Cosine Distance due to Schwartz inequality. In this paper however, we follow the conventional definition and use inner angle as the similarity measure between the vectors.
2.1. Matrix Factorization
Among the algorithmic approaches to solve RS, matrix factorization is a well-known technique. The basic premise of matrix factorization is that there are latent factors that determine the user ratings of items. These latent factors are not measured directly, but their impact is reflected in the user ratings (observed variable). In the case of movies, those could range from obvious features such as action, romance and comedy to more complex psychological emotions. Such nuances may not have simple labels to describe them. The beauty of the matrix factorization method is that it can handle such complexity with poise via a multi-dimensional vector model.
The starting point is the user-item ‘rating matrix’ (utility matrix), which in practice may have millions of entries. Note that some cells are empty (user ratings not available).

© 2020 SCTE•ISBE and NCTA. All rights reserved. 5
Movie 1 Movie 2 Movie 3 . . . . . Movie n User 1 5 N/A 2 3 User 2 1 3 N/A N/A User 3 N/A 4 1 4 . . . . . . . . . .
User m N/A 4 1 N/A
Figure 2 – User-Item Rating Matrix
Matrix factorization decomposes the user ratings matrix based on latent factors that contribute to user preferences and item attributes. It then predicts the unknown ratings through the scalar/inner/dot product of the latent features of users and items.
For example, if Bob is an action movie aficionado, his profile may consist of: Bob = 60% Action + 30% Comedy + 10% Romance+ 0% Historical Similarly, the profile for movie could be: Titanic = 30% Action + 0% Comedy + 60% Romance + 10% Historical
The dot product of these vectors would determine Bob’s affinity for the movie Titanic. The larger the dot product between a user vector and an item vector, the item is better suited for user’s taste and can be recommended.
The rating matrix of Figure 2 has many empty cells (sparse), as only a fraction of movies are watched by users, let alone rated. The goal of recommender system is to fill these gaps. In Figure 3, the sparse matrix is expressed in terms of two latent factor matrices (one for user and the other for item attributes). The missing values are approximated by the dot product of the two latent factor matrices via optimization.
Figure 3 – Matrix Factorization
2.2. Singular Value Decomposition (SVD)
A prominent technique for matrix factorization is singular value decomposition. The SVD algorithm received wide recognition for its critical role in the $1 million Netflix prize competition [2]. The singular value decomposition (SVD) factorizes a given matrix ‘X’ into constituent arrays of feature vectors.

© 2020 SCTE•ISBE and NCTA. All rights reserved. 6
Figure 4 – SVD Decomposition
A = UΣVT
- A is the given data matrix (m x n) of rank r - U is an orthonormal m x r matrix - Σ is a diagonal r x r matrix - V is an orthonormal n x r matrix
The diagonal matrix ‘Σ’ contains the singular values in descending order. The higher values represent the dominant features or latent factors of the given matrix. We consider the reduced form with small Sigma values set to zero as shown in the Figure 4.
Collaborative filtering (CF) based recommender systems perform poorly when dimensions in data increases (sometimes called ‘curse of dimensionality’). Reducing the extra dimensions while keeping the salient features is the function of a dimensionality reduction algorithm. SVD filters the dominant features from the data (Sigma matrix) and identify hidden correlations in the singular vectors U and VT.
SVD helps find a lower rank matrix approximation to the original matrix. Mathematically this means picking only the top singular values from the sigma matrix and discarding others. Each singular value defines the ‘strength’ of the concept. e.g. a high value may indicate the genre of the movie cluster such as action or comedy.
Figure 5 – SVD Decomposition in Elements Form
An alternate way to perform matrix factorization is to calculate eigenvalues of the covariance matrix (ATA). Both approaches are consistent in that the square roots of eigenvalues are equal to singular values. The Eigen vectors of the covariance matrix indicate ‘principal components’ of the matrix. Eigen method (sometimes called spectral decomposition), is computationally more involved, hence in this paper we explore SVD.

© 2020 SCTE•ISBE and NCTA. All rights reserved. 7
As mentioned, the main challenge with the matrix factorization methods is that the rating matrix is mostly sparse. This problem is addressed by iteratively calculating each cell value and updating them (using Gradient Descent and Alternate Least Square techniques). The error is minimized by applying Frobenius norm to data matrices. These steps are well-known in the literature and as such not discussed further.
We revisit the recommender systems in Section 4, in reference to disliked content.
3. Supplanting Unappealing TV Programs In this section we change gears and review the technical aspects of the selected use case. Then, the machine learning enhancements are discussed for creating an MLaaS product.
Almost all TV viewers have their favorite shows, as well as the ones they dislike. The latter (unappealing content) is the focus of this study. When confronted with disliked content the normal user behavior is to flip the channel, which leads to advertising revenue loss for the programmer. IP based digital TV streaming has made it possible to supply alternate content on per user basis.
While IP streaming offers such capability, the requirements cannot be met by changing just one end of the content stream. The contractual obligations between Programmer and Content Distributer must remain intact as well. A distributed solution is presented, requiring enhancements on multiple components: Alternate content is supplied by the programmer, assembled and stored at the Content Distributor. The disliked content is replaced automatically.
3.1. Alternate Content Usage
A customer identifies a TV program/show/series that is unappealing to her, and would prefer to have it replaced with alternate content. Her choices can be supplied via a web portal/API or a clickable icon added to the TV Guide. The Content Provider establishes Alternate content channels for selected regular channels. The Alternate content could be programs that aired earlier in the day and stored in the CDN. Once the setup is complete, whenever the consumer tunes to an unappealing program content, it will trigger content replacement automatically and seamlessly. In this context, ‘tuned to the channel’ could also mean accessing a web page, such as in a social-media based network.
Table 1 – Alt Content Examples (names slightly changed) Supplanting a Program by Alt Content (Traveler Channel)
Original Program Alt content-1 Alt content-2 Alt content-3 Ghoul Adventures Bizarre Feasts Museum Mysteries Nay Reservations
© 2020 SCTE•ISBE and NCTA. All rights reserved. 8
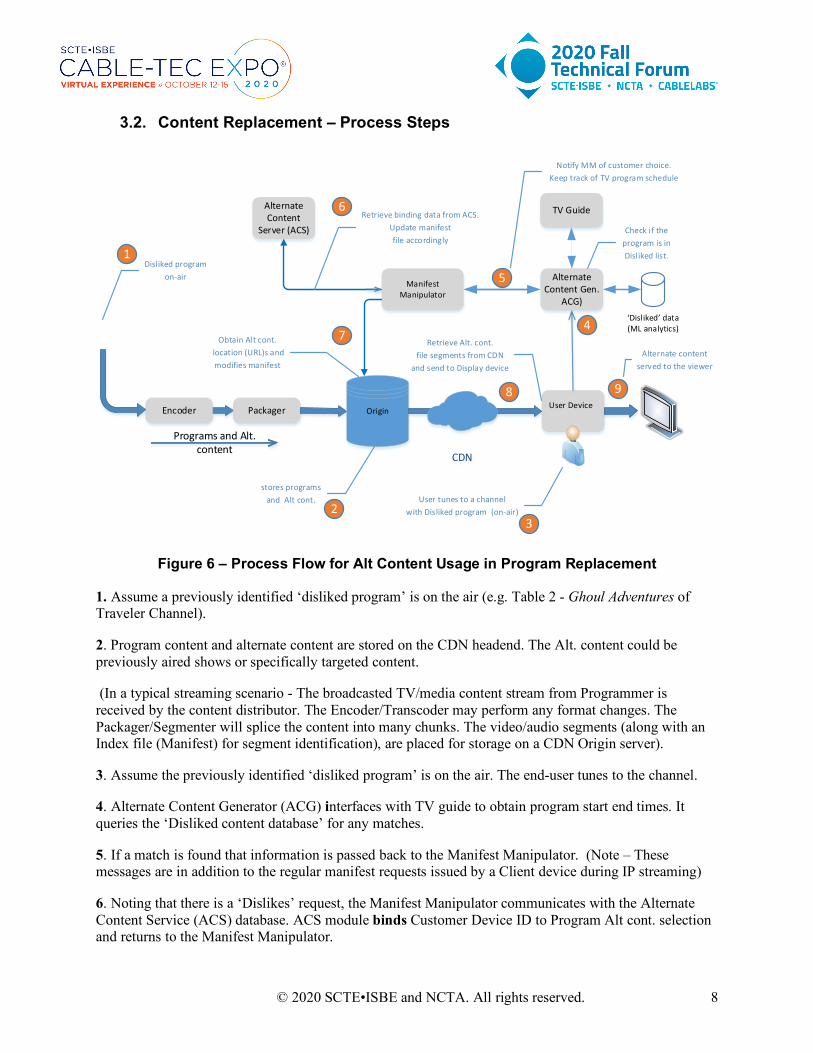
3.2. Content Replacement – Process Steps
Figure 6 – Process Flow for Alt Content Usage in Program Replacement
1. Assume a previously identified ‘disliked program’ is on the air (e.g. Table 2 - Ghoul Adventures of Traveler Channel).
2. Program content and alternate content are stored on the CDN headend. The Alt. content could be previously aired shows or specifically targeted content.
(In a typical streaming scenario - The broadcasted TV/media content stream from Programmer is received by the content distributor. The Encoder/Transcoder may perform any format changes. The Packager/Segmenter will splice the content into many chunks. The video/audio segments (along with an Index file (Manifest) for segment identification), are placed for storage on a CDN Origin server).
3. Assume the previously identified ‘disliked program’ is on the air. The end-user tunes to the channel.
4. Alternate Content Generator (ACG) interfaces with TV guide to obtain program start end times. It queries the ‘Disliked content database’ for any matches.
5. If a match is found that information is passed back to the Manifest Manipulator. (Note – These messages are in addition to the regular manifest requests issued by a Client device during IP streaming)
6. Noting that there is a ‘Dislikes’ request, the Manifest Manipulator communicates with the Alternate Content Service (ACS) database. ACS module binds Customer Device ID to Program Alt cont. selection and returns to the Manifest Manipulator.
Encoder
Alternate Content
Server (ACS)
Packager
Manifest Manipulator
OriginUser Device
Alternate Content Gen.
ACG)
Disliked programon-air
stores programs and Alt cont. User tunes to a channel
with Disliked program (on-air)
Check if the program is in Disliked list.
‘Disl iked’ data(ML analytics)
Retrieve binding data from ACS.Update manifest file accordingly
Obtain Alt cont. location (URL)s and modifies manifest
Retrieve Alt. cont. file segments from CDN
and send to Display device
CDN
1
23
4
6
7
8 9
Programs and Alt. content
Notify MM of customer choice.Keep track of TV program schedule
TV Guide
5
Alternate content served to the viewer

© 2020 SCTE•ISBE and NCTA. All rights reserved. 9
Customer Device Identifier Disliked content Alt. content
7. Manifest Manipulator modifies the index/manifest file, accordingly, replacing regular content with alternate content. The updated manifest is sent to the customer device (Client).
8. The Customer Device now retrieves corresponding alternate content from the CDN and send to the display device.
9. The original content is supplanted with alternate content and supplied to the display device for user consumption.
4. Replacing Disliked Content – ML Automation
4.1. Challenges in Applying Recommender Systems to Disliked content
In the movie recommendations example described earlier, the viewer inputs were explicitly supplied (e.g. one through five stars). In the case of disked content however, there is no explicit metric. The content is so averse, the viewer simply changes the channel. Not having user ratings is a barrier for applying the RS model, which uses similarity measures in the latent space to determine affinity. Hence, in this study a different metric is used for feature vector creation.
Another constraint is the sheer number of channels in a TV subscription. Most users have never even tuned to the hundreds of channels offered. It would be incorrect to categorize those as disliked content. Note that the present analysis applies to channels containing a mix of liked-content and disliked-content. The goal is to keep the viewer in the same channel. If there are no liked programs at all (i.e. customer never tunes to the channel), then the issue of ad revenue loss is moot.
4.2. Implicit Identification of Disliked content
The method adopted was to collect viewership data over time and apply data analytics to identify disliked content indirectly. One peculiarity with the viewership data is the vast difference in the time scale. For ‘disliked content’, the channel surfing times are about one to two seconds. But for ‘liked content’ (regular viewing), the durations could vary from several minutes per channel to hours. This disparity was addressed via a change of scale adjustment.
The wide range of the time scale is also a barrier for applying machine learning algorithms. This is illustrated below with reference to two algorithmic scenarios.
a) Cosine Similarity Cosine similarity is easy to visualize in two dimensions, but its application in the present context is for a multi-dimensional space. Due to the large disparity in the time scales (few seconds for disliked content vs. thousands of seconds for liked content), the user/item vectors in the latent space will not be an accurate depiction. The impact of disliked-content will be hard to quantify. On the other hand, simply inverting the scale (e.g. assigning 5 stars for disliked and 1 for liked), will not capture the nuances.
b) Singular Value Decomposition (SVD) Note that in the Singular values matrix, the dominant values are at the top left and decreases down the diagonal. Sigma 1 ≥ Sigma 2 ≥ Sigma 3…

© 2020 SCTE•ISBE and NCTA. All rights reserved. 10
The quantities of interest (disliked content with 1-2 seconds), are at the lower end of the time-scale and their impact is washed out by much larger terms in the matrix (thousands of seconds for liked content). As such, the dominant Sigma values do not reflect the impact of disliked-content, and skew the results. It is therefore necessary to rescale the data so that the disliked content reflect the dominant terms in the utility matrix.
4.3. Data Rescaling The metric adopted for this task is the log reciprocal of channel surf time. Since the channel change time could vary from 1 second to several hours (thousands of seconds), we use the following formula:
Disliked Content Measure = Log10 (104/T) = 4 – Log10 T
Table 2 – Disliked Content Rescaling
Disliked Content Liked Content Duration 1 sec 10 sec 15 min 2 hours Log10 (104/T) 4 3 1.045 0.143
The logarithmic scale converts the wide range of channel view time values to a more manageable compact scale. The original span of 1 second to over 2 hours, is now rescaled to the more compact range from zero to four (Table 2). The Log scale captures 1–5 star ratings implicitly. It is also in line with behavior based algorithms due to the continuity of scale. Conversely, simply assigning 5 stars to shorter times would not be granular. Also, the user response times for channel surfing are subjective.
4.4. Enhancements to Recommender Systems The result of applying RS is the creation of a disliked content matrix. This complements the more common liked-content matrix created by RS. The disliked-content analysis supplies additional data about user preferences to enhance the recommender system. This would be useful since a major issue with RS is the sparsity of the input data matrix.

© 2020 SCTE•ISBE and NCTA. All rights reserved. 11
Figure 7 – Disliked Content Usage to Enhance Consumer Profile
5. Machine Learning in Digital Video – Additional Examples Additional instances of potential usage are listed below for reference; not all are revenue related.
5.1. Enhanced Rating System for Movies
Current TV/Movie ratings are confusing (TV-Y7-FV, PG-13, TV-14…), as the restricted content definition is subjective. Parents would appreciate if they could know beforehand the type and placement of restricted content.
a) Scan videos in the repository and tag restricted content per pre-defined criteria, with time stamps. b) Develop an API for one-click access for the ‘Enhanced Ratings’ from the program guide.
5.2. Video Content Analysis - VOD Storage and Ingest a) Scan videos and generate descriptive metadata. Identify sentiments, underlying topics as well as
any anomalies in the media content. Create a searchable catalog of videos based on tagged data. b) Thematic advertising – Given an Ad-campaign theme (e.g. eco-tourism), find matching videos
from the collection. Find effectiveness of ads by different demographics/audiences. c) Celebrities - Find videos of a given actor, including duration/time stamps, from a collection. d) Closed captions – Translate speech to text for assets that currently do not have captions. e) Skipping content on VOD – User is presented with the option to auto-skip parts of a video based
on pre-defined content identifiers. ML can tag content based on heuristics.
Demographic Data Viewership Data
Liked-content(from Recommender)
Disliked-content (new)
Customer Data
Enhanced Profile for Analytics
© 2020 SCTE•ISBE and NCTA. All rights reserved. 12
5.3. Personalized Ads - Combine Demographic and Viewing data
[Scenario – Demographic data may suggest that 3 people live in a household, but it cannot answer questions such as, “Of the 3 inhabitants, which one was watching TV at 4 PM)?” Data analytics based on viewing patterns can be used to enhance targeted advertising]
a) Develop individual user profiles for each household based on multiple data sources – customer demographics, online viewing history and navigation data.
b) Make recommendations for personalized ads based on time-of-day viewership characteristics. c) Predict ad completion rates based on past viewing behavior and make ad recommendations.
5.4. Codec Quantization Parameter (QP) settings In a video codec the DCT coefficients are quantized per Quantization Parameter (QP) settings. Coarse QP values mean high compression and lower quality. QPs are also proportional to the Lagrangian multipliers of Rate optimization.
The Neural Network based auto-encoders on the other hand, map the data to a lower dimensional latent space and then reconstruct it during decoding. It can predict pixel values fairly accurately and provide optimum QP values. The encode-decode pair is trained as a single unit in unsupervised learning. The adaptively tuned QP values will yield improved PSNR.
6. Benefits to Service Providers and Programmers Machine learning enables identifying and auto-replacing of disliked content. MLaaS based novel offering (“Don’t Like, Don’t Watch!”) would be a new revenue opportunity for programmers and content distributors. The disliked content could even be faces and voices based on pre-defined signatures. Another improvement is in targeted advertising. Ad campaigns are generally based on consumer demographic data obtained from data brokers. The aggregated data can be refined by comparing with viewership patterns (e.g. time-of-day), garnered from liked and disliked content (Figure 7). Recommender systems based on explicit data can be improved by combining with disliked-content analysis.
Conclusion Cable-tech is ripe for disruption and transformation with MLaaS based consumer technologies. Service providers will reap the benefits of new revenue generating opportunities. To illustrate the point, a novel use case was presented along with MLaaS enhancements. To circumvent the challenges with general recommender system model, a new metric was proposed based on implicit user data. The auto-discovery and replacement of disliked content would prevent revenue loss for programmers due to channel surfing. Additional benefits include enhancements to recommender systems and targeted ad-campaigns.

© 2020 SCTE•ISBE and NCTA. All rights reserved. 13
Abbreviations
AI/ML Artificial Intelligence/Machine Learning MLaaS Machine learning as a service vMVPD Virtual Multi-Channel Video Programming Distributor (Internet based TV) SVD Singular Value Decomposition MF Matrix Factorization CB Content Based Filtering CF Collaborative Filtering
Acknowledgements
The author would like to thank Prof. Athula Gunawardena for helpful discussions.
Bibliography & References 1. Srilal Weerasinghe, Machine Learning Applications in Cable TV Advertising, SCTE-Cable-Tech-
Expo-2019
2. Yehuda Koren, Netflix Grand Prize, https://www.netflixprize.com/assets/GrandPrize2009_BPC_BellKor.pdf


