Mixing from Fickian Diffusion and Natural Convection … Pub... · Mixing from Fickian Diffusion...
10
Mixing from Fickian Diffusion and Natural Convection in Binary Non-Equilibrium Fluid Phases L. Rongy, K. B. Haugen, and A. Firoozabadi Dept. of Chemical Engineering, Mason Laboratory, Yale University, New Haven, CT 06511 DOI 10.1002/aic.12685 Published online June 16, 2011 in Wiley Online Library (wileyonlinelibrary.com). A two-dimensional (2-D) model that describes mass transport between non equilib- rium gas and liquid phases of a binary non polar mixture in a closed system of fixed volume and temperature is presented. Diffusion, convective mass transport due to com- pressibility and non ideality, and the motion of the interface upon evaporation and dis- solution are accounted. Natural convection in both phases is incorporated, which allows to study the effect of density increase in the liquid phase from gas dissolution. The Peng-Robinson equation of state is used to calculate the densities and the fugac- ities needed to find the interfacial composition consistent with local chemical equilib- rium. The results obtained with a one-dimensional model was compared to our 2-D results, showing that natural convection influences the mixing time drastically. In the liquid bulk phase, convective flux is much higher than diffusive flux. Across the inter- face, diffusive flux is, however, the dominating flux, which allows accurate measure- ment of diffusion coefficients at high pressure in 2-D domains. V V C 2011 American Institute of Chemical Engineers AIChE J, 58: 1336–1345, 2012 Keywords: two-phase systems, mixing, carbon dioxide, density-driven flow, diffusion coefficients Introduction The mixing of two non equilibrium fluid phases is rele- vant to a large number of applications such as improved oil recovery and carbon sequestration. Gas injection into oil reservoirs has long been used to maintain the pressure needed for recovery processes. The subsequent mixing between the gas and the liquid phase affects the physical properties of the oil such as its viscosity, density, and surface tension. 1 As a result, the recovery pro- cess might become more efficient, which is referred to as secondary recovery mechanisms. Reducing greenhouse gas emissions to hold back climate changes represents one of the most important challenges of our time. Underground injection of carbon dioxide (CO 2 ) in geological formations is a promising method considered for sequestering CO 2 captured from fossil-fuel power plants to reduce its concentration in the atmosphere and, therefore, its impact on global warming and climate change. 2,3 Different geological sites, including depleted oil fields, abandoned mining operations, saline aquifers, and deep-sea sediments have been proposed as possible long-term storage locations for CO 2 . At those underground conditions, CO 2 increases the density of the liquid present in the geological formation, which may lead to natural convection affecting the mixing processes. A large number of studies have examined the onset of convection during the mixing of CO 2 and brine in porous media both experimentally and with theoretical and Correspondence concerning this article should be addressed to A. Firoozabadi at abbas.fi[email protected]. Current Address of L. Rongy: Center for Nonlinear Phenomena and Complex Systems, Universite ´ Libre de Bruxelles, CP231, B-1050 Brussels, Belgium. V V C 2011 American Institute of Chemical Engineers 1336 AIChE Journal May 2012 Vol. 58, No. 5
-
Upload
truongkhanh -
Category
Documents
-
view
218 -
download
0
Transcript of Mixing from Fickian Diffusion and Natural Convection … Pub... · Mixing from Fickian Diffusion...

Mixing from Fickian Diffusion and NaturalConvection in Binary Non-Equilibrium Fluid
PhasesL. Rongy, K. B. Haugen, and A. Firoozabadi
Dept. of Chemical Engineering, Mason Laboratory, Yale University, New Haven, CT 06511
DOI 10.1002/aic.12685Published online June 16, 2011 in Wiley Online Library (wileyonlinelibrary.com).
A two-dimensional (2-D) model that describes mass transport between non equilib-rium gas and liquid phases of a binary non polar mixture in a closed system of fixedvolume and temperature is presented. Diffusion, convective mass transport due to com-pressibility and non ideality, and the motion of the interface upon evaporation and dis-solution are accounted. Natural convection in both phases is incorporated, whichallows to study the effect of density increase in the liquid phase from gas dissolution.The Peng-Robinson equation of state is used to calculate the densities and the fugac-ities needed to find the interfacial composition consistent with local chemical equilib-rium. The results obtained with a one-dimensional model was compared to our 2-Dresults, showing that natural convection influences the mixing time drastically. In theliquid bulk phase, convective flux is much higher than diffusive flux. Across the inter-face, diffusive flux is, however, the dominating flux, which allows accurate measure-ment of diffusion coefficients at high pressure in 2-D domains. VVC 2011 American Institute
of Chemical Engineers AIChE J, 58: 1336–1345, 2012
Keywords: two-phase systems, mixing, carbon dioxide, density-driven flow, diffusioncoefficients
Introduction
The mixing of two non equilibrium fluid phases is rele-vant to a large number of applications such as improved oilrecovery and carbon sequestration.
Gas injection into oil reservoirs has long been used tomaintain the pressure needed for recovery processes. Thesubsequent mixing between the gas and the liquid phaseaffects the physical properties of the oil such as its viscosity,density, and surface tension.1 As a result, the recovery pro-cess might become more efficient, which is referred to assecondary recovery mechanisms.
Reducing greenhouse gas emissions to hold back climatechanges represents one of the most important challenges ofour time. Underground injection of carbon dioxide (CO2) ingeological formations is a promising method considered forsequestering CO2 captured from fossil-fuel power plants toreduce its concentration in the atmosphere and, therefore, itsimpact on global warming and climate change.2,3 Differentgeological sites, including depleted oil fields, abandonedmining operations, saline aquifers, and deep-sea sedimentshave been proposed as possible long-term storage locationsfor CO2. At those underground conditions, CO2 increases thedensity of the liquid present in the geological formation,which may lead to natural convection affecting the mixingprocesses.
A large number of studies have examined the onset ofconvection during the mixing of CO2 and brine in porousmedia both experimentally and with theoretical and
Correspondence concerning this article should be addressed to A. Firoozabadi [email protected].
Current Address of L. Rongy: Center for Nonlinear Phenomena and ComplexSystems, Universite Libre de Bruxelles, CP231, B-1050 Brussels, Belgium.
VVC 2011 American Institute of Chemical Engineers
1336 AIChE JournalMay 2012 Vol. 58, No. 5

numerical models, often with the assumption of fixed inter-face conditions.4–7
The mixing between CO2 and water was recently studiedexperimentally in a pressure volume temperature (PVT) cell8
and a model was proposed to account for natural convection.However, to the best of our knowledge, there is no work in theliterature describing the mixing between two non equilibriumfluid phases and including natural convection in both phases aswell as the motion of the interface upon the phase changes.
Our purpose is two-fold. First, our work provides a realis-tic description of the mixing processes, which is needed toassess the efficiency of oil extraction and the storagecapacity in geological formations. In particular, we providefurther insight into the dynamics of mixing between CO2
and a hydrocarbon liquid phase, highlighting the role of thedifferent transport processes and the time scales of the sys-tem. Second, we are able to infer accurate diffusion coeffi-cients from measurements such as pressure evolution andgas–liquid level data by comparing the results obtained withour model to these experimental data.
The article is organized as follows. In the next section, wepresent the two-dimensional (2-D) governing equationsdescribing the compositional changes arising from Fickiandiffusion and convective mass transport. The motion of theinterface upon mixing is incorporated in the model formula-tion, and the velocity field is described by the compressibleNavier-Stokes equations. The interfacial and boundary condi-tions as well as the numerical integration method are alsopresented. Next, we focus on the mixing between CO2 andliquid normal decane (nC10), comparing our results with ex-perimental data (from Instituto Mexicano del petroleo) andmeasuring the diffusion coefficient accurately. The influenceof the diffusion coefficient and of natural convection arenext investigated and the non linear transient dynamics is an-alyzed before concluding the work in the last section.
Physical Model
The set up we study theoretically and numerically is a 2-D PVT cell with constant volume and temperature (see Fig-ure 1). In experiments, the cell is partly filled with liquidand the remainder is filled with gas. As the two phases equi-librate, the pressure and the liquid level change in time.Across the interface, local thermodynamic equilibrium isassumed. As a consequence, the composition on either sideof the interface differs from the composition of the bulkphases. This triggers mass transport by diffusive motion andby advection with a bulk velocity arising from compressibil-ity, non ideality, and natural convection if the system isbuoyantly unstable.
The gas–liquid interface is perpendicular to the gravityfield and, as the two phases mix, it can move upward ordownward. We assume, however, that the interface remainsflat. This assumption of non deformability rests on the factthat surface tension dominates over pressure and normal vis-cous stresses in the normal momentum balance at the inter-face.9 A suitably defined capillary number is shown to besmall. We also neglect variations in surface tension alongthe interface, which is a good assumption for the mixingbetween non reactive binary phases. We comment further onthis assumption toward the end of this section.
The governing equations in both phases are derived fromlocal mass and momentum balances.
Mass and Component Balance
The total mass balance is expressed by the continuityequation as
@q@t
þr � q~vð Þ ¼ 0 (1)
where for each phase, q is the mass density, t is the time, and~v¼ (u,w) is the 2-D velocity field. The composition of eachphase is determined by the mass fraction x of one of the twocomponents that we call component 1, component 2 beingtreated as the reference component. Writing the localcomponent balance yields
q@x@t
þ~v � rx
� �¼ �r � ~J (2)
where ~J is the Fickian diffusive mass flux of component 1 inthe corresponding phase, expressed as
~J ¼ �qDrx (3)
Pressure diffusion effects are neglected and the diffusioncoefficient D is calculated as a function of pressure andcomposition.10 A detailed explanation for the calculation of Dis given further. As the mixing process is assumed isothermal,the density is a function of pressure P and composition. Usingthe chain rule to expand the derivatives of density in Eq. 1leads to
@q@P
@P
@tþ~v � rP
� �þ @q@x
@x@t
þ~v � rx
� �þ qr �~v ¼ 0 (4)
We suppose that the spatial variations in pressure have anegligible effect on the density field. This assumption is
Figure 1. Sketch of a PVT cell with constant volumeand temperature.
H is the total height and L is the width of the cell. The gas–liquid interface is perpendicular to the gravity field ~g andthe pressure P and liquid level h vary with time as the twophases mix.
AIChE Journal May 2012 Vol. 58, No. 5 Published on behalf of the AIChE DOI 10.1002/aic 1337
justified for the problem discussed in this article. RearrangingEq. 4 and using Eq. 2 lead to the following expression for thedivergence of the velocity field
r �~v ¼ � 1
q@q@P
@P
@tþ 1
q2@q@x
r � ~J (5)
Equation 5 indicates that compressibility and non ideality(density variations with composition) can both be sources ofdivergence of the velocity field. To fully determine ~v, weobtain evolution equations from the momentum balance in thenext section.
Momentum Balance
We consider both the gas and the liquid phases to beNewtonian fluids and active in terms of convection. We can,therefore, write the momentum equations in each phase
q@~v
@tþ~v � r~v
� �¼ q~g�rPþ lr2~v
þ jþ l3
� �r r �~vð Þ; ð6Þ
where l and j are the shear viscosity and the bulk viscosity,respectively, assumed to be constant within each phase, and~g isthe gravity field. After linearizing and subsequently taking thecurl of Eq. 6within theBoussinesq approximation,we obtain thefollowing expression for the curl of the velocity field
@
@tr�~vð Þ ¼ g
q@q@x
þ lqr2 r�~vð Þ (7)
corresponding to a diffusion equation for the vorticity field witha source term arising from density gradients. The density fieldin the buoyancy term is evaluated as a function of pressure andcomposition using the Peng-Robinson equation of stateappropriate to the non polar mixtures considered here.11
Interfacial and Boundary Conditions
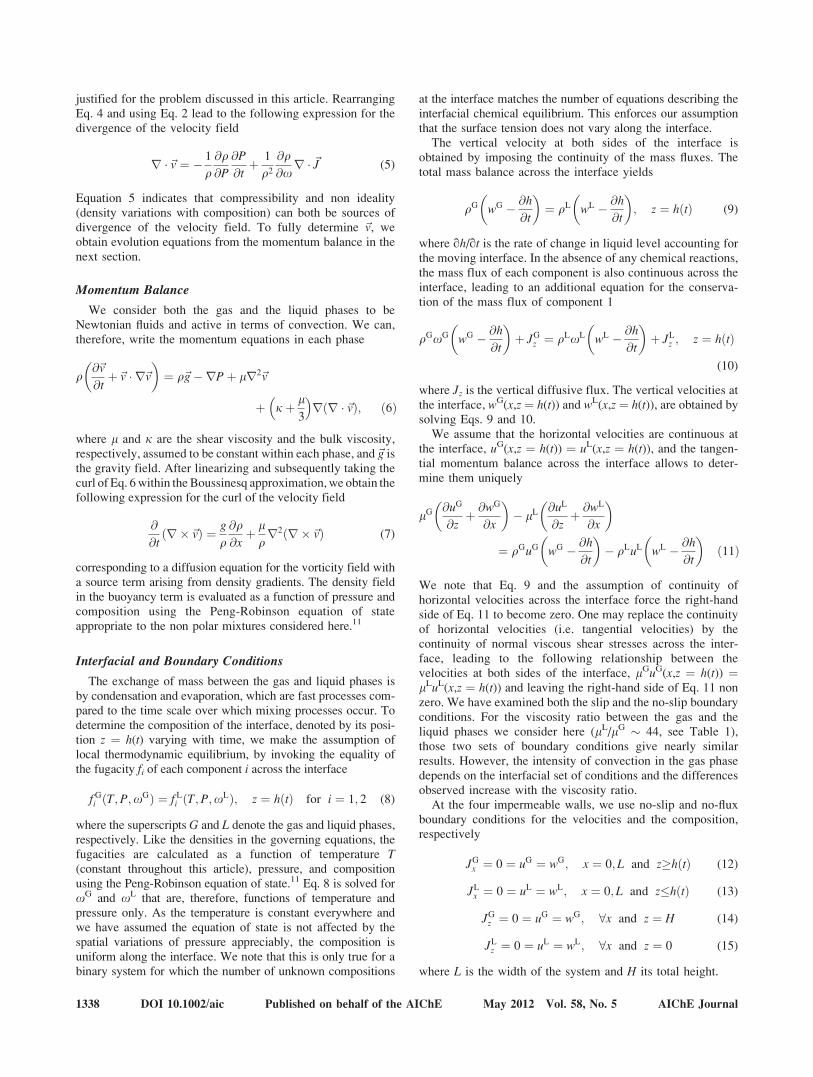
The exchange of mass between the gas and liquid phases isby condensation and evaporation, which are fast processes com-pared to the time scale over which mixing processes occur. Todetermine the composition of the interface, denoted by its posi-tion z ¼ h(t) varying with time, we make the assumption oflocal thermodynamic equilibrium, by invoking the equality ofthe fugacity fi of each component i across the interface
fGi ðT;P;xGÞ ¼ f Li ðT;P;xLÞ; z ¼ hðtÞ for i ¼ 1; 2 (8)
where the superscripts G and L denote the gas and liquid phases,respectively. Like the densities in the governing equations, thefugacities are calculated as a function of temperature T(constant throughout this article), pressure, and compositionusing the Peng-Robinson equation of state.11 Eq. 8 is solved forxG and xL that are, therefore, functions of temperature andpressure only. As the temperature is constant everywhere andwe have assumed the equation of state is not affected by thespatial variations of pressure appreciably, the composition isuniform along the interface. We note that this is only true for abinary system for which the number of unknown compositions
at the interface matches the number of equations describing theinterfacial chemical equilibrium. This enforces our assumptionthat the surface tension does not vary along the interface.
The vertical velocity at both sides of the interface isobtained by imposing the continuity of the mass fluxes. Thetotal mass balance across the interface yields
qG wG � @h
@t
� �¼ qL wL � @h
@t
� �; z ¼ hðtÞ (9)
where qh/qt is the rate of change in liquid level accounting forthe moving interface. In the absence of any chemical reactions,the mass flux of each component is also continuous across theinterface, leading to an additional equation for the conserva-tion of the mass flux of component 1
qGxG wG � @h
@t
� �þ JGz ¼ qLxL wL � @h
@t
� �þ JLz ; z ¼ hðtÞ
(10)
where Jz is the vertical diffusive flux. The vertical velocities atthe interface, wG(x,z ¼ h(t)) and wL(x,z ¼ h(t)), are obtained bysolving Eqs. 9 and 10.
We assume that the horizontal velocities are continuous atthe interface, uG(x,z ¼ h(t)) ¼ uL(x,z ¼ h(t)), and the tangen-tial momentum balance across the interface allows to deter-mine them uniquely
lG@uG
@zþ @wG
@x
� �� lL
@uL
@zþ @wL
@x
� �
¼ qGuG wG � @h
@t
� �� qLuL wL � @h
@t
� �ð11Þ
We note that Eq. 9 and the assumption of continuity ofhorizontal velocities across the interface force the right-handside of Eq. 11 to become zero. One may replace the continuityof horizontal velocities (i.e. tangential velocities) by thecontinuity of normal viscous shear stresses across the inter-face, leading to the following relationship between thevelocities at both sides of the interface, lGuG(x,z ¼ h(t)) ¼lLuL(x,z ¼ h(t)) and leaving the right-hand side of Eq. 11 nonzero. We have examined both the slip and the no-slip boundaryconditions. For the viscosity ratio between the gas and theliquid phases we consider here (lL/lG � 44, see Table 1),those two sets of boundary conditions give nearly similarresults. However, the intensity of convection in the gas phasedepends on the interfacial set of conditions and the differencesobserved increase with the viscosity ratio.
At the four impermeable walls, we use no-slip and no-fluxboundary conditions for the velocities and the composition,respectively
JGx ¼ 0 ¼ uG ¼ wG; x ¼ 0;L and z�hðtÞ (12)
JLx ¼ 0 ¼ uL ¼ wL; x ¼ 0; L and z�hðtÞ (13)
JGz ¼ 0 ¼ uG ¼ wG; 8x and z ¼ H (14)
JLz ¼ 0 ¼ uL ¼ wL; 8x and z ¼ 0 (15)
where L is the width of the system and H its total height.
1338 DOI 10.1002/aic Published on behalf of the AIChE May 2012 Vol. 58, No. 5 AIChE Journal

Numerical Implementation
The numerical scheme developed to integrate the equa-tions presented above uses a finite-volume discretization andbuilds on the work by Haugen and Firoozabadi.12,13 In thenumerical implementation, we use a reference frame cen-tered on and moving with the interface. The volume elementis rectangular because a higher precision is needed in thevertical direction to describe the transport processes acrossthe interface accurately.
The integration starts by performing an interfacial flash topredict the interfacial composition using Eq. 8 and the inter-facial vertical velocities using Eqs. 9–10. The velocity fieldin each phase, qP/qt, and qh/qt are next found by solving thelinear set of equations formed by Stokes’ theorem applied tothe integral form of Eq. 5 and Green’s theorem applied toeach volume element. Eqs 2 and 7 are then integrated usingan explicit Euler formulation. The density field and the dif-fusion coefficients are updated with the new compositionand pressure fields. The next step consists of moving theboundaries by qh/qt and adjusting the mesh accordingly. Thedetails on how the changes in size of the gas and liquiddomains are numerically implemented can be found in Ap-pendix A of Haugen and Firoozabadi.12
We have validated our numerical integrations by repro-ducing results previously obtained with a one-dimensional(1-D) code.12 Besides, our numerical solutions were found toconverge on decreasing the size of the volume elements andthe time step. A typical grid size used in this article is 1200� 30 to represent a 12-cm long and 19-mm wide system.The time step is chosen adaptively between 5.5 � 10�6 and5.5 � 10�3 s by comparing the local changes in time of thevariables with the magnitude of the global changes and isnot allowed to increase by more than 5% between two itera-tions.
Mixing dynamics: CO2-nC10 Mixture
In the remainder of this article, we will mainly considerthe mixing between CO2, which we will refer to as compo-nent 1, and normal decane, which we will treat as the refer-ence component. To compute the densities and the fugac-ities, we use the volume-translated Peng-Robinson equationof state11 (see Table 1 for related input parameters).
Measurement of the Diffusion Coefficient
The diffusion coefficient D varies with space and timebecause of the changes in composition and pressure. Weupdate the diffusion coefficient at the interface and in eachvolume element of our numerical grid every 5 s. We havetested that more frequent updates lead to the same results.
To account for the dependence of D on pressure and compo-sition, we use the unified model for non ideal and non polarmulticomponent mixtures developed by Leahy-Dios and Fir-oozabadi.10 An empirical correlation is first used to predictthe binary infinite-dilution diffusion coefficients, D1
12(T,P)(corresponding to CO2 infinitely diluted in nC10) andD1
21(T,P) (corresponding to nC10 infinitely diluted in CO2).Further dependence on temperature, pressure, and composi-tion is then calculated using the Vignes relation and an accu-rate description of the mixture non ideality by the fugacityderivatives evaluated with the Peng-Robinson equation ofstate10,11,14 (see Table 1 for related input parameters).
We compare our numerical integrations with experimentaldata (from Instituto Mexicano del petroleo) obtained in a cy-lindrical PVT cell containing a CO2–nC10 mixture at T ¼313.1 K. The height of the cell, H, is equal to 12 cm and itsdiameter, corresponding to our variable L, is equal to 19mm. The small cell diameter, along with the fact that thecell is placed in an isothermal bath, justify the assumptionthat the mixing processes can be treated as isothermal. Theinitial condition consists of pure gaseous CO2 on top of pureliquid normal decane. The initial pressure is 40.1 � 105 Pa,and the initial liquid level is 3.48 cm. Upon dissolution ofCO2 into the liquid phase, the pressure decreases. Figure 2ashows that using the correlation described above for the dif-fusion coefficients overestimates the rate of pressure change.The corresponding diffusion coefficients at the interface andin the bulk phases are presented in Table 2, for the initialcondition, when the bulk phases are uniform, and at the finalcondition. Table 2 also shows the initial and final infinite-dilution diffusion coefficients, varying with time due to thepressure changes. The discrepancy between the experimentaldata and the theoretical results observed in Figure 2a can bedue to either the representation of a cylinder by 2-D Carte-sian coordinates or to the correlation used for the mixture ofCO2 and normal decane. We note that, as D1
12 increases byonly 2% during the experiment, we can treat it as a constantfitting parameter and use our model to measure its value.
We have first tested that using a constant D112 equal to ei-
ther its value at the initial pressure or its value at the finalpressure both lead to the same result as using the value pre-dicted by the correlation and changing in time with pressure.We have next found that, for the experimental conditions,the optimal D1
12 ¼ 1.7 � 10�9 m2/s (see Figure 2a). Table 3gives the corresponding initial and final DG and DL. Theirtemporal and spatial dependences at the interface andthrough the bulk will be presented further in this section.Figure 2b shows the increase in liquid level arising from thedissolution of CO2 in the liquid phase. No experimental dataare available for the liquid level evolution of this system tocompare with our simulations.
Table 1. Critical Temperatures (Tc) and Pressures (Pc), Acentric Factors (k), Volume Shift Parameters (c), Molecular Weights(MW), Shear Viscosities (l), Diffusion Volumes (Vf), and Binary Interaction Parameter (k12) Used in the Volume-Translated
Peng-Robinson Equation of State11 and in the Diffusion Coefficients Correlation10
Tc (K) Pc (105 Pa) k c MW (g/mol) l(10�5 Pa s) Vf k12
CO2 304.1 73.75 0.239 0.1137 44.01 1.606 26.90.123
nC10 617.7 21.10 0.489 0.0865 142.3 71.26 209.8
The volume shift parameters and the binary interaction parameter have been fitted using independent experimental data on a CO2-nC10 mixture.16
AIChE Journal May 2012 Vol. 58, No. 5 Published on behalf of the AIChE DOI 10.1002/aic 1339

The data for the pressure changes can also be fitted withconstant effective diffusion coefficients, DG ¼ 1.5 � 10�7
m2/s and DL ¼ 5.6 � 10�9 m2/s (see Figure 3). Those valuesare only valid for the particular experimental set-up we areconsidering here as they constitute an effective measure ofthe diffusive transport process throughout the experiment.
We point out that, in both Figures 2 and 3, the results arevery sensitive to D1
12 and DL, respectively. The time neededto reach equilibrium decreases when the diffusion coefficientincreases, leading to a faster mixing. On the contrary, chang-ing the diffusion coefficient in the gas phase by a factor of 2does not influence the results significantly. This is because,for these experimental conditions, the composition of the gasphase remains almost pure CO2 with very little normal dec-ane evaporating. The maximum mass fraction of nC10 in thegas phase is indeed only 0.2% at equilibrium.
Influence of Natural Convection
Upon dissolution, CO2 increases locally the density of theliquid phase leading to a buoyantly unstable situation. Thelocal unstable density gradient along with numerical fluctua-tions (we did not perturb the system in any specific way)triggers natural convection. The influence of convection onthe mixing time scale is shown in Figure 4 where we com-pare the predictions of a 1-D model12,13 with our 2-D resultsfor constant diffusion coefficients. We use the optimal liquiddiffusion coefficient found in Figure 3, DL ¼ 5.6 � 10�9
m2/s and observe that it takes approximatively 100 h toreach the equilibrium with a 1-D model not accounting fornatural convection whereas it only takes 2 h in the experi-ment (see Figure 4a). We also compare the dynamics of theCO2-nC10 system with a methane (CH4)-nC10 mixture. In theformer case, the density increase in the liquid phase amounts
Table 2. Initial (t 5 0) and Final (t 5 t‘) DiffusionCoefficients in the Gas and Liquid Phases, DG
and DL,
respectively, calculated using the correlation fromLeahy-Dios and Firoozabadi.10
t ¼ 0 t ¼ t1
DGinterface (�10�7m2/s) 1.05
1.70DG
bulk (�10�7m2/s) 1.06
DLinterface (�10�8m2/s) 1.46
1.35DL
bulk (�10�8m2/s) 0.604
D112 (�10�9m2/s) 6.04 6.16
D121 (�10�7m2/s) 1.06 1.71
The infinite-dilution coefficients, D112 and D1
21, also change during the mixingbecause of the decrease in pressure. The values in the table have been calcu-lated for a CO2–nC10 mixture at T ¼ 313.1 K, with the initial pressure P0 ¼40.1 � 105 Pa, the initial liquid level h0 ¼ 3.48 cm, and the system dimen-sions H ¼ 12 cm and L ¼ 19 mm.
Table 3. Initial (t 5 0) and Final (t 5 t‘) DiffusionCoefficients in the Gas and Liquid Phases, DG
and DL,
Respectively, Calculated from a Constant D112 ¼ 1.7 � 10�9
m2/s and using the correlation from Leahy-Dios andFiroozabadi
10for D1
21
t ¼ 0 t ¼ t1
DGinterface (�10�7m2/s) 1.05
1.70DG
bulk (�10�7m2/s) 1.06
DLinterface (�10�9m2/s) 6.78
5.33DL
bulk (�10�9m2/s) 1.70
The other parameters are the same as in Table 2.
Figure 3. Pressure as a function of time for differentconstant diffusion coefficients in the liquidphase, DL.
The optimal DL ¼ 5.6 � 10�9 m2/s and the diffusion coeffi-cient in the gas phase, DG, is equal to 1.5 � 10�7 m2/s forall the plots. The other parameters are the same as in Figure2. [Color figure can be viewed in the online issue, which isavailable at wileyonlinelibrary.com.]
Figure 2. Pressure (a) and liquid level (b) as a functionof time with diffusion coefficients varying intime.
The diffusion coefficient at infinite dilution of CO2 in nC10,D1
12, predicted by the correlation evolves from 6.04 � 10�9
to 6.16 � 10�9 m2/s, whereas the comparison with experi-mental data shows that the optimal D1
12 ¼ 1.7 � 10�9 m2/s.The temperature is constant, T ¼ 313.1 K, the initial pres-sure P0 ¼ 40.1 � 105 Pa, the initial liquid level h0 ¼ 3.48cm, and the system dimensions are H ¼ 12 cm and L ¼ 19mm. [Color figure can be viewed in the online issue, whichis available at wileyonlinelibrary.com.]
1340 DOI 10.1002/aic Published on behalf of the AIChE May 2012 Vol. 58, No. 5 AIChE Journal

to 0.01 g/cm3 at the end of the mixing whereas in the lattercase, there is no density increase of the liquid phase upondissolution of methane. This explains why, in that case, theresults of the 1-D model are identical to the ones of the 2-Dmodel (see Figure 4a). We note that the mixing in the(CH4)–nC10 system occurs on the same time scale as themixing in the CO2–nC10 system without natural convection.Using a 2-D code accounting for natural convection is cru-cial as the experimental data can also be fitted with a 1-Dmodel but the predicted DL is two orders of magnitudehigher in that case (see Figure 4b). We would like to repeatthat in our article we have used a 2-D numerical Cartesiancoordinate model for the study of a cylindrical geometry.The numerical model is expected to capture the essence ofgravity effect. In the future, we plan to verify our modelwith composition and velocity data as they become availablein the literature.
Figures 5 and 6 show the evolution of the composition atthe interface and in the liquid phase. The interfacial mass
fraction of dissolved CO2 is maximum at the initial pressure.Following the dissolution of CO2 in the liquid phase, thepressure decreases, which leads to lower concentrations ofCO2 dissolved at the interface. The concentration of CO2 atthe liquid side of the interface follows the drop in pressure(see Figure 5). For the sake of clarity, the results are pre-sented in the frame of the moving interface, located at z ¼ 0in all the graphs below. The liquid concentration of CO2 ismaximum at the interface and drops sharply below the inter-face to become almost uniform in the bulk (see Figure 6).This points out that the dissolved CO2 is rapidly taken awayfrom the interface by convection and mixed in the bulkphase with a very efficient mixing rate. Figure 6 pictures therapid build-up of CO2 concentration in the liquid bulk phase.In the gas phase, there is only a small reduction in the con-centration of CO2. We do not show the results for brevity.
The changes in pressure and composition discussed aboveaffect the diffusion coefficients at the interface and in thebulk phases. Composition has a stronger effect than pressureon the diffusion coefficient in the liquid phase, whereas, inthe gas phase, DG is affected almost by pressure only, asexpected because of the small composition changes. Eventu-ally, we note that the diffusion coefficients are almost uni-form within each bulk phases, except close to the liquid sideof the interface.
Figure 4. Comparison between the predictions of a 1-Dmodel12,13 and our 2-D model with constantdiffusion coefficients.
(a) Pressure as a function of the square root of time using a1-D and a 2-D model: for the CO2-nC10 system, DL ¼ 5.6� 10�9 m2/s and DG ¼ 1.5 � 10�7 m2/s; for the CH4–nC10
system, DL ¼ 1.25 � 10�8 m2/s and DG ¼ 2.49 � 10�7
m2/s, values obtained by using the correlation for diffusioncoefficients at the equilibrium conditions.11 The binaryinteraction parameter between CH4 and nC10 is 0.045 andthe additional parameters are taken from Haugen and Firoo-zabadi.12,13 (b) Pressure as a function of time fitted by a 1-D model with DL ¼ 5.8 � 10�7 m2/s and DG ¼ 1.5 � 10�7
m2/s. The mixture is formed by CO2 and nC10, and temper-ature, initial conditions, and system dimensions are thesame as in Figure 2.[Color figure can be viewed in theonline issue, which is available at wileyonlinelibrary.com.]
Figure 5. Interfacial composition of CO2 on the liquidside as a function of (a) time and (b) pres-sure.
Binary interfacial compositions depend on T and P only andare, therefore, uniform along the interface in our system.The diffusion coefficients are calculated as a function ofpressure and composition using D1
12 ¼ 1.7 � 10�9 m2/s,and the other parameters are the same as in Figure 2.
AIChE Journal May 2012 Vol. 58, No. 5 Published on behalf of the AIChE DOI 10.1002/aic 1341

The 2-D composition field at different stages of the mixingis shown in Figure 7 for the liquid phase. Convection starts offclose to the lateral boundaries of the PVT cell in the liquid
region near the interface, 3 s after the liquid and the gas phasesare brought into contact. Because of the sharp differencebetween the interfacial and bulk compositions, as seen in Fig-ure 6, the interface is not shown to have a better color contrast.The composition field is initially symmetric about the middleof the PVT cell. After 26 s of mixing, two fingers, mirrorimages of each other, initiate at the interface close to the sym-metry line and merge rapidly into one sinking finger. After 36s, the symmetry breaks and the finger starts traveling towardthe left side of the cell. From that moment up to the time whenthe system reaches equilibrium, the dynamics is complex withone finger originating at a random position of the interface,most often close to the center of the system, and sinking in thebulk. At the same time, the base of the finger propagates alongthe interface toward either the left or the right boundary, lead-ing to pronounced downflow at the sides. The last five panelsof Figure 7 illustrate one case of a finger traveling to the left.In the early stages of mixing, a new finger appears every 10–30 s while it can take up to several minutes at longer timeswhen the system gets close to equilibrium. The velocity fieldin the liquid phase, including the interface, is illustrated in Fig-ure 8 at times corresponding to the first, third, fifth, and sev-enth panels of Figure 7. The maximum velocity is about 1 cm/s and the fluid circulation slows down with time. We note thatthis dynamics is quite different from the density-driven
Figure 6. Composition of CO2 in the middle of the PVTcell, plotted across the liquid bulk phase for var-ious times: t5 150 s, 5 min, 7.5 min, 10 min, 12.5min, 25 min, 52 min, and 2 h, from bottom to top.
The parameters are the same as in Figure 5 and, for thesake of clarity, the results are plotted in the frame of themoving interface, located at z ¼ 0. [Color figure can beviewed in the online issue, which is available at wileyonli-nelibrary.com.]
Figure 7. Liquid CO2 composition for various times: t 5 10.5, 27.5, 31, 162, 164.5, 174.5, 177.5, and 179 s, from leftto right and top to bottom.
For better color contrast, the interface is not represented and the color scale has been optimized for each panel. The first three panels illus-trate the initially symmetric dynamics. The last five panels are illustrative of the dynamics occurring for most of the mixing. Besides im-portant downward flow at the sides, one finger keeps initiating randomly along the interface. Its subsequent motion is downward and to-ward one of the lateral sides of the PVT cell. All the conditions are the same as in Figure 5 and the results are plotted in the frame of themoving interface, located at z ¼ 0. [Color figure can be viewed in the online issue, which is available at wileyonlinelibrary.com.]
1342 DOI 10.1002/aic Published on behalf of the AIChE May 2012 Vol. 58, No. 5 AIChE Journal

fingering observed in porous media or Hele-Shaw cells wherethe initial convective patterns consist in fingers with a well-defined wavelength6,16,17 and evolving in time by coarseningor tip splitting.
In the gas phase, a couple of convection rolls is initiatedby viscous drag at the interface and dies out in the bulk.
Mass Fluxes
We analyze the diffusive mass flux, ~JD ¼ �qD!x, andthe convective mass flux, ~JC ¼ qx~v, both in the liquid bulkphase and at the interface, to highlight the transport processescontrolling the mixing. Figure 9a displays the maximum inten-sity of the vertical diffusive and convective mass fluxes at the
liquid side of the interface. The diffusive flux is always anorder of magnitude larger than the convective flux and is nega-tive, transferring CO2 from the interface to the liquid phase.This points out that diffusion dominates the mass transfer atthe interface, and explains our results sensitivity to the diffu-sion coefficient (see Figures 2 and 3), allowing us to measureaccurate value even if convection has a huge effect on themixing time scale (see Figure 4). Indeed, the maximum inten-sity of the diffusive and convective fluxes in both directionsinside the liquid bulk phase, plotted in Figure 9b, indicatesthat the mixing in the bulk takes place mostly by convection.Both types of fluxes decrease by several orders of magnitudeduring the mixing, at the interface as well as in the bulk aftera significant increase in the very short times.
Figure 8. Velocity field in the liquid phase, including the interface, superimposed on the composition field of CO2
for various times: t 5 10.5, 31, 164.5, and 177.5 s, from left to right and top to bottom (times correspond-ing to the first, third, fifth, and seventh panels of Figure 7).
All the conditions are the same as in the previous figure and the results are plotted in the frame of the moving interface, located at z ¼ 0.The arrows, however, represent the real length of the velocity vectors in the fixed frame. The maximum velocity is about 1 cm/s anddecreases with time. [Color figure can be viewed in the online issue, which is available at wileyonlinelibrary.com.]
AIChE Journal May 2012 Vol. 58, No. 5 Published on behalf of the AIChE DOI 10.1002/aic 1343

Concluding Remarks
When two non equilibrium gas and liquid phases arebrought into contact, mass transfers across the interfaceuntil partial or complete mixing is achieved. We have stud-ied the case of a binary mixture formed by CO2 and normaldecane, pointing out that natural convection, triggered bythe density increase of the liquid phase upon dissolution ofCO2, accelerates the mixing between the two phases by afactor 50 for typical experimental conditions (total densityincrease in the liquid phase, DqL ¼ 0.01 g/cm3). Becauseof this very efficient mixing, the liquid bulk composition isalmost uniform. At the interface, however, the diffusivefluxes control the supply of CO2, which is demonstrated bythe sensitivity of the results to the diffusion coefficients.The model presented here aims at representing the differentprocesses accurately so that a comparison with experimen-tal data can allow for the measurement of the diffusioncoefficients. Our 2-D model includes Fickian diffusion,convective mass transport arising from compressibility, nonideality, and natural convection in both phases. The motionof the interface upon mixing is incorporated in the model,the fluid properties are calculated with the Peng-Robinson
equation of state, and the diffusion coefficients vary withpressure and composition.
We have considered a 2-D model. Three-dimensional-effects that may influence the dynamics described here arebeyond the scope of this article. In 2-D, we include all thephysical processes in the experimental system in our descrip-tion. The assumption of a non deformable interface can bejustified by considering the dimensionless capillary number,measuring interfacial deformation, Ca ¼ lU/c, where U is acharacteristic speed and c is the interfacial tension betweenCO2 and nC10. Interfacial tension in a CO2–nC10 system atsimilar conditions as ours, T ¼ 310.85 K and P ¼ 28 � 105
Pa, has been obtained from equilibrium measurements18 andis around 16 � 10�3 N/m. Using the viscosity of the liquidphase, lL ¼ 71.26 � 10�5 Pa s (see Table 1), and its charac-teristic velocity at the early stages of mixing, U � 1 cm/s,leads to the maximum capillary number for our system, Ca¼ 4.5 � 10�4. We can therefore safely neglect any surfacedeflections.
Extending this work to mixtures with more than two com-ponents and accounting for variable viscosity is a furtherstep to consider to determine diffusion coefficients in multi-component systems for which data are very scarce. The mix-ing between CO2 and water is a very important and timelyissue that could also be addressed with our model adapted topolar mixtures by changing the equation of state.19
Acknowledgments
The authors acknowledge financial support from the member compa-nies of R.E.R.I., and L.R. is supported by the F.R.S.-F.N.R.S. Belgium.They also thank the Instituto Mexicano del Petroleo for sharing their ex-perimental data.
Literature Cited
1. Moortgat J, Firoozabadi A. Higher-order compositional modelingwith Fickian diffusion in unstructured and anisotropic media. AdvWater Resour. 2010;33:951–968.
2. Schrag DP. Preparing to capture carbon. Science. 2007;315:812–813.3. Firoozabadi A, Cheng P. Prospects for subsurface CO2 sequestration.
AIChE J. 2010;56:1398–1405.4. Lindeberg E, Wessel-Berg D. Vertical convection in an aquifer col-
umn under a gas cap of CO2. Energy Convers Manage.1997;38:229–234.
5. Ennis-King J, Preston I, Paterson L. Onset of convection in aniso-tropic porous media subject to a rapid change in boundary condi-tions. Phys Fluids. 2005;17:084107.
6. Riaz A, Hesse M, Tchelepi HA, Orr FM. Onset of convection in agravitationally unstable diffusive boundary layer in porous media. JFluid Mech. 2006;548:87–111.
7. Kneafsey TJ, Pruess K. Laboratory flow experiments for visualizingcarbon dioxide-induced, density-driven brine convection. Transp Po-rous Med. 2010;82:123–139.
8. Farajzadeh R, Zitha PLJ, Bruining J. Enhanced mass transfer ofCO2 into water: experiment and modeling. Ind Eng Chem Res.2009;48:6423–6431.
9. Nepomnyashchy AA, Velarde MG, Colinet P. Interfacial Phenom-ena and Convection. Boca Raton: Chapman and Hall/CRC, 2002.
10. Leahy-Dios A, Firoozabadi A. Unified model for nonideal multicom-ponent molecular diffusion coefficients. AIChE J. 2007;53:2932–2939.
11. Peng D-Y, Robinson DB. New 2-constant equation of state. Ind EngChem Fundam. 1976;15:59–64.
12. Haugen KB, Firoozabadi A. Mixing of two binary nonequilibriumphases in one dimension. AIChE J. 2009;55:1930–1936.
Figure 9. Maximum intensity of the diffusive and con-vective vertical fluxes (a) on the liquid side ofthe interface as a function of time and (b) inthe liquid phase, both in the vertical and inthe horizontal directions, as a function oftime.
The plots are on a semi-log scale to accurately represent thechanges by several orders of magnitude during the mixing.All the parameters are the same as in the previous figures.[Color figure can be viewed in the online issue, which isavailable at wileyonlinelibrary.com.]
1344 DOI 10.1002/aic Published on behalf of the AIChE May 2012 Vol. 58, No. 5 AIChE Journal

13. Haugen KB, Firoozabadi A. Composition at the interface betweenmulticomponent nonequilibrium fluid phases. J Chem Phys.2009;130:064707.
14. Taylor R, Krishna R. Multicomponent Mass Transfer. New York:Wiley, 1993.
15. Reamer HH, Sage BH. Phase equilibria in hydrocarbon systems.Volumetric and phase behavior of the n-decane–CO2 system. JChem Eng Data. 1963;8:508–513.
16. Manickam O, Homsy GM. Fingering instabilities in vertical miscibledisplacement flows in porous media. J Fluid Mech. 1995;288:75–102.
17. Moortgat J, Sun S, Firoozabadi A. Compositional modeling of three-phase flow with gravity using higher-order finite element methods.Water Resour Res. 2011;47:WO511.
18. Ayirala SC, Rao DN. Miscibility determination from gas–oil interfa-cial tension and P-R equation of state. Can J Chem Eng.2007;85:302–312.
19. Li ZD, Firoozabadi A. Cubic-plus-association equation of state for as-phaltene precipitation in live oils. Energ Fuel. 2010;24:2956–2963.
Manuscript received Sept. 3, 2010, and revision received Apr. 18, 2011.
AIChE Journal May 2012 Vol. 58, No. 5 Published on behalf of the AIChE DOI 10.1002/aic 1345