Mixing and mass transfer in a pilot scale U-loop...
32
General rights Copyright and moral rights for the publications made accessible in the public portal are retained by the authors and/or other copyright owners and it is a condition of accessing publications that users recognise and abide by the legal requirements associated with these rights. • Users may download and print one copy of any publication from the public portal for the purpose of private study or research. • You may not further distribute the material or use it for any profit-making activity or commercial gain • You may freely distribute the URL identifying the publication in the public portal If you believe that this document breaches copyright please contact us providing details, and we will remove access to the work immediately and investigate your claim. Downloaded from orbit.dtu.dk on: Sep 09, 2018 Mixing and mass transfer in a pilot scale U-loop bioreactor Petersen, Leander Adrian Haaning; Villadsen, John; Jørgensen, Sten Bay; Gernaey, Krist V. Published in: Biotechnology and Bioengineering Link to article, DOI: 10.1002/bit.26084 Publication date: 2017 Document Version Peer reviewed version Link back to DTU Orbit Citation (APA): Petersen, L. A. H., Villadsen, J., Jørgensen, S. B., & Gernaey, K. (2017). Mixing and mass transfer in a pilot scale U-loop bioreactor. Biotechnology and Bioengineering, 114(2), [344–354]. DOI: 10.1002/bit.26084
Transcript of Mixing and mass transfer in a pilot scale U-loop...

General rights Copyright and moral rights for the publications made accessible in the public portal are retained by the authors and/or other copyright owners and it is a condition of accessing publications that users recognise and abide by the legal requirements associated with these rights.
• Users may download and print one copy of any publication from the public portal for the purpose of private study or research. • You may not further distribute the material or use it for any profit-making activity or commercial gain • You may freely distribute the URL identifying the publication in the public portal
If you believe that this document breaches copyright please contact us providing details, and we will remove access to the work immediately and investigate your claim.
Downloaded from orbit.dtu.dk on: Sep 09, 2018
Mixing and mass transfer in a pilot scale U-loop bioreactor
Petersen, Leander Adrian Haaning; Villadsen, John; Jørgensen, Sten Bay; Gernaey, Krist V.
Published in:Biotechnology and Bioengineering
Link to article, DOI:10.1002/bit.26084
Publication date:2017
Document VersionPeer reviewed version
Link back to DTU Orbit
Citation (APA):Petersen, L. A. H., Villadsen, J., Jørgensen, S. B., & Gernaey, K. (2017). Mixing and mass transfer in a pilotscale U-loop bioreactor. Biotechnology and Bioengineering, 114(2), [344–354]. DOI: 10.1002/bit.26084

AcceptedPrepri n
t
This article is protected by copyright. All rights reserved
Bioprocess Engineering and Supporting Technologies Biotechnology and Bioengineering DOI 10.1002/bit.26084
Mixing and mass transfer in a pilot scale U-loop bioreactor†
Leander A.H. Petersen1,3
, John Villadsen2, Sten B. Jørgensen
1, Krist V. Gernaey
1*
1. CAPEC-PROCESS Research Centre, Department of Chemical and Biochemical Engineering,
Technical University of Denmark, 2800 Lyngby, Denmark
2. CHEC Research Centre, Department of Chemical and Biochemical Engineering, Technical
University of Denmark, 2800 Lyngby, Denmark
3. Unibio A/S, Billedskærevej 8, 5230 Odense, Denmark
Running title: Mixing and mass transfer in a pilot scale U-loop bioreactor
* Corresponding author:
Krist V. Gernaey
CAPEC-PROCESS Research Centre,
Department of Chemical and Biochemical Engineering
Technical University of Denmark
2800, Denmark
+45 45252970
†This article has been accepted for publication and undergone full peer review but has not been through the copyediting, typesetting, pagination and proofreading process, which may lead to differences between this version and the Version of Record. Please cite this article as doi: [10.1002/bit.26084] This article is protected by copyright. All rights reserved Received June 3, 2016; Revision Received August 18, 2016; Accepted August 21, 2016
AcceptedPrepri n
t
This article is protected by copyright. All rights reserved
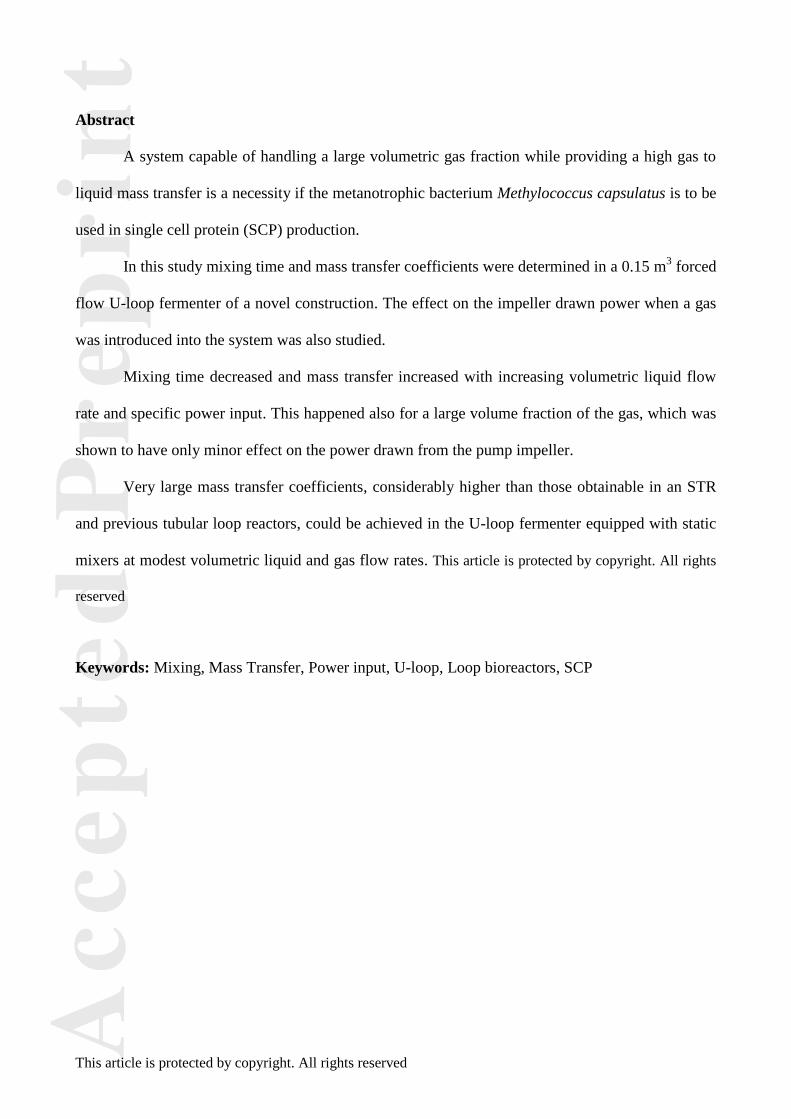
Abstract
A system capable of handling a large volumetric gas fraction while providing a high gas to
liquid mass transfer is a necessity if the metanotrophic bacterium Methylococcus capsulatus is to be
used in single cell protein (SCP) production.
In this study mixing time and mass transfer coefficients were determined in a 0.15 m3 forced
flow U-loop fermenter of a novel construction. The effect on the impeller drawn power when a gas
was introduced into the system was also studied.
Mixing time decreased and mass transfer increased with increasing volumetric liquid flow
rate and specific power input. This happened also for a large volume fraction of the gas, which was
shown to have only minor effect on the power drawn from the pump impeller.
Very large mass transfer coefficients, considerably higher than those obtainable in an STR
and previous tubular loop reactors, could be achieved in the U-loop fermenter equipped with static
mixers at modest volumetric liquid and gas flow rates. This article is protected by copyright. All rights
reserved
Keywords: Mixing, Mass Transfer, Power input, U-loop, Loop bioreactors, SCP
AcceptedPrepri n
t
This article is protected by copyright. All rights reserved
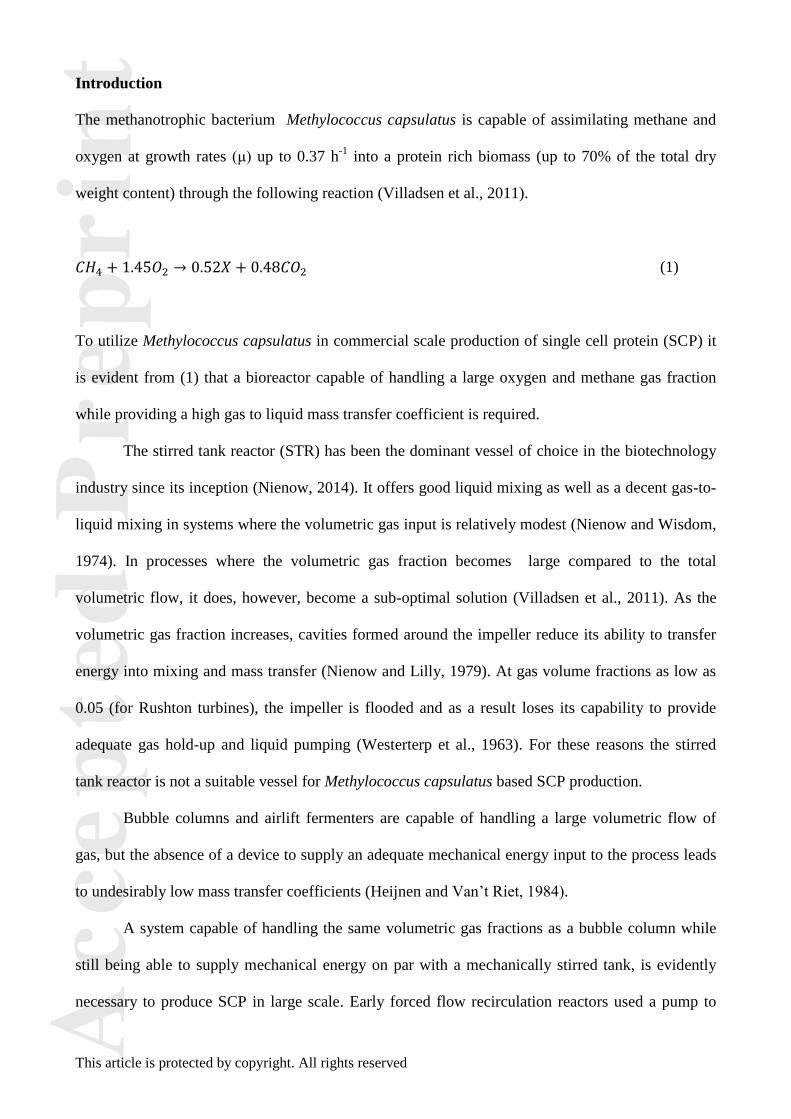
Introduction
The methanotrophic bacterium Methylococcus capsulatus is capable of assimilating methane and
oxygen at growth rates (μ) up to 0.37 h-1
into a protein rich biomass (up to 70% of the total dry
weight content) through the following reaction (Villadsen et al., 2011).
(1)
To utilize Methylococcus capsulatus in commercial scale production of single cell protein (SCP) it
is evident from (1) that a bioreactor capable of handling a large oxygen and methane gas fraction
while providing a high gas to liquid mass transfer coefficient is required.
The stirred tank reactor (STR) has been the dominant vessel of choice in the biotechnology
industry since its inception (Nienow, 2014). It offers good liquid mixing as well as a decent gas-to-
liquid mixing in systems where the volumetric gas input is relatively modest (Nienow and Wisdom,
1974). In processes where the volumetric gas fraction becomes large compared to the total
volumetric flow, it does, however, become a sub-optimal solution (Villadsen et al., 2011). As the
volumetric gas fraction increases, cavities formed around the impeller reduce its ability to transfer
energy into mixing and mass transfer (Nienow and Lilly, 1979). At gas volume fractions as low as
0.05 (for Rushton turbines), the impeller is flooded and as a result loses its capability to provide
adequate gas hold-up and liquid pumping (Westerterp et al., 1963). For these reasons the stirred
tank reactor is not a suitable vessel for Methylococcus capsulatus based SCP production.
Bubble columns and airlift fermenters are capable of handling a large volumetric flow of
gas, but the absence of a device to supply an adequate mechanical energy input to the process leads
to undesirably low mass transfer coefficients (Heijnen and Van’t Riet, 1984).
A system capable of handling the same volumetric gas fractions as a bubble column while
still being able to supply mechanical energy on par with a mechanically stirred tank, is evidently
necessary to produce SCP in large scale. Early forced flow recirculation reactors used a pump to

AcceptedPrepri n
t
This article is protected by copyright. All rights reserved
transport the aqueous medium through a tubular reactor into which the gas was injected (Russell et
al., 1974; Ziegler et al., 1977). In a separator exhaust gas is removed from the liquid using a
hydrocyclone. The reactors were used for aerobic yeast fermentation (Russell et al., 1974; Ziegler et
al., 1977).
The present paper experimentally investigates the power consumption, mixing efficiency
and rate of mass transfer in a novel forced flow pilot plant fermenter (0.15 m3) into which static
mixers are installed to provide further mass transfer than achieved in the earlier constructions. The
mixing and mass transfer results will be compared to conventional bioreactor designs, and existing
forced flow recirculation loop systems.
Materials and methods
The U-loop fermenter
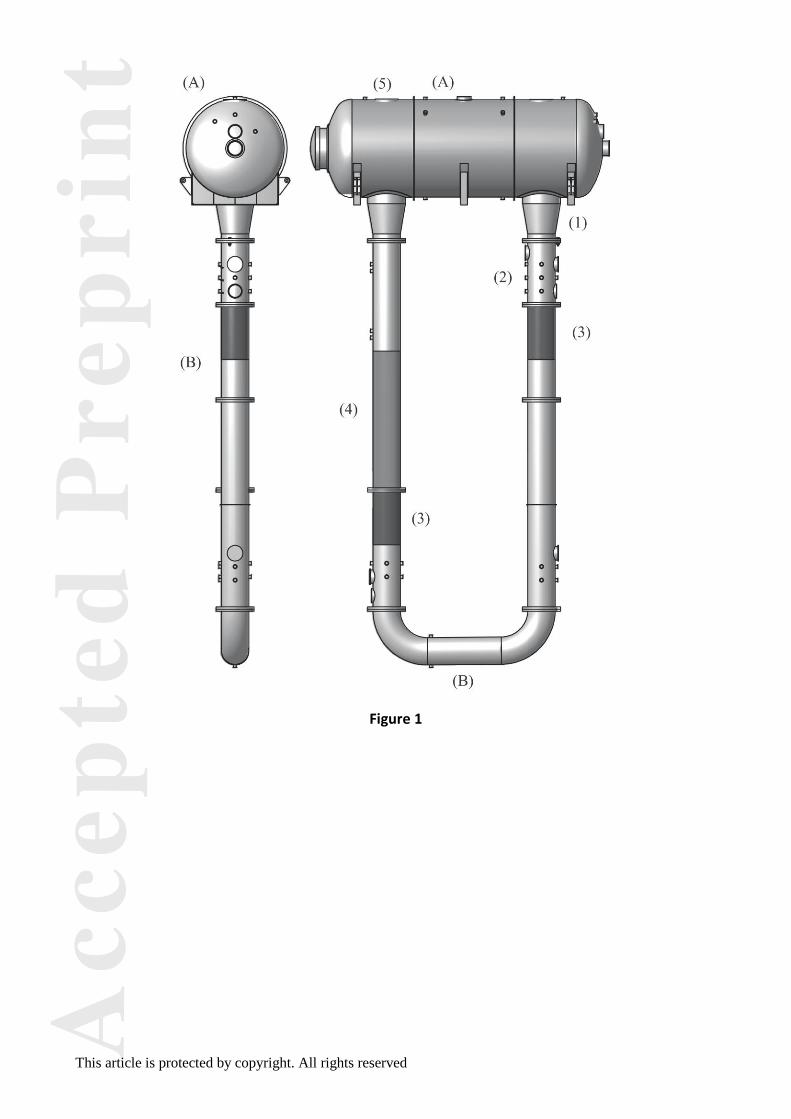
The novel U-loop fermenter concept (Larsen, 2000) depicted in fig. 1 is also fundamentally
different from existing forced flow recirculation loop systems in which the recirculation loop is
used to inject liquid or gas-liquid mixtures through one or more jets into one large tank where the
bioreaction takes place (Nordkvist et al., 2003). In The U-loop fermenter gas and liquid are mixed
by pumping gas and liquid through a vertical U-shaped pipe (A. on fig. 1) fitted with static mixers.
The U-shaped pipe leads to a cylindrical top tank (B on fig. 1) that works as a de-gassing unit.
Metabolic heat is removed from the process by the installation of a pipe heat exchanger (C. on
figure 1) in the loop. Essentially, the forced flow recirculation loop is turned into a near plug flow
reactor for the gas phase which has a short holding time (less than one minute) versus several hours
for the liquid phase. The liquid phase is radially mixed to achieve a high gas mass transfer, and its
overall residence time in the U-loop reactor is determined by the desired productivity of SCP.
Experimental setup

AcceptedPrepri n
t
This article is protected by copyright. All rights reserved
A centrifugal pump with a high head and capable of delivering a high flow rate was chosen
as pumping device in the pilot setup used in this study (1 on fig. 2). Gas was injected into the loop
after the pump and the flow rate was controlled by a mass flow controller (B on fig. 2). Liquid feed
is added to the system by positive displacement pumps either by injection directly into the loop or
by injection into the degassing unit. Dispersion of gas and liquid was generated by static mixing
elements of the SMV™ type from Sulzer (5 on fig. 2). Little data was available on the pressure drop
generated by each static mixing unit and this led to the decision to use a high head pump.
Temperature was kept steady at 25±0.2°C during all experiments by removing heat with a pipe heat
exchanger (6 on fig. 2). The volumetric flow rate (Q) was measured by a flow-meter (I on fig. 2)
placed in the loop. Gas was removed from the liquid in a de-gassing unit (7 on fig. 2) before
(re)entering the pump. Pressure transmitters (A on fig. 2), temperature sensors (D on fig. 2), pH
sensors (E on fig. 2) and oxygen sensors (C on fig. 2) were placed at strategic points in the loop and
the exhaust pipe. The liquid volume (V) in all experiments was kept at 0.15 m3.
Characterization of the U-loop fermenter
The power input into the U-loop system is determined by the centrifugal pump transferring
energy into torque. Energy transmission is consequently not fundamentally different from that
transmitted into an STR, and as such power (P) and flow rate (Q) in both systems is described by
the same equations (Paul et al., 2004):
(2)
(3)
Equations (2) and (3) are standard equations used to calculate the power input to an impeller (e.g a
Rushton turbine) and the resulting flow away from the impeller. N is the rotation speed of the
impeller (s-1
), D is the impeller diameter (m) and ρl is the liquid density (kg⋅m-3
). NP in Eq. (2) is

AcceptedPrepri n
t
This article is protected by copyright. All rights reserved
the so-called power number. It can be considered a dimensionless representation of the resistance
the impeller encounters as it moves through the liquid. NQ in Eq. (3) is the dimensionless flow
number and it is a measure of the impellers ability to displace liquid from one point of the U-loop
fermenter to another (Paul et al., 2004).
Figure 3 shows that the measured pumping power input (P) and volumetric flow (Q) are
directly obtained from equations (2) and (3). The slopes on the two graphs equal the dimensionless
power number (NP) and flow number (NQ) respectively. Both numbers reach a constant value when
the volumetric flow in the system is fully turbulent at high Reynolds numbers (Re(s)), but as the
flow pattern changes from laminar to turbulent NP decreases slightly with increasing Re while NQ
increases. This phenomenon explains why neither of the two lines intersects at the origin. Only
turbulent flows at impeller Reynolds numbers ranging from 8.94⋅105
– 2.25⋅106 were studied in
this paper, which is why a more traditional plot showing the power number and flow number versus
the Reynolds number is not included.
When a gas is introduced into the system, the only change in power and flow originates
from the pump’s ability to handle different density liquids or gas/liquid mixtures. Consequently,
when aerating the system only the dimensionless power number (NP) and flow number (NQ)
undergo a slight change to form (4) and (5).
(4)
(5)
The dimensionless parameters NP,g and NQ,g in Eq. (4) and (5) represent the modified (gassed)
power and flow number respectively, when a gas is introduced into the system.
Considering that all data is gathered with industrial equipment, and that small forces such as
friction in the smooth pipe are neglected, the agreement between experimental data and the
fundamental equations (2-5) is remarkably good.

AcceptedPrepri n
t
This article is protected by copyright. All rights reserved
In stirred tank reactor systems it is desired to compare the decrease in power input when a
gas is introduced into the system and the resulting ability of the impeller to mix gas and liquid, i.e.
to provide mass transfer. This is done by introducing the aeration number (6) (Calderbank, 1958;
Nienow, 2014; Paul et al., 2004; Villadsen et al., 2011).
(6)
Gas is injected after the pump impeller into the U-loop fermenter, and if complete degassing of the
liquid in the degasser is assumed, then it is the liquid flow acting on the gas bubbles that creates
aeration, not the rotations of the pump impeller itself. With this in mind, it is possible to describe
aeration in the U-loop through a slight alteration of (6):
(7)
Eq. (7) also accounts for situations where the gravitational forces exerted on the gas bubbles
exceed the torque exerted by the pump. In this case the aeration number would be zero despite a gas
flow and rotation of the impeller, as all the gas escapes directly to the degassing unit. Eq. (7) makes
it possible to compare the U-loop fermenters ability to handle gas with that of a stirred tank reactor.
Model fluids
Fermentation broths with Methylococcus capsulatus cell densities of up to 20 g⋅L-1
did not
exhibit viscosities measurably different from that of water. To mimic the fermentation broth we
used a non-coalescing solution with little to no buffer capacity (to avoid interference with the
mixing time experiments) and oxygen solubility similar to that of water. A 0.05 M Potassium
Chloride (KCl) solution (Marrucci and Nicodemo, 1967) was used in all experiments and found to
satisfactorily meet the above-mentioned demands.

AcceptedPrepri n
t
This article is protected by copyright. All rights reserved
Mixing
Mixing time in bioreactors can be quantified by observing the shift in pH after injecting a
tracer slug of concentrated acid or base, as long as the change in pH is modest, and any present
buffer systems are inactive (Nordkvist et al., 2003; Villadsen et al., 2011). pH was monitored with
a frequency of 1 s-1
with two electrodes placed at strategic points in the loop (E on fig. 2). For each
pH measurement a normalized pH was calculated according to (8).
(8)
Two different mixing processes were investigated.
Mixing by leg-injection: The tracer slug was introduced to the system between the pump (1
on fig. 2) and the static mixing device (5 on fig. 2). Here significant mixing is only achieved
through recirculation over the static mixers.
Mixing by top tank injection: The tracer was introduced to the system in the degassing unit
(7 on fig. 2). Mixing is already achieved by turbulence in the degassing unit, and further
through recirculation over the static mixers.
Several different acid/base concentrations were tested ranging from 1-10 M. A 5 ml addition of 2 M
HNO3 or 2 M NaOH over a 4 second time period gave a satisfactory final pH step of 0.1-0.3 pH
units, as well as a very smooth first order normalized pH profile (Marten et al., 1997) in agreement
with (9) in the leg mixing experiments.
(9)
The time required to reach a specific degree of mixing (m) follows from (10).

AcceptedPrepri n
t
This article is protected by copyright. All rights reserved
(10)
In the experiments where a tracer was added to the degassing unit, mixing depends on the level of
turbulence in the degasser, as well as on distribution through the loop pipe. Consequently mixing
cannot be described by a single rate constant as in (9) and (10). The time to achieve a specific
degree of mixing was instead calculated as the time interval between the initial responses in the
normalized pH profile and a mixing degree of m (Nordkvist et al., 2003).
The mixing time was determined as the average value of at least four individual
measurements with each tracer, performed for each set of operating conditions, as addition of an
alkaline tracer gives a slight overestimation of the mixing time while addition of acid results in an
underestimation (Nordkvist et al., 2003). Using data from either pH probe resulted in less than a 2%
deviation in the mixing time. Consequently only one result (the average value) was reported.
Mass Transfer
Gas-liquid mass transfer coefficients were obtained using the hydrogen peroxide steady state
technique (Hickman, 1988). Initially catalase (Catazyme® from Novozymes A/S) was added to the
0.05 M KCl solution in the U-loop. After testing several catalase concentrations ranging from 10-
100 g⋅m-3
, a concentration of ≥70 g⋅m-3
was found to be non-rate limiting, and deemed
satisfactory. Additional catalase was supplied every hour and during each steady state. This was
done to compensate for loss of catalytic activity, and to ensure that the enzymatic reaction was not
limiting.
Figure 4 shows a typical experiment. A steady state oxygen tension (measured with two
Mettler Toledo InPro® 6860i sensors positioned at C in fig. 2) was obtained at a specific volumetric
gas flow rate and specific power input. A constant flow rate (measured with a flow-meter) of a
H2O2 mixture was then injected into the leg of the U-loop fermenter by a positive displacement

AcceptedPrepri n
t
This article is protected by copyright. All rights reserved
pump (3 on fig. 2). Based on the mixing time experiments a 2.65 M H2O2 solution (determined by
titration with KMnO4) was chosen.
A new steady state in the oxygen tension was reached, and kept for approximately 30 min.
Addition of H2O2 was then stopped, and it was ensured that the oxygen tension returned to the
initial value. Assuming that the liquid phase is perfectly mixed one determines the gas/liquid mass
transfer coefficient (kLa) from (11).
(11)
cl* is the saturation concentration of the oxygen in the liquid. Under the assumption that complete
back mixing of the gas phase occurs, this can be determined by (12)
(12)
In Eq. 12, pO2exit
is the volume fraction of oxygen in the gas leaving the system during each steady
state, HO is henry’s constant for oxygen in water at T=25°C (7.69⋅104 m
3⋅Pa⋅mol-1
(Sander, 2015))
and p is the pressure measured at the oxygen sensor (to account for hydrostatic pressure changes).
Aeration did not affect the gauge pressure at the oxygen sensor. Eq. 12 assumes that the gas phase is
well mixed. This assumption was found to be sufficient in this study, as using data from either
oxygen sensor resulted in less than a 3% deviation in the mass transfer coefficient calculated using
Eq. 11 and Eq. 12. Consequently only one result (the average value) was reported. Steady state
oxygen tension was unaffected by the supply of additional catalase, ruling out the enzymatic
reaction being rate limiting. In larger U-loop fermenters, a different model for the gas phase (i.e. a
plug flow model) might be necessary.

AcceptedPrepri n
t
This article is protected by copyright. All rights reserved
The specific power input (P/V) was varied from 7500-29000 W⋅m-3
and the volumetric gas
flow rate (Qg) ranged from 2.83⋅10-4
to 1.43⋅10-3
N⋅m3⋅s
-1.
Results and discussion
Power and flow
Table I shows a selection of power numbers (NP and NP,g) and flow numbers (NQ and NQ,g)
at given aeration numbers (NA) found using Eq. (2)-(7). Notable from Table I is that although the
power numbers for the impeller in the centrifugal pump are relatively small compared to traditional
impellers (Nienow and EKATO, 2000) so are the flow numbers. The centrifugal pump used in this
study was for other reasons over designed to overcome a pressure loss (Δp) over the U-shaped pipe
of up to 4⋅105Pa. The ability to overcome a drop in gauge pressure by a centrifugal pump is
accomplished through the conversion of kinetic flow energy into localized turbulence in and around
the pump casing by the insertion of resistance generating devices (Grundfos, 2014). As such the
high lifting capabilities of the pump form a direct explanation of the low flow numbers.
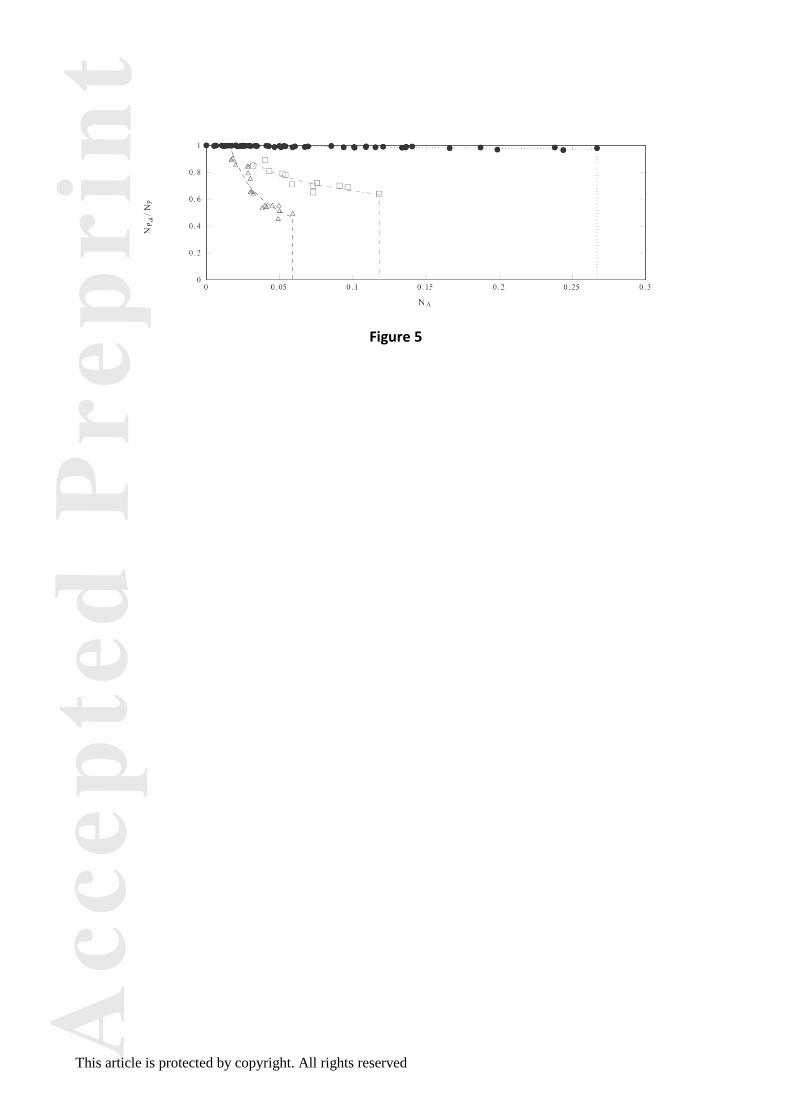
Another interesting observation from Table I is that only minor changes in power and flow
number take place as the aeration number increases. Conducting a more in-depth study of the power
number as a function of the aeration number for the U-loop fermenter and a STR (shown in figure
5.) reveals that a unique relationship between power transferred into mixing and volumetric gas
flow exists in the U-loop fermenter. In the STR, power drawn from the impeller seems to decease
drastically with increased volumetric gas flow, while it appears that this drop is almost non-existing
in the U-loop.
Dependent on the number of impellers, the traditional STR is flooded when the volumetric
gas fraction reaches 0.055 and 0.11 respectively (Nienow and Lilly, 1979). In the U-loop gas-to-
liquid mixing occurs at volumetric gas fractions up to 0.27 without flooding. Depending on the
number of impellers this is potentially a fivefold increase in how much gas can be mixed into the
liquid.

AcceptedPrepri n
t
This article is protected by copyright. All rights reserved
Furthermore at aeration numbers between 0.055 and 0.11; the decrease in power drawn from
the pump impeller in the U-loop fermenter was barely measurable, compared to a drop to 0.49 (in
the one Rushton turbine STR at NA=0.055) and 0.62 (in the 2 Rushton turbine STR at NA=0.11.
This means that the reduction in power drawn from the pump impeller is 0.1% in the U-loop
fermenter when a gas is introduced into the system. This number is about 500 times higher in a
traditional STR equipped with one Rushton turbine, and about 380 times higher in a traditional STR
equipped with two Rushton impellers. Even at aeration numbers as high as 0.27, the power number
in the U-loop fermenter only decreases from 1 to about 0.97, which is about 13 times less power
lost compared to a 2 Rushton turbine STR at less than half the level of aeration.
Gas enters the U-loop fermenter after the pump, and exits the reactor in the degassing unit
before the liquid reenters the pump casing. This ingenious design evidently leads to a constant
drawn power from the impeller, as gas, apart for the small fraction soluble in the liquid medium is
never present around the impeller blade.
Mixing
Mixing times (tmix,95%) ranged from around 600-160 seconds when injecting a tracer into the
leg, and from around 140-35 seconds when the tracer slug was introduced through the degassing
unit. Mixing time could be correlated to volumetric flow and specific power input through (13) and
(14) respectively for mixing by leg injection.
(13)
(14)
And through (15) and (16) for mixing by top tank injection (=injection in the degasser)
(15)

AcceptedPrepri n
t
This article is protected by copyright. All rights reserved
(16)
A detailed presentation of the mixing time data is shown in figure 6. The mixing time is evidently
much shorter if the tracer is introduced into the degasser instead of directly into the U-shaped pipe.
This is not surprising when the magnitude of turbulence in the degassing unit is taken into
consideration.
The rather long mixing time when introducing the tracer in the leg, indicates a low extent of
mixing, which is consistent with the nearly ideal plug flow conditions one would expect locally in
the U-shaped part of the fermentor.
For the purpose of single cell protein production, where the primary nutrients (CH4 and O2)
have to be transferred from the gas phase to the liquid phase, and only trace concentrations of
minerals need to be blended from a continuous liquid feed, the mixing times measured in this study
are entirely satisfactory for both types of mixing.
While equation (13) and (15) show that an adequate degree of mixing is achieved at modest
volumetric flows, equation (14) and (16) indicate that a large power input is required. During
experiments the pressure drop recorded at point A on fig. 2 was less than 1⋅105 Pa. Localized
turbulence would logically not provide any beneficial effect on the mixing time (or mass transfer) in
the U-loop system as a whole, which means that an unnecessarily large power input is wasted in the
pump casing. A selection of a pump with a more suitable head will be beneficial for future designs,
and lead to a significant decrease in energy expenditure to achieve desired mixing times.
Mass Transfer
Gas-to-liquid mass transfer coefficient (kLa) values ranged from 400-3000 h-1
and could
through a least square regression be correlated to the superficial gas velocity (ug), the volumetric
flow and specific power input through (17) and (18) respectively.

AcceptedPrepri n
t
This article is protected by copyright. All rights reserved
(17)
(18)
In Eq. (17) and (18) kLa is in h-1
, and QG is in m3h
-1 while all other parameters are in SI units. A
detailed presentation of the mass transfer data is shown in figure 7. The mass transfer values are
extraordinarily high for a vessel of the size used in this study. While equation (17) shows that a
large mass transfer coefficient can be achieved at modest volumetric flows and superficial gas
velocities, equation (18) indicates that a very large power input is required. This result is similar to
the observations made in the previous section. If another centrifugal pump was used with the same
impeller, capable of delivering the same volumetric flow, but with a different casing enabling it to
overcome a gauge pressure loss of 1.5⋅105 Pa (50% more than the highest value measured in this
study) instead of 4⋅105 Pa, a threefold reduction in power input could be expected (SANWA,
private communication).
For an STR where the height (H) equals the diameter (Dv), the gas to liquid mass transfer
coefficient can be expressed by (19) (Van’t Riet, 1979).
(19)
If the height (H) is twice the diameter (Dv), the gas to liquid mass transfer in an STR follows (20)
(Vasconcelos et al., 2000).
(20)
A comparison between Eq. (18), (19) and (20) is shown in figure 8 (A-D). Figures A and B show
that with the high head centrifugal pump, the performance of the U-loop fermenter is similar to an
STR with H=Dv and the mass transfer is in fact better in an STR with H=2Dv if all vessels are

AcceptedPrepri n
t
This article is protected by copyright. All rights reserved
aerated with the same superficial gas velocity. However if a more suitable centrifugal pump capable
of overcoming a smaller pressure loss (1.5⋅105 Pa instead of 4⋅10
5 Pa) is used, the U-loop
fermenter with ug ≥ 0.15ms-1
starts outperforming conventional systems, even at modest power
inputs.
When looking at the data one must not forget that the design of the U-loop fermenter allows
very high superficial gas velocities to be achieved at very modest volumetric gas flow rates; for
example aerating a 0.15 m3 U-loop fermenter with 1 vvm achieves the same superficial gas velocity
as an 0.15 m3 STR with H=2Dv aerated with ~17.3 vvm and an 0.15 m
3 STR with H=Dv aerated
with ~27.4vvm. Aerating a 0.15 m3 STR with such high volumetric gas flow would lead to flooding
unless a massive energy input is transmitted to the mixing aggregate. Figure 8 (C and D) shows that
much higher kLa values than those of STRs can be achieved in the U-loop fermenter at similar
volumetric gas flow rates and even with the pump used in this study. In an STR the liquid phase is
more or less considered to be well mixed, but the gas phase is neither well mixed nor in plug flow
through the liquid (unless the gas hold up is very small). In the U-loop reactor the gas and liquid
follow each other in plug flow, Due to the long hold up time of the liquid the concentrations in the
liquid phase are almost constant throughout the loop, but the gas phase loses reactants O2 and CH4
as in a plug flow reactor (i.e. by first order reaction kinetics) as soon as the process becomes limited
by mass transfer by the continuously decreasing cl*.
The mass transfer values found in this study are much higher than the ones found in
previous studies of similar systems (Ziegler et al., 1977). Earlier tubular loop reactors were not
equipped with static mixing devices and relied solely on gas holdup and turbulence to generate
mass transfer. Evidently the static mixing devices used in this study facilitate an exceptionally high
interfacial area “a” as kL is not expected to change.
For an STR where the impeller is replaced with a forced flow recirculation loop, and
mixing/mass transfer is facilitated by allowing gas/liquid from the loop to pass through a rotary jet
head, the gas-liquid mass transfer coefficient can be expressed by (21) (Nordkvist et al., 2003).

AcceptedPrepri n
t
This article is protected by copyright. All rights reserved
(21)
The system is very similar to the one investigated in this study, and Eq. (17) is strikingly similar to
(21). The U-loop fermenter does however outperform the rotary jet heads as is evident in figure 9.
This can probably be attributed to a larger gas-volume fraction in the loop part of the U-loop
fermenter, and the good performance generally noted for static mixing devices.
Conclusion
The U-loop fermenter evidently handles the process requirement for a large volumetric gas
fraction quite well. The ingenious design of introducing gas into the system after the pump and
stripping it before the liquid re-enters the pump casing, results in little or no difference between the
gassed and un-gassed power numbers, even at high volumetric gas fractions and aeration numbers.
Mixing times of 600-35 seconds which satisfied the process demands and very high mass
transfer coefficients of 400-3000 h-1
could be achieved at modest volumetric flow rates within the
experimental range of 6.95⋅10-3
-1.41⋅10-2
m3⋅s
-1 studied. The design of the U-loop allowed for
high superficial gas velocities to be achieved at modest volumetric gas flow rates, which meant that
the system still outperformed a traditional stirred tank even with the over-dimensioned pump used
in this study.
Proper dimensioning of the pump proved to be of utmost importance as a pump with a larger
head than needed leads to an unnecessarily large power input requirement (7500-29000 W⋅m-3
) to
achieve mixing and mass transfer.
As mixing time and mass transfer were correlated to the drawn power input at a constant
volume (V=0.15 m3) it would be highly interesting to investigate whether these equations apply to
other reactor volumes outside the experimental range used in this study.

AcceptedPrepri n
t
This article is protected by copyright. All rights reserved
Nomenclature
Notation
Symbol name unit
cl* Oxygen saturation mol⋅m
-3
D Impeller diameter m
Dv Tank Diameter m
E Normalized pH
H Liquid height m
HO Henrys constant for oxygen in water at 25°C m3⋅Pa⋅mol
-1
[H2O2] Feed concentration of hydrogen peroxide mol⋅m-3
kLa Oxygen mass transfer coefficient h-1
kmix Mixing constant s-1
m Degree of mixing
N Rotations of the impeller rps (s-1
)
NA Aeration number
NP Power number
NP,g Gassed power number
NQ Flow number
NQ,g Gassed flow number
P Drawn power W
Pg Gassed drawn power W
p Gauge pressure Pa
pO2 Dissolved oxygen tension %
pO2exit
Oxygen volume fraction in exhaust gas %
pO2sat
Dissolved oxygen tension at saturation %
Q Volumetric liquid flow rate m3⋅s
-1

AcceptedPrepri n
t
This article is protected by copyright. All rights reserved
QH2O2 Volumetric feed flow rate of H2O2 m3⋅h
-1
Qg Volumetric gas flow rate m3⋅s
-1
QG Gassed Volumetric liquid flow rate m3⋅s
-1
Re Reynolds number
STR Stirred tank reactor
T Temperature °C
t Time s
tmix Mixing time (95%) s
ug Superficial gas velocity m⋅s-1
V Volume m3
vvm Volume gas pr. volume liquid pr. minute m3⋅min
-1⋅m-3
X stoichiometric symbol for biomass
Greek letters
Δp Gauge pressure difference Pa
μ Specific growth rate h-1
ρl Liquid density kg⋅m-3
AcceptedPrepri n
t
This article is protected by copyright. All rights reserved
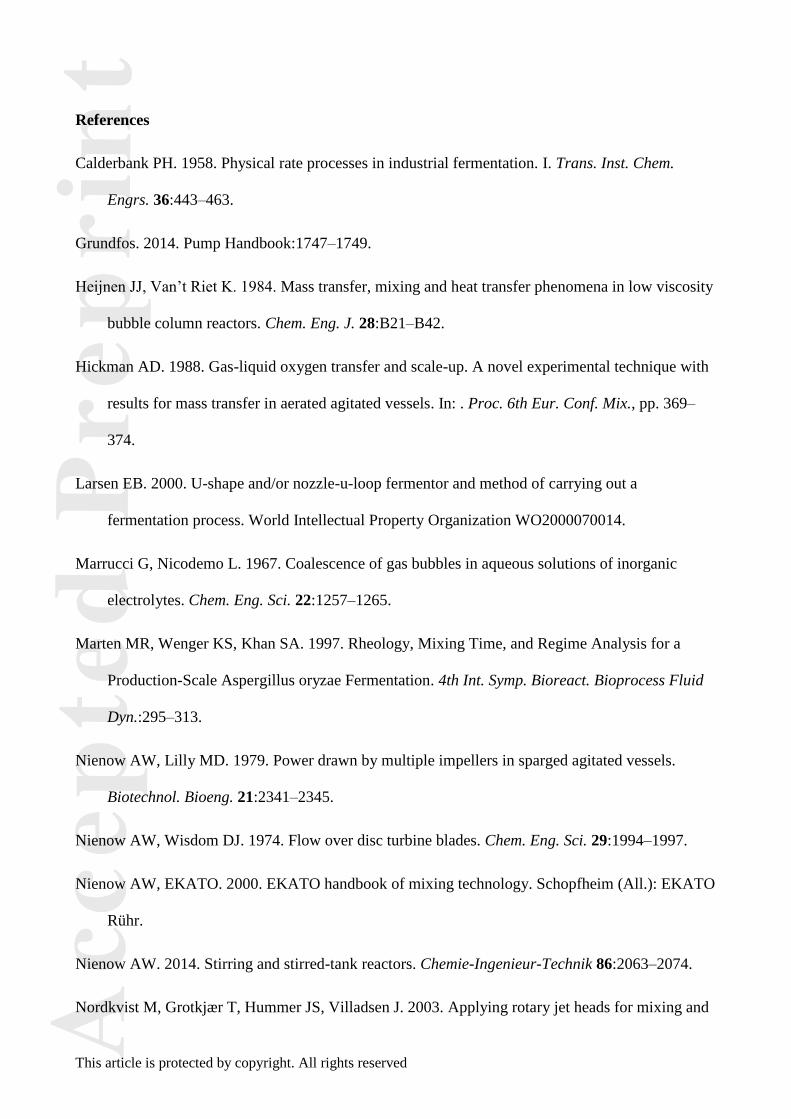
References
Calderbank PH. 1958. Physical rate processes in industrial fermentation. I. Trans. Inst. Chem.
Engrs. 36:443–463.
Grundfos. 2014. Pump Handbook:1747–1749.
Heijnen JJ, Van’t Riet K. 1984. Mass transfer, mixing and heat transfer phenomena in low viscosity
bubble column reactors. Chem. Eng. J. 28:B21–B42.
Hickman AD. 1988. Gas-liquid oxygen transfer and scale-up. A novel experimental technique with
results for mass transfer in aerated agitated vessels. In: . Proc. 6th Eur. Conf. Mix., pp. 369–
374.
Larsen EB. 2000. U-shape and/or nozzle-u-loop fermentor and method of carrying out a
fermentation process. World Intellectual Property Organization WO2000070014.
Marrucci G, Nicodemo L. 1967. Coalescence of gas bubbles in aqueous solutions of inorganic
electrolytes. Chem. Eng. Sci. 22:1257–1265.
Marten MR, Wenger KS, Khan SA. 1997. Rheology, Mixing Time, and Regime Analysis for a
Production-Scale Aspergillus oryzae Fermentation. 4th Int. Symp. Bioreact. Bioprocess Fluid
Dyn.:295–313.
Nienow AW, Lilly MD. 1979. Power drawn by multiple impellers in sparged agitated vessels.
Biotechnol. Bioeng. 21:2341–2345.
Nienow AW, Wisdom DJ. 1974. Flow over disc turbine blades. Chem. Eng. Sci. 29:1994–1997.
Nienow AW, EKATO. 2000. EKATO handbook of mixing technology. Schopfheim (All.): EKATO
Rühr.
Nienow AW. 2014. Stirring and stirred-tank reactors. Chemie-Ingenieur-Technik 86:2063–2074.
Nordkvist M, Grotkjær T, Hummer JS, Villadsen J. 2003. Applying rotary jet heads for mixing and

AcceptedPrepri n
t
This article is protected by copyright. All rights reserved
mass transfer in a forced recirculation tank reactor system. Chem. Eng. Sci. 58:3877–3890.
Paul EL, Atiemo-Obeng VA, Kresta SM. 2004. Handbook of industrial mixing: science and
practice. John Wiley & Sons.
Russell TWF, Dunn IJ, Blanch HW. 1974. The tubular loop batch fermentor: Basic concepts.
Biotechnol. Bioeng. 16:1261–1272.
Sander R. 2015. Compilation of Henry’s law constants (version 4.0) for water as solvent. Atmos.
Chem. Phys. 15:4399–4981.
Van’t Riet K. 1979. Review of Measuring Methods and Results in Nonviscous Gas-Liquid Mass
Transfer in Stirred Vessels. Ind. Eng. Chem. Process Des. Dev. 18:357–364.
Vasconcelos JMT, Orvalho SCP, Rodrigues AM a. F, Alves SS. 2000. Effect of Blade Shape on the
Performance of Six-Bladed Disk Turbine Impellers. Ind. Eng. Chem. Res. 39:203–213.
Vasconcelos JMT, Alves SS, Nienow AW, Bujalski W. 1998. Scale-up of mixing in gassed multi-
turbine agitated vessels. Can. J. Chem. Eng. 76:398–404.
Villadsen J, Nielsen JH, Lidén G. 2011. Bioreaction Engineering Principles 3rd ed. Springer US.
Westerterp KR, van Dierendonck LL, de Kraa JA. 1963. Interfacial areas in agitated gas-liquid
contactors. Chem. Eng. Sci. 18:157–176.
Ziegler H, Meister D, Dunn IJ. 1977. The tubular loop fermentor: oxygen transfer, growth kinetics,
and design. Biotechnol. Bioeng. 19:507–525.

AcceptedPrepri n
t
This article is protected by copyright. All rights reserved
Table I: A selection of power numbers (Np), gassed power numbers (Np,g), flow numbers (NQ),
gassed flow numbers (NQ,g) found during experiments in the 0.15 m3 U-loop fermenter at increasing
aeration numbers (NA).
NP / NPg NA NQ / NQ,g
0.2009 0.0000 0.0043
0.2009 0.0200 0.0042
0.2004 0.0410 0.0041
0.1994 0.0605 0.0043
0.1981 0.0938 0.0042
0.1975 0.1012 0.0044
0.1989 0.1207 0.0043
0.1967 0.1661 0.0044
0.1946 0.1988 0.0045
0.1939 0.2438 0.0046

AcceptedPrepri n
t
This article is protected by copyright. All rights reserved
Figures:
AcceptedPrepri n
t
This article is protected by copyright. All rights reserved
Figure 1

AcceptedPrepri n
t
This article is protected by copyright. All rights reserved
Figure 2

AcceptedPrepri n
t
This article is protected by copyright. All rights reserved
Figure 3

AcceptedPrepri n
t
This article is protected by copyright. All rights reserved
Figure 4
AcceptedPrepri n
t
This article is protected by copyright. All rights reserved
Figure 5

AcceptedPrepri n
t
This article is protected by copyright. All rights reserved
Figure 6

AcceptedPrepri n
t
This article is protected by copyright. All rights reserved
Figure 7

AcceptedPrepri n
t
This article is protected by copyright. All rights reserved
Figure 8

AcceptedPrepri n
t
This article is protected by copyright. All rights reserved
Figure 9