Mixed Methods Research
20
Mixed Methods Research n J. Carolyn Graff n My ideas have undergone a process of emergence by emergency. When they are needed badly enough, they are accepted. —Richard Buckminster Fuller n Objectives: n Discuss the emergence, purpose, and characteristics of mixed meth- ods research. n Describe the designs and decisions related to selecting a design in mixed methods research. n Discuss issues related to research questions, sampling, measurement, and analysis in mixed methods research. n Consider opportunities for conducting mixed methods research. n Introduction Mixed methods has emerged in the social and behavioral sciences during the past two decades, joining qualitative and quantitative methods of schol- arly inquiry as the “third research community” (Teddlie & Tashakkori, 2009, p. 4). Quantitative researchers typically focus on numeric data and analyses; qualitative researchers typically focus on narrative data and analyses; and mixed methods researchers focus on numeric and narrative data and analyses. The paradigm or worldview that researchers work in is most often consistent with their beliefs about the nature of reality, their philosophical views, and the scientific field or scholarly community they are part of. In other words, researchers tend to work from perspectives that allow them to explore and examine the problems and issues that are consistent with their own beliefs and views and that are most important to their scholarly community (Teddlie & Tashakkori, 2009). 45 CHAPTER 3 © Jones & Bartlett Learning, LLC. NOT FOR SALE OR DISTRIBUTION.
Transcript of Mixed Methods Research

Mixed Methods Research
n J. Carolyn Graff n
My ideas have undergone a process of emergence by emergency. When they are needed badly enough, they are accepted.
—Richard Buckminster Fuller
n Objectives: n Discuss the emergence, purpose, and characteristics of mixed meth-
ods research. n Describe the designs and decisions related to selecting a design in
mixed methods research. n Discuss issues related to research questions, sampling, measurement,
and analysis in mixed methods research. n Consider opportunities for conducting mixed methods research.
n IntroductionMixed methods has emerged in the social and behavioral sciences during the past two decades, joining qualitative and quantitative methods of schol-arly inquiry as the “third research community” (Teddlie & Tashakkori, 2009, p. 4). Quantitative researchers typically focus on numeric data and analyses; qualitative researchers typically focus on narrative data and analyses; and mixed methods researchers focus on numeric and narrative data and analyses. The paradigm or worldview that researchers work in is most often consistent with their beliefs about the nature of reality, their philosophical views, and the scientific field or scholarly community they are part of. In other words, researchers tend to work from perspectives that allow them to explore and examine the problems and issues that are consistent with their own beliefs and views and that are most important to their scholarly community (Teddlie & Tashakkori, 2009).
45
Chapter 3
© Jones & Bartlett Learning, LLC. NOT FOR SALE OR DISTRIBUTION.
© Jones & Bartlett Learning, LLCNOT FOR SALE OR DISTRIBUTION
© Jones & Bartlett Learning, LLCNOT FOR SALE OR DISTRIBUTION
© Jones & Bartlett Learning, LLCNOT FOR SALE OR DISTRIBUTION
© Jones & Bartlett Learning, LLCNOT FOR SALE OR DISTRIBUTION
© Jones & Bartlett Learning, LLCNOT FOR SALE OR DISTRIBUTION
© Jones & Bartlett Learning, LLCNOT FOR SALE OR DISTRIBUTION
© Jones & Bartlett Learning, LLCNOT FOR SALE OR DISTRIBUTION
© Jones & Bartlett Learning, LLCNOT FOR SALE OR DISTRIBUTION
© Jones & Bartlett Learning, LLCNOT FOR SALE OR DISTRIBUTION
© Jones & Bartlett Learning, LLCNOT FOR SALE OR DISTRIBUTION
© Jones & Bartlett Learning, LLCNOT FOR SALE OR DISTRIBUTION
© Jones & Bartlett Learning, LLCNOT FOR SALE OR DISTRIBUTION
© Jones & Bartlett Learning, LLCNOT FOR SALE OR DISTRIBUTION
© Jones & Bartlett Learning, LLCNOT FOR SALE OR DISTRIBUTION
© Jones & Bartlett Learning, LLCNOT FOR SALE OR DISTRIBUTION
© Jones & Bartlett Learning, LLCNOT FOR SALE OR DISTRIBUTION
© Jones & Bartlett Learning, LLCNOT FOR SALE OR DISTRIBUTION
© Jones & Bartlett Learning, LLCNOT FOR SALE OR DISTRIBUTION
© Jones & Bartlett Learning, LLCNOT FOR SALE OR DISTRIBUTION
© Jones & Bartlett Learning, LLCNOT FOR SALE OR DISTRIBUTION

Quantitative researchers most often work from the positivist paradigm or the post-positivist paradigm. Research conducted from positivism is expected to be objective, free of values, hypothesis driven, and measurable. Positivists use deductive reasoning and seek to find causes that precede, or occur at the same time as, effects. The post-positivist paradigm has replaced positivism (Schwandt, 1997) or follows positivism as “the (current) predominant philosophy for (quantitative) research in the human sci-ences” (Teddlie & Tashakkori, 2009, p. 69). Research consistent with postpositivism is influenced by researchers’ values and their chosen theory or conceptual framework. According to the postpositivist paradigm, facts cannot necessarily prove a theory and determine a cause. Reality is socially constructed, and internal and external validity are both important.
Qualitative researchers work mostly from the constructivist (or interpretivist) para digm, which supports the notion that there are many realities that are constructed as the researcher engages with participants. Realities are constructed by participants and researchers who seek to understand participants’ points of view. Observations of reality are influenced by researchers’ values. Multiple realities exist, and our under-standing of these realities is constructed individually and socially. Constructivists believe that determining a connection between cause and effect is impossible; there-fore, description of reality is important. Qualitative researchers engage in inductive reasoning as they work from units of data toward a theory, or as they work from the specific or particular to the general. Statements about reality are limited to the time and context of the study, so generalizability is limited to transferability of results from one context to another (Teddlie & Tashakkori, 2009).
Philosophical differences between positivist/postpositivist and constructivist para-digms contributed to tension, or “paradigm wars” (Tashakkori & Teddlie, 1998, p. 3), between qualitative and quantitative researchers. Qualitative researchers
stress the socially constructed nature of reality, the intimate relationship between the researcher and what is studied, and . . . emphasize the value-laden nature of inquiry. . . [Qualitative researchers note that] quantitative studies emphasize the measurement and analysis of causal relationships between variables, not processes . . . within a value-free framework. (Denzin & Lincoln, 2005, p. 10)
As social science has grown and evolved during the 1960s and 1970s, scholars began debating issues around quantitative methods. For example, Cook and Campbell (1979) and Cronbach (1982) discussed the importance of the research setting. Their debate focused on a controlled setting that was important to positivists and a natural setting that was important to constructivists (Tashakkori & Teddlie, 1998).
By the 1990s, support for mixed methods increased as the contribution of both quantitative and qualitative methods to address complex research problems became more evident and the number of mixed methods studies increased. Researchers began pointing to the similarities between the qualitative and quantitative approaches and calling for recognition that the divide between qualitative “purists” and quantitative “purists” was exaggerated (Tashakkori & Teddlie, 1998).
46 n Chapter 3 Mixed Methods Research
© Jones & Bartlett Learning, LLC. NOT FOR SALE OR DISTRIBUTION.
© Jones & Bartlett Learning, LLCNOT FOR SALE OR DISTRIBUTION
© Jones & Bartlett Learning, LLCNOT FOR SALE OR DISTRIBUTION
© Jones & Bartlett Learning, LLCNOT FOR SALE OR DISTRIBUTION
© Jones & Bartlett Learning, LLCNOT FOR SALE OR DISTRIBUTION
© Jones & Bartlett Learning, LLCNOT FOR SALE OR DISTRIBUTION
© Jones & Bartlett Learning, LLCNOT FOR SALE OR DISTRIBUTION
© Jones & Bartlett Learning, LLCNOT FOR SALE OR DISTRIBUTION
© Jones & Bartlett Learning, LLCNOT FOR SALE OR DISTRIBUTION
© Jones & Bartlett Learning, LLCNOT FOR SALE OR DISTRIBUTION
© Jones & Bartlett Learning, LLCNOT FOR SALE OR DISTRIBUTION
© Jones & Bartlett Learning, LLCNOT FOR SALE OR DISTRIBUTION
© Jones & Bartlett Learning, LLCNOT FOR SALE OR DISTRIBUTION
© Jones & Bartlett Learning, LLCNOT FOR SALE OR DISTRIBUTION
© Jones & Bartlett Learning, LLCNOT FOR SALE OR DISTRIBUTION
© Jones & Bartlett Learning, LLCNOT FOR SALE OR DISTRIBUTION
© Jones & Bartlett Learning, LLCNOT FOR SALE OR DISTRIBUTION
© Jones & Bartlett Learning, LLCNOT FOR SALE OR DISTRIBUTION
© Jones & Bartlett Learning, LLCNOT FOR SALE OR DISTRIBUTION
© Jones & Bartlett Learning, LLCNOT FOR SALE OR DISTRIBUTION
© Jones & Bartlett Learning, LLCNOT FOR SALE OR DISTRIBUTION

Howe (1988) proposed that the paradigm pragmatism replace the debate around an incompatibility between qualitative and quantitative methods. Similar points that compatibility and partnership could exist between these two methods were made by others (Brewer & Hunter, 1989; Reichardt & Rallis, 1994). Many social and behav-ioral scientists have beliefs that are distinct and separate from positivism, postposi-tivism, or constructivism. Pragmatism allows researchers to “study what interests and is of value to (them), study it in the different ways that (they) deem appropriate, and use the results in ways that can bring about positive consequences within (their) value system” (Tashakkori & Teddlie, 1998, p. 30).
Working from the pragmatist paradigm, mixed methods researchers accept the idea that qualitative and quantitative methods are indeed compatible (Howe, 1988). These researchers are not required to choose between qualitative or quantitative methods. Instead, they determine how both qualitative and quantitative methods will answer their research questions. Inductive and deductive reasoning are used, and hypotheses may be proposed. Mixed methods researchers work with participants from an objective or subjective point of view, depending on whether they are engaged in the qualitative or quantitative aspect of the study. Values play an important role in determining what mixed methods researchers study, how the study is designed, and how data are analyzed (Tashakkori & Teddlie, 1998).
Pragmatists view reality from two perspectives. One reality is consistent with the positivists’ and postpositivists’ views of reality. That is, there is a reality outside the human that can be observed, measured, and understood to some extent. Pragmatists’ second perspective of reality is that there is no one truth, but there are several expla-nations of reality. Researchers who are pragmatists choose the best explanation that makes sense within their value system. Cause and effect relationships exist but are changing and difficult to identify. Internal validity and credibility are important to pragmatists. Regarding generalization of findings, pragmatists place importance on external validity and transferability of findings, along with the idea that hypotheses are tied to time and context (Teddlie & Tashakkori, 2009).
n Purpose and Characteristics of Mixed Methods ResearchGreene, Caracelli, and Graham (1989) identified the purposes of mixed methods research as triangulation, complementarity, development, initiation, and expan-sion based on their reviews of mixed methods studies. Triangulation of qualitative and quantitative methods (Jick, 1979; Patton, 1980) is considered an antecedent to mixed methods as it is known today (Creswell, 2011). Triangulation involves the use of qualitative and quantitative methods in an effort to reach convergence of find-ings. Complementarity refers to the use of qualitative and quantitative methods to examine the overlapping and different facets of a phenomenon in order to obtain a more meaningful understanding of the phenomenon. Development involves using one method after the other so that the first method guides the second in terms of decisions made about sampling, measurement, and implementation. Initiation occurs in mixed
Purpose and Characteristics of Mixed Methods Research n 47
© Jones & Bartlett Learning, LLC. NOT FOR SALE OR DISTRIBUTION.
© Jones & Bartlett Learning, LLCNOT FOR SALE OR DISTRIBUTION
© Jones & Bartlett Learning, LLCNOT FOR SALE OR DISTRIBUTION
© Jones & Bartlett Learning, LLCNOT FOR SALE OR DISTRIBUTION
© Jones & Bartlett Learning, LLCNOT FOR SALE OR DISTRIBUTION
© Jones & Bartlett Learning, LLCNOT FOR SALE OR DISTRIBUTION
© Jones & Bartlett Learning, LLCNOT FOR SALE OR DISTRIBUTION
© Jones & Bartlett Learning, LLCNOT FOR SALE OR DISTRIBUTION
© Jones & Bartlett Learning, LLCNOT FOR SALE OR DISTRIBUTION
© Jones & Bartlett Learning, LLCNOT FOR SALE OR DISTRIBUTION
© Jones & Bartlett Learning, LLCNOT FOR SALE OR DISTRIBUTION
© Jones & Bartlett Learning, LLCNOT FOR SALE OR DISTRIBUTION
© Jones & Bartlett Learning, LLCNOT FOR SALE OR DISTRIBUTION
© Jones & Bartlett Learning, LLCNOT FOR SALE OR DISTRIBUTION
© Jones & Bartlett Learning, LLCNOT FOR SALE OR DISTRIBUTION
© Jones & Bartlett Learning, LLCNOT FOR SALE OR DISTRIBUTION
© Jones & Bartlett Learning, LLCNOT FOR SALE OR DISTRIBUTION
© Jones & Bartlett Learning, LLCNOT FOR SALE OR DISTRIBUTION
© Jones & Bartlett Learning, LLCNOT FOR SALE OR DISTRIBUTION
© Jones & Bartlett Learning, LLCNOT FOR SALE OR DISTRIBUTION
© Jones & Bartlett Learning, LLCNOT FOR SALE OR DISTRIBUTION

methods when paradoxes are discovered; consistencies and discrepancies in qualita-tive and quantitative findings are compared and analyzed for new perspectives and insights that can yield new questions. Expansion occurs as qualitative and quantitative components are included in a study to increase its scope and breadth.
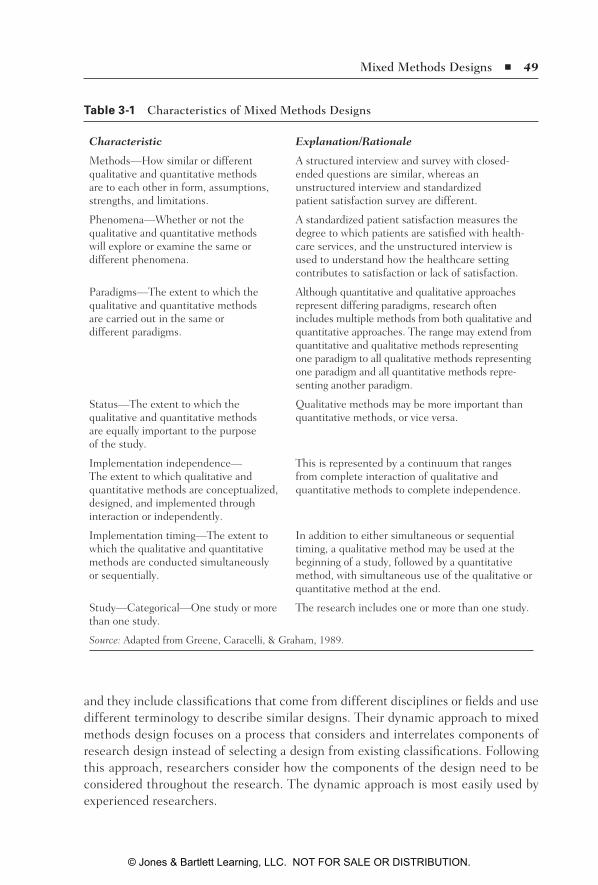
Greene et al. (1989) also identified characteristics of mixed methods designs that can be useful to researchers as they determine which mixed methods design will be used. These characteristics include methods, phenomena, paradigms, status, imple-mentation independence, implementation timing, and study (see Table 3-1). Greene et al. contributed to an increased understanding of mixed methods research as they focused on purpose, paradigm issues, data analysis strategies, and usefulness.
Creswell and Plano Clark (2011) identified core characteristics of mixed methods research. The researcher:
n Collects and analyzes persuasively and rigorously both qualitative and quan-titative data (based on research questions)
n Mixes (or integrates or links) the two forms of data concurrently by combin-ing them (or merging them), by having one build on the other sequentially, or by embedding one within the other
n Gives priority to one or to both forms of data (in terms of what the research emphasizes)
n Uses these procedures in a single study or in multiple phases of a program of study
n Frames these procedures within philosophical worldviews and theoretical lenses
n Combines the procedures into specific research designs that direct the plan for conducting the study. (p. 5)
Mixed methods research offers a practical approach to addressing research problems and questions and the potential for increased applicability because these problems and questions are examined in different ways. After considering the purposes of mixed methods and the characteristics that can be useful in determining which design to use, specific types of designs will be discussed, and selected studies exemplifying these designs will be presented.
n Mixed Methods DesignsKey principles to follow when designing a study include (a) deciding on the type of design; (b) identifying the design approach to use; (c) matching the design to the study’s problem, purpose, and questions; and (d) being clear about the reason for using mixed methods (Creswell & Plano Clark, 2011, p. 54). Deciding on the type of design means that the researcher makes a decision about using qualitative and quantitative methods before the research is started (fixed mixed methods design) or adds a second method after the study has begun (emergent mixed methods design). Creswell and Plano Clark’s (2011) design approaches are typology based and dynamic,
48 n Chapter 3 Mixed Methods Research
© Jones & Bartlett Learning, LLC. NOT FOR SALE OR DISTRIBUTION.
© Jones & Bartlett Learning, LLCNOT FOR SALE OR DISTRIBUTION
© Jones & Bartlett Learning, LLCNOT FOR SALE OR DISTRIBUTION
© Jones & Bartlett Learning, LLCNOT FOR SALE OR DISTRIBUTION
© Jones & Bartlett Learning, LLCNOT FOR SALE OR DISTRIBUTION
© Jones & Bartlett Learning, LLCNOT FOR SALE OR DISTRIBUTION
© Jones & Bartlett Learning, LLCNOT FOR SALE OR DISTRIBUTION
© Jones & Bartlett Learning, LLCNOT FOR SALE OR DISTRIBUTION
© Jones & Bartlett Learning, LLCNOT FOR SALE OR DISTRIBUTION
© Jones & Bartlett Learning, LLCNOT FOR SALE OR DISTRIBUTION
© Jones & Bartlett Learning, LLCNOT FOR SALE OR DISTRIBUTION
© Jones & Bartlett Learning, LLCNOT FOR SALE OR DISTRIBUTION
© Jones & Bartlett Learning, LLCNOT FOR SALE OR DISTRIBUTION
© Jones & Bartlett Learning, LLCNOT FOR SALE OR DISTRIBUTION
© Jones & Bartlett Learning, LLCNOT FOR SALE OR DISTRIBUTION
© Jones & Bartlett Learning, LLCNOT FOR SALE OR DISTRIBUTION
© Jones & Bartlett Learning, LLCNOT FOR SALE OR DISTRIBUTION
© Jones & Bartlett Learning, LLCNOT FOR SALE OR DISTRIBUTION
© Jones & Bartlett Learning, LLCNOT FOR SALE OR DISTRIBUTION
© Jones & Bartlett Learning, LLCNOT FOR SALE OR DISTRIBUTION
© Jones & Bartlett Learning, LLCNOT FOR SALE OR DISTRIBUTION
and they include classifications that come from different disciplines or fields and use different terminology to describe similar designs. Their dynamic approach to mixed methods design focuses on a process that considers and interrelates components of research design instead of selecting a design from existing classifications. Following this approach, researchers consider how the components of the design need to be considered throughout the research. The dynamic approach is most easily used by experienced researchers.
table 3-1 Characteristics of Mixed Methods Designs
Characteristic Explanation/Rationale
Methods—How similar or different qualitative and quantitative methods are to each other in form, assumptions, strengths, and limitations.
A structured interview and survey with closed-ended questions are similar, whereas an unstructured interview and standardized patient satisfaction survey are different.
Phenomena—Whether or not the qualitative and quantitative methods will explore or examine the same or different phenomena.
A standardized patient satisfaction measures the degree to which patients are satisfied with health-care services, and the unstructured interview is used to understand how the healthcare setting contributes to satisfaction or lack of satisfaction.
Paradigms—The extent to which the qualitative and quantitative methods are carried out in the same or different paradigms.
Although quantitative and qualitative approaches represent differing paradigms, research often includes multiple methods from both qualitative and quantitative approaches. The range may extend from quantitative and qualitative methods representing one paradigm to all qualitative methods representing one paradigm and all quantitative methods repre-senting another paradigm.
Status—The extent to which the qualitative and quantitative methods are equally important to the purpose of the study.
Qualitative methods may be more important than quantitative methods, or vice versa.
Implementation independence— The extent to which qualitative and quantitative methods are conceptualized, designed, and implemented through interaction or independently.
This is represented by a continuum that ranges from complete interaction of qualitative and quantitative methods to complete independence.
Implementation timing—The extent to which the qualitative and quantitative methods are conducted simultaneously or sequentially.
In addition to either simultaneous or sequential timing, a qualitative method may be used at the beginning of a study, followed by a quantitative method, with simultaneous use of the qualitative or quantitative method at the end.
Study—Categorical—One study or more than one study.
The research includes one or more than one study.
Source: Adapted from Greene, Caracelli, & Graham, 1989.
Mixed Methods Designs n 49
© Jones & Bartlett Learning, LLC. NOT FOR SALE OR DISTRIBUTION.
© Jones & Bartlett Learning, LLCNOT FOR SALE OR DISTRIBUTION
© Jones & Bartlett Learning, LLCNOT FOR SALE OR DISTRIBUTION
© Jones & Bartlett Learning, LLCNOT FOR SALE OR DISTRIBUTION
© Jones & Bartlett Learning, LLCNOT FOR SALE OR DISTRIBUTION
© Jones & Bartlett Learning, LLCNOT FOR SALE OR DISTRIBUTION
© Jones & Bartlett Learning, LLCNOT FOR SALE OR DISTRIBUTION
© Jones & Bartlett Learning, LLCNOT FOR SALE OR DISTRIBUTION
© Jones & Bartlett Learning, LLCNOT FOR SALE OR DISTRIBUTION
© Jones & Bartlett Learning, LLCNOT FOR SALE OR DISTRIBUTION
© Jones & Bartlett Learning, LLCNOT FOR SALE OR DISTRIBUTION
© Jones & Bartlett Learning, LLCNOT FOR SALE OR DISTRIBUTION
© Jones & Bartlett Learning, LLCNOT FOR SALE OR DISTRIBUTION
© Jones & Bartlett Learning, LLCNOT FOR SALE OR DISTRIBUTION
© Jones & Bartlett Learning, LLCNOT FOR SALE OR DISTRIBUTION
© Jones & Bartlett Learning, LLCNOT FOR SALE OR DISTRIBUTION
© Jones & Bartlett Learning, LLCNOT FOR SALE OR DISTRIBUTION
© Jones & Bartlett Learning, LLCNOT FOR SALE OR DISTRIBUTION
© Jones & Bartlett Learning, LLCNOT FOR SALE OR DISTRIBUTION
© Jones & Bartlett Learning, LLCNOT FOR SALE OR DISTRIBUTION
© Jones & Bartlett Learning, LLCNOT FOR SALE OR DISTRIBUTION

Matching the design to the research problem, purpose, and questions is a crucial aspect of mixed methods research design. Recalling that the pragmatist paradigm serves as the philosophical base for mixed methods, researchers choose the design that best addresses the research problem and research questions. Researchers should thoughtfully generate the research problem and research questions and use sound reasoning when selecting a design.
Mixed Methods Designs TerminologyThe mixed methods research notation system was developed by Morse (1991) and is still used in mixed methods research. The Morse notation system (Table 3-2) indi-cates whether the project has a qualitative (QUAL) or quantitative (QUAN) orienta-tion, which aspect of the research design is dominant (QUAL or QUAN) and which is less dominant (qual or quan), and whether the projects are carried out simultane-ously (QUAL + quan) or sequentially (QUAN R qual).
Different terminology is used by some researchers who have built on the Morse system. Teddlie and Tashakkori (2009) consider the term parallel mixed designs to be more inclusive than simultaneous designs. They noted that the term parallel mixed methods design allows for QUAL and QUAN data to be collected at the same time
table 3-2 Terminology for Mixed Methods Research Designs
Notations
QUAL indicates a qualitatively oriented project
QUAN indicates a quantitatively oriented project
+ indicates projects that are conducted simultaneously
R indicates projects that are conducted sequentially
Uppercase (QUAL or QUAN) indicates a dominant project
Lowercase (qual or quan) indicates a less dominant project
Simultaneous designs
QUAL + qual indicates a qualitatively oriented, qualitative simultaneous design
QUAN + quan indicates a quantitatively oriented, quantitative simultaneous design
QUAL + quan indicates a qualitatively oriented, qualitative and quantitative simultaneous design
QUAN + qual indicates a quantitatively oriented, quantitative and qualitative simultaneous design
Sequential designs
QUAL R qual indicates a qualitatively oriented project followed by a second qualitative project
QUAN R quan indicates a quantitatively oriented project followed by a second quantitative project
QUAL R quan indicates a qualitatively oriented project followed by a quantitative project
QUAN R qual indicates a quantitatively oriented project followed by a qualitative project
Sources: Adapted from Morse, 1991, and Morse, 2003.
50 n Chapter 3 Mixed Methods Research
© Jones & Bartlett Learning, LLC. NOT FOR SALE OR DISTRIBUTION.
© Jones & Bartlett Learning, LLCNOT FOR SALE OR DISTRIBUTION
© Jones & Bartlett Learning, LLCNOT FOR SALE OR DISTRIBUTION
© Jones & Bartlett Learning, LLCNOT FOR SALE OR DISTRIBUTION
© Jones & Bartlett Learning, LLCNOT FOR SALE OR DISTRIBUTION
© Jones & Bartlett Learning, LLCNOT FOR SALE OR DISTRIBUTION
© Jones & Bartlett Learning, LLCNOT FOR SALE OR DISTRIBUTION
© Jones & Bartlett Learning, LLCNOT FOR SALE OR DISTRIBUTION
© Jones & Bartlett Learning, LLCNOT FOR SALE OR DISTRIBUTION
© Jones & Bartlett Learning, LLCNOT FOR SALE OR DISTRIBUTION
© Jones & Bartlett Learning, LLCNOT FOR SALE OR DISTRIBUTION
© Jones & Bartlett Learning, LLCNOT FOR SALE OR DISTRIBUTION
© Jones & Bartlett Learning, LLCNOT FOR SALE OR DISTRIBUTION
© Jones & Bartlett Learning, LLCNOT FOR SALE OR DISTRIBUTION
© Jones & Bartlett Learning, LLCNOT FOR SALE OR DISTRIBUTION
© Jones & Bartlett Learning, LLCNOT FOR SALE OR DISTRIBUTION
© Jones & Bartlett Learning, LLCNOT FOR SALE OR DISTRIBUTION
© Jones & Bartlett Learning, LLCNOT FOR SALE OR DISTRIBUTION
© Jones & Bartlett Learning, LLCNOT FOR SALE OR DISTRIBUTION
© Jones & Bartlett Learning, LLCNOT FOR SALE OR DISTRIBUTION
© Jones & Bartlett Learning, LLCNOT FOR SALE OR DISTRIBUTION

or at slightly different times. For practical reasons, researchers may be unable to col-lect data at the same time or simultaneously. Creswell and Plano Clark (2011) have expanded the Morse notation system to include an embedded method in a larger design and implementation of methods in a recursive process.
Decision on Mixed Methods DesignResearchers must decide (a) if the study will involve one method (QUAL or QUAN) or mixed methods (QUAL and QUAN), (b) if the study includes one phase or multiple phases, (c) how the mixing of QUAL and QUAN methods will occur, and (d) if the mixing of methods occurs across all stages of the study. A phase refers to the process of carrying out the study, that is, formulating the research question (conceptualization), collecting and analyzing data (experiential stage), and interpreting results (inferential stage; Tashakkori & Teddlie, 2003).
Studies with a one-method design use one method and one phase (i.e., a QUAN design or a QUAL design with one phase) or one method and two phases (i.e., a parallel one-method study or a sequential one-method study). Using the Morse notation system, a parallel one-method study is depicted as QUAN + QUAN or as QUAL + QUAL. A sequential one-method study is depicted as QUAN R QUAN or as QUAL R QUAL.
A mixed methods design is seen in studies with two methods and one phase (i.e., one phase conversion design) or two methods and multiple phases (i.e., parallel mixed design, sequential mixed designs, conversion mixed design, and multilevel mixed design). The one-phase conversion design refers to a study that involves a single phase, that is, the conceptualization, experiential, and inferential stages are carried out as one study. Conversion of data occurs when data originally collected as QUAN data are converted to narrative data for qualitative analysis (qualitized). Conversion of data can also occur when data originally collected as QUAL data are converted to numeric data for statistical analysis (quantitized).
Parallel mixed designs involve two phases: one phase involves QUAL, and the other phase involves QUAN, or vice versa. The QUAL and QUAN phases occur simultane-ously or with a slight time lapse between each phase. The two parallel phases are some-what independent of each other. One phase includes QUAL questions, data collection, and data analysis, and one phase includes QUAN questions, data collection, and data analysis. The QUAL and QUAN phases are planned and carried out to answer similar aspects of a main research question. Researchers draw conclusions or make infer-ences based on the data from each phase, and they integrate their conclusions from the QUAL and QUAN phases to make a meta-inference (Teddlie & Tashakkori, 2009, p. 152). In the parallel mixed design, researchers may ask research questions to con-firm existing thinking and to explore and generate new ideas. The QUAN phase may confirm existing ideas, and the QUAL phase may explore new ideas; both the QUAL and the QUAN phases can be exploratory. As previously noted, a slight lapse in time between each phase may be the result of practical issues such as the research team’s
Mixed Methods Designs n 51
© Jones & Bartlett Learning, LLC. NOT FOR SALE OR DISTRIBUTION.
© Jones & Bartlett Learning, LLCNOT FOR SALE OR DISTRIBUTION
© Jones & Bartlett Learning, LLCNOT FOR SALE OR DISTRIBUTION
© Jones & Bartlett Learning, LLCNOT FOR SALE OR DISTRIBUTION
© Jones & Bartlett Learning, LLCNOT FOR SALE OR DISTRIBUTION
© Jones & Bartlett Learning, LLCNOT FOR SALE OR DISTRIBUTION
© Jones & Bartlett Learning, LLCNOT FOR SALE OR DISTRIBUTION
© Jones & Bartlett Learning, LLCNOT FOR SALE OR DISTRIBUTION
© Jones & Bartlett Learning, LLCNOT FOR SALE OR DISTRIBUTION
© Jones & Bartlett Learning, LLCNOT FOR SALE OR DISTRIBUTION
© Jones & Bartlett Learning, LLCNOT FOR SALE OR DISTRIBUTION
© Jones & Bartlett Learning, LLCNOT FOR SALE OR DISTRIBUTION
© Jones & Bartlett Learning, LLCNOT FOR SALE OR DISTRIBUTION
© Jones & Bartlett Learning, LLCNOT FOR SALE OR DISTRIBUTION
© Jones & Bartlett Learning, LLCNOT FOR SALE OR DISTRIBUTION
© Jones & Bartlett Learning, LLCNOT FOR SALE OR DISTRIBUTION
© Jones & Bartlett Learning, LLCNOT FOR SALE OR DISTRIBUTION
© Jones & Bartlett Learning, LLCNOT FOR SALE OR DISTRIBUTION
© Jones & Bartlett Learning, LLCNOT FOR SALE OR DISTRIBUTION
© Jones & Bartlett Learning, LLCNOT FOR SALE OR DISTRIBUTION
© Jones & Bartlett Learning, LLCNOT FOR SALE OR DISTRIBUTION

inability to collect QUAL and QUAN data at the same time, or the research question may necessitate a time interval between each phase. Using the Morse notation system, the parallel mixed design study with an equal orientation for both phases would be depicted as QUAL + QUAN. The parallel mixed methods design in which the quali-tative phase dominates would be depicted as QUAL + quan; the design in which the quantitative phase is dominant would be depicted as QUAN + qual.
Sequential mixed designs are used in studies in which one phase occurs after the other phase (i.e., QUAL R QUAN or QUAN R QUAL). The findings from the first phase lead to the development of the second phase. The researcher draws final con-clusions based on the data from both phases. Research questions and data collection and analysis for the second phase evolve from the first phase. The second phase of the study is carried out to further explain or confirm the findings from the first phase (Tashakkori & Teddlie, 2003). The iterative sequential mixed methods design is a more complicated sequential mixed design in which there are more than two phases (e.g., QUAN R QUAL R QUAN; Teddlie & Tashakkori, 2009).
A conversion mixed design is used in studies in which the collected data are qual-itized or transformed from QUAN to QUAL, or when the collected data are quantitized or transformed from QUAL to QUAN. Therefore, the collected data are analyzed both qualitatively and quantitatively. Related aspects of the same research questions are answered using both the qualitative data and the quantitative data.
The multilevel mixed design may be parallel or sequential. QUAN data are col-lected from one level, and QUAL data are collected from a different level. The data are analyzed by level, and the results for the QUAN level and the QUAL level are used to formulate the conclusions. These conclusions are then integrated to create meta-inferences. For example, QUAL data on patient safety may be collected at the patient level or from individual patients, and QUAN data on patient safety may be collected at the unit level or from hospital units. The QUAL data and the QUAN data are ana-lyzed separately. Inferences are made about patients from the patient-level data, and inferences are made about the hospital units from the hospital unit-level data. These inferences are integrated to generate conclusions that represent both the patient- and the hospital-unit levels of data.
Mixing Qualitative and Quantitative PhasesMixing a study’s QUAL and QUAN phases refers to the process of “the independent or interactive relationship of a mixed methods study” (Creswell & Plano Clark, 2011, p. 66). Morse and Niehaus (2009) described the point at which the quantitative and qualitative phases are mixed as the point of interface. Mixing can occur at the point of a study’s design, data collection, data analysis, and interpretation (Creswell & Plano Clark, 2011). Integrating the QUAL and QUAN methods can occur at one or all methodological and analytical stages, with the “most dynamic and innovative” (Teddlie & Tashakkori, 2009, p. 146) designs being mixed across stages. These two mixed methods researchers indicated that the parallel designs (QUAN + qual or QUAL + quan) are the most popular designs. They referred to these parallel designs
52 n Chapter 3 Mixed Methods Research
© Jones & Bartlett Learning, LLC. NOT FOR SALE OR DISTRIBUTION.
© Jones & Bartlett Learning, LLCNOT FOR SALE OR DISTRIBUTION
© Jones & Bartlett Learning, LLCNOT FOR SALE OR DISTRIBUTION
© Jones & Bartlett Learning, LLCNOT FOR SALE OR DISTRIBUTION
© Jones & Bartlett Learning, LLCNOT FOR SALE OR DISTRIBUTION
© Jones & Bartlett Learning, LLCNOT FOR SALE OR DISTRIBUTION
© Jones & Bartlett Learning, LLCNOT FOR SALE OR DISTRIBUTION
© Jones & Bartlett Learning, LLCNOT FOR SALE OR DISTRIBUTION
© Jones & Bartlett Learning, LLCNOT FOR SALE OR DISTRIBUTION
© Jones & Bartlett Learning, LLCNOT FOR SALE OR DISTRIBUTION
© Jones & Bartlett Learning, LLCNOT FOR SALE OR DISTRIBUTION
© Jones & Bartlett Learning, LLCNOT FOR SALE OR DISTRIBUTION
© Jones & Bartlett Learning, LLCNOT FOR SALE OR DISTRIBUTION
© Jones & Bartlett Learning, LLCNOT FOR SALE OR DISTRIBUTION
© Jones & Bartlett Learning, LLCNOT FOR SALE OR DISTRIBUTION
© Jones & Bartlett Learning, LLCNOT FOR SALE OR DISTRIBUTION
© Jones & Bartlett Learning, LLCNOT FOR SALE OR DISTRIBUTION
© Jones & Bartlett Learning, LLCNOT FOR SALE OR DISTRIBUTION
© Jones & Bartlett Learning, LLCNOT FOR SALE OR DISTRIBUTION
© Jones & Bartlett Learning, LLCNOT FOR SALE OR DISTRIBUTION
© Jones & Bartlett Learning, LLCNOT FOR SALE OR DISTRIBUTION

as quasi-mixed, whereas Morse (1991, 2003) referred to these designs as dominant or less dominant.
Once researchers have settled on conducting a mixed methods study, they must choose the best design for their study. Building on the work of Creswell (2003) and Morgan (1998), Teddlie and Tashakkori (2009) developed a seven-step process for selecting the appropriate design in mixed methods research (Table 3-3). Researchers can use this process as a guide to identifying the best research design for their study or generating a new design that will address the research questions.
table 3-3 Process for Selecting an Appropriate Mixed Methods Design
Step Explanation
1. Determine if the research questions require one method or a mixed method design.
Research questions that can be answered by either QUAL or QUAN data can be addressed by a one-method design. Research questions that require both QUAL and QUAN to answer the questions require a mixed methods design.
2. Be aware that a number of typologies of mixed methods research designs exist and know how to access infor-mation about them.
Accessing the original presentations of mixed methods designs can provide detailed information about the design and its characteristics.
3. Select the best available mixed methods research design, realizing that a design may eventually need to be generated for the study.
It is important to look for the most appropriate or one best available research design instead of the “perfect fit” for a study. Designs may need to be combined or created for a study.
4. Be aware of the criteria emphasized by each of the mixed methods design typologies and of the implications for a study.
For example, criteria for the typology proposed by Creswell (2003) are implementation, priority, stage of integration, and theoretical perspective.
5. List the general criteria before selecting the specific criteria that are most important to the study.
General criteria for mixed methods typologies include number of methods (QUAL and/or QUAN), number of phases, implementation process, stage of integrating methods, priority of QUAL or QUAN, functions of the research study, and theoretical perspective.
6. Apply the selected criteria to potential designs to select the best research design for the study.
Determining the research design that is most consistent with the desired qualities on the selected criteria will likely result in the best design for the study.
7. Because there may be no one best design for a given study, a new mixed methods design may need to be developed at the beginning or during the evolution of the study.
Mixed methods studies may change as the research progresses and yields more phases than were originally planned or includes phases that change in importance.
Source: Adapted from Teddlie and Tashakkori, 2009, pp. 163–164.
Mixed Methods Designs n 53
© Jones & Bartlett Learning, LLC. NOT FOR SALE OR DISTRIBUTION.
© Jones & Bartlett Learning, LLCNOT FOR SALE OR DISTRIBUTION
© Jones & Bartlett Learning, LLCNOT FOR SALE OR DISTRIBUTION
© Jones & Bartlett Learning, LLCNOT FOR SALE OR DISTRIBUTION
© Jones & Bartlett Learning, LLCNOT FOR SALE OR DISTRIBUTION
© Jones & Bartlett Learning, LLCNOT FOR SALE OR DISTRIBUTION
© Jones & Bartlett Learning, LLCNOT FOR SALE OR DISTRIBUTION
© Jones & Bartlett Learning, LLCNOT FOR SALE OR DISTRIBUTION
© Jones & Bartlett Learning, LLCNOT FOR SALE OR DISTRIBUTION
© Jones & Bartlett Learning, LLCNOT FOR SALE OR DISTRIBUTION
© Jones & Bartlett Learning, LLCNOT FOR SALE OR DISTRIBUTION
© Jones & Bartlett Learning, LLCNOT FOR SALE OR DISTRIBUTION
© Jones & Bartlett Learning, LLCNOT FOR SALE OR DISTRIBUTION
© Jones & Bartlett Learning, LLCNOT FOR SALE OR DISTRIBUTION
© Jones & Bartlett Learning, LLCNOT FOR SALE OR DISTRIBUTION
© Jones & Bartlett Learning, LLCNOT FOR SALE OR DISTRIBUTION
© Jones & Bartlett Learning, LLCNOT FOR SALE OR DISTRIBUTION
© Jones & Bartlett Learning, LLCNOT FOR SALE OR DISTRIBUTION
© Jones & Bartlett Learning, LLCNOT FOR SALE OR DISTRIBUTION
© Jones & Bartlett Learning, LLCNOT FOR SALE OR DISTRIBUTION
© Jones & Bartlett Learning, LLCNOT FOR SALE OR DISTRIBUTION

n Research Questions, Sampling, Data Collection, Analysis, and Conclusions
After identifying the design that will be used for mixed methods, researchers select appropriate sampling, data collection, and analysis strategies to answer the research questions. Recognizing that research questions guide the mixed methods design and methods, the following section focuses on generating research questions in mixed methods research.
Research QuestionsMixed methods research questions, like research questions in QUAN or QUAL research, are generated to address a phenomenon that needs to be understood or better understood. A review of the literature is carried out when researchers have identified the focus of their research and before the initiation of or during the research process. In mixed methods, the research questions require narrative and numeric information. Two or more questions are generated; at least one question elicits nar-rative data (QUAL), and at least one question elicits numeric data (QUAN). Along with the QUAN research question, a research hypothesis may be generated to reveal predictions about the phenomenon before the study begins. For a study using the parallel mixed design, research questions will be generated before the study begins; for a study using a sequential mixed design, additional research questions may emerge as the study progresses. Research questions for mixed methods designs should include an overarching question that addresses both the QUAL and QUAN questions, or sep-arate QUAL and QUAN questions are generated along with a question that reflects integration of these two questions (Creswell & Plano Clark, 2007). At least one research question should justify the need for using both QUAL and QUAN methods (Teddlie & Tashakkori, 2009).
SamplingMixed methods sampling requires an understanding and acknowledgment of the sampling strategies that occur in QUAN and QUAL research. Probability sampling techniques are used most often in QUAN research to obtain a sample that most accu-rately represents the entire population. Purposive sampling techniques are used mainly in QUAL research to select participants or other units of study who can provide or yield data that will address the research questions. Although convenience sampling is some-times used in QUAL and QUAN research, it includes samples that are the most avail-able to the researcher; these may not be representative of the population being studied and may yield biased data. Because techniques for mixed methods include choosing participants for a study using both probability and purposive sampling, a comparison of purposive and probability sampling techniques is presented in Table 3-4.
Mixed methods sampling includes characteristics of both purposive and prob-ability sampling. Combining sampling techniques for QUAL and QUAN methods
54 n Chapter 3 Mixed Methods Research
© Jones & Bartlett Learning, LLC. NOT FOR SALE OR DISTRIBUTION.
© Jones & Bartlett Learning, LLCNOT FOR SALE OR DISTRIBUTION
© Jones & Bartlett Learning, LLCNOT FOR SALE OR DISTRIBUTION
© Jones & Bartlett Learning, LLCNOT FOR SALE OR DISTRIBUTION
© Jones & Bartlett Learning, LLCNOT FOR SALE OR DISTRIBUTION
© Jones & Bartlett Learning, LLCNOT FOR SALE OR DISTRIBUTION
© Jones & Bartlett Learning, LLCNOT FOR SALE OR DISTRIBUTION
© Jones & Bartlett Learning, LLCNOT FOR SALE OR DISTRIBUTION
© Jones & Bartlett Learning, LLCNOT FOR SALE OR DISTRIBUTION
© Jones & Bartlett Learning, LLCNOT FOR SALE OR DISTRIBUTION
© Jones & Bartlett Learning, LLCNOT FOR SALE OR DISTRIBUTION
© Jones & Bartlett Learning, LLCNOT FOR SALE OR DISTRIBUTION
© Jones & Bartlett Learning, LLCNOT FOR SALE OR DISTRIBUTION
© Jones & Bartlett Learning, LLCNOT FOR SALE OR DISTRIBUTION
© Jones & Bartlett Learning, LLCNOT FOR SALE OR DISTRIBUTION
© Jones & Bartlett Learning, LLCNOT FOR SALE OR DISTRIBUTION
© Jones & Bartlett Learning, LLCNOT FOR SALE OR DISTRIBUTION
© Jones & Bartlett Learning, LLCNOT FOR SALE OR DISTRIBUTION
© Jones & Bartlett Learning, LLCNOT FOR SALE OR DISTRIBUTION
© Jones & Bartlett Learning, LLCNOT FOR SALE OR DISTRIBUTION
© Jones & Bartlett Learning, LLCNOT FOR SALE OR DISTRIBUTION

requires thoughtful attention and creativity. When generating samples for the QUAN phase of mixed methods studies, researchers typically seek to obtain samples that are representative of the population. When generating samples for the QUAL phase, researchers typically seek to establish samples that will provide information at mul-tiple levels of meaning, or a “thick description” (Geertz, 1973). Using mixed methods, the researcher aims to generate a sample that is representative and that also provides meaningful information. In mixed methods research, decisions about sampling are
table 3-4 Comparison Between Purposive and Probability Sampling Techniques
Dimension of Contrast Purposive Sampling Probability Sampling
Other names Purposeful sampling
Nonrandom sampling
QUAL sampling
Scientific sampling
Random sampling
QUAN sampling
Overall purpose of sampling
To generate a sample that will address research questions
To generate a sample that will address research questions
Issue of generalizability Seeks a form of generalizability (transferability)
Seeks a form of generalizability (external validity)
Number of techniques At least 15 specific techniques (nominally, groups under three general types)
Three basic techniques with modifications
Rationale for selecting cases/units
To address specific purposes related to the research ques-tions; selection of cases deemed most informative in regard to research questions
Selection of cases that are collectively representative of the population
Sample size Typically small (usually 30 or fewer cases)
Large enough to establish representativeness (usually at least 50 units)
Depth/breadth of information per case/unit
Focuses on depth of information generated by the cases
Focuses on breadth of information generated by the sampling units
Time of sample selection Before the study begins, during the study, or both
Before the study begins
Selection method Uses expert judgment Often applies mathematical formulas
Sampling frame Informal sampling frame some-what larger than sample
Formal sampling frame typically much larger than sample
Form of data generated Focuses on narrative data, though numeric data can also be generated
Focuses on numeric data, though narrative data can also be generated
Source: Teddlie, C. B., & Tashakkori, A. (2008). In Foundations of mixed methods research: Integrating quantitative and qualitative approaches in the social and behavioral sciences (p. 179). Sage Publishers, Inc.
Research Questions, Sampling, Data Collection, Analysis, and Conclusions n 55
© Jones & Bartlett Learning, LLC. NOT FOR SALE OR DISTRIBUTION.
© Jones & Bartlett Learning, LLCNOT FOR SALE OR DISTRIBUTION
© Jones & Bartlett Learning, LLCNOT FOR SALE OR DISTRIBUTION
© Jones & Bartlett Learning, LLCNOT FOR SALE OR DISTRIBUTION
© Jones & Bartlett Learning, LLCNOT FOR SALE OR DISTRIBUTION
© Jones & Bartlett Learning, LLCNOT FOR SALE OR DISTRIBUTION
© Jones & Bartlett Learning, LLCNOT FOR SALE OR DISTRIBUTION
© Jones & Bartlett Learning, LLCNOT FOR SALE OR DISTRIBUTION
© Jones & Bartlett Learning, LLCNOT FOR SALE OR DISTRIBUTION
© Jones & Bartlett Learning, LLCNOT FOR SALE OR DISTRIBUTION
© Jones & Bartlett Learning, LLCNOT FOR SALE OR DISTRIBUTION
© Jones & Bartlett Learning, LLCNOT FOR SALE OR DISTRIBUTION
© Jones & Bartlett Learning, LLCNOT FOR SALE OR DISTRIBUTION
© Jones & Bartlett Learning, LLCNOT FOR SALE OR DISTRIBUTION
© Jones & Bartlett Learning, LLCNOT FOR SALE OR DISTRIBUTION
© Jones & Bartlett Learning, LLCNOT FOR SALE OR DISTRIBUTION
© Jones & Bartlett Learning, LLCNOT FOR SALE OR DISTRIBUTION
© Jones & Bartlett Learning, LLCNOT FOR SALE OR DISTRIBUTION
© Jones & Bartlett Learning, LLCNOT FOR SALE OR DISTRIBUTION
© Jones & Bartlett Learning, LLCNOT FOR SALE OR DISTRIBUTION
© Jones & Bartlett Learning, LLCNOT FOR SALE OR DISTRIBUTION

usually made before the study begins; however, sequential mixed designs may result in the need to make sampling decisions during the study.
In the absence of an established classification or typology for mixed methods sam-pling strategies, Teddlie and Tashakkori (2009) discussed strategies for sampling and mixed methods designs from the perspectives of probability and purposive sampling. Their provisional typology of mixed methods sampling strategies includes (a) basic, (b) sequential, (c) parallel, (d) multilevel, and (e) multiple mixed methods sampling strategies. The first three strategies will be discussed.
A basic mixed methods sampling technique is stratified purposive sampling. This involves identifying subgroups in a population and then selecting cases (participants) from each subgroup in a purposive manner. Researchers can then identify character-istics for the subgroups and compare and contrast across the subgroups. Purposive random sampling involves selecting a random sample of a small number of units (par-ticipants) from a larger population (Kemper, Stringfield, & Teddlie, 2003). Random selection of this sample reflects probability sampling, and the smaller number of par-ticipants selected reflects purposive sampling.
Using sequential mixed methods sampling, researchers select units of analysis (e.g., participants) by using probability and purposive sampling strategies, one after another. That is, probability sampling for the QUAN phase is followed by purposive sampling for the QUAL phase (QUAN R QUAL), or vice versa (QUAL R QUAN). This sampling method is used often, with the QUAN R QUAL procedure being the most frequent (Teddlie & Tashakkori, 2009).
Parallel mixed methods sampling refers to use of probability and purposive sam-pling strategies concurrently or with a slight time lapse between each phase. A prob-ability sampling is used to produce data for the QUAN phase, and purposive sampling produces data for the QUAL phase. These two sampling procedures are used to gen-erate separate sets of data. Parallel mixed methods sampling can also occur when the participants are selected using both probability and purposive sampling (Teddlie & Tashakkori, 2009). Researchers use the sample derived from probability and purpo-sive sampling to test a hypothesis for the QUAN phase and to answer a research ques-tion in the QUAL phase. Using the Morse notation system, parallel mixed methods sampling is represented as QUAN + QUAL or QUAL + QUAN.
Data CollectionMixed methods researchers use strategies that are the same as those used by researchers engaged only in QUAN research and by those engaged only in QUAL research. That is, mixed methods researchers use strategies such as observation, unobtrusive measures, focus groups, interviews, questionnaires, and tests (Johnson & Turner, 2003). They need to have an understanding of both QUAN and QUAL data collection strategies.
When used in mixed methods research, the strategies mentioned obviously require a blending or combining to yield the data that researchers are trying to obtain. For
56 n Chapter 3 Mixed Methods Research
© Jones & Bartlett Learning, LLC. NOT FOR SALE OR DISTRIBUTION.
© Jones & Bartlett Learning, LLCNOT FOR SALE OR DISTRIBUTION
© Jones & Bartlett Learning, LLCNOT FOR SALE OR DISTRIBUTION
© Jones & Bartlett Learning, LLCNOT FOR SALE OR DISTRIBUTION
© Jones & Bartlett Learning, LLCNOT FOR SALE OR DISTRIBUTION
© Jones & Bartlett Learning, LLCNOT FOR SALE OR DISTRIBUTION
© Jones & Bartlett Learning, LLCNOT FOR SALE OR DISTRIBUTION
© Jones & Bartlett Learning, LLCNOT FOR SALE OR DISTRIBUTION
© Jones & Bartlett Learning, LLCNOT FOR SALE OR DISTRIBUTION
© Jones & Bartlett Learning, LLCNOT FOR SALE OR DISTRIBUTION
© Jones & Bartlett Learning, LLCNOT FOR SALE OR DISTRIBUTION
© Jones & Bartlett Learning, LLCNOT FOR SALE OR DISTRIBUTION
© Jones & Bartlett Learning, LLCNOT FOR SALE OR DISTRIBUTION
© Jones & Bartlett Learning, LLCNOT FOR SALE OR DISTRIBUTION
© Jones & Bartlett Learning, LLCNOT FOR SALE OR DISTRIBUTION
© Jones & Bartlett Learning, LLCNOT FOR SALE OR DISTRIBUTION
© Jones & Bartlett Learning, LLCNOT FOR SALE OR DISTRIBUTION
© Jones & Bartlett Learning, LLCNOT FOR SALE OR DISTRIBUTION
© Jones & Bartlett Learning, LLCNOT FOR SALE OR DISTRIBUTION
© Jones & Bartlett Learning, LLCNOT FOR SALE OR DISTRIBUTION
© Jones & Bartlett Learning, LLCNOT FOR SALE OR DISTRIBUTION

example, data collected through observation can include a procedure that has open-ended prompts to elicit free response, and close-ended items that require a preestab-lished response. For unobtrusive measures such as documents and artifacts, both nonnumeric and numeric data will be sought. Focus group scripts may include both open-ended questions to elicit narrative data and other questions that elicit numeric data. Interviews may include open-ended interview questions to yield narrative data and closed-ended questions with preestablished responses. Questionnaires may include items that require responding to preestablished or predetermined categories and open-ended items that require narrative responses. Standardized tests or tests developed by a researcher that include closed-ended items may be used along with open-ended essay items (Teddlie & Tashakkori, 2009).
Researchers conducting mixed methods studies seek permission from institu-tions (i.e., institutional review boards), organizations, key individuals within organi-zations, and participants who will provide their own data or representatives who can provide data about participants. When qualitative research requires researchers to spend an amount of time with participants to collect data, researchers may need to gain formal and/or informal permission from a gatekeeper. Creswell and Plano Clark (2011) described the gatekeeper as “an individual in the organization supportive of the proposed research who will, essentially, ‘open up’ the organization” (p. 175).
The quality of data collected by researchers conducting mixed methods studies is determined to an extent by the standards of quality established for the QUAL and QUAN phases. Valid and credible QUAL and QUAN data will contribute to high-quality data in the mixed methods study. Differences in what represents quality in QUAL and QUAN data can present challenges to mixed methods researchers. Data quality in QUAN research is based on validity and reliability, whereas data quality in QUAL research is based on credibility and dependability. Teddlie and Tashakkori (2009) noted that QUAN researchers “evaluate (or often fail to evaluate) their data quality in terms of data/measurement validity (whether the data represent the con-structs they were assumed to capture) and data/measurement reliability (whether the data consistently and accurately represent the constructs under examination)” (p. 209). Qualitative researchers discuss validity of data in terms of its trustworthi-ness and credibility.
Trustworthiness refers to findings that are “worth paying attention to” (Lincoln & Guba, 1985, p. 290) and is divided into credibility, dependability, transferability, and confirmability. With credibility, researchers evaluate whether the findings are cred-ible interpretations of the participants’ data; credibility is similar to internal validity in QUAN research. Dependability is related to reliability and evaluates the quality of the integration of data collection, data analysis, and formulation of a conclusion or theory. Transferability is considered a form of external validity and refers to the degree to which findings can apply or transfer to situations outside the study that generate the findings. Confirmability is a measure of the extent to which study findings are supported by the data (Lincoln & Guba, 1985; Rolfe, 2006).
Research Questions, Sampling, Data Collection, Analysis, and Conclusions n 57
© Jones & Bartlett Learning, LLC. NOT FOR SALE OR DISTRIBUTION.
© Jones & Bartlett Learning, LLCNOT FOR SALE OR DISTRIBUTION
© Jones & Bartlett Learning, LLCNOT FOR SALE OR DISTRIBUTION
© Jones & Bartlett Learning, LLCNOT FOR SALE OR DISTRIBUTION
© Jones & Bartlett Learning, LLCNOT FOR SALE OR DISTRIBUTION
© Jones & Bartlett Learning, LLCNOT FOR SALE OR DISTRIBUTION
© Jones & Bartlett Learning, LLCNOT FOR SALE OR DISTRIBUTION
© Jones & Bartlett Learning, LLCNOT FOR SALE OR DISTRIBUTION
© Jones & Bartlett Learning, LLCNOT FOR SALE OR DISTRIBUTION
© Jones & Bartlett Learning, LLCNOT FOR SALE OR DISTRIBUTION
© Jones & Bartlett Learning, LLCNOT FOR SALE OR DISTRIBUTION
© Jones & Bartlett Learning, LLCNOT FOR SALE OR DISTRIBUTION
© Jones & Bartlett Learning, LLCNOT FOR SALE OR DISTRIBUTION
© Jones & Bartlett Learning, LLCNOT FOR SALE OR DISTRIBUTION
© Jones & Bartlett Learning, LLCNOT FOR SALE OR DISTRIBUTION
© Jones & Bartlett Learning, LLCNOT FOR SALE OR DISTRIBUTION
© Jones & Bartlett Learning, LLCNOT FOR SALE OR DISTRIBUTION
© Jones & Bartlett Learning, LLCNOT FOR SALE OR DISTRIBUTION
© Jones & Bartlett Learning, LLCNOT FOR SALE OR DISTRIBUTION
© Jones & Bartlett Learning, LLCNOT FOR SALE OR DISTRIBUTION
© Jones & Bartlett Learning, LLCNOT FOR SALE OR DISTRIBUTION

There is not consistent agreement on quality in qualitative research in the disci-pline of nursing; therefore, the two basic questions posed by Teddlie and Tashakkori (2009) offer guidance to mixed methods researchers regarding the QUAL phase of their study. The first question focuses on measurement validity/credibility and reads, “Am I truly measuring/recording/capturing what I intend to, rather than something else?” (p. 209). The second question focuses on measurement reliability/dependability and reads, “Assuming that I am measuring/capturing what I intend to, is my measurement/recording consistent and accurate (i.e., yields little error)?” (p. 209). Teddlie and Tashakkori noted that researchers’ difficulties answering these two questions are often the basis of controversy around research findings.
Measurement validity and credibility is often an issue in health research because the attributes being measured cannot be observed, but must be measured indirectly. Instruments chosen to measure an attribute should obtain data from participants that provide essential information about that attribute. Face validity of a measure-ment instrument (i.e., the extent to which an instrument looks as if it is measuring the attribute it is supposed to measure) does not replace construct validity (i.e., the extent to which an instrument measures the attribute or construct). Researchers can ask others who are considered experts to help determine if an instrument is mea-suring the attribute(s) it is supposed to measure. Additional information on methods for determining validity of data collection measures used during the QUAN and QUAL phases of research is available (Morse, Barrett, Mayan, Olson, & Spiers, 2002; Shadish, Cook, & Campbell, 2002; Teddlie & Tashakkori, 2009).
Determining measurement validity in the QUAN phase of a mixed methods study can be accomplished by evaluating content, convergent, concurrent, predictive, and discriminant validity. Determining reliability in the QUAN phase of a mixed methods study can be accomplished by using techniques such as test-retest reliability, split half reliability, parallel forms reliability, and interrater reliability.
As mentioned earlier, validity in the QUAL phase of a mixed methods study can be determined using trustworthiness criteria established by Lincoln and Guba (1985). Teddlie and Tashakkori (2009) identified six strategies that can be used to determine the trustworthiness of QUAL data: (a) prolonged engagement (spending enough time with participants to establish trust, learn about the participants, and check for misinformation), (b) persistent observation (helping the researcher to use his or her observations to address his or her research questions), (c) triangulation techniques (using multiple sources, methods, and investigators to best represent the reality or realities of the participants), (d) member checks (asking participants to verify the researchers’ interpretations and representations of their reality—events, phenomena), (e) thick descriptions (analyzing multiple levels of meaning of reality—events, phenomena), and (f) reflexive journal (generating a diary in which researchers record information about themselves, their use of self as an instrument, and the research method).
58 n Chapter 3 Mixed Methods Research
© Jones & Bartlett Learning, LLC. NOT FOR SALE OR DISTRIBUTION.
© Jones & Bartlett Learning, LLCNOT FOR SALE OR DISTRIBUTION
© Jones & Bartlett Learning, LLCNOT FOR SALE OR DISTRIBUTION
© Jones & Bartlett Learning, LLCNOT FOR SALE OR DISTRIBUTION
© Jones & Bartlett Learning, LLCNOT FOR SALE OR DISTRIBUTION
© Jones & Bartlett Learning, LLCNOT FOR SALE OR DISTRIBUTION
© Jones & Bartlett Learning, LLCNOT FOR SALE OR DISTRIBUTION
© Jones & Bartlett Learning, LLCNOT FOR SALE OR DISTRIBUTION
© Jones & Bartlett Learning, LLCNOT FOR SALE OR DISTRIBUTION
© Jones & Bartlett Learning, LLCNOT FOR SALE OR DISTRIBUTION
© Jones & Bartlett Learning, LLCNOT FOR SALE OR DISTRIBUTION
© Jones & Bartlett Learning, LLCNOT FOR SALE OR DISTRIBUTION
© Jones & Bartlett Learning, LLCNOT FOR SALE OR DISTRIBUTION
© Jones & Bartlett Learning, LLCNOT FOR SALE OR DISTRIBUTION
© Jones & Bartlett Learning, LLCNOT FOR SALE OR DISTRIBUTION
© Jones & Bartlett Learning, LLCNOT FOR SALE OR DISTRIBUTION
© Jones & Bartlett Learning, LLCNOT FOR SALE OR DISTRIBUTION
© Jones & Bartlett Learning, LLCNOT FOR SALE OR DISTRIBUTION
© Jones & Bartlett Learning, LLCNOT FOR SALE OR DISTRIBUTION
© Jones & Bartlett Learning, LLCNOT FOR SALE OR DISTRIBUTION
© Jones & Bartlett Learning, LLCNOT FOR SALE OR DISTRIBUTION

Data AnalysisMixed methods data analysis requires knowledge of strategies used to analyze QUAL and QUAN data. QUAL data analysis involves an inductive process in which researchers work to address research questions. These questions may involve gener-ating new ideas and theories; explaining phenomena; exploring associations between attitudes, behaviors, and experiences; developing typologies and classifications; and developing conceptual definitions (Green & Thorogood, 2009). QUAL data analysis is iterative in that there is a movement between data collection and data analysis so that analysis may be occurring shortly after data collection begins. QUAL data analysis is eclectic (Teddlie & Tashakkori, 2009), as noted in the statement, “There are many ways of analyzing qualitative data” (Coffey & Atkinson, 1996, p. 3). Although Miles and Huberman (1994) described a focused method of data analysis (i.e., data reduc-tion, data display, and conclusion drawing/verification) in their text, An Expanded Sourcebook: Qualitative Data Analysis, they advised researchers “to look behind any apparent formalism and seek out what is useful in your own work” (p. 5).
Common approaches to QUAL data analysis are: thematic content analysis, grounded theory, framework analysis, and narrative analysis (Green & Thorogood, 2009). The most basic, and maybe the most commonly used in health, QUAL research is thematic content analysis. Using this approach, the content of data is analyzed to generate and categorize recurring themes. Data are coded and catego-rized until themes are identified or emerge. Grounded theory involves a cyclical pro-cess in which data are collected and analyzed, and a coding scheme is developed; additional data collection and analysis may be needed until saturation is reached and there are no new constructs emerging. There is movement back and forth between the emerging theory and data or constant comparison (Glaser & Strauss, 1967; Strauss, 1987). Narrative analysis is conducted “to see how respondents in interviews impose order on the flow of experience to make sense of events and actions in their lives” (Riessman, 1993, p. 2). Narrative, or the practice of story-telling (Green & Thorogood, 2009), is analyzed in terms of “how it is put together, the linguistic and cultural resources it draws on, and how it persuades the listener of authenticity” (Riessman, 1993, p. 2).
The number of computer software programs available to assist with QUAL data analysis has increased, and the quality and efficiency of this software have improved to provide sophisticated methods of managing and organizing data (Bringer, Johnston, & Brackenridge, 2006). Mixed methods researchers should be aware of advantages and disadvantages of software programs and their usefulness for a given research study. Researchers should select software that supports rigorous QUAL data analysis (Auld et al., 2007; Banner & Albarran, 2009).
QUAN data are analyzed using various statistical techniques. Descriptive sta-tistics summarize data to allow researchers to better understand the data trends. Inferential techniques are typically used to test hypotheses and further examine the
Research Questions, Sampling, Data Collection, Analysis, and Conclusions n 59
© Jones & Bartlett Learning, LLC. NOT FOR SALE OR DISTRIBUTION.
© Jones & Bartlett Learning, LLCNOT FOR SALE OR DISTRIBUTION
© Jones & Bartlett Learning, LLCNOT FOR SALE OR DISTRIBUTION
© Jones & Bartlett Learning, LLCNOT FOR SALE OR DISTRIBUTION
© Jones & Bartlett Learning, LLCNOT FOR SALE OR DISTRIBUTION
© Jones & Bartlett Learning, LLCNOT FOR SALE OR DISTRIBUTION
© Jones & Bartlett Learning, LLCNOT FOR SALE OR DISTRIBUTION
© Jones & Bartlett Learning, LLCNOT FOR SALE OR DISTRIBUTION
© Jones & Bartlett Learning, LLCNOT FOR SALE OR DISTRIBUTION
© Jones & Bartlett Learning, LLCNOT FOR SALE OR DISTRIBUTION
© Jones & Bartlett Learning, LLCNOT FOR SALE OR DISTRIBUTION
© Jones & Bartlett Learning, LLCNOT FOR SALE OR DISTRIBUTION
© Jones & Bartlett Learning, LLCNOT FOR SALE OR DISTRIBUTION
© Jones & Bartlett Learning, LLCNOT FOR SALE OR DISTRIBUTION
© Jones & Bartlett Learning, LLCNOT FOR SALE OR DISTRIBUTION
© Jones & Bartlett Learning, LLCNOT FOR SALE OR DISTRIBUTION
© Jones & Bartlett Learning, LLCNOT FOR SALE OR DISTRIBUTION
© Jones & Bartlett Learning, LLCNOT FOR SALE OR DISTRIBUTION
© Jones & Bartlett Learning, LLCNOT FOR SALE OR DISTRIBUTION
© Jones & Bartlett Learning, LLCNOT FOR SALE OR DISTRIBUTION
© Jones & Bartlett Learning, LLCNOT FOR SALE OR DISTRIBUTION

descriptive statistics results. Univariate statistical analysis examines the association between one variable that is the focus of the analysis or dependent variable, and one or more variables that are independent variables and possible predictors of the depen-dent variable. Multivariate statistical analysis examines the association between at least two sets of variables, multiple dependent variables and multiple independent variables. Last, QUAN data can be analyzed using parametric or nonparametric sta-tistics. Parametric statistics require that data meet rigorous assumptions to include variable measurement on an interval or ratio scale. Nonparametric statistical analyses are used with nominal and ordinal scale data and do not involve the rigorous assump-tions needed with parametric statistical analyses.
Mixed methods data analyses involve QUAN and QUAL data analyses that are “combined, connected, or integrated in research studies” (Teddlie & Tashakkori, 2009, p. 263). There are numerous classifications of data analysis strategies (Caracelli & Greene, 1993; Creswell & Plano Clark, 2007; Creswell & Plano Clark, 2011; Greene, 2007; Onwuegbuzie & Teddlie, 2003; Rao & Woolcock, 2003; Teddlie & Tashak-kori, 2009). The following discussion on mixed methods data analysis will follow the typology of mixed methods designs proposed by Teddlie and Tashakkori. Four com-ponents of their typology (i.e., parallel, sequential, conversion, and multilevel mixed data analysis) will be discussed here.
Parallel mixed data analysis involves QUAN analysis of data using statistical tech-niques appropriate for the variables, and QUAL analysis of data using qualitative analysis approaches appropriate for the data and the research question. The two analyses are conducted independent of each other and provide information about the phenomenon through connecting, combining, or integrating the findings from the QUAN analysis and from the QUAL analysis.
Sequential mixed data analysis is conducted when the QUAL and QUAN phases of a study are in chronological order. For example, QUAL R QUAN analysis indi-cates that the QUAN analysis emerges from the QUAL analysis, and QUAN R QUAL analysis indicates that the QUAL analysis emerges from the QUAN analysis. An iterative sequential mixed analysis occurs when a sequential design has more than two phases. Examples are QUAN R QUAL R QUAN or QUAL R QUAN R QUAL R QUAN. An interesting note is that sequential mixed data analysis can result in the development of data categories or classifications. Teddlie and Tashakkori (2009) discussed the strategy proposed by Caracelli and Green (1993), in which one set of data yields a set of categories that is used when analyzing the second set of data.
Conversion mixed data analysis occurs when data are converted from one form (numeric or narrative) to the other form (narrative or numeric). As mentioned ear-lier, converting QUAL data into numeric data is referred to as quantitizing, and
60 n Chapter 3 Mixed Methods Research
© Jones & Bartlett Learning, LLC. NOT FOR SALE OR DISTRIBUTION.
© Jones & Bartlett Learning, LLCNOT FOR SALE OR DISTRIBUTION
© Jones & Bartlett Learning, LLCNOT FOR SALE OR DISTRIBUTION
© Jones & Bartlett Learning, LLCNOT FOR SALE OR DISTRIBUTION
© Jones & Bartlett Learning, LLCNOT FOR SALE OR DISTRIBUTION
© Jones & Bartlett Learning, LLCNOT FOR SALE OR DISTRIBUTION
© Jones & Bartlett Learning, LLCNOT FOR SALE OR DISTRIBUTION
© Jones & Bartlett Learning, LLCNOT FOR SALE OR DISTRIBUTION
© Jones & Bartlett Learning, LLCNOT FOR SALE OR DISTRIBUTION
© Jones & Bartlett Learning, LLCNOT FOR SALE OR DISTRIBUTION
© Jones & Bartlett Learning, LLCNOT FOR SALE OR DISTRIBUTION
© Jones & Bartlett Learning, LLCNOT FOR SALE OR DISTRIBUTION
© Jones & Bartlett Learning, LLCNOT FOR SALE OR DISTRIBUTION
© Jones & Bartlett Learning, LLCNOT FOR SALE OR DISTRIBUTION
© Jones & Bartlett Learning, LLCNOT FOR SALE OR DISTRIBUTION
© Jones & Bartlett Learning, LLCNOT FOR SALE OR DISTRIBUTION
© Jones & Bartlett Learning, LLCNOT FOR SALE OR DISTRIBUTION
© Jones & Bartlett Learning, LLCNOT FOR SALE OR DISTRIBUTION
© Jones & Bartlett Learning, LLCNOT FOR SALE OR DISTRIBUTION
© Jones & Bartlett Learning, LLCNOT FOR SALE OR DISTRIBUTION
© Jones & Bartlett Learning, LLCNOT FOR SALE OR DISTRIBUTION

converting QUAN data into narrative or another type of QUAL data is referred to as qualitizing. Most often, QUAL data are quantitized or are converted into narra-tive categories that are assigned numbers. Teddlie and Tashakkori (2009) described the simplest qualitizing technique as one that involves identifying groups of values within the distribution of values on numeric data. These groups of numeric data are examined for meaning, and narrative categories are created based on the meaning of the groups.
Multilevel mixed data analysis involves the use of QUAL and QUAN data anal-ysis at different levels within a study. For example, QUAL analysis may be used at one level (e.g., health provider), and QUAN analysis is used at the other level (e.g., hospital). When more than two levels are included in a study, QUAL analysis is always conducted for one of the levels, and QUAN analysis is always used for one of the remaining levels. For example, QUAN analysis is conducted at the patient level, QUAL analysis is conducted at the health provider level, and QUAN analysis is con-ducted at the clinic level.
n ConclusionMixed methods research has gained increasing acceptance as complex healthcare issues demand that healthcare providers have “conceptually sound, holistic knowledge” (Car-roll & Rothe, 2010, p. 3479) to guide practice, policy, and research. As reflected in the quotation at the beginning of this chapter, new ideas that are needed badly enough will be accepted. Similarly, mixed methods research is an idea that has been badly needed and is being accepted. Emerging from paradigms with differing philosophical perspec-tives, mixed methods research addresses critical healthcare problems using both quali-tative and quantitative research methods. The research-based evidence resulting from studies using mixed methods will guide healthcare providers to improve healthcare quality and patient outcomes. Mixed methods research examples are presented in Table 3-5. The references at the end of this chapter serve as a beginning point for students and scholars to gain additional, in-depth information on mixed methods research.
Reflective Activities
1. Describe paradigms supporting quantitative, qualitative, and mixed methods research.
2. Identify processes involved in implementing mixed methods research using a parallel, sequential, conversion, or multilevel design.
3. How would the use of mixed methods research address a clinical practice prob-lem and policy issue?
Reflective Activities n 61
© Jones & Bartlett Learning, LLC. NOT FOR SALE OR DISTRIBUTION.
© Jones & Bartlett Learning, LLCNOT FOR SALE OR DISTRIBUTION
© Jones & Bartlett Learning, LLCNOT FOR SALE OR DISTRIBUTION
© Jones & Bartlett Learning, LLCNOT FOR SALE OR DISTRIBUTION
© Jones & Bartlett Learning, LLCNOT FOR SALE OR DISTRIBUTION
© Jones & Bartlett Learning, LLCNOT FOR SALE OR DISTRIBUTION
© Jones & Bartlett Learning, LLCNOT FOR SALE OR DISTRIBUTION
© Jones & Bartlett Learning, LLCNOT FOR SALE OR DISTRIBUTION
© Jones & Bartlett Learning, LLCNOT FOR SALE OR DISTRIBUTION
© Jones & Bartlett Learning, LLCNOT FOR SALE OR DISTRIBUTION
© Jones & Bartlett Learning, LLCNOT FOR SALE OR DISTRIBUTION
© Jones & Bartlett Learning, LLCNOT FOR SALE OR DISTRIBUTION
© Jones & Bartlett Learning, LLCNOT FOR SALE OR DISTRIBUTION
© Jones & Bartlett Learning, LLCNOT FOR SALE OR DISTRIBUTION
© Jones & Bartlett Learning, LLCNOT FOR SALE OR DISTRIBUTION
© Jones & Bartlett Learning, LLCNOT FOR SALE OR DISTRIBUTION
© Jones & Bartlett Learning, LLCNOT FOR SALE OR DISTRIBUTION
© Jones & Bartlett Learning, LLCNOT FOR SALE OR DISTRIBUTION
© Jones & Bartlett Learning, LLCNOT FOR SALE OR DISTRIBUTION
© Jones & Bartlett Learning, LLCNOT FOR SALE OR DISTRIBUTION
© Jones & Bartlett Learning, LLCNOT FOR SALE OR DISTRIBUTION

table 3-5 Mixed Methods Research Studies
Study Citation Design
Brazier, A., Cooke, K., & Moravan, V. (2008). Using mixed methods for evaluating an integrative approach to cancer care: A case study. Integrative Cancer Therapies, 7(1), 5–17.
Sequential
Carr, E. C. (2009). Understanding inadequate pain management in the clinical setting: The value of the sequential explanatory mixed method study. Journal of Clinical Nursing, 18(1), 124–131.
Sequential
Giesbrecht, E. M., Ripat, J. D., Quanbury, A. O., & Cooper, J. E. (2009). Participation in community-based activities of daily living: Comparison of a pushrim-activated, power-assisted wheelchair and a power wheelchair. Disability & Rehabilitation Assistive Technology, 4(3), 198–207.
Parallel
Hodgkin, S. (2008). Telling it all: A story of women’s social capital using a mixed methods approach. Journal of Mixed Methods Research, 2(3), 296–316.
Sequential
Mortenson, W. B., Miller, W. C., & Miller-Pogar, J. (2007). Measuring wheelchair intervention outcomes: Development of the wheelchair out-come measure. Disability & Rehabilitation Assistive Technology, 2(5), 275–285.
Conversion
Myers, K. K., & Oetzel, J. G. (2003). Exploring the dimensions of organi-zational assimilation: Creating and validating a measure. Communication Quarterly, 51(4), 438–457.
Sequential
Pomeroy, S. E. M ., & Cant, R. P. (2010). General practitioners’ decision to refer patients to dietitians: Insight into the clinical reasoning process. Australian Journal of Primary Health, 16(2), 147–153.
Sequential
Raine, K. D., Plotnikoff, R., Nykiforuk, C., Deegan, H., Hemphill, E., Storey, K., . . . Ohinmaa, A. (2010). Reflections on community-based population health intervention and evaluation for obesity and chronic disease prevention: The Healthy Alberta Communities project. International Journal of Public Health, 55(6), 679–686.
Multi-layered
Van Staa, A. (2011). Unraveling triadic communication in hospital consul-tations with adolescents with chronic conditions: The added value of mixed methods research. Patient Education & Counseling, 82(3), 455–464.
Sequential
Wiecha, J. L., Nelson, T. F., Roth, B. A., Glashagel, J., & Vaughan, L. (2010). Disseminating health promotion practices in after-school programs through YMCA learning collaborative. American Journal of Health Promotion, 24(3), 190–198.
Sequential
Wittink, M. N., Barg, F. K., & Gallo, J. J. (2006). Unwritten rules of talking to doctors about depression: Integrating qualitative and quantitative methods. Annals of Family Medicine, 4(4), 302–309.
Parallel
62 n Chapter 3 Mixed Methods Research
© Jones & Bartlett Learning, LLC. NOT FOR SALE OR DISTRIBUTION.
© Jones & Bartlett Learning, LLCNOT FOR SALE OR DISTRIBUTION
© Jones & Bartlett Learning, LLCNOT FOR SALE OR DISTRIBUTION
© Jones & Bartlett Learning, LLCNOT FOR SALE OR DISTRIBUTION
© Jones & Bartlett Learning, LLCNOT FOR SALE OR DISTRIBUTION
© Jones & Bartlett Learning, LLCNOT FOR SALE OR DISTRIBUTION
© Jones & Bartlett Learning, LLCNOT FOR SALE OR DISTRIBUTION
© Jones & Bartlett Learning, LLCNOT FOR SALE OR DISTRIBUTION
© Jones & Bartlett Learning, LLCNOT FOR SALE OR DISTRIBUTION
© Jones & Bartlett Learning, LLCNOT FOR SALE OR DISTRIBUTION
© Jones & Bartlett Learning, LLCNOT FOR SALE OR DISTRIBUTION
© Jones & Bartlett Learning, LLCNOT FOR SALE OR DISTRIBUTION
© Jones & Bartlett Learning, LLCNOT FOR SALE OR DISTRIBUTION
© Jones & Bartlett Learning, LLCNOT FOR SALE OR DISTRIBUTION
© Jones & Bartlett Learning, LLCNOT FOR SALE OR DISTRIBUTION
© Jones & Bartlett Learning, LLCNOT FOR SALE OR DISTRIBUTION
© Jones & Bartlett Learning, LLCNOT FOR SALE OR DISTRIBUTION
© Jones & Bartlett Learning, LLCNOT FOR SALE OR DISTRIBUTION
© Jones & Bartlett Learning, LLCNOT FOR SALE OR DISTRIBUTION
© Jones & Bartlett Learning, LLCNOT FOR SALE OR DISTRIBUTION
© Jones & Bartlett Learning, LLCNOT FOR SALE OR DISTRIBUTION

RefeRences
Auld, G. W., Diker, A., Bock, M. A., Boushey, C. J., Bruhn, C. M., Cluskey, M., . . . Zaghloul, S. (2007). Development of a decision tree to determine appropriateness of NVivo in analyzing qualitative data sets. Journal of Nutrition Education and Behavior, 39(1), 37–47.
Banner, D., & Albarran, J. (2009). Computer-assisted qualitative data analysis software: A review. Canadian Journal of Cardiovascular Nursing, 19(3), 24–31.
Brewer, J., & Hunter, A. (1989). Multimethod research: A synthesis of styles. Newbury Park, CA: Sage.Bringer, J. D., Johnston, L. H., & Brackenridge, C. H. (2006). Using computer-assisted qualitative data
analysis software to develop a grounded theory project. Field Methods, 18(3), 245–266.Caracelli, V. J., & Greene, J. C. (1993). Data analysis strategies for mixed-method evaluation designs.
Educational Evaluation and Policy Analysis, 15, 195–207.Carroll, L. J., & Rothe, J. P. (2010). Levels of reconstruction as complementarity in mixed methods
research: A social theory-based conceptual framework for integrating qualitative and quantitative research. International Journal of Environmental Research and Public Health, 7, 3478–3488.
Coffey, A., & Atkinson, P. (1996). Making sense of qualitative data: Complementary research strategies. Thousand Oaks, CA: Sage.
Cook, T. D., & Campbell, D. T. (1979). Quasiexperimentation: Design and analysis issues for field settings. Boston, MA: Houghton Mifflin.
Creswell, J. W. (2003). Research design: Qualitative, quantitative, and mixed methods approaches. Thousand Oaks, CA: Sage.
Creswell, J. W. (2011). Controversies in mixed methods research. In N. K. Denzin & Y. S. Lincoln (Eds.), The SAGE handbook of qualitative research (4th ed., pp. 269–284). Thousand Oaks, CA: Sage.
Creswell, J. W., & Plano Clark, V. L. (2007). Designing and conducting mixed methods research. Thousand Oaks, CA: Sage.
Creswell, J. W., & Plano Clark, V. L. (2011). Designing and conducting mixed methods research (2nd ed.). Los Angeles, CA: Sage.
Cronbach, L. J. (1982). Designing evaluations of educational and social programs. San Francisco, CA: Jossey-Bass.
Denzin, N. K., & Lincoln, Y. S. (2005). Introduction: The discipline and practice of qualitative research. In N. K. Denzin & Y. S. Lincoln (Eds.), The handbook of qualitative research (3rd ed., pp. 1–32). Thousand Oaks, CA: Sage.
Geertz, C. (1973). The interpretation of cultures: Selected essays. New York, NY: Basic Books.Glaser, B., & Strauss, A. (1967). The discovery of grounded theory: Strategies for qualitative research.
Chicago, IL: Aldine Press.Green, J., & Thorogood, N. (2009). Qualitative methods for health research (2nd ed.). Los Angeles, CA: Sage.Greene, J. C. (2007). Mixing methods in social inquiry. San Francisco, CA: Jossey-Bass.Greene, J. C., Caracelli, V. J., & Graham, W. F. (1989). Toward a conceptual framework for mixed-method
evaluation designs. Educational Evaluation and Policy Analysis, 11, 255–274.Howe, K. R. (1988). Against the quantitative-qualitative incompatibility thesis or dogmas die hard.
Educational Researcher, 17(8), 10–16.Jick, T. D. (1979). Mixing qualitative and quantitative methods: Triangulation in action. Administrative
Science Quarterly, 24, 602–611.Johnson, R. B., & Turner, L. (2003). Data collection strategies in mixed methods research. In A. Tashakkori
& C. Teddlie (Eds.), Handbook of mixed methods in social and behavioral research (pp. 297–320). Thousand Oaks, CA: Sage.
Kemper, E., Stringfield, S., & Teddlie, C. (2003). Mixed methods sampling strategies in social science research. In A. Tashakkori & C. Teddlie (Eds.), Handbook of mixed methods in social and behavioral research (pp. 273–296). Thousand Oaks, CA: Sage.
Lincoln, Y. S., & Guba, E. G. (1985). Naturalistic inquiry. Beverly Hills, CA: Sage.Miles, M. B., & Huberman, A. M. (1994). An expanded sourcebook: Qualitative data analysis (2nd ed.).
Thousand Oaks, CA: Sage.
References n 63
© Jones & Bartlett Learning, LLC. NOT FOR SALE OR DISTRIBUTION.
© Jones & Bartlett Learning, LLCNOT FOR SALE OR DISTRIBUTION
© Jones & Bartlett Learning, LLCNOT FOR SALE OR DISTRIBUTION
© Jones & Bartlett Learning, LLCNOT FOR SALE OR DISTRIBUTION
© Jones & Bartlett Learning, LLCNOT FOR SALE OR DISTRIBUTION
© Jones & Bartlett Learning, LLCNOT FOR SALE OR DISTRIBUTION
© Jones & Bartlett Learning, LLCNOT FOR SALE OR DISTRIBUTION
© Jones & Bartlett Learning, LLCNOT FOR SALE OR DISTRIBUTION
© Jones & Bartlett Learning, LLCNOT FOR SALE OR DISTRIBUTION
© Jones & Bartlett Learning, LLCNOT FOR SALE OR DISTRIBUTION
© Jones & Bartlett Learning, LLCNOT FOR SALE OR DISTRIBUTION
© Jones & Bartlett Learning, LLCNOT FOR SALE OR DISTRIBUTION
© Jones & Bartlett Learning, LLCNOT FOR SALE OR DISTRIBUTION
© Jones & Bartlett Learning, LLCNOT FOR SALE OR DISTRIBUTION
© Jones & Bartlett Learning, LLCNOT FOR SALE OR DISTRIBUTION
© Jones & Bartlett Learning, LLCNOT FOR SALE OR DISTRIBUTION
© Jones & Bartlett Learning, LLCNOT FOR SALE OR DISTRIBUTION
© Jones & Bartlett Learning, LLCNOT FOR SALE OR DISTRIBUTION
© Jones & Bartlett Learning, LLCNOT FOR SALE OR DISTRIBUTION
© Jones & Bartlett Learning, LLCNOT FOR SALE OR DISTRIBUTION
© Jones & Bartlett Learning, LLCNOT FOR SALE OR DISTRIBUTION

Morgan, D. L. (1998). Practical strategies for combining qualitative and quantitative methods: Applications to health research. Qualitative Health Research, 8(3), 362–376.
Morse, J. M. (1991). Approaches to qualitative-quantitative methodological triangulation. Nursing Research, 40(1), 120–123.
Morse, J. M. (2003). Principles of mixed methods and multimethod research design. In A. Tashakkori & C. Teddlie (Eds.), Handbook of mixed methods in social and behavioral research (pp. 189–208). Thousand Oaks, CA: Sage.
Morse, J. M., Barrett, M., Mayan, M., Olson, K., & Spiers, J. (2002). Verification strategies for establishing reliability and validity in qualitative research. International Journal of Qualitative Methods, 1(2), 1–19.
Morse, J. M., & Niehaus, L. (2009). Mixed methods design: Principles and procedures. Walnut Creek, CA: Left Coast Press.
Onwuegbuzie, A., & Teddlie, C. (2003). A framework for analyzing data in mixed methods research. In A. Tashakkori & C. Teddlie (Eds.), Handbook of mixed methods in social and behavioral research (pp. 351–384). Thousand Oaks, CA: Sage.
Patton, M. Q. (1980). Qualitative evaluation and research methods. Newbury Park, CA: Sage.Rao, V., & Woolcock, M. (2003). Integrating qualitative and quantitative approaches in program
evaluation. In F. J. Bourguignon & L. Pereira de Silva (Eds.), Evaluating the poverty and distribution impact of economic policies (pp. 165–190). New York, NY: The World Bank.
Reichardt, C. S., & Rallis, S. F. (1994). Qualitative and quantitative inquiries are not incompatible: A call for a new partnership. In C. S. Reichardt & S. F. Rallis (Eds.), The qualitativequantitative debate: New perspectives (pp. 85–92). San Francisco, CA: Jossey-Bass.
Riessman, C. K. (1993). Narrative analysis. Newbury Park, CA: Sage.Rolfe, G. (2006). Validity, trustworthiness and rigour: Quality and the idea of qualitative research. Journal
of Advanced Nursing, 53(3), 304–410.Schwandt, T. (1997). Qualitative inquiry: A dictionary of terms. Thousand Oaks, CA: Sage.Shadish, W., Cook, T. D., & Campbell, D. T. (2002). Experimental and quasiexperimental designs for
general causal inference. Boston, MA: Houghton Mifflin.Strauss, A. (1987). Qualitative analysis for social scientists. Cambridge, England: Cambridge University Press.Tashakkori, A., & Teddlie, C. (1998). Mixed methodology: Combining qualitative and quantitative
approaches. Thousand Oaks, CA: Sage.Tashakkori, A., & Teddlie, C. (Eds.). (2003). Handbook of mixed methods in social and behavioral research.
Thousand Oaks, CA: Sage.Teddlie, C., & Tashakkori, A. (2009). Foundations of mixed methods research: Integrating quantitative and
qualitative approaches in the social and behavioral sciences. Los Angeles, CA: Sage.
64 n Chapter 3 Mixed Methods Research
© Jones & Bartlett Learning, LLC. NOT FOR SALE OR DISTRIBUTION.
© Jones & Bartlett Learning, LLCNOT FOR SALE OR DISTRIBUTION
© Jones & Bartlett Learning, LLCNOT FOR SALE OR DISTRIBUTION
© Jones & Bartlett Learning, LLCNOT FOR SALE OR DISTRIBUTION
© Jones & Bartlett Learning, LLCNOT FOR SALE OR DISTRIBUTION
© Jones & Bartlett Learning, LLCNOT FOR SALE OR DISTRIBUTION
© Jones & Bartlett Learning, LLCNOT FOR SALE OR DISTRIBUTION
© Jones & Bartlett Learning, LLCNOT FOR SALE OR DISTRIBUTION
© Jones & Bartlett Learning, LLCNOT FOR SALE OR DISTRIBUTION
© Jones & Bartlett Learning, LLCNOT FOR SALE OR DISTRIBUTION
© Jones & Bartlett Learning, LLCNOT FOR SALE OR DISTRIBUTION
© Jones & Bartlett Learning, LLCNOT FOR SALE OR DISTRIBUTION
© Jones & Bartlett Learning, LLCNOT FOR SALE OR DISTRIBUTION
© Jones & Bartlett Learning, LLCNOT FOR SALE OR DISTRIBUTION
© Jones & Bartlett Learning, LLCNOT FOR SALE OR DISTRIBUTION
© Jones & Bartlett Learning, LLCNOT FOR SALE OR DISTRIBUTION
© Jones & Bartlett Learning, LLCNOT FOR SALE OR DISTRIBUTION
© Jones & Bartlett Learning, LLCNOT FOR SALE OR DISTRIBUTION
© Jones & Bartlett Learning, LLCNOT FOR SALE OR DISTRIBUTION
© Jones & Bartlett Learning, LLCNOT FOR SALE OR DISTRIBUTION
© Jones & Bartlett Learning, LLCNOT FOR SALE OR DISTRIBUTION


![Twenty Years of Research on Mixed Methods · Twenty years of research on mixed methods. Journal of Mixed Methods Studies, Volume 1 (Issue 1), 26-40 [Online] Abstract. This research](https://static.fdocuments.in/doc/165x107/5f0253887e708231d403b7f7/twenty-years-of-research-on-mixed-methods-twenty-years-of-research-on-mixed-methods.jpg)