Mitochondria as key responders of metabolic and hormonal ...
20
Josep Calduch-Giner 1 , Yann Echasseriau 2 , Patrick Prunet 2 & Jaume Pérez-Sánchez 1 Mitochondria as key responders of metabolic and hormonal disturbances in fish. Meta-analysis flowchart of transcriptomic data in gilthead sea bream (Sparus aurata) 1 Instituto de Acuiculturade Torre de la Sal (CSIC), Castellón, Spain 2 Laboratoire de Physiologie et Génomique des Poissons (INRA), Rennes, France Barcelona, July2013
Transcript of Mitochondria as key responders of metabolic and hormonal ...

Josep Calduch-Giner1, Yann Echasseriau2, Patrick Prunet2 & Jaume Pérez-Sánchez1
Mitochondria as key responders of metabolicand hormonal disturbances in fish.
Meta-analysis flowchart of transcriptomic data in gilthead sea bream (Sparus aurata)
1Instituto de Acuicultura de Torre de la Sal (CSIC), Castellón, Spain2Laboratoire de Physiologie et Génomique des Poissons (INRA), Rennes, France
Barcelona, July 2013
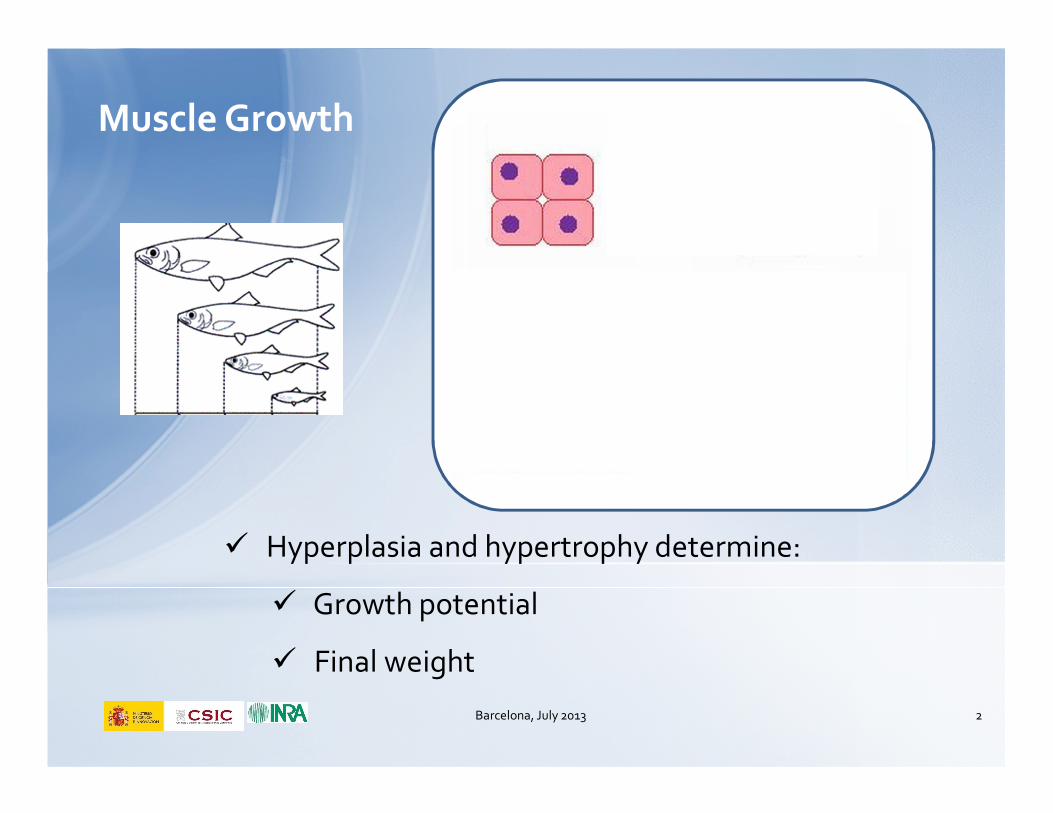
Muscle Growth
� Hyperplasia and hypertrophy determine:
� Growth potential
� Final weight
Barcelona, July 2013 2
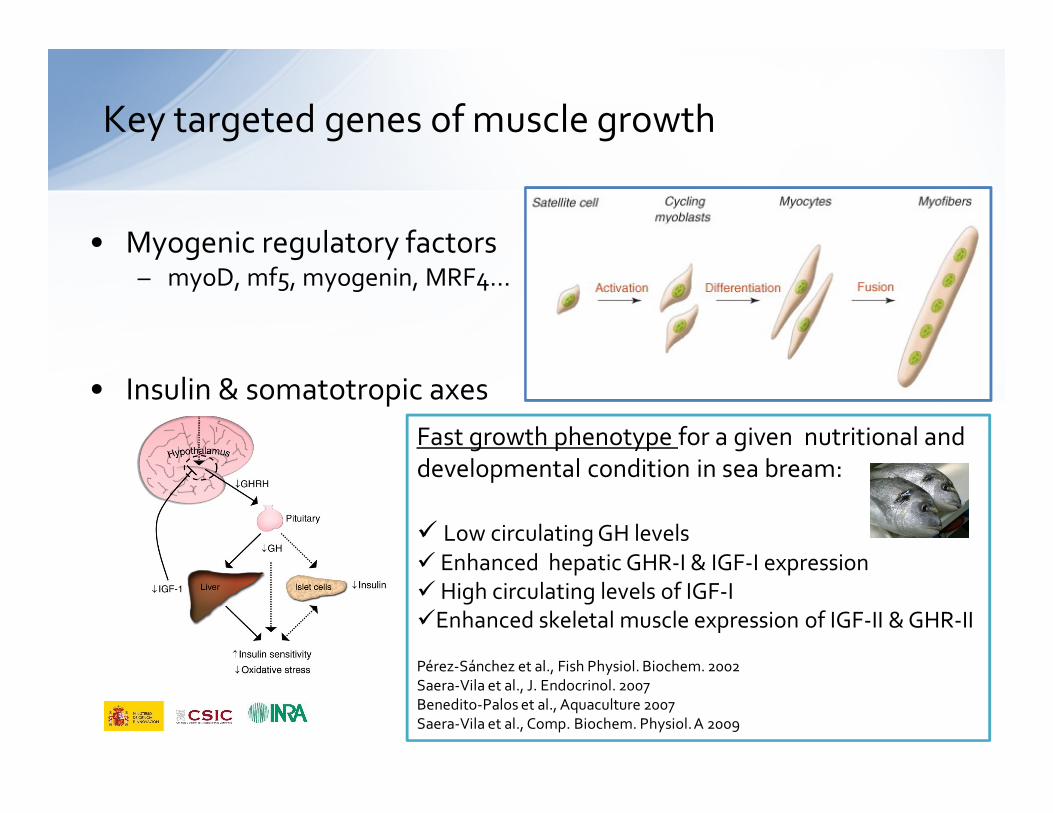
• Myogenic regulatory factors– myoD, mf5, myogenin, MRF4…
• Insulin & somatotropic axes
Key targeted genes of muscle growth
Fast growth phenotype for a given nutritional and developmental condition in sea bream:
� Low circulating GH levels� Enhanced hepatic GHR-I & IGF-I expression� High circulating levels of IGF-I �Enhanced skeletal muscle expression of IGF-II & GHR-II
Pérez-Sánchez et al., Fish Physiol. Biochem. 2002Saera-Vila et al., J. Endocrinol. 2007Benedito-Palos et al., Aquaculture 2007Saera-Vila et al., Comp. Biochem. Physiol. A 2009
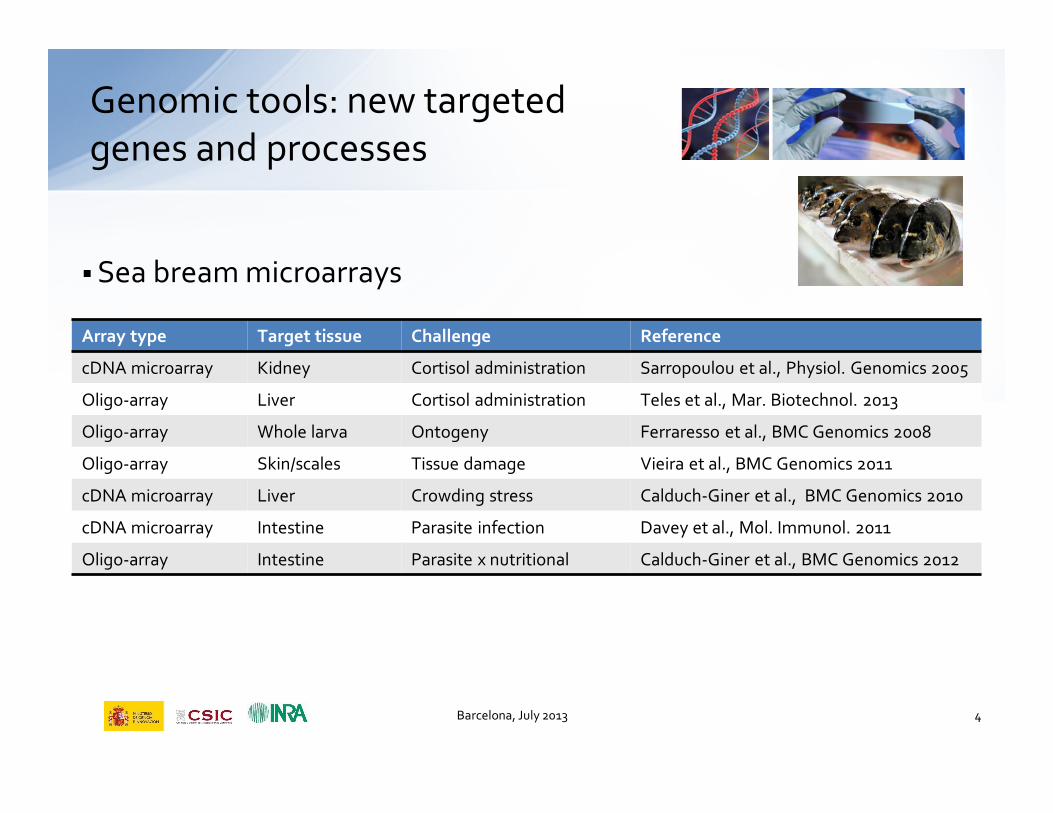
Genomic tools: new targetedgenes and processes
� Sea bream microarrays
Array type Target tissue Challenge Reference
cDNA microarray Kidney Cortisol administration Sarropoulou et al., Physiol. Genomics 2005
Oligo-array Liver Cortisol administration Teles et al., Mar. Biotechnol. 2013
Oligo-array Whole larva Ontogeny Ferraresso et al., BMC Genomics 2008
Oligo-array Skin/scales Tissue damage Vieira et al., BMC Genomics 2011
cDNA microarray Liver Crowding stress Calduch-Giner et al., BMC Genomics 2010
cDNA microarray Intestine Parasite infection Davey et al., Mol. Immunol. 2011
Oligo-array Intestine Parasite x nutritional Calduch-Giner et al., BMC Genomics 2012
Barcelona, July 2013 4
Genomic tools: new targetedgenes and processes
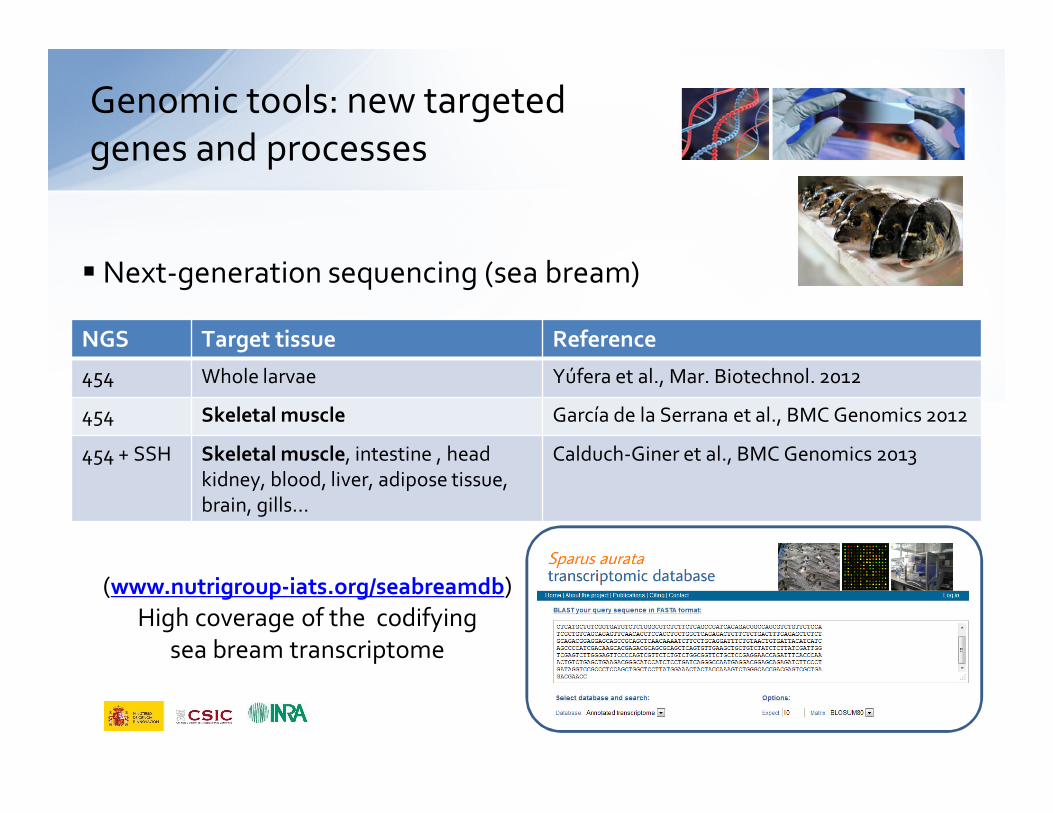
� Next-generation sequencing (sea bream)
NGS Target tissue Reference
454 Whole larvae Yúfera et al., Mar. Biotechnol. 2012
454 Skeletal muscle García de la Serrana et al., BMC Genomics 2012
454 + SSH Skeletal muscle, intestine , head kidney, blood, liver, adipose tissue, brain, gills…
Calduch-Giner et al., BMC Genomics 2013
(www.nutrigroup-iats.org/seabreamdb)High coverage of the codifying
sea bream transcriptome
Gene expresssion profiling of cardiac and skeletal muscle tissues
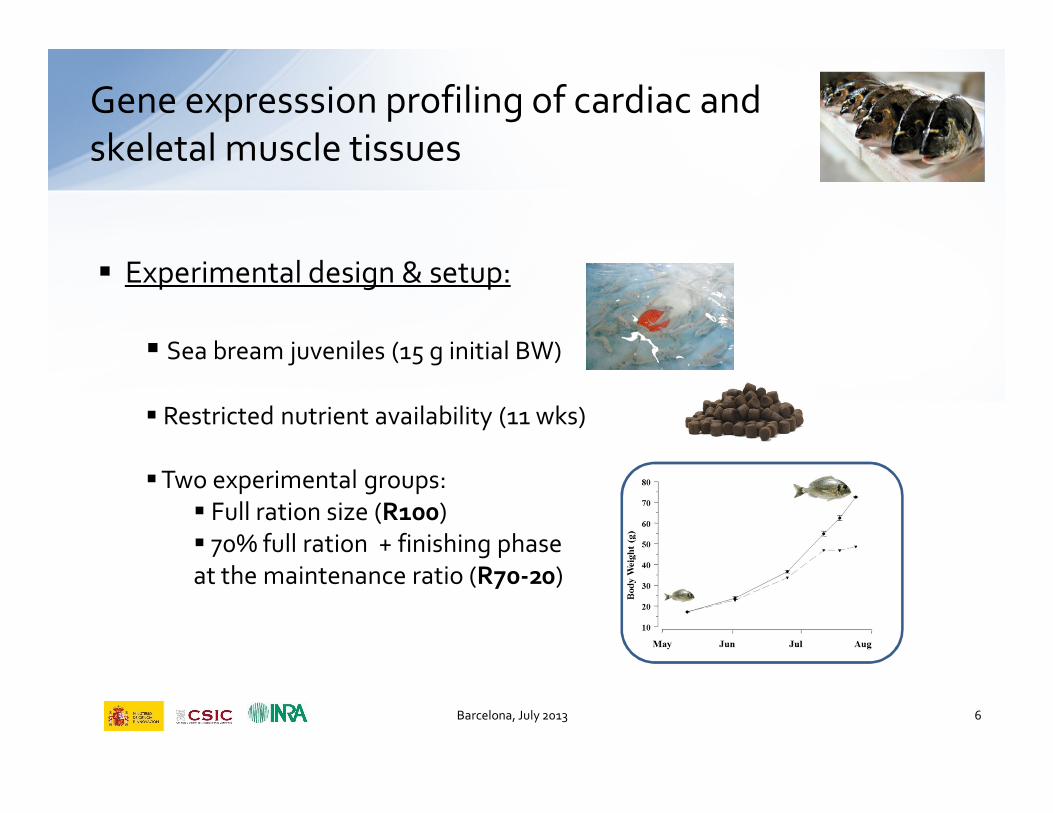
� Experimental design & setup:
� Sea bream juveniles (15 g initial BW)
� Restricted nutrient availability (11 wks)
�Two experimental groups:� Full ration size (R100)� 70% full ration + finishing phaseat the maintenance ratio (R70-20)
Barcelona, July 2013 6
Gene expresssion profiling of cardiac and skeletal muscle tissues
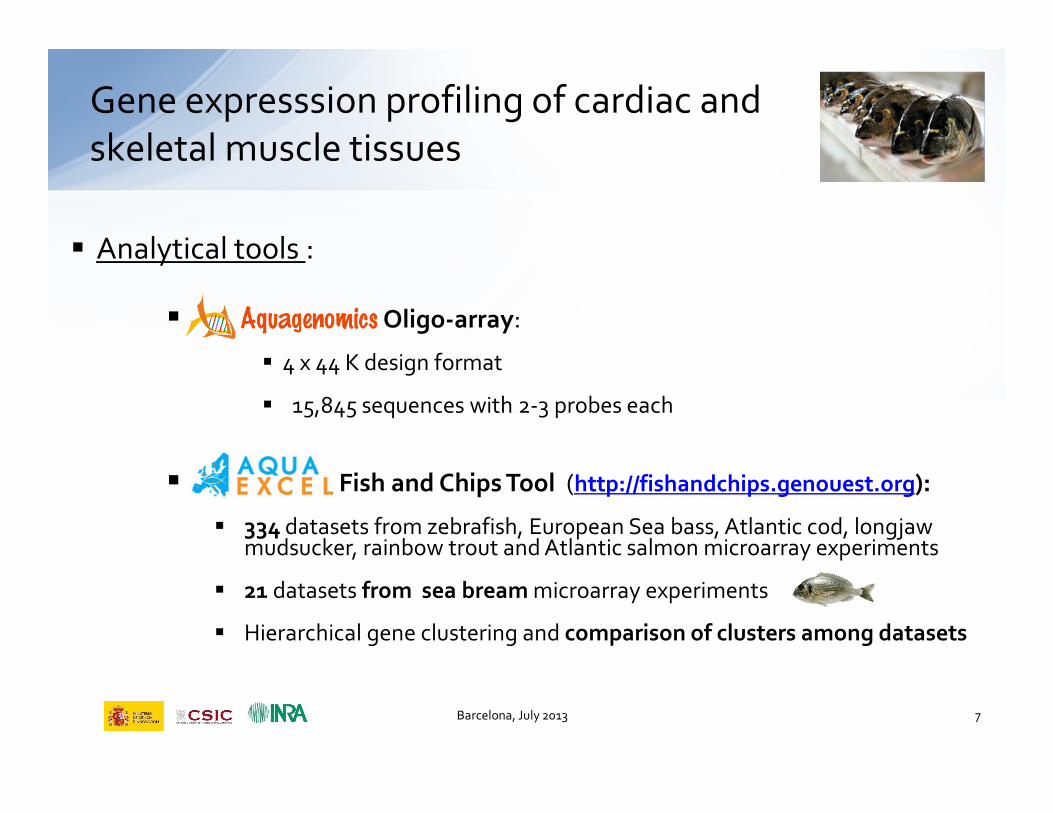
� Analytical tools :
� Oligo-array:
� 4 x 44 K design format
� 15,845 sequences with 2-3 probes each
� Fish and Chips Tool (http://fishandchips.genouest.org):
� 334 datasets from zebrafish, European Sea bass, Atlantic cod, longjawmudsucker, rainbow trout and Atlantic salmon microarray experiments
� 21 datasets from sea bream microarray experiments
� Hierarchical gene clustering and comparison of clusters among datasets
Barcelona, July 2013 7
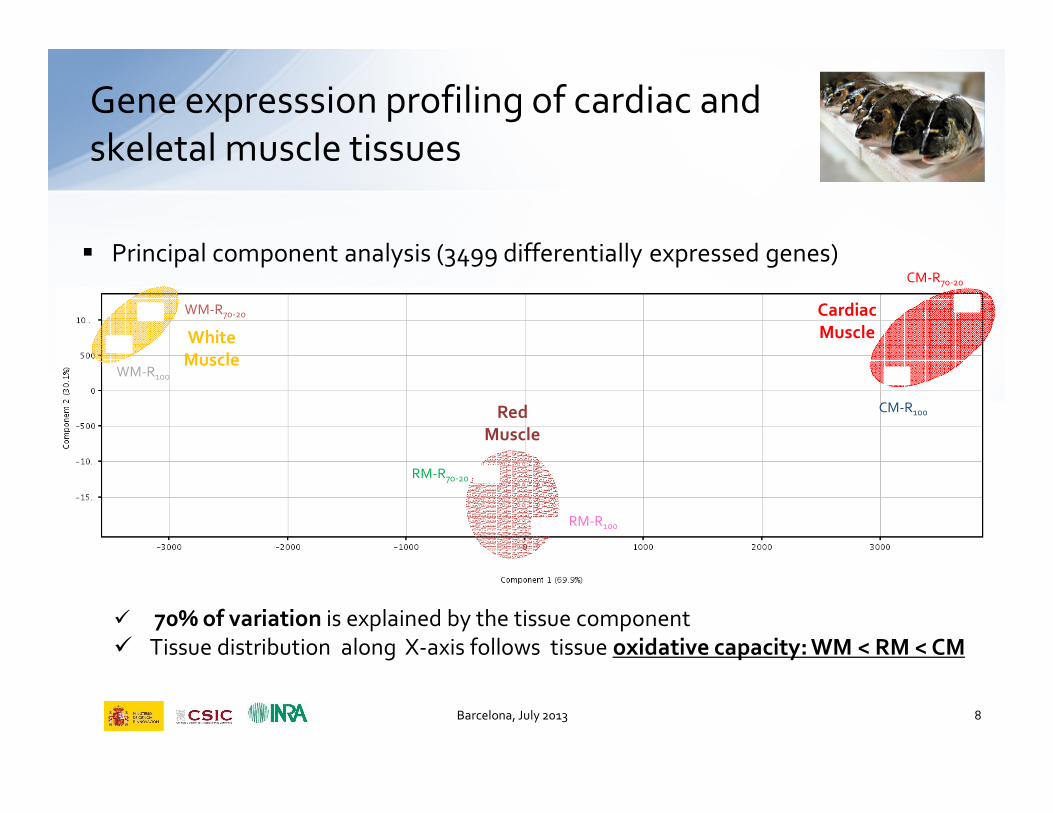
White
Muscle
Red
Muscle
Cardiac
Muscle
� 70% of variation is explained by the tissue component� Tissue distribution along X-axis follows tissue oxidative capacity: WM < RM < CM
� Principal component analysis (3499 differentially expressed genes)
Gene expresssion profiling of cardiac and skeletal muscle tissues
FOTO doradas
WM-R100
WM-R70-20
RM-R100
RM-R70-20
CM-R100
CM-R70-20
Barcelona, July 2013 8

� Definition of 3
clusters according totranscript abundance
in a given tissue
Gene expression profiling:K-means clustering
White muscle
Cluster
Red muscle
Cluster
Cardiac muscle
Cluster
Hig
hly
exp
ressed
gene
s
0
200
400
600
800
1000
1200
1400
16001393
628
1478
Barcelona, July 2013 9
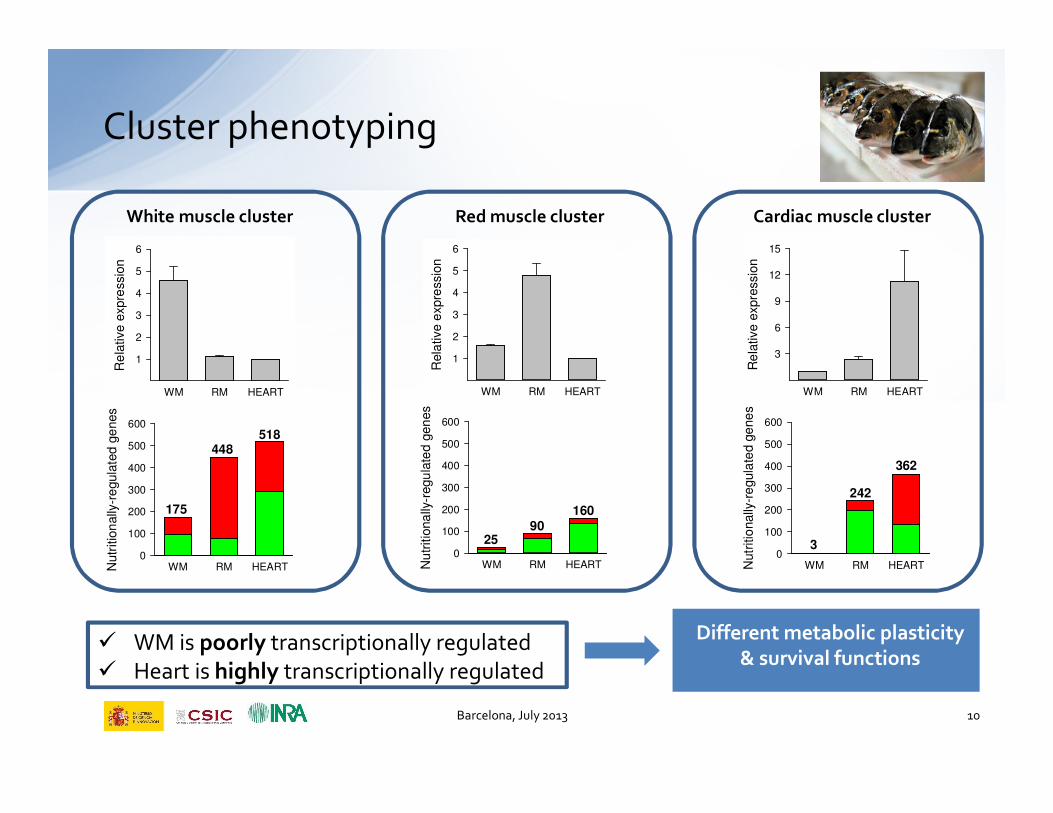
Different metabolic plasticity& survival functions
Cluster phenotyping
White muscle cluster Red muscle cluster Cardiac muscle cluster
� WM is poorly transcriptionally regulated� Heart is highly transcriptionally regulated
WM RM HEART
Re
lative e
xpre
ssio
n
1
2
3
4
5
6
WM RM HEARTNutr
itio
nally
-re
gula
ted
ge
nes
0
100
200
300
400
500
600
175
448
518
WM RM HEART
Rela
tive e
xpre
ssio
n
1
2
3
4
5
6
WM RM HEARTNu
tritio
na
lly-r
egu
late
d g
en
es
0
100
200
300
400
500
600
25
90
160
WM RM HEART
Re
lative
expre
ssio
n
3
6
9
12
15
WM RM HEARTNutr
itio
nally
-re
gula
ted g
ene
s
0
100
200
300
400
500
600
3
242
362
Barcelona, July 2013 10
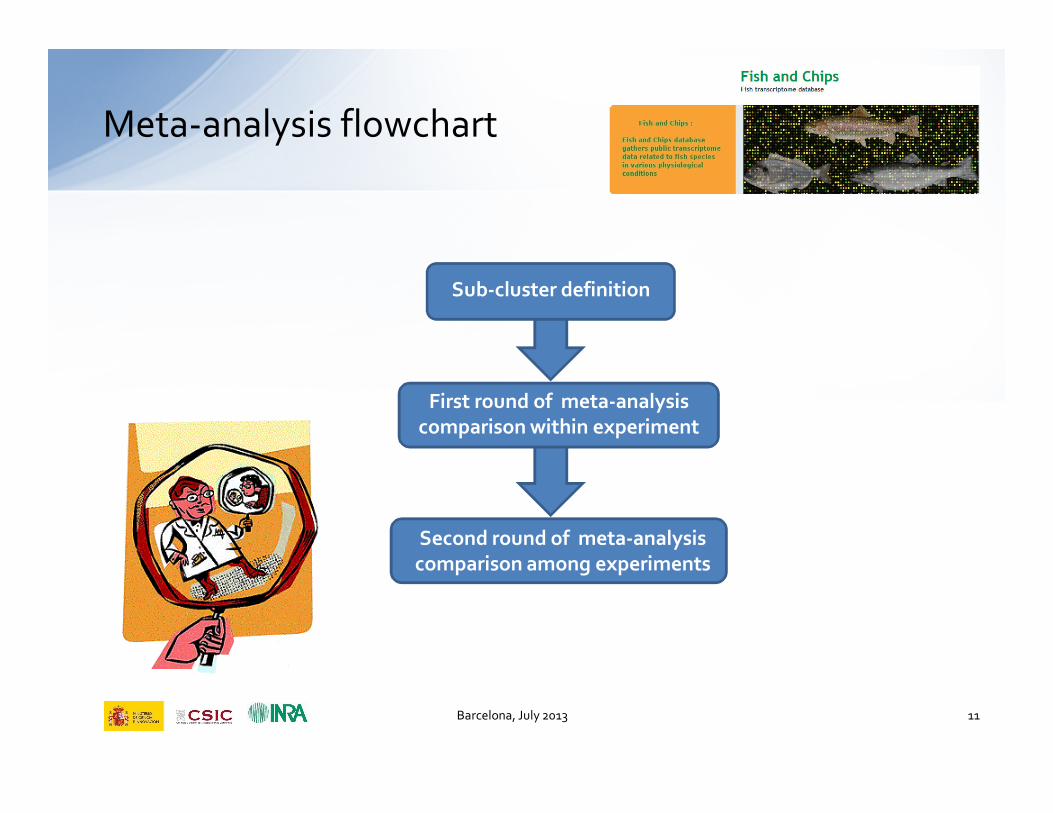
Second round of meta-analysiscomparison among experiments
First round of meta-analysiscomparison within experiment
Meta-analysis flowchart
Sub-cluster definition
Barcelona, July 2013 11
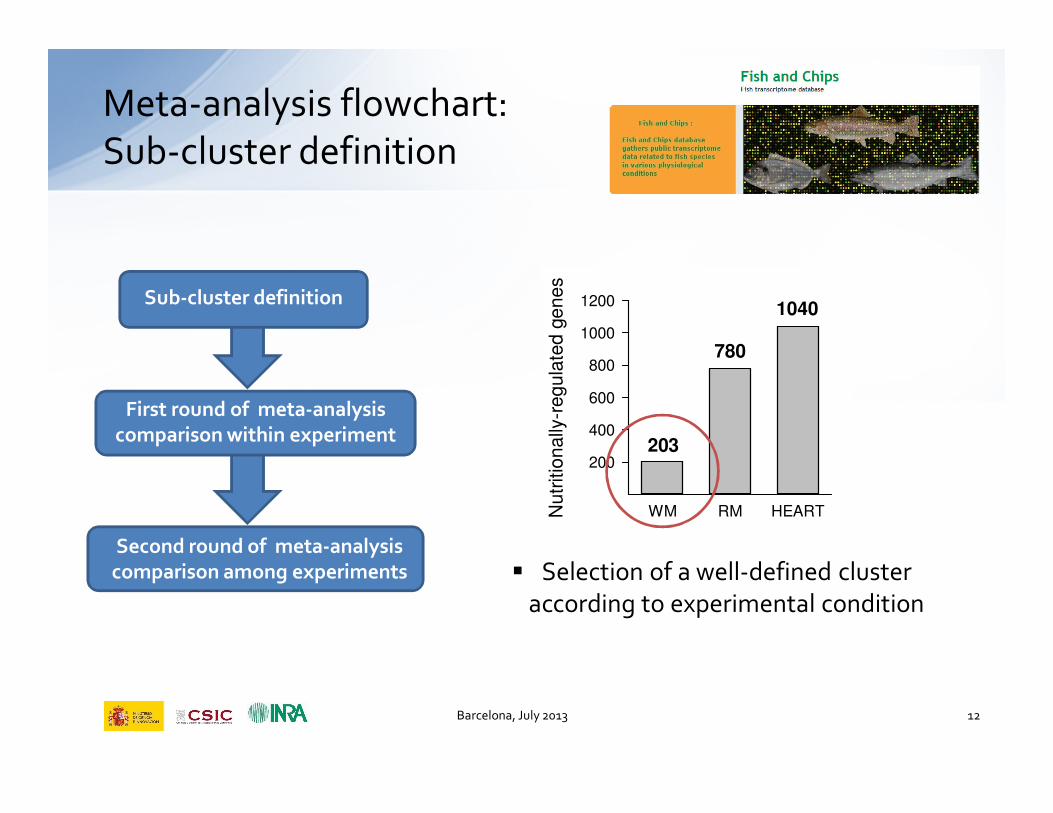
Sub-cluster definition
First round of meta-analysiscomparison within experiment
Second round of meta-analysiscomparison among experiments
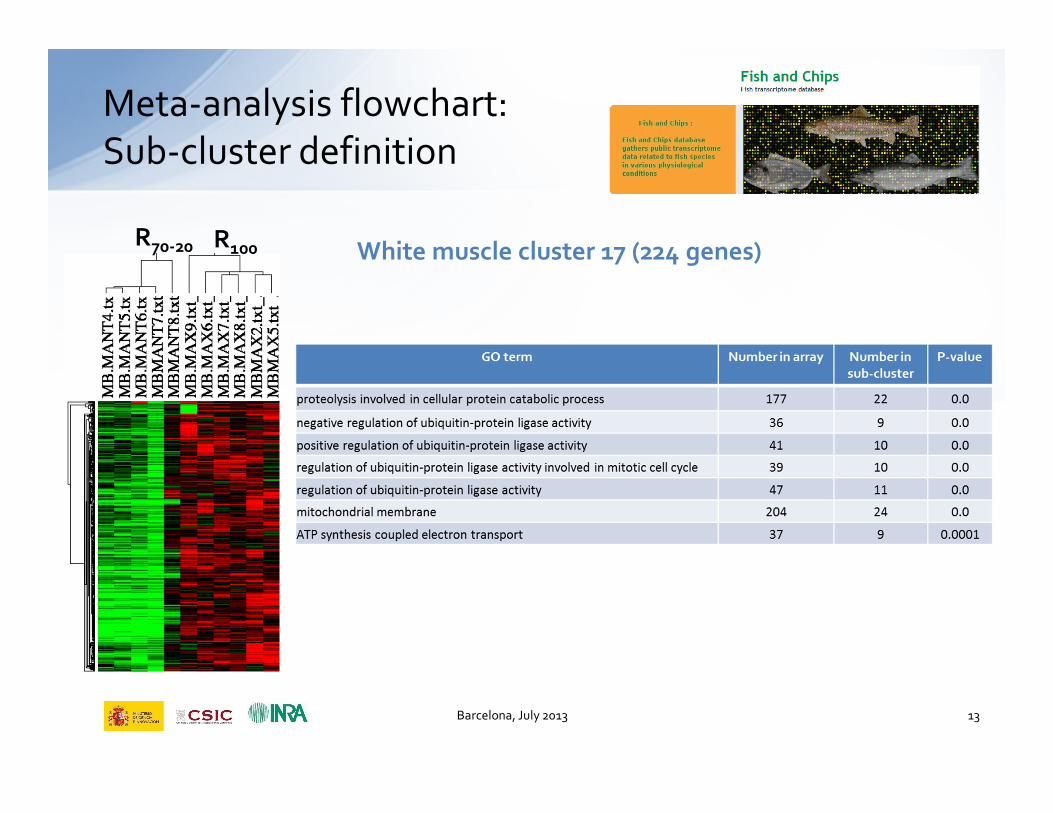
Meta-analysis flowchart: Sub-cluster definition
� Selection of a well-defined clusteraccording to experimental condition
Barcelona, July 2013 12
WM RM HEARTNu
tritio
na
lly-r
eg
ula
ted
ge
ne
s
200
400
600
800
1000
1200
203
780
1040
Meta-analysis flowchart: Sub-cluster definition
R70-20 R100 White muscle cluster 17 (224 genes)
Barcelona, July 2013 13
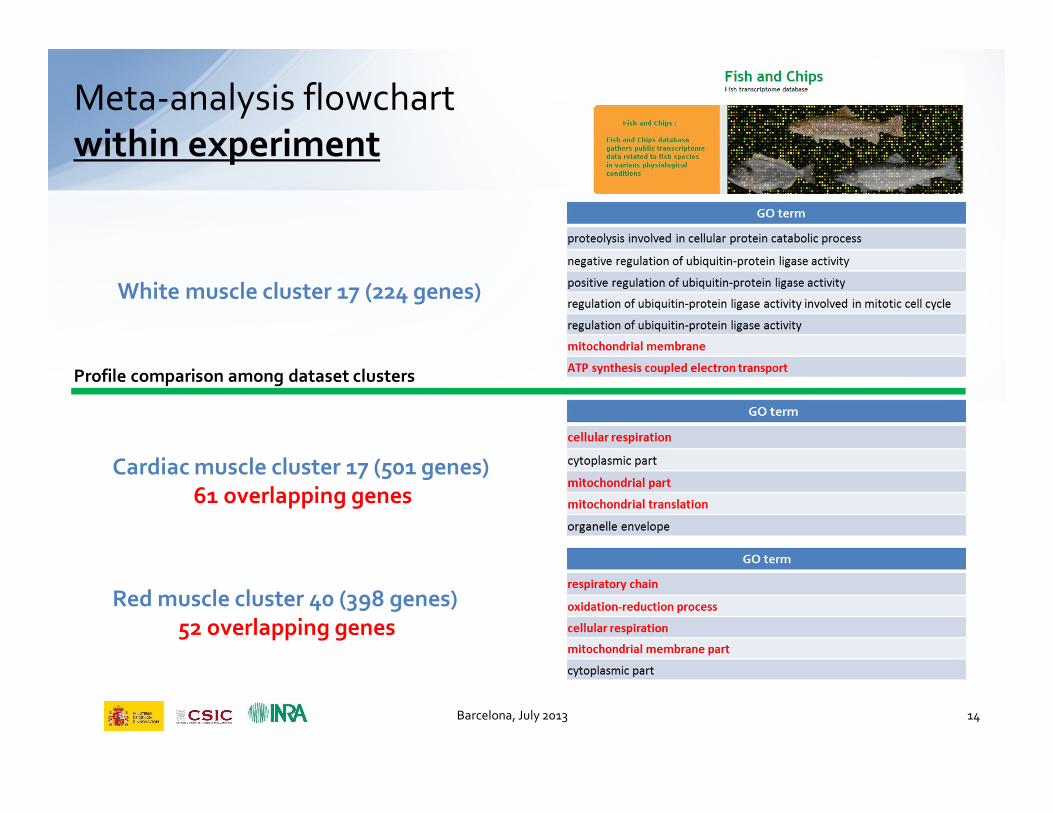
White muscle cluster 17 (224 genes)
Cardiac muscle cluster 17 (501 genes)
61 overlapping genes
Red muscle cluster 40 (398 genes)
52 overlapping genes
Profile comparison among dataset clusters
Barcelona, July 2013 14
Meta-analysis flowchart within experiment

Meta-analysis flowchart among
independent experiments
Cardiac muscle cluster 17 (501 genes)
Liver – Cortisol administration
cluster 40 (139 genes)
41 overlapping genes
Early development cluster 4 (1464 genes)
146 overlapping genes
Profile comparison among dataset clusters
Barcelona, July 2013 15
• Sea bream has divergent muscle transcriptomes• Sea bream has divergent muscle transcriptomes
• Sea bream muscle transcriptomes are differentially regulated bynutrient availability
• Highly expressed and nutritionally regulated genes of WM areenriched in genes related to proteolysis and protein ubiquitination
• Highly expressed and nutritionally regulated genes of heart and RMare enriched in the GO term mitochondria
• Microarray meta-analysis evidences that mitochondria-relatedgenes are a common link within and among tissue transcriptomesin challenged fish
Concluding remarks
Barcelona, July 2013 16
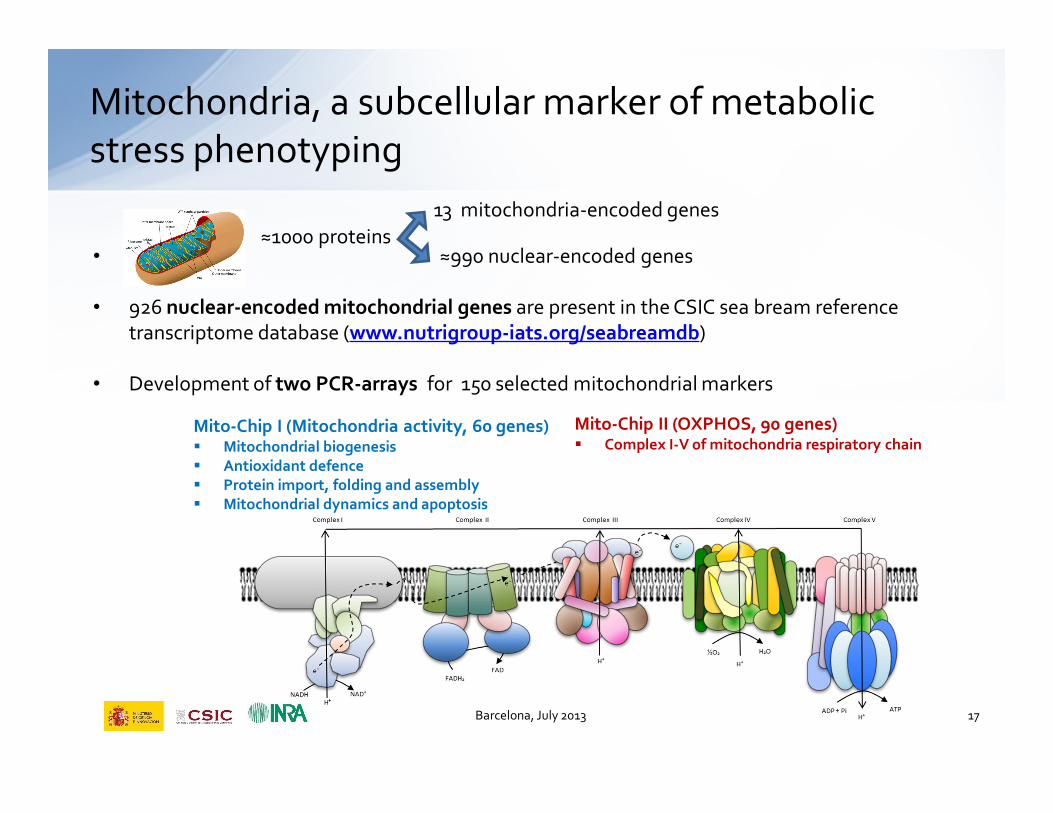
Mitochondria, a subcellular marker of metabolicstress phenotyping
Mito-Chip II (OXPHOS, 90 genes)� Complex I-V of mitochondria respiratory chain
Mito-Chip I (Mitochondria activity, 60 genes) � Mitochondrial biogenesis
� Antioxidant defence
� Protein import, folding and assembly
� Mitochondrial dynamics and apoptosis
•
• 926 nuclear-encoded mitochondrial genes are present in the CSIC sea bream referencetranscriptome database (www.nutrigroup-iats.org/seabreamdb)
• Development of two PCR-arrays for 150 selected mitochondrial markers
≈1000 proteins13 mitochondria-encoded genes
≈990 nuclear-encoded genes
Barcelona, July 2013 17
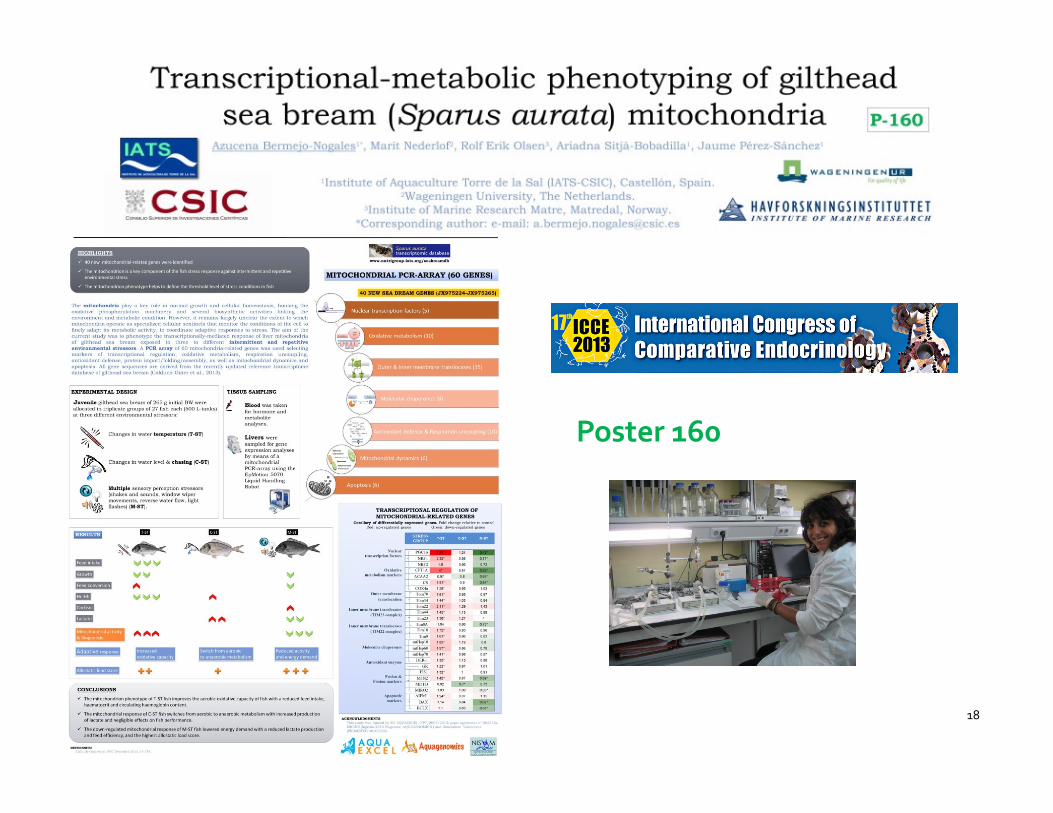
Poster 160
18
ACKNOWLEDGMENTS
Nutrigenomics and Fish Growth Endocrinology Laboratoire de Physiologieet Génomique des Poissons
Jaume Pérez SánchezJosep Calduch Giner
Azucena Bermejo NogalesLaura Benedito Palos
Gabriel Ballester LozanoM. Ángeles González Albaladejo
Patricia Cabrera Martínez
Patrick Prunet
Yann Echasseriau
Funding:
Barcelona, July 2013
Thank you for your attention !!
Barcelona, July 2013