Mitigating N O emission from arable soils
81
Mitigating N 2 O emission from arable soils Dissertation Zur Erlangung des Doktorgrades der Fakultät für Agrarwissenschaften der Georg-August-Universität Göttingen vorgelegt von Haitao Wang geboren in Henan, China Göttingen, 02.05.2019
Transcript of Mitigating N O emission from arable soils

Mitigating N2O emission from arable soils
Dissertation
Zur Erlangung des Doktorgrades
der Fakultät für Agrarwissenschaften
der Georg-August-Universität Göttingen
vorgelegt von
Haitao Wang
geboren in Henan, China
Göttingen, 02.05.2019

D17
1. Referent: Prof. Dr. Klaus Dittert
2. Korreferent: Prof. Dr. Petr Karlovsky
3. Prüferin: Prof. Dr. Michaela Dippold
Tag der mündlichen Prüfung 02.05.2019

1
Contents
Chapter 1: General introduction ............................................................................................................... 3
1.1 N2O emissions from arable lands .................................................................................................. 3
1.2 N2O productions pathways in soil ................................................................................................. 4
1.3 Enhanced efficiency fertilizers to mitigate N2O emission ............................................................. 6
1.4 Impact of plant on N2O emissions ................................................................................................. 7
1.5 Objectives ...................................................................................................................................... 8
1.6 Experimental concept .................................................................................................................... 9
References ............................................................................................................................................... 10
Chapter 2: Use of urease and nitrification inhibitors to reduce gaseous nitrogen emissions from
fertilizers containing ammonium nitrate and urea ................................................................................ 16
Abstract ................................................................................................................................................... 18
Introduction ............................................................................................................................................. 18
Materials and Methods ............................................................................................................................ 18
Results ..................................................................................................................................................... 20
Discussion ............................................................................................................................................... 23
Conclusions ............................................................................................................................................. 25
References ............................................................................................................................................... 25
Chapter 3: Use of urease and nitrification inhibitors to decrease yield-scaled N2O emissions from
winter wheat and oilseed rape fields: a two-year field experiment ....................................................... 28
Abstract ................................................................................................................................................... 28
Introduction ............................................................................................................................................. 29
Materials and methods ............................................................................................................................ 31
Results ..................................................................................................................................................... 35
Discussion ............................................................................................................................................... 42
Conclusions ............................................................................................................................................. 45
References ............................................................................................................................................... 46
Chapter 4: The potential of ryegrass as cover crop to reduce soil N2O emissions and increase the
population size of denitrifying bacteria ................................................................................................... 52
Abstract ................................................................................................................................................... 53
2
Introduction ............................................................................................................................................. 54
Material and Methods ............................................................................................................................. 55
Results ..................................................................................................................................................... 59
Discussion ............................................................................................................................................... 60
Conclusions ............................................................................................................................................. 63
References ............................................................................................................................................... 64
Chapter 5: General Discussion ................................................................................................................. 68
5.1 Effect of urease and nitrification inhibitors on N2O emission ........................................................... 68
5.2 Effect of crop rotation on yield and yield-scaled N2O emissions ...................................................... 69
5.3 The presence of plant affect N2O emissions ...................................................................................... 69
5.4 Approaches for N2O mitigation in arable lands ................................................................................. 71
References ............................................................................................................................................... 72
Chapter 6: Summary ................................................................................................................................. 77
Acknowledgements ..................................................................................................................................... 78

3
Chapter 1: General introduction
1.1 N2O emissions from arable lands
The increasing atmospheric nitrous oxide (N2O) concentration is among the most serious
consequences of anthropogenic alteration of the global nitrogen (N) cycle (Bakken and Frostegard,
2017). N2O was beside carbon dioxide (CO2), methane (CH4) the most well-known greenhouse gas
(GHG) which was induced by human activity (IPCC, 2013). The global warming potential of N2O
could be 265 time higher than CO2 on a 100-year basis (Myhre et al., 2013). Moreover, N2O is
considered as the most important ozone destroyer in latest decades (Ravishankara et al., 2009). The
atmospheric N2O concentration in 2017 was 330 ppb and increased by about 21% than pre-
industrial level (WMO, 2018). Globally, the largest source of N2O emissions were soil ecosystems,
which was estimated at 6.8 Tg N2O-N yr-1, comprising 65% of total atmospheric N2O emission
(IPCC, 2006). Among them were 4.2 Tg N2O-N yr-1 were derived from synthetic nitrogen
fertilization and its indirect emissions.
The most important indictors of N2O emission above all is the input of N in the soil and its
subsequent availability, therefore emission factors (EF) was commonly used to construct most
national GHG inventories (Shcherbak et al., 2014). EF of N2O is defined as the percentage of
fertilizer N that is transformed into N2O emissions. Intergovernmental Panel on Climate Change
(IPCC) suggests that synthetic fertilizer-induced N2O was round to 1%. The fertilizer application
on a global scale is probably to increase, to feed the increasing world population (IPCC, 2006; van
Beek et al., 2010). N2O emissions therefore are likely continue to increase in the coming decades
(Reay et al., 2012).
The most widely used synthetic N fertilizers are urea and urea-containing N fertilizers. Urea
accounts for about 56% of the global production (Bremner, 2007; International Fertilizer Industry
Association, 2013; Suter et al., 2016). Urea is a solid fertilizer with a high N content (46%). It can
easily be stored and applied to crops and it can be added to the soil in combination with other N
fertilizers. Calcium ammonium nitrate (CAN) was beside urea another important fertilizers.
Ammonium nitrate mixed with urea was named urea ammonium nitrate (UAN), which is a liquid

4
N fertilizer consisting of 50% urea and 50% ammonium nitrate and ranging from 28 to 32% N by
weight.
The other side of the coin is the low N use efficiency (NUE). NUE in agriculture was usually lower
than 50% by crops (Drury et al., 2017; Galloway et al., 2003; Sun et al., 2015). About 25% of the
urea applied to the soil surface is converted to ammonia (NH3) and volatilized to the atmosphere
(FAOSTAT, 2015). NH3 have an indirect impact on climate change, because of its relation with
N2O, It is thought that about 1–2% of gaseous NH3 is converted into N2O (Wulf et al., 2002).
Besides, NH3 is known to cause acidification and eutrophication of both soils and surface
(Jongebreur and Voorburg, 1992; Simpson et al., 2012). Therefore, agricultural managements to
increase the NUE along with crop yield, is in other way reducing N2O emissions from agriculture.
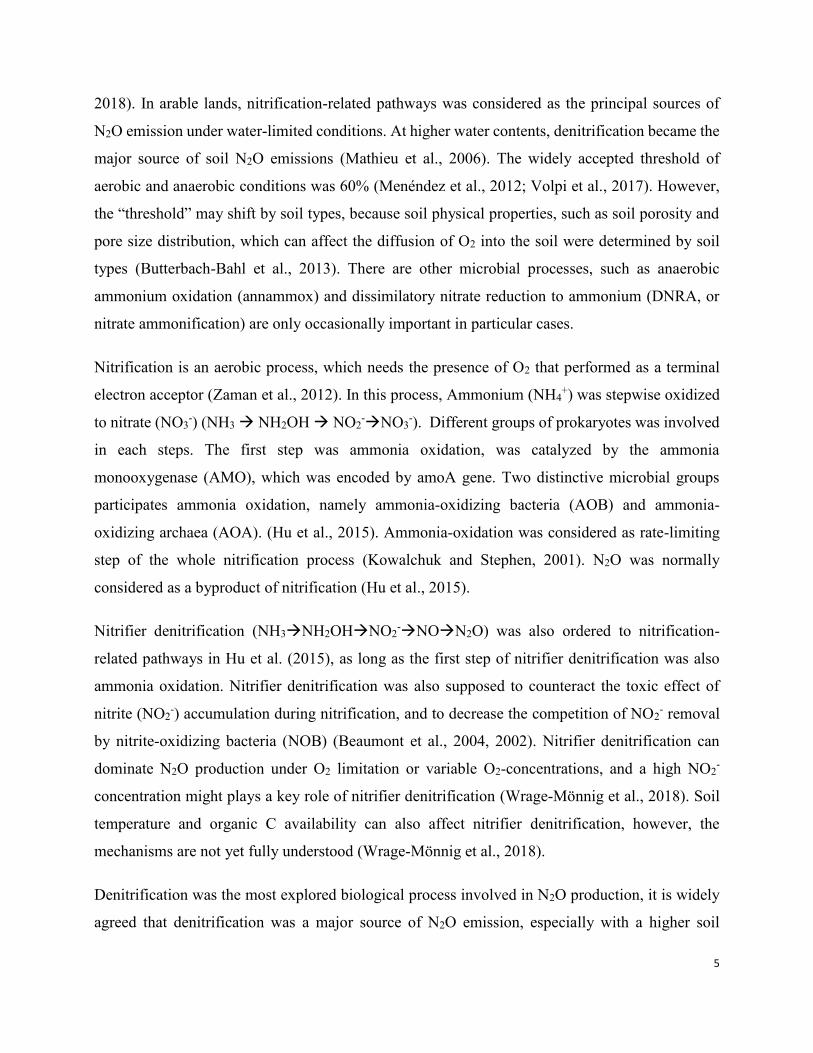
1.2 N2O productions pathways in soil
Fig. 1: The most important pathways of nitrous oxide production in arable lands (after Wrage et
al., 2001, modified)
The most dominant biological process forming N2O from mineral N substrates in arable lands are
nitrification, denitrification (Bremner, 1997) and nitrifier denitrification (Wrage-Mönnig et al.,
Denitrification
Nitrification
NH2OH NO2- NO N2O NH4+ N2
N2O NO3- NO2- NO N2O N2
Nitrifier denitrification
5
2018). In arable lands, nitrification-related pathways was considered as the principal sources of
N2O emission under water-limited conditions. At higher water contents, denitrification became the
major source of soil N2O emissions (Mathieu et al., 2006). The widely accepted threshold of
aerobic and anaerobic conditions was 60% (Menéndez et al., 2012; Volpi et al., 2017). However,
the “threshold” may shift by soil types, because soil physical properties, such as soil porosity and
pore size distribution, which can affect the diffusion of O2 into the soil were determined by soil
types (Butterbach-Bahl et al., 2013). There are other microbial processes, such as anaerobic
ammonium oxidation (annammox) and dissimilatory nitrate reduction to ammonium (DNRA, or
nitrate ammonification) are only occasionally important in particular cases.
Nitrification is an aerobic process, which needs the presence of O2 that performed as a terminal
electron acceptor (Zaman et al., 2012). In this process, Ammonium (NH4+) was stepwise oxidized
to nitrate (NO3-) (NH3 NH2OH NO2
-NO3-). Different groups of prokaryotes was involved
in each steps. The first step was ammonia oxidation, was catalyzed by the ammonia
monooxygenase (AMO), which was encoded by amoA gene. Two distinctive microbial groups
participates ammonia oxidation, namely ammonia-oxidizing bacteria (AOB) and ammonia-
oxidizing archaea (AOA). (Hu et al., 2015). Ammonia-oxidation was considered as rate-limiting
step of the whole nitrification process (Kowalchuk and Stephen, 2001). N2O was normally
considered as a byproduct of nitrification (Hu et al., 2015).
Nitrifier denitrification (NH3NH2OHNO2-NON2O) was also ordered to nitrification-
related pathways in Hu et al. (2015), as long as the first step of nitrifier denitrification was also
ammonia oxidation. Nitrifier denitrification was also supposed to counteract the toxic effect of
nitrite (NO2-) accumulation during nitrification, and to decrease the competition of NO2
- removal
by nitrite-oxidizing bacteria (NOB) (Beaumont et al., 2004, 2002). Nitrifier denitrification can
dominate N2O production under O2 limitation or variable O2-concentrations, and a high NO2-
concentration might plays a key role of nitrifier denitrification (Wrage-Mönnig et al., 2018). Soil
temperature and organic C availability can also affect nitrifier denitrification, however, the
mechanisms are not yet fully understood (Wrage-Mönnig et al., 2018).
Denitrification was the most explored biological process involved in N2O production, it is widely
agreed that denitrification was a major source of N2O emission, especially with a higher soil

6
moisture. In the denitrification pathway, denitrifying microorganisms use NO3- as an electron
acceptor and stepwise reduce it to gaseous N2. N2O was also considered as intermediaries resulted
by incomplete denitrification. Therefore, reduce the N2O/N2 ratio of soil denitrification was a
possible approach to reduce N2O emissions (Schlesinger, 2009).
Each step of soil denitrification is regulated by enzymes such as NO3-, nitrite (NO2
-), and N2O
reductase that are encoded by different functional genes carried by microorganisms (Philippot et
al., 2007). For instance, the first step was regulated by NO3- reductase, periplasmic nitrate reductase
is encoded by nap and membrane-bound NO3- reductase is encoded by nar (Bru et al., 2007). NO2
reductase has two functionally equivalent type, a copper- and a cytochrome cd1-containing NO2
reductase are encoded by the nirK and nirS gene, respectively (Braker et al., 2000; Henry et al.,
2004). The final step of denitrification, is catalyzed by N2O reductase which is encoded by the nos
gene, controls the reduction of N2O to N2. nos-mediated N2O to N2 reduction is the only known
microbial process to reduce N2O in the biosphere (Jones et al., 2013; Philippot et al., 2007). Thus,
increased nos abundances in soils may indicate a more complete denitrification and low N2O/N2
ratio, and possibly reduced N2O emission (Jones et al., 2013). Recently findings of microorganisms
equipped with nos but not the other genes involved in denitrification, can be a valuable contributors
to the soil N2O sink capacity (Jones et al., 2014). Apart bacterial denitrification, fungal
denitrification was also reported as a major source of soil N2O emissions in various of studies
(Shoun Hirofumi et al., 2012; Thamdrup, 2012). It was believed to be an important source of N2O
emission, because fungal genomes usually lack the nos gene, therefore N2O was the final product
of many fungal denitrifiers (Baggs, 2011; Philippot et al., 2011).
1.3 Enhanced efficiency fertilizers to mitigate N2O emission
Good agricultural practice is a possible way to maximize N use efficiency, e.g. the correct
application techniques, good timing and soil testing to determine the amount of fertilizer required.
But agricultural practices always constrained by physical conditions. In last several decades,
several enhanced efficiency fertilizers were developed to increase soil N availability and to
decrease N loss (Chen et al., 2008; Li et al., 2018). A number of chemical products have been
developed to delay the transformation of N in the soil, to better synchronize fertilizer N release
with crop uptake (Li et al., 2018) and these can be added to urea and UAN. Two main categories
of these slow-release products are urease inhibitors and nitrification inhibitors.

7
Urease inhibitors are usually added to urea, the aim of urease inhibitors is to reduce the activity of
the urease enzyme and slow the rate of urea hydrolysis (Sommer et al., 2004). When urea is applied
to the soil, it rapidly hydrolyzes to ammonium carbonate ((NH4)2CO3). (NH4)2CO3 is unstable and
breaks down to NH3 and CO2. The NH3 is either absorbed by the soil or volatilizes. The hydrolysis
reaction is catalyzed by urease enzyme. However, urease enzyme can be blocked by urease
inhibitors. The conversion of urea to NH3 was delayed for a period of 1–2 weeks, allowing time
for the incorporation of NH3 into the soil and utilized by plant uptake. The most effective
compounds to inhibit urease were phosphoryl amides (Bremner and Chai, 1989; McCarty et al.,
1989). from that N-(n-butyl) thiophosphoric triamide (NBPT) was the most widely used product,
and it was proved by many studies that it can effectively prevent the loss of NH3 (Drury et al., 2017;
Liu et al., 2017; Mira et al., 2017; Silva et al., 2017; Tian et al., 2015).
Nitrification inhibitors was intended to decrease the enzymatic activity of NH3 oxidizing bacteria
(Ruser and Schulz, 2015). With the addition of nitrification inhibitors to urea, the conversion of
ammonium ions (NH4+) to NO3
− is prevented. Hence, soil NO3- leaching and the production of N2O
emissions from denitrification was also prevented. The most extensively studied compounds are
nitrapyrin (Belser and Schmidt, 1981; Habibullah et al., 2018; Wolt, 2004; Zacherl and Amberger,
1990), Dicyandiamide (DCD) (Di et al., 2014; Guo et al., 2014; Liu et al., 2017; Zaman et al., 2013)
and 3,4-dimethylpyrazol-phosphate (DMPP) (Liu et al., 2015; Pasda et al., 2001; Rose et al., 2018;
Shi et al., 2017). In Germany, Piadin (1H-1, 2, 4-triazole and 3-methylpyrazole) and Vizura
(containing DMPP) are more often used commercial products. Although only a few studies focused
on Piadin, but it has also been shown to be effective in reducing N2O emissions (Pietzner et al.,
2017; Wolf et al., 2014; Wu et al., 2017).
1.4 Impact of plant on N2O emissions
The presence of plant and its rhizosphere modifies the major factors regulating nitrification and
denitrification: carbon, NO3- and oxygen. It was estimated that 5-21% of photosynthesis
assimilated carbon (C) is released into the soil as root exudates (Derrien et al., 2004; Nguyen, 2003).
The intensity of C turnover processes in rhizosphere are estimated to be at least one order of
magnitude greater than in the bulk soil (Kuzyakov, 2010). As root-released C served as an electron
donor (Philippot et al., 2007), root exudates was also supposed to increase denitrification activity
(Bijay-singh et al., 1988). Most of the root exudates were easily available for soil microbes, and
8
can be metabolized within a few hours (Fischer and Kuzyakov, 2010; Jones et al., 2005; Jones and
Kielland, 2002; Kuzyakov and Xu, 2013). Therefore, soil microbial community, for example
denitrifying microbes, can be several times greater in rhizosphere, compared to bulk soil (Chèneby
et al., 2004; Herman et al., 2006). However, until now, how the diversity of denitrifiers and the
expression of denitrification genes are affected by root exudates was still little understood (Henry
et al., 2008)
There was an intense competition for mineral N between plant roots and soil microorganisms
(Kuzyakov and Xu, 2013). The availability of mineral N in soils is considered as the major factor
limiting nitrification and denitrification (Philippot et al., 2007; Saggar et al., 2013). The uptake of
ammonium (NH4+) by plants can lead to strong depletion zones of NH4
+ in the rhizosphere (Orcutt,
2000). In contrast, depletion zones of NO3- in the rhizosphere are less pronounced, due to its high
mobility within most soils (Kuzyakov and Xu, 2013). However, the concentration of NO3- in soil
can rapidly be decreased by root uptake (Tinker and Nye, 2000). Likewise, regulatory functions of
soil NO3- on denitrifying soil communities were reported from different ecosystems (Correa-
Galeote et al., 2017; Deiglmayr et al., 2006; Enwall et al., 2005). The effect of different soil NO3-
concentrations on the abundance and diversity of denitrifiers in soils, however, still remains to be
elucidated (Correa-Galeote et al., 2017).
The effect of plants on oxygen is more complex (Philippot et al., 2007). On the one hand, oxygen
depleting zone emerges in the rhizosphere by respiration of the roots and soil microbes (Bakken,
1988; Hayashi et al., 2015). On the other hand, soil gas exchange and oxygen concentration was
increased, due the consumption of water by plant roots (Philippot et al., 2007). How the changed
O2 concentration in rhizosphere affect soil denitrification, still received contradictory conclusions
(Chantigny et al., 1996; Klemedtsson et al., 1987; Morley et al., 2008; Prade and Trolldenier, 1988).
1.5 Objectives
The present study aimed mitigating N2O emission in arable lands. Enhanced efficiency fertilizers
were an important approach to achieve this goal, but the effectiveness suffers high uncertainty.
Both incubation and field experiment are important tools to evaluate the effectiveness of urease
and nitrification inhibitors, but both have their advantages and drawbacks. Hence, our objective
are:

9
1. To evaluate the effectiveness of NBPT, Piadin and a new inhibitor NZONE MAX, on
reducing NH3 and N2O emissions, under laboratory conditions.
2. To assess the effect of DMPP and NBPT on grain yield and reduction of N2O emission in
a wheat- wheat- oilseed rape rotation system, with a two-year field experiment.
3. With the comparison of unplanted and planted soils, we try to understand how the presence
of Lolium perenne affect soil C and N dynamics, N2O emissions, and soil denitrifying
communities.
1.6 Experimental concept
The study includes both incubation and field experiments. The two-year field experiment was
conducted on Reinshof agricultural research station, University of Goettingen, Lower Saxony,
Germany (51°29‘50.3‘‘N, 9°55‘59.9‘‘E). Soil for incubation experiment was also collected from
Reinshof research station. Mean annual precipitation: 651 ± 24 mm, mean annual temperature: 9.2
± 0.1 °C (1981 – 2010, meteorological station at Goettingen, station ID: 1691, Germany's National
Meteorological Service). The soil is classified as a Luvisol (IUSS, 2015) and the texture of the
topsoil (0–25 cm) was classified into 61% silt, 23% sand, and 16% clay, with a 2% of total C. The
bulk density is 1.3 g cm-3, the soil pH was 7.1 ± 0.1 in all measured samples. Gas collection use
closed chamber methods. The chamber volume varies in different experiments, but the basic idea
is with a closed, air-tight chamber inserted on the soil, soil emitted spur gas for example CO2, N2O
and CH4 accumulates in the chamber, we collect the gas samples at 0, 20 and 40 min after the
enclosure, then we measure CO2, N2O and CH4 concentration on gas chromatograph (GC), later
we use linear regression (Parkin et al., 2012) to calculate the gas flux rates. In all experiments, soil
samples were taken with auger, and then stored at -20°C until further analysis. Following
parameters were measured later: Water filled pore space (WFPS), soil ammonium (NH4+) and
nitrite (NO3-), soil pH, total C and N, dissolved organic carbon (DOC) analyses and the copy
number of bacterial 16S rRNA genes, fungal 18S rRNA genes, narG, napA, nirK, nirS, nosZ clade
I and nosZ clade II.

10
References
Baggs, E.M., 2011. Soil microbial sources of nitrous oxide: recent advances in knowledge, emerging
challenges and future direction. Curr. Opin. Environ. Sustain., Carbon and nitrogen cycles 3, 321–327. https://doi.org/10.1016/j.cosust.2011.08.011
Bakken, L.R., 1988. Denitrification under different cultivated plants: effects of soil moisture tension,
nitrate concentration, and photosynthetic activity. Biol. Fertil. Soils 6, 271–278.
https://doi.org/10.1007/BF00261011
Bakken, L.R., Frostegard, A., 2017. Sources and sinks for N2O, can microbiologist help to mitigate N2O
emissions? Environ. Microbiol. 19, 4801–4805. https://doi.org/10.1111/1462-2920.13978
Beaumont, H.J.E., Hommes, N.G., Sayavedra-Soto, L.A., Arp, D.J., Arciero, D.M., Hooper, A.B.,
Westerhoff, H.V., Spanning, R.J.M. van, 2002. Nitrite Reductase of Nitrosomonas europaea Is
Not Essential for Production of Gaseous Nitrogen Oxides and Confers Tolerance to Nitrite. J.
Bacteriol. 184, 2557–2560. https://doi.org/10.1128/JB.184.9.2557-2560.2002
Beaumont, H.J.E., Lens, S.I., Reijnders, W.N.M., Westerhoff, H.V., van Spanning, R.J.M., 2004.
Expression of nitrite reductase in Nitrosomonas europaea involves NsrR, a novel nitrite-sensitive
transcription repressor. Mol. Microbiol. 54, 148–158. https://doi.org/10.1111/j.1365-
2958.2004.04248.x
Belser, L.W., Schmidt, E.L., 1981. Inhibitory Effect of Nitrapyrin on Three Genera of Ammonia-
Oxidizing Nitrifiers. Appl Env. Microbiol 41, 819–821.
Bijay-singh, Ryden, J.C., Whitchead, D.C., 1988. Some relationships between denitrification potential and
fractions of organic carbon in air-dried and field-moist soils. Soil Biol. Biochem. 20, 737–741.
https://doi.org/10.1016/0038-0717(88)90160-5
Braker, G., Zhou, J., Wu, L., Devol, A.H., Tiedje, J.M., 2000. Nitrite reductase genes (nirK and nirS) as
functional markers to investigate diversity of denitrifying bacteria in Pacific northwest marine
sediment communities. Appl Env. Microbiol 66, 2096–2104.
https://doi.org/10.1128/AEM.66.5.2096-2104.2000
Bremner, 1997. Sources of nitrous oxide in soils. Nutr. Cycl. Agroecosystems 49, 7–16.
https://doi.org/10.1023/A:1009798022569
Bremner, J.M., 2007. Problems in the use of urea as a nitrogen fertilizer. Soil Use Manag. 6, 70–71.
Bremner, J.M., Chai, H.S., 1989. Effects of phosphoroamides on ammonia volatilization and nitrite
accumulation in soils treated with urea. Biol. Fertil. Soils 8, 227–230.
https://doi.org/10.1007/BF00266483
Bru, D., Sarr, A., Philippot, L., 2007. Relative abundances of proteobacterial membrane-bound and
periplasmic nitrate reductases in selected environments. Appl Env. Microbiol 73, 5971–5974.
https://doi.org/10.1128/AEM.00643-07
Butterbach-Bahl, Baggs Elizabeth M., Dannenmann Michael, Kiese Ralf, Zechmeister-Boltenstern
Sophie, 2013. Nitrous oxide emissions from soils: how well do we understand the processes and
their controls? Philos. Trans. R. Soc. B Biol. Sci. 368, 20130122.
https://doi.org/10.1098/rstb.2013.0122
Chantigny, M.H., Prévost, D., Angers, D.A., Vézina, L.-P., Chalifour, F.-P., 1996. Microbial biomass and
N transformations in two soils cropped with annual and perennial species. Biol. Fertil. Soils 21,
239–244. https://doi.org/10.1007/BF00334898

11
Chen, D., Suter, H., Islam, A., Edis, R., Freney, J.R., Walker, C.N., 2008. Prospects of improving
efficiency of fertiliser nitrogen in Australian agriculture: a review of enhanced efficiency
fertilisers. Soil Res. 46, 289–301. https://doi.org/10.1071/SR07197
Chèneby, D., Perrez, S., Devroe, C., Hallet, S., Couton, Y., Bizouard, F., Iuretig, G., Germon, J.C.,
Philippot, L., 2004. Denitrifying bacteria in bulk and maize-rhizospheric soil: diversity and N2O-
reducing abilities. Can. J. Microbiol. 50, 469–474. https://doi.org/10.1139/w04-037
Correa-Galeote, D., Tortosa, G., Moreno, S., Bru, D., Philippot, L., Bedmar, E.J., 2017. Spatiotemporal
Variations in the Abundance and Structure of Denitrifier Communities in Sediments Differing in
Nitrate Content. Curr. Issues Mol. Biol. 24, 71–102. https://doi.org/10.21775/cimb.024.071
Deiglmayr, K., Philippot, L., Kandeler, E., 2006. Functional stability of the nitrate-reducing community in
grassland soils towards high nitrate supply. Soil Biol. Biochem. 38, 2980–2984.
https://doi.org/10.1016/j.soilbio.2006.04.034
Derrien, D., Marol, C., Balesdent, J., 2004. The dynamics of neutral sugars in the rhizosphere of wheat.
An approach by13C pulse-labelling and GC/C/IRMS. Plant Soil 267, 243–253.
https://doi.org/10.1007/s11104-005-5348-8
Drury, C.F., Yang, X., Reynolds, W.D., Calder, W., Oloya, T.O., Woodley, A.L., 2017. Combining urease
and nitrification inhibitors with incorporation reduces ammonia and nitrous oxide emissions and
increases corn yields. J. Environ. Qual. 46, 939–949. https://doi.org/10.2134/jeq2017.03.0106
Enwall, K., Philippot, L., Hallin, S., 2005. Activity and composition of the denitrifying bacterial
community respond differently to long-term fertilization. Appl. Environ. Microbiol. 71, 8335–8343. https://doi.org/10.1128/AEM.71.12.8335-8343.2005
FAOSTAT, 2015. Food and Agricultural Organization of the United Nations. Statistics Division [WWW
Document]. URL http://www.fao.org/faostat/en/#data/QC (accessed 2.3.18).
Galloway, J.N., Aber, J.D., Erisman, J.W., Seitzinger, S.P., Howarth, R.W., Cowling, E.B., Cosby, B.J.,
2003. The Nitrogen Cascade. BioScience 53, 341–356. https://doi.org/10.1641/0006-
3568(2003)053[0341:TNC]2.0.CO;2
Habibullah, H., Nelson, K.A., Motavalli, P.P., 2018. Management of Nitrapyrin and Pronitridine
Nitrification Inhibitors with Urea Ammonium Nitrate for Winter Wheat Production. Agronomy 8,
204. https://doi.org/10.3390/agronomy8100204
Hayashi, K., Tokida, T., Kajiura, M., Yanai, Y., Yano, M., 2015. Cropland soil–plant systems control
production and consumption of methane and nitrous oxide and their emissions to the atmosphere.
Soil Sci. Plant Nutr.
Henry, S., Baudoin, E., López-Gutiérrez, J.C., Martin-Laurent, F., Brauman, A., Philippot, L., 2004.
Quantification of denitrifying bacteria in soils by nirK gene targeted real-time PCR. J. Microbiol.
Methods 59, 327–335. https://doi.org/10.1016/j.mimet.2004.07.002
Henry, S., Texier, S., Hallet, S., Bru, D., Dambreville, C., Chèneby, D., Bizouard, F., Germon, J.C.,
Philippot, L., 2008. Disentangling the rhizosphere effect on nitrate reducers and denitrifiers:
insight into the role of root exudates. Environ. Microbiol. 10, 3082–3092.
https://doi.org/10.1111/j.1462-2920.2008.01599.x
Herman, D.J., Johnson, K.K., Jaeger, C.H., Schwartz, E., Firestone, M.K., 2006. Root influence on
nitrogen mineralization and nitrification in Avena barbata rhizosphere soil. Soil Sci. Soc. Am. J.
70, 1504–1511. https://doi.org/10.2136/sssaj2005.0113

12
Hu, H.-W., Chen, D., He, J.-Z., 2015. Microbial regulation of terrestrial nitrous oxide formation:
understanding the biological pathways for prediction of emission rates. FEMS Microbiol. Rev. 39,
729–749. https://doi.org/10.1093/femsre/fuv021
International Fertilizer Industry Association, 2013. Fertilizer Indicators, 3rd ed. Paris.
IPCC, 2013. Climate Change 2013: The physical Science Basis. IPCC Working Group I Contribution to
AR5 pp 84.
IPCC, 2006. Guidelines for National Greenhouse Gas Inventories.
Jones, C.M., Graf, D.R., Bru, D., Philippot, L., Hallin, S., 2013. The unaccounted yet abundant nitrous
oxide-reducing microbial community: a potential nitrous oxide sink. ISME J. 7, 417–426.
https://doi.org/10.1038/ismej.2012.125
Jones, C.M., Spor, A., Brennan, F.P., Breuil, M.-C., Bru, D., Lemanceau, P., Griffiths, B., Hallin, S.,
Philippot, L., 2014. Recently identified microbial guild mediates soil N2O sink capacity. Nat.
Clim. Change 4, 801–805. https://doi.org/10.1038/nclimate2301
Jongebreur, A.A., Voorburg, J.H., 1992. The role of ammonia in acidification. Perspectives for the
prevention and reduction of emissions from livestock operations, in: Schneider, T. (Ed.), Studies
in Environmental Science, Acidification Research: Etvaluation and Policy Applications. Elsevier,
pp. 55–64. https://doi.org/10.1016/S0166-1116(08)70101-8
Klemedtsson, L., Svensson, B.H., Rosswall, T., 1987. Dinitrogen and nitrous oxide produced by
denitrification and nitrification in soil with and without barley plants. Plant Soil 99, 303–319.
https://doi.org/10.1007/BF02370877
Kowalchuk, G.A., Stephen, J.R., 2001. Ammonia-oxidizing bacteria: a model for molecular microbial
ecology. Annu. Rev. Microbiol. 55, 485–529. https://doi.org/10.1146/annurev.micro.55.1.485
Kuzyakov, Y., 2010. Priming effects: Interactions between living and dead organic matter. Soil Biol.
Biochem. 42, 1363–1371. https://doi.org/10.1016/j.soilbio.2010.04.003
Kuzyakov, Y., Xu, X., 2013. Competition between roots and microorganisms for nitrogen: mechanisms
and ecological relevance. New Phytol. 198, 656–669. https://doi.org/10.1111/nph.12235
Li, T., Zhang, W., Yin, J., Chadwick, D., Norse, D., Lu, Y., Liu, X., Chen, X., Zhang, F., Powlson, D.,
Dou, Z., 2018. Enhanced-efficiency fertilizers are not a panacea for resolving the nitrogen
problem. Glob. Change Biol. 24, e511–e521. https://doi.org/10.1111/gcb.13918
Liu, R., Hayden, H., Suter, H., He, J., Chen, D., 2015. The effect of nitrification inhibitors in reducing
nitrification and the ammonia oxidizer population in three contrasting soils. J. Soils Sediments 15,
1113–1118. https://doi.org/10.1007/s11368-015-1086-6
Liu, S., Wang, J.J., Tian, Z., Wang, X., Harrison, S., 2017. Ammonia and greenhouse gas emissions from
a subtropical wheat field under different nitrogen fertilization strategies. J. Environ. Sci. 57, 196–210. https://doi.org/10.1016/j.jes.2017.02.014
Mathieu, O., Hénault, C., Lévêque, J., Baujard, E., Milloux, M.-J., Andreux, F., 2006. Quantifying the
contribution of nitrification and denitrification to the nitrous oxide flux using 15N tracers.
Environ. Pollut. Barking Essex 1987 144, 933–940. https://doi.org/10.1016/j.envpol.2006.02.005
McCarty, G.W., Bremner, J.M., Chai, H.S., 1989. Effect of N-(n-butyl) thiophosphoric triamide on
hydrolysis of urea by plant, microbial, and soil urease. Biol. Fertil. Soils 8, 123–127.
https://doi.org/10.1007/BF00257755
13
Menéndez, S., Barrena, I., Setien, I., González-Murua, C., Estavillo, J.M., 2012. Efficiency of nitrification
inhibitor DMPP to reduce nitrous oxide emissions under different temperature and moisture
conditions. Soil Biol. Biochem. 53, 82–89. https://doi.org/10.1016/j.soilbio.2012.04.026
Mira, A.B., Cantarella, H., Souza-Netto, G.J.M., Moreira, L.A., Kamogawa, M.Y., Otto, R., 2017.
Optimizing urease inhibitor usage to reduce ammonia emission following urea application over
crop residues. Agric. Ecosyst. Environ. 248, 105–112. https://doi.org/10.1016/j.agee.2017.07.032
Morley, N., Baggs, E.M., Dörsch, P., Bakken, L., 2008. Production of NO, N2O and N2 by extracted soil
bacteria, regulation by NO2− and O2 concentrations. FEMS Microbiol. Ecol. 65, 102–112.
https://doi.org/10.1111/j.1574-6941.2008.00495.x
Myhre, G.D., Shindell, F.M., Bréon, W., Collins, J., Fuglestvedt, J., Huang, D., Koch, J.F., Lamarque, D.,
Lee, B., Mendoza, T., Nakajima, A., Robock, G., Stephens, T., Takemura, H., Z., 2013.
Anthropogenic and Natural Radiative Forcing. Clim. Change 2013 Phys. Sci. Basis Contrib.
Work. Group Fifth Assess. Rep. Intergov. Panel Clim. Change.
Nguyen, C., 2003. Rhizodeposition of organic C by plants: mechanisms and controls. Agronomie 23, 375–396. https://doi.org/10.1051/agro:2003011
Orcutt, D.M., 2000. The Physiology of Plants Under Stress: Soil and Biotic Factors. John Wiley & Sons
Inc, New York, NY, USA.
Parkin, T.B., Venterea, R.T., Hargreaves, S.K., 2012. Calculating the detection limits of chamber-based
soil greenhouse gas flux measurements. J. Environ. Qual. 41, 705.
Pasda, G., Hähndel, R., Zerulla, W., 2001. Effect of fertilizers with the new nitrification inhibitor DMPP
(3,4-dimethylpyrazole phosphate) on yield and quality of agricultural and horticultural crops.
Biol. Fertil. Soils 34, 85–97. https://doi.org/10.1007/s003740100381
Philippot, L., Andert, J., Jones, C.M., Bru, D., Hallin, S., 2011. Importance of denitrifiers lacking the
genes encoding the nitrous oxide reductase for N2O emissions from soil. Glob. Change Biol. 17,
1497–1504. https://doi.org/10.1111/j.1365-2486.2010.02334.x
Philippot, L., Hallin, S., Schloter, M., 2007. Ecology of Denitrifying Prokaryotes in Agricultural Soil, in:
Advances in Agronomy, Advances in Agronomy. Academic Press, pp. 249–305.
https://doi.org/10.1016/S0065-2113(07)96003-4
Pietzner, B., Rücknagel, J., Koblenz, B., Bednorz, D., Tauchnitz, N., Bischoff, J., Köbke, S., Meurer,
K.H.E., Meißner, R., Christen, O., 2017. Impact of slurry strip-till and surface slurry incorporation
on NH3 and N2O emissions on different plot trials in Central Germany. Soil Tillage Res. 169, 54–64.
Prade, K., Trolldenier, G., 1988. Effect of wheat roots on denitrification at varying soil air-filled porosity
and organic-carbon content. Biol. Fertil. Soils 7, 1–6. https://doi.org/10.1007/BF00260723
Ravishankara, A.R., Daniel, J.S., Portmann, R.W., 2009. Nitrous oxide (N2O): the dominant ozone-
depleting substance emitted in the 21st century. Science 326, 123–125.
https://doi.org/10.1126/science.1176985
Reay, D.S., Davidson, E.A., Smith, K.A., Smith, P., Melillo, J.M., Dentener, F., Crutzen, P.J., 2012.
Global agriculture and nitrous oxide emissions. Nat. Clim. Change 2, 410–416.
https://doi.org/10.1038/nclimate1458
Rose, T.J., Wood, R.H., Rose, M.T., Van Zwieten, L., 2018. A re-evaluation of the agronomic
effectiveness of the nitrification inhibitors DCD and DMPP and the urease inhibitor NBPT. Agric.
Ecosyst. Environ. 252, 69–73. https://doi.org/10.1016/j.agee.2017.10.008

14
Ruser, R., Schulz, R., 2015. The effect of nitrification inhibitors on the nitrous oxide (N2O) release from agricultural soils—a review. J. Plant Nutr. Soil Sci. 178, 171–188.
Saggar, S., Jha, N., Deslippe, J., Bolan, N.S., Luo, J., Giltrap, D.L., Kim, D.-G., Zaman, M., Tillman, R.W., 2013. Denitrification and N2O:N2 production in temperate grasslands: Processes, measurements, modelling and mitigating negative impacts. Sci. Total Environ., Soil as a Source & Sink for Greenhouse Gases 465, 173–195. https://doi.org/10.1016/j.scitotenv.2012.11.050
Schlesinger, W.H., 2009. On the fate of anthropogenic nitrogen. Proc. Natl. Acad. Sci. 106, 203–208. https://doi.org/10.1073/pnas.0810193105
Shcherbak, I., Millar, N., Robertson, G.P., 2014. Global metaanalysis of the nonlinear response of soil nitrous oxide (N2O) emissions to fertilizer nitrogen. Proc. Natl. Acad. Sci. 111, 9199–9204. https://doi.org/10.1073/pnas.1322434111
Shi, X., Hu, H.-W., Kelly, K., Chen, D., He, J.-Z., Suter, H., 2017. Response of ammonia oxidizers and denitrifiers to repeated applications of a nitrification inhibitor and a urease inhibitor in two pasture soils. J. Soils Sediments 17, 974–984. https://doi.org/10.1007/s11368-016-1588-x
Shoun Hirofumi, Fushinobu Shinya, Jiang Li, Kim Sang-Wan, Wakagi Takayoshi, 2012. Fungal denitrification and nitric oxide reductase cytochrome P450nor. Philos. Trans. R. Soc. B Biol. Sci. 367, 1186–1194. https://doi.org/10.1098/rstb.2011.0335
Silva, A.G.B., Sequeira, C.H., Sermarini, R.A., Otto, R., 2017. Urease Inhibitor NBPT on Ammonia Volatilization and Crop Productivity: A Meta-Analysis. Agron. J. 109, 1–13. https://doi.org/10.2134/agronj2016.04.0200
Simpson, D., Benedictow, A., Berge, H., Bergström, R., Emberson, L.D., Fagerli, H., Flechard, C.R., Hayman, G.D., Gauss, M., Jonson, J.E., Jenkin, M.E., Nyíri, A., Richter, C., Semeena, V.S., Tsyro, S., Tuovinen, J.-P., Valdebenito, Á., Wind, P., 2012. The EMEP MSC-W chemical transport model – technical description. Atmospheric Chem. Phys. 12, 7825–7865. https://doi.org/10.5194/acp-12-7825-2012
Sommer, S.G., Schjoerring, J.K., Denmead, O.T., 2004. Ammonia Emission from Mineral Fertilizers and Fertilized Crops, in: Advances in Agronomy. Academic Press, pp. 557–622. https://doi.org/10.1016/S0065-2113(03)82008-4
Sun, H., Zhang, H., Powlson, D., Min, J., Shi, W., 2015. Rice production, nitrous oxide emission and ammonia volatilization as impacted by the nitrification inhibitor 2-chloro-6-(trichloromethyl)-pyridine. Field Crops Res. 173, 1–7. https://doi.org/10.1016/j.fcr.2014.12.012
Suter, H.C., Sultana, H., Davies, R., Walker, C., Chen, D., 2016. Influence of enhanced efficiency fertilisation techniques on nitrous oxide emissions and productivity response from urea in a temperate Australian ryegrass pasture. Soil Res. 54, 523–532. https://doi.org/10.1071/SR15317
Thamdrup, B., 2012. New Pathways and Processes in the Global Nitrogen Cycle. Annu. Rev. Ecol. Evol. Syst. 43, 407–428. https://doi.org/10.1146/annurev-ecolsys-102710-145048
Tian, Z., Wang, J.J., Liu, S., Zhang, Z., Dodla, S.K., Myers, G., 2015. Application effects of coated urea and urease and nitrification inhibitors on ammonia and greenhouse gas emissions from a subtropical cotton field of the Mississippi delta region. Sci. Total Environ. 533, 329–338. https://doi.org/10.1016/j.scitotenv.2015.06.147
Tinker, P.B., Nye, P.H., 2000. Solute Movement in the Rhizosphere. Oxford University Press, Oxford, UK.
van Beek, C.L., Meerburg, B.G., Schils, R.L.M., Verhagen, J., Kuikman, P.J., 2010. Feeding the world’s increasing population while limiting climate change impacts: linking N2O and CH4 emissions

15
from agriculture to population growth. Environ. Sci. Policy 13, 89–96.
https://doi.org/10.1016/j.envsci.2009.11.001
Volpi, I., Laville, P., Bonari, E., o di Nasso, N.N., Bosco, S., 2017. Improving the management of mineral
fertilizers for nitrous oxide mitigation: The effect of nitrogen fertilizer type, urease and
nitrification inhibitors in two different textured soils. Geoderma 307, 181–188.
https://doi.org/10.1016/j.geoderma.2017.08.018
WMO, 2018. WMO Greenhouse Gas Bulletin (GHG Bulletin) - No. 14 : The State of Greenhouse Gases in the Atmosphere Based on Global Observations through 2017. WMO.
Wolf, U., Fuss, R., Hoeppner, F., Flessa, H., 2014. Contribution of N2O and NH3 to total greenhouse gas
emission from fertilization: results from a sandy soil fertilized with nitrate and biogas digestate
with and without nitrification inhibitor. Nutr. Cycl. Agroecosystems 100, 121–134.
https://doi.org/10.1007/s10705-014-9631-z
Wolt, J.D., 2004. A meta-evaluation of nitrapyrin agronomic and environmental effectiveness with
emphasis on corn production in the Midwestern USA. Nutr. Cycl. Agroecosystems 69, 23–41.
https://doi.org/10.1023/B:FRES.0000025287.52565.99
Wrage, N., Velthof, G.L., van Beusichem, M.L., Oenema, O., 2001. Role of nitrifier denitrification in the
production of nitrous oxide. Soil Biol. Biochem. 33, 1723–1732. https://doi.org/10.1016/S0038-
0717(01)00096-7
Wrage-Mönnig, N., Horn, M.A., Well, R., Müller, C., Velthof, G., Oenema, O., 2018. The role of nitrifier
denitrification in the production of nitrous oxide revisited. Soil Biol. Biochem. 123, A3–A16.
https://doi.org/10.1016/j.soilbio.2018.03.020
Wu, D., Senbayram, M., Well, R., Brueggemann, N., Pfeiffer, B., Loick, N., Stempfhuber, B., Dittert, K.,
Bol, R., 2017. Nitrification inhibitors mitigate N2O emissions more effectively under straw-
induced conditions favoring denitrification. Soil Biol. Biochem. 104, 197–207.
https://doi.org/10.1016/j.soilbio.2016.10.022
Wulf, S., Maeting, M., Clemens, J., 2002. Application technique and slurry co-fermentation effects on
ammonia, nitrous oxide, and methane emissions after spreading. J. Environ. Qual. 31, 1795.
Zacherl, B., Amberger, A., 1990. Effect of the nitrification inhibitors dicyandiamide, nitrapyrin and
thiourea onNitrosomonas europaea. Fertil. Res. 22, 37–44. https://doi.org/10.1007/BF01054805
Zaman, M., Nguyen, M.L., Šimek, M., Nawaz, S., Khan, M.J., Babar, M.N., Zaman, S., 2012. Emissions of Nitrous Oxide (N2O) and Di-Nitrogen (N2) from the Agricultural Landscapes, Sources, Sinks,
and Factors Affecting N2O and N2 Ratios. Greenh. Gases - Emiss. Meas. Manag.
https://doi.org/10.5772/32781

16
Chapter 2: Use of urease and nitrification inhibitors to reduce gaseous nitrogen emissions
from fertilizers containing ammonium nitrate and urea
Haitao Wang1, Sarah Köbke1, Klaus Dittert1*
1 Department of Crop Science, Section of Plant Nutrition and Crop Physiology, University of Goettingen,
Carl-Sprengel-Weg 1, 37075 Göttingen, Germany
This manuscript was published in Global Ecology & Conservation:
Wang, H., Köbke, S., Dittert, K., 2020. Use of urease and nitrification inhibitors to reduce
gaseous nitrogen emissions from fertilizers containing ammonium nitrate and urea. Global
Ecology and Conservation 22, e00933. https://doi.org/10.1016/j.gecco.2020.e00933

Original Research Article
Use of urease and nitrification inhibitors to reduce gaseousnitrogen emissions from fertilizers containing ammoniumnitrate and urea
Haitao Wang*, Sarah K€obke, Klaus DittertDepartment of Crop Science, Section of Plant Nutrition and Crop Physiology, University of Goettingen, Carl-Sprengel-Weg 1, 37075,
G€ottingen, Germany
a r t i c l e i n f o
Article history:
Received 24 October 2019Received in revised form 18 January 2020Accepted 18 January 2020
Keywords:
Nitrous oxideAmmonia volatilizationNitrification inhibitor
a b s t r a c t
Nitrogen (N) fertilizers increase agricultural yields, but also lead to the release of thegreenhouse gases nitrous oxide (N2O) and ammonia (NH3). This not only reduces the ef-ficiency of N use, but also results in climate change and loss of biodiversity. The use ofnitrification inhibitors may improve the efficiency of N use and reduce the emission ofgreenhouse gases. We tested three inhibitors (NZONE MAX, Piadin and N-(n-butyl) thio-phosphoric triamide (NBPT)) added to two common N fertilizers (urea and urea ammo-nium nitrate (UAN)) and determined emissions of CO2, N2O and NH3 to evaluate theeffectiveness of these three inhibitors and to improve our understanding of the soil ni-trogen cycle. NBPT effectively reduced NH3 volatilization by 50% (from 3.0 g NH3-N m�2 inurea alone to 1.4 g NH3-N m�2 in urea þ NBPT). Piadin decreased N2O emissions (from0.98 g N2O-N m�2 in urea alone to 0.15 g N2O-N m�2 in urea þ Piadin and from 0.81 g N2O-N m�2 in UAN alone to 0.39 g N2O-N m�2 in UAN þ Piadin) by inhibiting the conversion ofNH4
þ to NO3�. However, although Piadin was found to be an effective nitrification inhibitor,
the risk of higher NH3 emissions (from 3.0 g NH3-N m�2 in urea alone to 4.5 g NH3-N m�2
in urea þ Piadin) with the addition of Piadin cannot be neglected in environmental andeconomical evaluations.© 2020 The Authors. Published by Elsevier B.V. This is an open access article under the CC
BY license (http://creativecommons.org/licenses/by/4.0/).
1. Introduction
Large-scale inputs of nitrogen (N) fertilizers in agriculture have increased crop yields worldwide, allowing global agri-cultural production to keep pace with the rapidly growing population (Burney et al., 2010). The global use of N fertilizers isunlikely to decrease while the world’s population continues to increase (Bakken and Frostegard, 2017; van Beek et al., 2010).The most widely used synthetic N fertilizers are urea and urea-containing N fertilizers. Urea accounts for about 56% of theglobal production of N fertilizers (Bremner, 2007; International Fertilizer Industry Association, 2013; Suter et al., 2016). Urea isa solid fertilizer with a high N content (46%). It can be stored and applied to crops easily and it can be added to the soil incombinationwith other N fertilizers. A common urea-containing fertilizer is urea ammonium nitrate (UAN), which is a liquidN fertilizer consisting of 50% urea and 50% ammonium nitrate and ranging from 28% to 32% N by weight.
* Corresponding author.E-mail address: [email protected] (H. Wang).
Contents lists available at ScienceDirect
Global Ecology and Conservation
journal homepage: http: / /www.elsevier .com/locate/gecco
https://doi.org/10.1016/j.gecco.2020.e009332351-9894/© 2020 The Authors. Published by Elsevier B.V. This is an open access article under the CC BY license (http://creativecommons.org/licenses/by/4.0/).
Global Ecology and Conservation 22 (2020) e00933

The efficiency of Nuse is often low (Sun et al., 2015), and typically<50% of the applied N fertilizer can be used bya corn cropowning to environmental andmanagement constraints (Drury et al., 2017). About 25% of the urea applied to the soil surface isconverted to ammonia (NH3) andvolatilized to theatmosphere (FAOSTAT, 2015); also, the rateofNH3volatilizationmaybeevenhigher at warm temperatures and under moist soil conditions (Camberato, 2017; Tasca et al., 2011). Such large losses of N notonly constitute an economic loss for farmers, but are also an important source of greenhouse gases. NH3 is known to causeacidification and eutrophication of both soils and surface waters, and may also have an indirect impact on Earth’s climateowning to its short lifetime in the atmosphere and its relationships with other climate-relevant gases, such as N2O (Pietzneret al., 2017). It is estimated that about 1%e2% of volatilized NH3 is later on converted into N2O (Wulf et al., 2002). The effectof the emission of N2O on the atmosphere might be one of the most serious environmental consequences of N fertilizer losses(Bakken and Frostegard, 2017), as it contributes to both global warming and the depletion of the ozone layer (Erisman et al.,2007; Ravishankara et al., 2009). About 70% of N2O and 90% of NH3 emissions are caused by agricultural activities (Boyeret al., 2002; Zaman and Blennerhassett, 2010). Therefore, improvement in the efficiency of N use is not only a question forpolicymakers aiming to meet the demands of the United Nations Framework Convention on Climate Change (the Kyoto Pro-tocol) to estimate anthropogenic greenhouse gas emissions (UNFCCC, 1997), but may also increase profits for farmers.
To increase the efficiency of N use, in addition to good agricultural practices (e.g. the correct application techniques, goodtiming and soil testing to determine the amounts of fertilizer required, whichmay be constrained by physical conditions), theuse of N stabilizers and nitrification inhibitors may potentially delay detrimental processes such as the volatilization of NH3,the leaching of nitrate (NO3
�) and the reduction of N2O emissions. A number of chemical products have been developed todelay the transformation of N, and these can be added to urea and UAN. These slow-release products are classified as (1)urease inhibitors or (2) nitrification inhibitors (Franzen, 2017):
(1) Urease inhibitors. When urea is applied to the soil, it rapidly hydrolyzes to ammonium carbonate. Ammonium car-bonate is unstable and breaks down to NH3 and CO2. The NH3 is either absorbed by the soil or volatilizes. The hydrolysisreaction is determined by the urease enzyme, and urease inhibitors block this enzyme to prevent the conversion of ureato NH3 for a period of 1e2 weeks, allowing time for the incorporation of urea into the soil by rainfall or other means.Many reports have shown that N-(n-butyl) thiophosphoric triamide (NBPT) can effectively prevent the loss of NH3
(Drury et al., 2017; Liu et al., 2017; Mira et al., 2017; Silva et al., 2017; Tian et al., 2015).(2) Nitrification inhibitors. The enzymatic activity of NH3 oxidizing bacteria is strongly affected by nitrification inhibitors
(Ruser and Schulz, 2015). With the addition of nitrification inhibitors to urea, the conversion of ammonium ions (NH4þ)
to NO3� is delayed, possibly also limiting N2O emissions from soil denitrification. Dicyandiamide (DCD) (Di et al., 2014;
Guo et al., 2014; Liu et al., 2017; Zaman et al., 2013) and 3,4-dimethylpyrazol-phosphate (DMPP) (Liu et al., 2015; Roseet al., 2018; Shi et al., 2017) are the most researched compounds and are effective in reducing N2O emissions. InGermany, however, Vizura (containing DMPP) and Piadin (1H-1, 2, 4-triazole and 3-methylpyrazole) are more oftenused as nitrification inhibitors, and Piadin has also been shown to be effective in reducing N2O emissions (Pietzneret al., 2017; Wolf et al., 2014; Wu et al., 2017).
To find new, effective chemical ingredients, novel fertilizer additives should also testeddfor example, NZONE MAX (alsocalled a penetrant/nitrogen management aid), which has only been mentioned in a few informal reports. NZONE MAXcontains 27.5% alkylarylpolyoxyethylene glycol, 7.25% calcium aminoethylpiperazine and 6.5% calcium heteropolysaccharides.NZONE MAX is an ammonium stabilizer intended to open the exchange sites on the soil colloid and improve the attachmentof NH4
þ to soil colloids. Therefore the loss of N by volatilization, leaching and denitrification can be reduced.Although there has been a wealth of studies on urease (e.g. NBPT) and nitrification (e.g. DMPP and DCD) inhibitors, new
compounds still require research. The effectiveness of inhibitors in reducing NH3 and N2O emissions in different types of soiland in different climates is variable. As a result of the complex interactions between N2O and NH3 emissions, themitigation ofone gas fluxmay enhance the emission of another; so, apart from losses by leaching and runoff, both N2O and NH3 fluxes needto be considered in environmental evaluations (Ferm et al., 2006;Webb et al., 2010). Therefore, more experimental data aboutthe emissions of NH3 and N2Owhen using new inhibitors are needed. To improve our knowledge of the environmental impactof different inhibitors, we conducted a pot experiment using urea and UAN as N fertilizers, and using NBPT, Piadin and NZONEMAX as N additives, and measured their effects on greenhouse gas emissions. We used analyses of CO2, N2O and NH3
emissions to evaluate the effectiveness of these three chemical additives in improving the efficiency of N use and theirenvironmental impact. Our hypotheses were: (1) the urease inhibitor NBPT can effectively reduce NH3 emissions; (2) thenitrification inhibitor Piadin can effectively reduce N2O emissions; and (3) NZONE MAX will decrease NH3 volatilization andN2O emissions when used as an additive.
2. Materials and methods
2.1. Soil properties and sample preparation
A loamy loess soil was collected from Reinshof agricultural research station, University of Goettingen, Lower Saxony,Germany (51�29050.300N 9�55059.900E, 155m asl). The annual mean temperature and mean annual precipitation were 8.5 �C
H. Wang et al. / Global Ecology and Conservation 22 (2020) e009332

and 650 mm, respectively. The soil was classified as Luvisol (IUSS, 2015) and the texture of the topsoil (0e25 cm) is describedin Table 1 (R€omer et al., 2015). It had previously been used for a three-year field rotation consisting of winter barley (Hordeumvulgare) (2013e2014), winter oilseed rape (Brassica napus) (2014e2015) and winter wheat (Triticum aestivum) (2015e2016).The soil was collected on 4th April 2016 and stored in a container for three months before incubation. Before use, the soil waspassed through a 2-mm sieve. The soil taken from the field had a moisture content of 30% water-filled pore space (WFPS),which was adjusted to a WFPS of 55% (equivalent to a 60% water holding capacity) at the start of the experiment. Whiterectangular polypropylene buckets with dimensions of 0.39 m (length)� 0.29 m (width) x 0.27 m (height) and an air-tight lidwere used as the incubation system. The soil column thereinwas 16.5 cm high and consisted of three layers of soil adjusted toa soil bulk density of 1.30 g cm�3. There was a 10-cm headspace above the soil surface when the air-tight lid was closed. Thesoil was pre-incubated in the buckets at 25 �C for 5 days before the addition of fertilizers. All experiments were conductedunder the same controlled environmental conditions.
2.2. Experimental treatments
The experiment consisted of eight treatments (including CK, U, U þ NZ, U þ P, U þ NBPT, UAN, UAN þ NZ, UAN þ P,described in Table 2) and four replicates. The total amount of N applied to each pot, except the control treatment, was 12 g Nm�2 (corresponding to 120 kg N ha�1). The calculated amount of fertilizer added to each pot was only 2.066 g of urea or2.64 ml of UAN and therefore the required amount of inhibitors was very small. The inhibitors were bought in liquid form anddiluted according to the manufacturer’s recommendations. The fertilizers and diluted inhibitors for each pot were dissolvedin 7.5 ml of water and the required volume of liquid was applied evenly to the soil surface using a pipette.
2.3. Gas flux measurements
2.3.1. Measurement of CO2 and N2O emissions
Trace gas concentrations of gas samples were analyzed after manual gas sampling from each closed chamber. Lids on thetop of the buckets were sealed and samples were taken via silicon stoppers therein. Samples were taken using 60-ml syringesand then 30 mL of gas was transferred into evacuated 12-ml Exetainer vials (Labco, Lampeter, UK). Samples were taken at 0,20 and 40 min after the chambers had been sealed and measurements were taken each day during the first week, then everytwo or three days for a period of one month. Gas samples were analyzed on a BRUKER SCION™ 456 gas chromatograph(BRUKER, Bremen, Germany) equippedwith electron capture detection for analysis of N2O, a flame ionization detector for CH4
and a thermal conductivity detector for CO2 analysis. Flux rates were calculated with linear or non-linear regression of the gasconcentrationwith time (Parkin et al., 2012; Wang et al., 2013). Cumulative emissions were calculated by linear interpolation.
2.3.2. Measurement of NH3 emissions
NH3 emissions were determined by the Dr€ager tube method (Pacholski et al., 2006) using an X-act 5000 automatic tubepump (Dr€ager, Kiel, Germany). Four gas collection cylinders were inserted into the soil surface within each bucket andemitted gases were extracted through the tube pump and flushed through NH3 color indicator-equipped NH3 absorber tubes(Dr€ager Safety, Lübeck, Germany). The measured concentrations were converted from ppm into absolute values (kg N ha�1)and the NH3 fluxes were calculated as reported by Pacholski et al. (2006). Measurements were taken each day during the firstweek, then every two or three days for a period of one month.
2.4. Additional parameters
On the first day of the experiment, the soil moisture was adjusted to a WFPS of 55% and fertilizer was added. This cor-responds to typical spring timemoisture conditions when soils toleratemanagement measures such as fertilizer spreading by
Table 1
Soil properties (0e25 cm depth) of the soil used in the pot experiments, cited from Roemer et al. (2015).
Clay (%) Silt (%) Sand (%) Organic matter (%) Bulk density (g cm�3) pH (CaCl2)
16 61 23 2.0 1.30 7e7.2
Table 2
Total mineral N (g N m�2) additions and added inhibitors in different treatments.
CK U U þ NZ U þ P U þ NBPT UAN UAN þ NZ UAN þ P
NO3�-N 0 0 0 0 3 3 3 3
NH4�-N 0 12 12 12 9 9 9 9
Added Inhibitors 0 0 NZONE MAX Piadin NBPT 0 NZONE MAX Piadin
CK: control without fertilization, U: urea, NZ: NZONE MAX, P: Piadin, NBPT: N-(n-butyl) thiophosphoric triamide, UAN: urea ammonium nitrate.
H. Wang et al. / Global Ecology and Conservation 22 (2020) e00933 3
agricultural machinery. Themoisture decreased to aWFPS of 51% on day 5. Then, simulating a rainfall event, it was adjusted toa WFPS of 80% to stimulate high N2O emission rates under oxygen depleted soil conditions. By the end of the experimentWFPS had decreased to 60%.
Soil samples were taken before application of fertilizers and at the end of the experiment (30 days later) to determine thesoil moisture content and the concentration of mineral N (NO3
�, NH4þ). 50 g soil samples were dispersed in 250 ml of
0.0125 mol L�1 CaCl2 solution, shaken for 1 h and filtered for later analysis with a Sanþþ continuous flow analyzer (SkalarAnalytical, Breda, The Netherlands).
2.5. Calculations and statistical analysis
Emission rates are expressed as arithmetic means ± the standard error of the mean of four replicates. Least significancedifference tests were used to check significant pairwise differences among the treatments. Statistical analyses were per-formed using Statistica 11 (Dell, Round Rock, TX, USA), with p < 0.05 as the criterion for a statistical significance.
3. Results
3.1. CO2 emissions
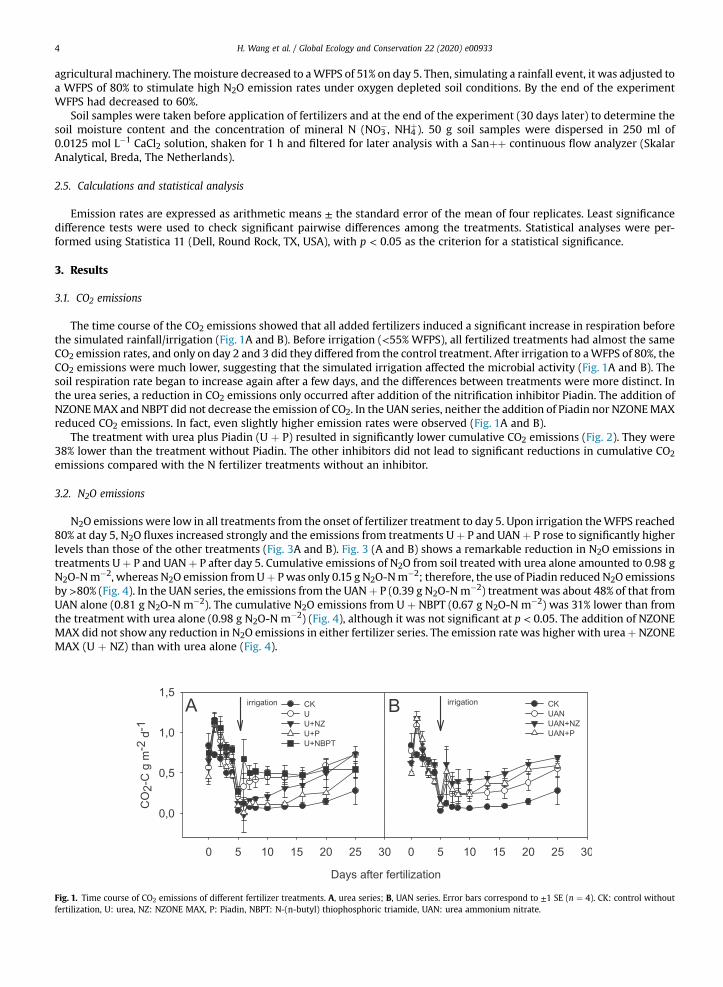
The time course of the CO2 emissions showed that all added fertilizers induced a significant increase in respiration beforethe simulated rainfall/irrigation (Fig. 1A and B). Before irrigation (<55% WFPS), all fertilized treatments had almost the sameCO2 emission rates, and only on day 2 and 3 did they differed from the control treatment. After irrigation to aWFPS of 80%, theCO2 emissions were much lower, suggesting that the simulated irrigation affected the microbial activity (Fig. 1A and B). Thesoil respiration rate began to increase again after a few days, and the differences between treatments were more distinct. Inthe urea series, a reduction in CO2 emissions only occurred after addition of the nitrification inhibitor Piadin. The addition ofNZONEMAX and NBPT did not decrease the emission of CO2. In the UAN series, neither the addition of Piadin nor NZONEMAXreduced CO2 emissions. In fact, even slightly higher emission rates were observed (Fig. 1A and B).
The treatment with urea plus Piadin (U þ P) resulted in significantly lower cumulative CO2 emissions (Fig. 2). They were38% lower than the treatment without Piadin. The other inhibitors did not lead to significant reductions in cumulative CO2
emissions compared with the N fertilizer treatments without an inhibitor.
3.2. N2O emissions
N2O emissions were low in all treatments from the onset of fertilizer treatment to day 5. Upon irrigation theWFPS reached80% at day 5, N2O fluxes increased strongly and the emissions from treatments Uþ P and UANþ P rose to significantly higherlevels than those of the other treatments (Fig. 3A and B). Fig. 3 (A and B) shows a remarkable reduction in N2O emissions intreatments Uþ P and UANþ P after day 5. Cumulative emissions of N2O from soil treated with urea alone amounted to 0.98 gN2O-Nm�2, whereas N2O emission fromUþ Pwas only 0.15 g N2O-Nm�2; therefore, the use of Piadin reduced N2O emissionsby >80% (Fig. 4). In the UAN series, the emissions from the UANþ P (0.39 g N2O-Nm�2) treatment was about 48% of that fromUAN alone (0.81 g N2O-N m�2). The cumulative N2O emissions from U þ NBPT (0.67 g N2O-N m�2) was 31% lower than fromthe treatment with urea alone (0.98 g N2O-N m�2) (Fig. 4), although it was not significant at p < 0.05. The addition of NZONEMAX did not show any reduction in N2O emissions in either fertilizer series. The emission rate was higher with ureaþNZONEMAX (U þ NZ) than with urea alone (Fig. 4).
Fig. 1. Time course of CO2 emissions of different fertilizer treatments. A, urea series; B, UAN series. Error bars correspond to ±1 SE (n ¼ 4). CK: control withoutfertilization, U: urea, NZ: NZONE MAX, P: Piadin, NBPT: N-(n-butyl) thiophosphoric triamide, UAN: urea ammonium nitrate.
H. Wang et al. / Global Ecology and Conservation 22 (2020) e009334
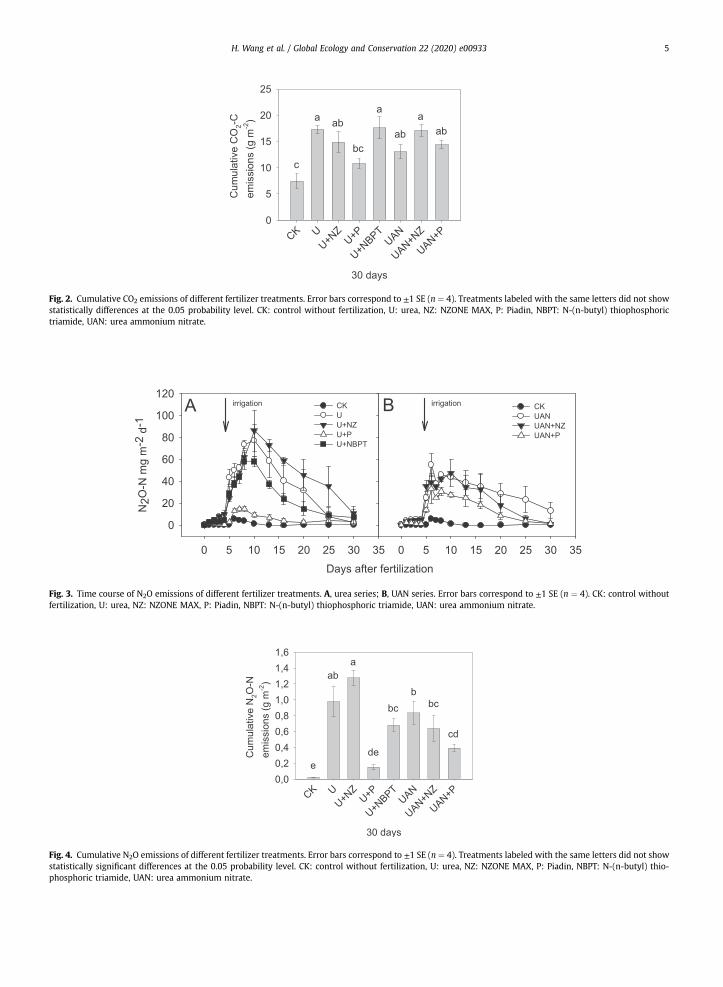
Fig. 2. Cumulative CO2 emissions of different fertilizer treatments. Error bars correspond to ±1 SE (n ¼ 4). Treatments labeled with the same letters did not showstatistically differences at the 0.05 probability level. CK: control without fertilization, U: urea, NZ: NZONE MAX, P: Piadin, NBPT: N-(n-butyl) thiophosphorictriamide, UAN: urea ammonium nitrate.
Fig. 3. Time course of N2O emissions of different fertilizer treatments. A, urea series; B, UAN series. Error bars correspond to ±1 SE (n ¼ 4). CK: control withoutfertilization, U: urea, NZ: NZONE MAX, P: Piadin, NBPT: N-(n-butyl) thiophosphoric triamide, UAN: urea ammonium nitrate.
Fig. 4. Cumulative N2O emissions of different fertilizer treatments. Error bars correspond to ±1 SE (n ¼ 4). Treatments labeled with the same letters did not showstatistically significant differences at the 0.05 probability level. CK: control without fertilization, U: urea, NZ: NZONE MAX, P: Piadin, NBPT: N-(n-butyl) thio-phosphoric triamide, UAN: urea ammonium nitrate.
H. Wang et al. / Global Ecology and Conservation 22 (2020) e00933 5

3.3. NH3 emissions
Fig. 5 shows that all treatments resulted in a sharp increase in NH3 emissions after addition of fertilizers. In the urea series,the emissions after the urea alone, Uþ NZ and Uþ P treatments showed similar time courses and reached a peak on the thirdday (Fig. 5A and B). By contrast, the emissions in treatment U þ NBPT were much lower, with the peak value on day four. Theincrease persisted for three days longer than in the other treatments. The peak emission after the U þ NBPT treatment wasonly 0.27 g NH3-N m�2 d�1 on day 4, compared with 0.84, 0.84 and 0.96 g NH3-N m�2 d�1 at day 3 for the urea alone, U þ NZand U þ P treatments (Fig. 5A and B). The time courses of the emissions were similar for the three treatments in the UANseries, with peak values at day 3. The peak emissions in the UAN, UAN þ NZ and UAN þ P treatments were 0.58, 0.61 and0.69 g NH3-Nm�2 d�1, respectively. In contrast to CO2 and N2O fluxes therewas no response to the simulated irrigation on day5 in any treatment.
Cumulative emissions of NH3 from the soil surfaces of the experimental pots in the urea treatment amounted to 3.4 g NH3-N m�2 in 30 days (Fig. 6), minus the emission of 0.4 g NH3-N m�2 from the control treatment, which was considered as thebackground emission from the original soil N pool. The emission related to the application of urea alone was therefore about3 g NH3-N m�2. In relation to 12 g NH3-N m�2 fertilization, the rate of ammonium volatilization was thus 25% of the appliedurea-N. With addition of the urease inhibitor (U þ NBPT), the emission was reduced to 1.7 g NH3-N m�2 (the cumulativeemissionminus the background emission). Therefore, after the treatment with UþNBPT, the cumulative NH3 emissions werereduced by ca. 50% relative to urea alone.
NH3 emissions from the Piadin þ fertilizer treatment were higher than for urea and UAN alone (Fig. 6). In the urea series,the cumulative emission from the Uþ P treatment was 4.95 g NH3-N m�2, i.e. 44% more than after treatment with urea alone(3.42 g NH3-Nm�2). In the UAN series, the cumulative emission of NH3 after treatment with UANþ P (2.83 g NH3-Nm�2) was12% higher than after treatment with UAN alone (2.53 g NH3-N m�2).
Fig. 5. Time course of NH3 emissions of different fertilizer treatments. A, urea series; B, UAN series. Error bars correspond to ±1 SE (n ¼ 4). CK: control withoutfertilization, U: urea, NZ: NZONE MAX, P: Piadin, NBPT: N-(n-butyl) thiophosphoric triamide, UAN: urea ammonium nitrate.
Fig. 6. Cumulative NH3 emissions of different fertilizer treatments. Error bars correspond to ±1 SE (n ¼ 4). Treatments labeled with the same letters did not showstatistically significant differences at the 0.05 probability level. CK: control without fertilization, U: urea, NZ: NZONE MAX, P: Piadin, NBPT: N-(n-butyl) thio-phosphoric triamide, UAN: urea ammonium nitrate.
H. Wang et al. / Global Ecology and Conservation 22 (2020) e009336

3.4. NO3�-N and NH4
þ-N remaining in the soil after 30 days
The mineral N in the soil samples was determined before the addition of the fertilizers and the concentrations of NO3�-N
and NH4þ-N were 6.80 and 0.23 g N m�2, respectively (Fig. 7A and B). Thirty days after the addition of 12 g N m�2 to all
treatments, the remaining soil NO3�-N ranged from 7.7 g Nm�2 (Uþ P) to 14.6 g Nm�2 (UþNZ) and 2.8 g Nm�2 in the control
treatment (Fig. 7A). The soils treated with U þ P showed a lower but not significant NO3�-N content than those treated with
urea alone. The NH4þ-N remaining after treatment with U þ P (1.6 g NH3-N m�2) was significantly higher than that remaining
after the other treatments (<0.5 g NH3-N m�2) (Fig. 7B).
4. Discussion
4.1. CO2 emissions
The additional emission of CO2 from the soils treated with urea fertilizer was a result of two processes: the hydrolysis ofurea and induced heterotrophic microbial activity. During hydrolysis of urea, urea is cleaved into NH3 (2 � NH3) and carbondioxide (CO2) and this goes along with a net increase in the soil pH. In this experiment, the treatment with UAN alone (13.1 gCO2-C m�2, Fig. 1) resulted in CO2 emissions that were 25% lower than the treatment with urea alone (17.3 g CO2-C m�2)(p < 0.05). As N in UAN consists of only 50% urea-N that can be hydrolyzed, this figure indicates that, in both treatments, thehydrolysis of urea made a considerable contribution to the volume of CO2 emitted.
The other source of CO2 is respiration resulting from the activity of heterotrophic microorganisms, such as the NH3-oxidizing bacteria population (Kowles, 2018). All treatments showed a surge in the emission of CO2 after 24e72 h. The soilmoisture content was low (55%WFPS) during this time period and the temperature remained constant at 25 �C. Irrigation to aWFPS of 80% on day 5 caused a dramatic decrease in the emission of CO2, after which the emission of CO2 increased slowly,with a simultaneous decrease in theWFPS. Therefore it seems that at 55%WFPS conditions weremore favorable for microbialrespiration than 80% WFPS conditions. The observed decrease in CO2 emissions after treatment with urea and a nitrificationinhibitor has been reported previously (Florio et al., 2016; Maienza et al., 2014; Weiske et al., 2001). The decreased CO2
emissions after irrigation were mainly from i) disturbed microbial activity and ii) the slower diffusion rate of CO2 out of thesoil with a higher water content.
4.2. N2O emissions
N2O emissions were relatively low in all treatments during the first four days of the experiment, before irrigation at day 5.However, the emissions increased rapidly to a high level after irrigation, suggesting that the increase in the soil moisturecontent (WFPS) from 50% to 55% between days 0 and 5e80% at day 6 was the key driver of N2O emissions (Cardenas et al.,
Fig. 7. Nitrate and ammonium present in the soil samples before the application of fertilizer and after 30 days of application for the different treatments. Errorbars correspond to ±1 SE (n ¼ 4). Treatments labeled with the same letters did not show statistically significant differences at the 0.05 probability level. CK:control without fertilization, U: urea, NZ: NZONE MAX, P: Piadin, NBPT: N-(n-butyl) thiophosphoric triamide, UAN: urea ammonium nitrate.
H. Wang et al. / Global Ecology and Conservation 22 (2020) e00933 7

2017; Yu et al., 2018; Zaman et al., 2013). It is widely accepted that soil moisture has an important impact on N2O emissionsand that a WFPS of 60% is the threshold between aerobic and anaerobic soil conditions (Men�endez et al., 2012). Soil moisturebelow aWFPS of 60% is unfavorable for the emission of N2O. LowN2O emission rates have been observed previously in similarstudies reported by Men�endez et al. (2012) and Volpi et al. (2017).
Only a few earlier studies (Pietzner et al., 2017; Wolf et al., 2014; Wu et al., 2017) have evaluated 1H-1,2,4-triazole and 3-methylpyrazole (Piadin) as a nitrification inhibitor. However, the results of these studies were similar to our findings, con-firming that Piadin can significantly reduce N2O emissions. Research has also been carried out on other nitrification inhibitors(e.g. DMPP, DCD and Nitrapyrin), demonstrating their effectiveness in reducing N2O emissions. As nitrification inhibitors aimto suppress, reduce or delay the oxidation of NH4
þ to NO3� in soils, our observations of reduced N2O fluxes in the treatments
with nitrification inhibitors were probably related to variations in the availability of the substrate (NO3�) for denitrification.
Theymay also have been influenced by different contributions from the twomajor N2O-forming processes of nitrification anddenitrification (Zaman and Nguyen, 2012). In a number of studies (Guo et al., 2014; Yu et al., 2018; Zaman et al., 2013; Zamanand Nguyen, 2012) the time courses of soil NH4
þ and NO3� concentrations after application of fertilizers have shown that
treatment with nitrification inhibitors (DMPP or DCD) result in higher NH4þ and lower NO3
� concentrations.Cumulative emissions of N2O were high in all treatments in this study, except for the U þ P and UAN þ P treatments. This
suggests that the chosen incubation environment did favor denitrification, probably as a result of the high soil moisturecontent (80% WFPS), high incubation temperature (25 �C) and high soil NO3
� content. The N2O emissions in studies undersimilar conditions were predominantly from denitrification (Grave et al., 2018; Men�endez et al., 2012; Senbayram et al., 2012;Luo et al., 2008), most likely as a result of limited nitrification due to the low availability of oxygen (Tian et al., 2015). Thelowest N2O emissions in our study were observed in the treatments with the lowest NO3
� concentrations in the soil (withPiadin treatment), which is seen as further evidence of this assumption.
4.3. NH3 emissions
The release of large amounts of NH3 after the application of urea is a serious agricultural problem (Engel et al., 2017; Liet al., 2015; Pacholski et al., 2018; Schraml et al., 2016; Sun et al., 2015; Tian et al., 2015). In this study, the U þ NBPTtreatment reduced NH3 fluxes by about 50%, which is in agreement with previously published work (Connell et al., 2011;Drury et al., 2017;Mira et al., 2017; Suter et al., 2013). Themeta-analysis of Silva et al. (2017) showed that ureaþNBPT reduced52% losses of NH3. The trend of reductionwas observed in soils over all classes of soil pH, organic carbon content and rate of Naddition. Moreover, the addition of NBPT to urea has also been suggested to be effective in increasing crop yields (Drury et al.,2017; Silva et al., 2017).
As UAN is composed of urea and ammonium nitrate in a ratio of 1:1, the volatilization losses of NH3 from the group of UANtreatments should theoretically be lower than those from the soils treated with the different urea fertilizers. This wasconfirmed by our results. Although we did not include a UAN þ NBPT solution in this study, a number of other studies (Goos,2012; Grant, 2013; Rajkovich et al., 2017) have shown that the addition of NBPT to UAN can significantly reduce NH3 lossesrelative to the application of UAN alone.
By contrast, nitrification inhibitors tend to induce increased NH3 emissions because NH4þ is available for extended periods
of time. The addition of Piadin to both groups of N fertilizers increased the cumulative NH3 emissions by 44% and 12%,respectively, relative to urea or UAN alone. This increase in NH3 emissions agrees with earlier reports showing that nitrifi-cation inhibitor treatments increased NH3 emissions from 3% to 65% (Fan et al., 2018; Ferm et al., 2006; Lam et al., 2018, 2017;Pan et al., 2016; Qiao et al., 2015; Webb et al., 2010). However, Piadin performed well in reducing N2O emissions owing tolower NO3
�-N concentrations in the soil. Therefore, the benefit of nitrification inhibitors in reducing N2O emissions has to bejudged against the higher risk of NH3 volatilization, or additional strategies need to be implemented to reduce NH3
volatilization.
4.4. Soil NO3�-N and NH4
þ-N
The remaining mineral N was determined at the end of experiment. It was expected that large amounts of total mineral N(NO3
�-N þ NH4þ-N) would remain in the soil due to the absence of plants utilizing N and the shallow depth of the experiment
in the soil layer (16 cm). In addition, N leaching was impeded as a result of the use of water-tight incubation vessels.Consequently, all the treatments (urea alone, U þ NZ, U þ NBPT, UAN and UAN þ NZ) showed residual mineral N of >10 g Nm�2. As the total amount of mineral N at the start of the experiment was 19 g N m�2 (12 g N m�2 fertilizer N and 7 g N m�2
initial soil mineral N), more than half of the original amount of N remained in the treated soils. The range of N losses in ourexperiment was similar to previously reported experiments carried out under similar conditions (Wu et al., 2017; Zaman andNguyen, 2012). Some of the applied N not recovered as inorganic N was probably taken up by soil microbes and would havebeen part of the soil organic N pool.
Nitrification inhibitors such as Piadin inhibit the oxidation of NH4þ to NO3
�. In our study, the residual soil NH4þ-N in U þ P
treatment was 1.6 g N m�2, whereas in all other treatments it was <0.5 g N m�2. The soil NO3� concentration was still low at
the end of the incubation period of 30 days, accounting for only 7.7 g NO3�-N m�2, which was the lowest of all treatments. In
the pot experiments of Goos and Johnson (1999) and Sassman (2014), conducted at 25 �C for tests of application rates of 15 gNH4
�-N m�2, the half-life of soil NH4þ after the application of urea alone and UAN alonewas 2e3 weeks. This is consistent with
H. Wang et al. / Global Ecology and Conservation 22 (2020) e009338
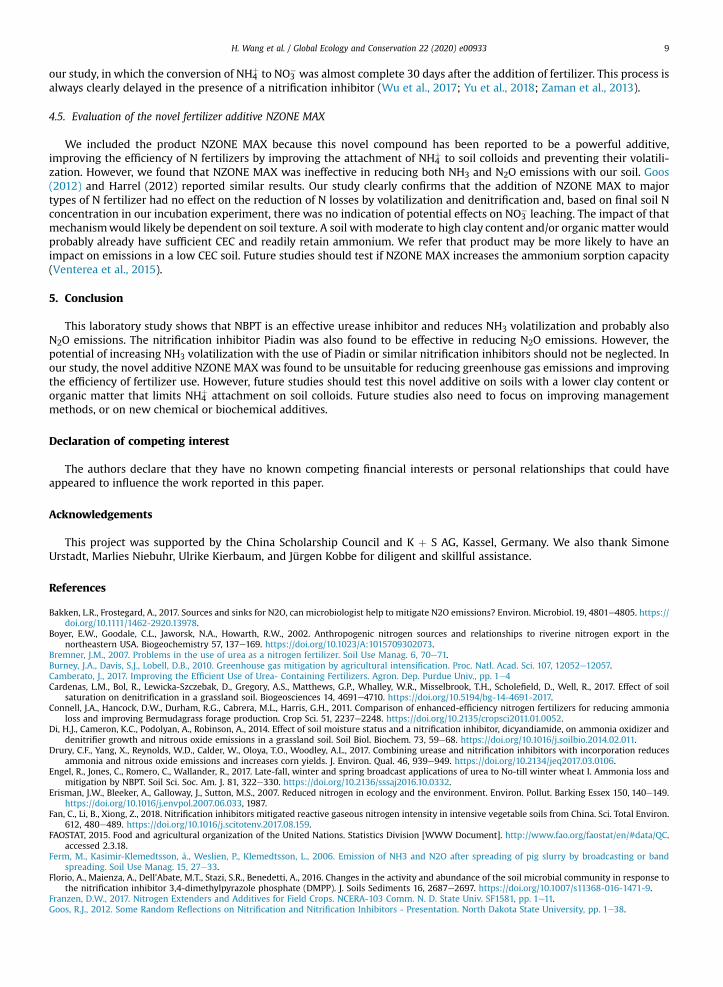
our study, in which the conversion of NH4þ to NO3
� was almost complete 30 days after the addition of fertilizer. This process isalways clearly delayed in the presence of a nitrification inhibitor (Wu et al., 2017; Yu et al., 2018; Zaman et al., 2013).
4.5. Evaluation of the novel fertilizer additive NZONE MAX
We included the product NZONE MAX because this novel compound has been reported to be a powerful additive,improving the efficiency of N fertilizers by improving the attachment of NH4
þ to soil colloids and preventing their volatili-zation. However, we found that NZONE MAX was ineffective in reducing both NH3 and N2O emissions with our soil. Goos(2012) and Harrel (2012) reported similar results. Our study clearly confirms that the addition of NZONE MAX to majortypes of N fertilizer had no effect on the reduction of N losses by volatilization and denitrification and, based on final soil Nconcentration in our incubation experiment, there was no indication of potential effects on NO3
� leaching. The impact of thatmechanismwould likely be dependent on soil texture. A soil with moderate to high clay content and/or organic matter wouldprobably already have sufficient CEC and readily retain ammonium. We refer that product may be more likely to have animpact on emissions in a low CEC soil. Future studies should test if NZONE MAX increases the ammonium sorption capacity(Venterea et al., 2015).
5. Conclusion
This laboratory study shows that NBPT is an effective urease inhibitor and reduces NH3 volatilization and probably alsoN2O emissions. The nitrification inhibitor Piadin was also found to be effective in reducing N2O emissions. However, thepotential of increasing NH3 volatilization with the use of Piadin or similar nitrification inhibitors should not be neglected. Inour study, the novel additive NZONE MAX was found to be unsuitable for reducing greenhouse gas emissions and improvingthe efficiency of fertilizer use. However, future studies should test this novel additive on soils with a lower clay content ororganic matter that limits NH4
þ attachment on soil colloids. Future studies also need to focus on improving managementmethods, or on new chemical or biochemical additives.
Declaration of competing interest
The authors declare that they have no known competing financial interests or personal relationships that could haveappeared to influence the work reported in this paper.
Acknowledgements
This project was supported by the China Scholarship Council and K þ S AG, Kassel, Germany. We also thank SimoneUrstadt, Marlies Niebuhr, Ulrike Kierbaum, and Jürgen Kobbe for diligent and skillful assistance.
References
Bakken, L.R., Frostegard, A., 2017. Sources and sinks for N2O, can microbiologist help to mitigate N2O emissions? Environ. Microbiol. 19, 4801e4805. https://doi.org/10.1111/1462-2920.13978.
Boyer, E.W., Goodale, C.L., Jaworsk, N.A., Howarth, R.W., 2002. Anthropogenic nitrogen sources and relationships to riverine nitrogen export in thenortheastern USA. Biogeochemistry 57, 137e169. https://doi.org/10.1023/A:1015709302073.
Bremner, J.M., 2007. Problems in the use of urea as a nitrogen fertilizer. Soil Use Manag. 6, 70e71.Burney, J.A., Davis, S.J., Lobell, D.B., 2010. Greenhouse gas mitigation by agricultural intensification. Proc. Natl. Acad. Sci. 107, 12052e12057.Camberato, J., 2017. Improving the Efficient Use of Urea- Containing Fertilizers. Agron. Dep. Purdue Univ., pp. 1e4Cardenas, L.M., Bol, R., Lewicka-Szczebak, D., Gregory, A.S., Matthews, G.P., Whalley, W.R., Misselbrook, T.H., Scholefield, D., Well, R., 2017. Effect of soil
saturation on denitrification in a grassland soil. Biogeosciences 14, 4691e4710. https://doi.org/10.5194/bg-14-4691-2017.Connell, J.A., Hancock, D.W., Durham, R.G., Cabrera, M.L., Harris, G.H., 2011. Comparison of enhanced-efficiency nitrogen fertilizers for reducing ammonia
loss and improving Bermudagrass forage production. Crop Sci. 51, 2237e2248. https://doi.org/10.2135/cropsci2011.01.0052.Di, H.J., Cameron, K.C., Podolyan, A., Robinson, A., 2014. Effect of soil moisture status and a nitrification inhibitor, dicyandiamide, on ammonia oxidizer and
denitrifier growth and nitrous oxide emissions in a grassland soil. Soil Biol. Biochem. 73, 59e68. https://doi.org/10.1016/j.soilbio.2014.02.011.Drury, C.F., Yang, X., Reynolds, W.D., Calder, W., Oloya, T.O., Woodley, A.L., 2017. Combining urease and nitrification inhibitors with incorporation reduces
ammonia and nitrous oxide emissions and increases corn yields. J. Environ. Qual. 46, 939e949. https://doi.org/10.2134/jeq2017.03.0106.Engel, R., Jones, C., Romero, C., Wallander, R., 2017. Late-fall, winter and spring broadcast applications of urea to No-till winter wheat I. Ammonia loss and
mitigation by NBPT. Soil Sci. Soc. Am. J. 81, 322e330. https://doi.org/10.2136/sssaj2016.10.0332.Erisman, J.W., Bleeker, A., Galloway, J., Sutton, M.S., 2007. Reduced nitrogen in ecology and the environment. Environ. Pollut. Barking Essex 150, 140e149.
https://doi.org/10.1016/j.envpol.2007.06.033, 1987.Fan, C., Li, B., Xiong, Z., 2018. Nitrification inhibitors mitigated reactive gaseous nitrogen intensity in intensive vegetable soils from China. Sci. Total Environ.
612, 480e489. https://doi.org/10.1016/j.scitotenv.2017.08.159.FAOSTAT, 2015. Food and agricultural organization of the United Nations. Statistics Division [WWW Document]. http://www.fao.org/faostat/en/#data/QC.
accessed 2.3.18.Ferm, M., Kasimir-Klemedtsson, å., Weslien, P., Klemedtsson, L., 2006. Emission of NH3 and N2O after spreading of pig slurry by broadcasting or band
spreading. Soil Use Manag. 15, 27e33.Florio, A., Maienza, A., Dell’Abate, M.T., Stazi, S.R., Benedetti, A., 2016. Changes in the activity and abundance of the soil microbial community in response to
the nitrification inhibitor 3,4-dimethylpyrazole phosphate (DMPP). J. Soils Sediments 16, 2687e2697. https://doi.org/10.1007/s11368-016-1471-9.Franzen, D.W., 2017. Nitrogen Extenders and Additives for Field Crops. NCERA-103 Comm. N. D. State Univ. SF1581, pp. 1e11.Goos, R.J., 2012. Some Random Reflections on Nitrification and Nitrification Inhibitors - Presentation. North Dakota State University, pp. 1e38.
H. Wang et al. / Global Ecology and Conservation 22 (2020) e00933 9
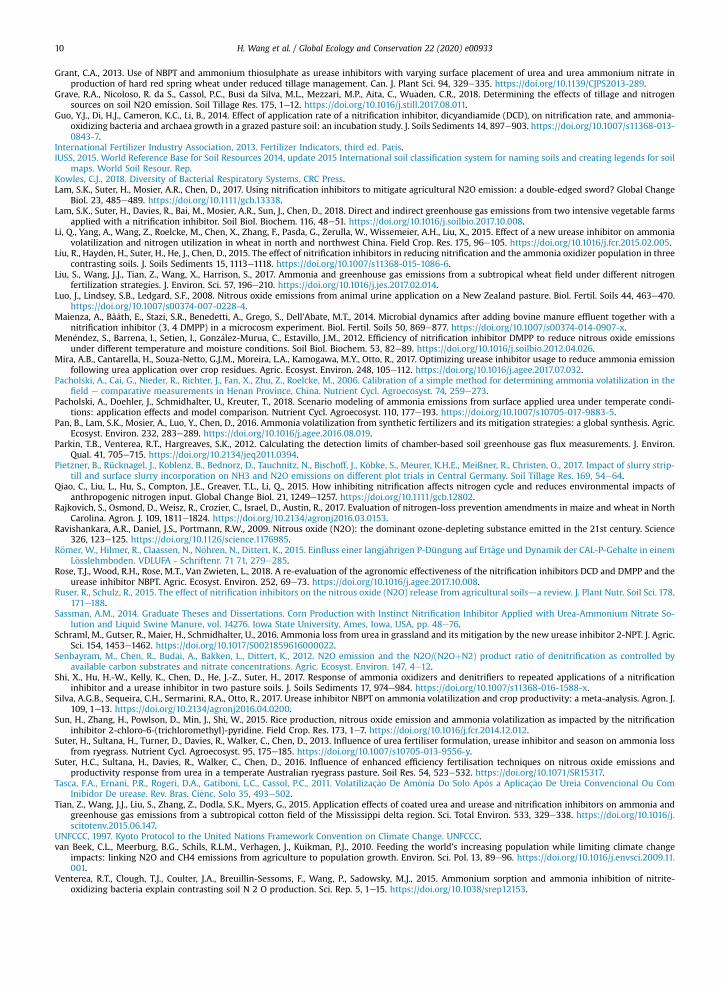
Grant, C.A., 2013. Use of NBPT and ammonium thiosulphate as urease inhibitors with varying surface placement of urea and urea ammonium nitrate inproduction of hard red spring wheat under reduced tillage management. Can. J. Plant Sci. 94, 329e335. https://doi.org/10.1139/CJPS2013-289.
Grave, R.A., Nicoloso, R. da S., Cassol, P.C., Busi da Silva, M.L., Mezzari, M.P., Aita, C., Wuaden, C.R., 2018. Determining the effects of tillage and nitrogensources on soil N2O emission. Soil Tillage Res. 175, 1e12. https://doi.org/10.1016/j.still.2017.08.011.
Guo, Y.J., Di, H.J., Cameron, K.C., Li, B., 2014. Effect of application rate of a nitrification inhibitor, dicyandiamide (DCD), on nitrification rate, and ammonia-oxidizing bacteria and archaea growth in a grazed pasture soil: an incubation study. J. Soils Sediments 14, 897e903. https://doi.org/10.1007/s11368-013-0843-7.
International Fertilizer Industry Association, 2013. Fertilizer Indicators, third ed. Paris.IUSS, 2015. World Reference Base for Soil Resources 2014, update 2015 International soil classification system for naming soils and creating legends for soil
maps. World Soil Resour. Rep.Kowles, C.J., 2018. Diversity of Bacterial Respiratory Systems. CRC Press.Lam, S.K., Suter, H., Mosier, A.R., Chen, D., 2017. Using nitrification inhibitors to mitigate agricultural N2O emission: a double-edged sword? Global Change
Biol. 23, 485e489. https://doi.org/10.1111/gcb.13338.Lam, S.K., Suter, H., Davies, R., Bai, M., Mosier, A.R., Sun, J., Chen, D., 2018. Direct and indirect greenhouse gas emissions from two intensive vegetable farms
applied with a nitrification inhibitor. Soil Biol. Biochem. 116, 48e51. https://doi.org/10.1016/j.soilbio.2017.10.008.Li, Q., Yang, A., Wang, Z., Roelcke, M., Chen, X., Zhang, F., Pasda, G., Zerulla, W., Wissemeier, A.H., Liu, X., 2015. Effect of a new urease inhibitor on ammonia
volatilization and nitrogen utilization in wheat in north and northwest China. Field Crop. Res. 175, 96e105. https://doi.org/10.1016/j.fcr.2015.02.005.Liu, R., Hayden, H., Suter, H., He, J., Chen, D., 2015. The effect of nitrification inhibitors in reducing nitrification and the ammonia oxidizer population in three
contrasting soils. J. Soils Sediments 15, 1113e1118. https://doi.org/10.1007/s11368-015-1086-6.Liu, S., Wang, J.J., Tian, Z., Wang, X., Harrison, S., 2017. Ammonia and greenhouse gas emissions from a subtropical wheat field under different nitrogen
fertilization strategies. J. Environ. Sci. 57, 196e210. https://doi.org/10.1016/j.jes.2017.02.014.Luo, J., Lindsey, S.B., Ledgard, S.F., 2008. Nitrous oxide emissions from animal urine application on a New Zealand pasture. Biol. Fertil. Soils 44, 463e470.
https://doi.org/10.1007/s00374-007-0228-4.Maienza, A., Bååth, E., Stazi, S.R., Benedetti, A., Grego, S., Dell’Abate, M.T., 2014. Microbial dynamics after adding bovine manure effluent together with a
nitrification inhibitor (3, 4 DMPP) in a microcosm experiment. Biol. Fertil. Soils 50, 869e877. https://doi.org/10.1007/s00374-014-0907-x.Men�endez, S., Barrena, I., Setien, I., Gonz�alez-Murua, C., Estavillo, J.M., 2012. Efficiency of nitrification inhibitor DMPP to reduce nitrous oxide emissions
under different temperature and moisture conditions. Soil Biol. Biochem. 53, 82e89. https://doi.org/10.1016/j.soilbio.2012.04.026.Mira, A.B., Cantarella, H., Souza-Netto, G.J.M., Moreira, L.A., Kamogawa, M.Y., Otto, R., 2017. Optimizing urease inhibitor usage to reduce ammonia emission
following urea application over crop residues. Agric. Ecosyst. Environ. 248, 105e112. https://doi.org/10.1016/j.agee.2017.07.032.Pacholski, A., Cai, G., Nieder, R., Richter, J., Fan, X., Zhu, Z., Roelcke, M., 2006. Calibration of a simple method for determining ammonia volatilization in the
field e comparative measurements in Henan Province, China. Nutrient Cycl. Agroecosyst. 74, 259e273.Pacholski, A., Doehler, J., Schmidhalter, U., Kreuter, T., 2018. Scenario modeling of ammonia emissions from surface applied urea under temperate condi-
tions: application effects and model comparison. Nutrient Cycl. Agroecosyst. 110, 177e193. https://doi.org/10.1007/s10705-017-9883-5.Pan, B., Lam, S.K., Mosier, A., Luo, Y., Chen, D., 2016. Ammonia volatilization from synthetic fertilizers and its mitigation strategies: a global synthesis. Agric.
Ecosyst. Environ. 232, 283e289. https://doi.org/10.1016/j.agee.2016.08.019.Parkin, T.B., Venterea, R.T., Hargreaves, S.K., 2012. Calculating the detection limits of chamber-based soil greenhouse gas flux measurements. J. Environ.
Qual. 41, 705e715. https://doi.org/10.2134/jeq2011.0394.Pietzner, B., Rücknagel, J., Koblenz, B., Bednorz, D., Tauchnitz, N., Bischoff, J., K€obke, S., Meurer, K.H.E., Meißner, R., Christen, O., 2017. Impact of slurry strip-
till and surface slurry incorporation on NH3 and N2O emissions on different plot trials in Central Germany. Soil Tillage Res. 169, 54e64.Qiao, C., Liu, L., Hu, S., Compton, J.E., Greaver, T.L., Li, Q., 2015. How inhibiting nitrification affects nitrogen cycle and reduces environmental impacts of
anthropogenic nitrogen input. Global Change Biol. 21, 1249e1257. https://doi.org/10.1111/gcb.12802.Rajkovich, S., Osmond, D., Weisz, R., Crozier, C., Israel, D., Austin, R., 2017. Evaluation of nitrogen-loss prevention amendments in maize and wheat in North
Carolina. Agron. J. 109, 1811e1824. https://doi.org/10.2134/agronj2016.03.0153.Ravishankara, A.R., Daniel, J.S., Portmann, R.W., 2009. Nitrous oxide (N2O): the dominant ozone-depleting substance emitted in the 21st century. Science
326, 123e125. https://doi.org/10.1126/science.1176985.R€omer, W., Hilmer, R., Claassen, N., N€ohren, N., Dittert, K., 2015. Einfluss einer langj€ahrigen P-Düngung auf Ert€age und Dynamik der CAL-P-Gehalte in einem
L€osslehmboden. VDLUFA - Schriftenr. 71 71, 279e285.Rose, T.J., Wood, R.H., Rose, M.T., Van Zwieten, L., 2018. A re-evaluation of the agronomic effectiveness of the nitrification inhibitors DCD and DMPP and the
urease inhibitor NBPT. Agric. Ecosyst. Environ. 252, 69e73. https://doi.org/10.1016/j.agee.2017.10.008.Ruser, R., Schulz, R., 2015. The effect of nitrification inhibitors on the nitrous oxide (N2O) release from agricultural soilsda review. J. Plant Nutr. Soil Sci. 178,
171e188.Sassman, A.M., 2014. Graduate Theses and Dissertations. Corn Production with Instinct Nitrification Inhibitor Applied with Urea-Ammonium Nitrate So-
lution and Liquid Swine Manure, vol. 14276. Iowa State University, Ames, Iowa, USA, pp. 48e76.Schraml, M., Gutser, R., Maier, H., Schmidhalter, U., 2016. Ammonia loss from urea in grassland and its mitigation by the new urease inhibitor 2-NPT. J. Agric.
Sci. 154, 1453e1462. https://doi.org/10.1017/S0021859616000022.Senbayram, M., Chen, R., Budai, A., Bakken, L., Dittert, K., 2012. N2O emission and the N2O/(N2OþN2) product ratio of denitrification as controlled by
available carbon substrates and nitrate concentrations. Agric. Ecosyst. Environ. 147, 4e12.Shi, X., Hu, H.-W., Kelly, K., Chen, D., He, J.-Z., Suter, H., 2017. Response of ammonia oxidizers and denitrifiers to repeated applications of a nitrification
inhibitor and a urease inhibitor in two pasture soils. J. Soils Sediments 17, 974e984. https://doi.org/10.1007/s11368-016-1588-x.Silva, A.G.B., Sequeira, C.H., Sermarini, R.A., Otto, R., 2017. Urease inhibitor NBPT on ammonia volatilization and crop productivity: a meta-analysis. Agron. J.
109, 1e13. https://doi.org/10.2134/agronj2016.04.0200.Sun, H., Zhang, H., Powlson, D., Min, J., Shi, W., 2015. Rice production, nitrous oxide emission and ammonia volatilization as impacted by the nitrification
inhibitor 2-chloro-6-(trichloromethyl)-pyridine. Field Crop. Res. 173, 1e7. https://doi.org/10.1016/j.fcr.2014.12.012.Suter, H., Sultana, H., Turner, D., Davies, R., Walker, C., Chen, D., 2013. Influence of urea fertiliser formulation, urease inhibitor and season on ammonia loss
from ryegrass. Nutrient Cycl. Agroecosyst. 95, 175e185. https://doi.org/10.1007/s10705-013-9556-y.Suter, H.C., Sultana, H., Davies, R., Walker, C., Chen, D., 2016. Influence of enhanced efficiency fertilisation techniques on nitrous oxide emissions and
productivity response from urea in a temperate Australian ryegrass pasture. Soil Res. 54, 523e532. https://doi.org/10.1071/SR15317.Tasca, F.A., Ernani, P.R., Rogeri, D.A., Gatiboni, L.C., Cassol, P.C., 2011. Volatilizaç~ao De Amonia Do Solo Ap�os a Aplicaç~ao De Ureia Convencional Ou Com
Inibidor De urease. Rev. Bras. Cienc. Solo 35, 493e502.Tian, Z., Wang, J.J., Liu, S., Zhang, Z., Dodla, S.K., Myers, G., 2015. Application effects of coated urea and urease and nitrification inhibitors on ammonia and
greenhouse gas emissions from a subtropical cotton field of the Mississippi delta region. Sci. Total Environ. 533, 329e338. https://doi.org/10.1016/j.scitotenv.2015.06.147.
UNFCCC, 1997. Kyoto Protocol to the United Nations Framework Convention on Climate Change. UNFCCC.van Beek, C.L., Meerburg, B.G., Schils, R.L.M., Verhagen, J., Kuikman, P.J., 2010. Feeding the world’s increasing population while limiting climate change
impacts: linking N2O and CH4 emissions from agriculture to population growth. Environ. Sci. Pol. 13, 89e96. https://doi.org/10.1016/j.envsci.2009.11.001.
Venterea, R.T., Clough, T.J., Coulter, J.A., Breuillin-Sessoms, F., Wang, P., Sadowsky, M.J., 2015. Ammonium sorption and ammonia inhibition of nitrite-oxidizing bacteria explain contrasting soil N 2 O production. Sci. Rep. 5, 1e15. https://doi.org/10.1038/srep12153.
H. Wang et al. / Global Ecology and Conservation 22 (2020) e0093310
Volpi, I., Laville, P., Bonari, E., o di Nasso, N.N., Bosco, S., 2017. Improving the management of mineral fertilizers for nitrous oxide mitigation: the effect ofnitrogen fertilizer type, urease and nitrification inhibitors in two different textured soils. Geoderma 307, 181e188. https://doi.org/10.1016/j.geoderma.2017.08.018.
Wang, K., Zheng, X., Pihlatie, M., Vesala, T., Liu, C., Haapanala, S., Mammarella, I., Rannik, Ü., Liu, H., 2013. Comparison between static chamber and tunablediode laser-based eddy covariance techniques for measuring nitrous oxide fluxes from a cotton field. Agric. For. Meteorol. 171-172, 9e19.
Webb, J., Pain, B., Bittman, S., Morgan, J., 2010. The impacts of manure application methods on emissions of ammonia, nitrous oxide and on cropresponseda review. Agric. Ecosyst. Environ. 137, 39e46.
Weiske, A., Benckiser, G., Herbert, T., Ottow, J., 2001. Influence of the nitrification inhibitor 3, 4-dimethylpyrazole phosphate (DMPP) in comparison todicyandiamide (DCD) on nitrous oxide emissions, carbon dioxide fluxes and methane oxidation during 3 years of repeated application in field ex-periments. Biol. Fertil. Soils 34, 109e117. https://doi.org/10.1007/s003740100386.
Wolf, U., Fuss, R., Hoeppner, F., Flessa, H., 2014. Contribution of N2O and NH3 to total greenhouse gas emission from fertilization: results from a sandy soilfertilized with nitrate and biogas digestate with and without nitrification inhibitor. Nutrient Cycl. Agroecosyst. 100, 121e134. https://doi.org/10.1007/s10705-014-9631-z.
Wu, D., Senbayram, M., Well, R., Brueggemann, N., Pfeiffer, B., Loick, N., Stempfhuber, B., Dittert, K., Bol, R., 2017. Nitrification inhibitors mitigate N2Oemissions more effectively under straw-induced conditions favoring denitrification. Soil Biol. Biochem. 104, 197e207. https://doi.org/10.1016/j.soilbio.2016.10.022.
Wulf, S., Maeting, M., Clemens, J., 2002. Application technique and slurry co-fermentation effects on ammonia, nitrous oxide, and methane emissions afterspreading. J. Environ. Qual. 31, 1795.
Yu, Q., Junwei, M., Wanchun, S., Ping, Z., Hui, L., Changhuan, F., Jianrong, F., 2018. Evaluations of the DMPP on organic and inorganic nitrogen mineralizationand plant heavy metals absorption. Geoderma 312, 45e51. https://doi.org/10.1016/j.geoderma.2017.10.007.
Zaman, M., Blennerhassett, J.D., 2010. Effects of the different rates of urease and nitrification inhibitors on gaseous emissions of ammonia and nitrous oxide,nitrate leaching and pasture production from urine patches in an intensive grazed pasture system. Agric. Ecosyst. Environ., Estim. Nitrous Oxide Emiss.Ecosyst. Mitig. Technol. 136, 236e246. https://doi.org/10.1016/j.agee.2009.07.010.
Zaman, M., Nguyen, M.L., 2012. How application timings of urease and nitrification inhibitors affect N losses from urine patches in pastoral system. Agric.Ecosyst. Environ. 156, 37e48. https://doi.org/10.1016/j.agee.2012.04.025.
Zaman, M., Zaman, S., Nguyen, M.L., Smith, T.J., Nawaz, S., 2013. The effect of urease and nitrification inhibitors on ammonia and nitrous oxide emissionsfrom simulated urine patches in pastoral system: a two-year study. Sci. Total Environ., Soil Source Sink Greenh. Gases 465, 97e106. https://doi.org/10.1016/j.scitotenv.2013.01.014.
H. Wang et al. / Global Ecology and Conservation 22 (2020) e00933 11
28
Chapter 3: Use of urease and nitrification inhibitors to decrease yield-scaled N2O emissions
from winter wheat and oilseed rape fields: a two-year field experiment
Haitao Wang1, Shutan Ma2, Guodong Shao3, Klaus Dittert1
1 Department of Crop Science, Division of Plant Nutrition and Crop Physiology, University of Goettingen,
Carl-Sprengel-Weg 1, 37075 Göttingen, Germany
2 School of Environmental Science and Engineering, Anhui Normal University, Wuhu 241002, China
3 Soil Science of Tropical and Subtropical Ecosystems, Faculty of Forest Sciences and Forest Ecology,
University of Goettingen, Buesgenweg 2, 37077 Göttingen, Germany
Abstract
Nitrogen fertilizers are the major source of nitrous oxide (N2O) emissions from arable land. The
addition of nitrification inhibitors to fertilizers may improve the nitrogen (N) use efficiency and
reduce N2O emissions. However, it is still unclear how crop rotations affect nitrification and urease
inhibitors to reduce N2O emissions. We conducted a field experiment with two-year winter wheat
and one-year oilseed rape cultivation in Germany from 2016 to 2017. We applied five different
fertilizer treatments: (1) a control treatment without fertilization (N0); (2) calcium ammonium
nitrate (CAN); (3) ammonium sulfate nitrate with the nitrification inhibitor 3,4-dimethylepyrazole
phosphate (ENTEC); (4) urea; and (5) urea with the urease inhibitor N-(n-butyl) thiophosphoric
triamide (UTEC). Crop yield, grain and straw N content, and N2O fluxes were measured to assess
yield-scaled N2O emissions under different treatments. We found that in all fertilized treatments,
the aboveground N uptake of wheat after wheat was 199–203 kg N ha−1, which was much lower
than that of wheat after oilseed rape (252–271 kg N ha−1). The apparent N recovery of oilseed rape
(13–23%) was much lower than in wheat after wheat (63–66%). The enhanced-efficiency fertilizers
increased aboveground N uptake by 0–5% compared to fertilizers without inhibitors. The oilseed
rape field had the highest yield-scaled N2O emissions (18.0, 15.1, 16.7 and 15.6 g N2O-N kg−1
aboveground N uptake in CAN, ENTEC, urea and UTEC, respectively). These results indicate that
urease and nitrification inhibitors hold the potential to increase crop yield and reduce N2O
emissions. Oilseed rape straw should be carefully managed to avoid high N2O emissions. We also

29
suggest that an optimized N application strategy might be a possible way to increase the efficiency
of urease and nitrification inhibitors; for instance, by increasing the N application rate in wheat
after wheat, but reducing it in oilseed rape.
Keywords: crop rotation, mineral N concentration, yield, nitrification inhibitors, N fertilization,
N2O emissions
Introduction
Nitrous oxide (N2O) is a potent greenhouse gas that absorbs longwave radiation (Granli and
Bockman, 1994) and has a global warming potential 298 times higher than that of CO2 on a 100-
year timescale (IPCC, 2013; Myhre et al., 2013). N2O also contributes to the depletion of
stratospheric ozone (Ravishankara et al., 2009). The atmospheric concentration of N2O in 2015
was 330 ppb, 21% higher than pre-industrial levels (WMO, 2018). The uptake efficiency of
nitrogen (N) fertilizer is usually <50% (Galloway et al., 2003) and losses of N from fertilizers have
both economic and environmental impacts (Fowler et al., 2013; Prather and Hsu, 2010), with
agriculture accounting for 60% of global anthropogenic N2O emissions (Bhatia et al., 2010).
Enhanced-efficiency fertilizers coated with urease or nitrification inhibitors may be used to reduce
the losses of N from soils (Lam et al., 2018; Wang et al., 2020). Soil N2O production relies on
nitrate (NO3−) and ammonium (NH4
+) provided by mineral or organic N (N fertilizer) (Ruser et al.,
2017). The dominant biological processes that produce N2O using mineral N substrates in soils are
nitrification and denitrification (Bremner, 1997). Urease inhibitors reduce the activity of the urease
enzyme and therefore slows the hydrolysis of urea, leading to a decrease in the volatilization of
ammonia (NH3) from soils (Drury et al., 2017; Liu et al., 2017; Mira et al., 2017; Silva et al., 2017).
N-(n-Butyl) thiophosphoric triamide (NBPT) is a very widely used urease inhibitor in arable soils
(Tian et al., 2015). Nitrification inhibitors prevent the conversion of NH4+ to NO3
− by decreasing
the enzymatic activity of ammonium-oxidizing bacteria, leading to a reduction in nitrification and
the emission of N2O from soils (Hu et al., 2015; Ruser and Schulz, 2015). 3,4-Dimethylpyrazole
phosphate (DMPP) (Liu et al., 2015; Rose et al., 2018; Shi et al., 2017) and dicyandiamide (Di et
al., 2014; Guo et al., 2014; Liu et al., 2017; Zaman et al., 2013) are very widely used nitrification
30
inhibitors to reduce N2O emissions and have been shown to be effective in increasing crop yields
and reducing N2O emissions (Akiyama et al., 2010).
Many incubation studies have focused on the effect of nitrification or urease inhibitors on soil N2O
emissions (Cantarella et al., 2018; Tian et al., 2015). However, short-term incubation studies may
lead to a misinterpretation of the environmental effects of N2O emissions. Firstly, neglecting
freeze–thaw emissions would underestimate agricultural N2O emissions by 17 to 28% (Wagner-
Riddle et al., 2017). Secondly, N fertilizers with inhibitors are usually applied in spring, but it is
still not clear how long their effects might last. The addition of nitrification inhibitors is assumed
to reduce NO3− leaching rates and therefore lead to a lower C/N ratio in plant residues that are left
after cropping (Pfab et al., 2012). This may accelerate the mineralization of plant residues and
promote the release of N2O in the post-harvest season (Köbke et al., 2018; Walter et al., 2015).
Therefore, measurements of N2O emissions on an annual basis will provide more reliable
information to support the mitigation potential of these inhibitors (Pfab et al., 2012). Since N
fertilizers coated with nitrification or urease inhibitor can reduce N losses and may have the
potential to increase crop yields (Abalos et al., 2014), we suggest that the reduction in yield-scaled
N2O emissions (the annual cumulative N2O emissions per unit grain yield) from enhanced-
efficiency fertilizers would be more significant than the reduction in area-scaled N2O emissions.
Winter oilseed rape (Brassica napus L.) and winter wheat (Triticum aestivum L.) are important
crops in Germany. The area of winter oilseed rape in Germany in 2018 was twice that in 1990
(FAOSTAT, 2018), and makes up >75% of transport biofuels in Europe (Hamelinek et al., 2014).
Winter wheat has the highest yield potential in all cereals, and the cultivated area has reached 26.6%
of the total arable land in Germany, which represents an increase by one-third in the last 30 years
(DESTATIS, 2015). Continuous cropping of winter wheat could decrease soil fertility, grain yield,
and yield stability (de Cárcer et al., 2019; Macholdt et al., 2020). Therefore, winter oilseed rape is
recommended as a break crop. The grain yield of oilseed rape preceding winter wheat is usually
higher than that of continuous cropping with a cereal (Angus et al., 2015; Sieling and Christen,
2015; Weiser et al., 2018). The N surplus of winter oilseed rape cultivation is higher as a result of
its low harvest index and large amount of crop residue (Bouchet et al., 2016; Sieling and Kage,
2010). This high-N surplus can reduce the need for N fertilizer in the following winter wheat season
and increase the grain yield. This might be a positive environmental impact on decreasing the
31
potential yield-scaled N2O emissions during a winter oilseed rape–winter wheat rotation. However,
Sieling and Kage (2010) reported that the large N surplus after the harvest of winter oilseed rape
cannot be used by the succeeding winter wheat crop before the winter season, and this large N pool
would increase the risk of post-harvest N2O emissions (Köbke et al., 2018). Therefore, the effect
of the preceding crop should also be taken into consideration when assessing annual N2O emissions.
In this study, we measured soil N2O fluxes from two adjacent fields that were both grown with a
wheat–wheat–oilseed rape rotation. In the first field, the preceding crop was oilseed rape in 2015,
and the standing crop during the experiment was winter wheat in 2016 and 2017 (WW2016 and
WW2017). In the second field, the standing crop during the measurement period was oilseed rape
in 2017 (WR2017), which was preceded by two years of winter wheat in 2015 and 2016. We
applied two common fertilizers (calcium ammonium nitrate (CAN) and urea) and two enhanced-
efficiency fertilizers (NBPT and DMPP) at each site, and also measured grain and straw yields and
their N contents. Our main aim was to verify how crop rotation—here, wheat–wheat–oilseed rape
rotation—affects the performance of the two inhibitors in terms of N2O emissions, crop yield, and
yield-scaled N2O emissions. We hypothesized that the enhanced-efficiency fertilizers would (1)
increase the crop yield and (2) reduce N2O emissions, compared to fertilizers without inhibitors,
and (3) oilseed rape fields would have higher N2O emissions than wheat fields.
Materials and methods
Study site and field treatments
This experiment was conducted at Reinshof, an experimental agricultural station of the University
of Goettingen, Lower Saxony, Germany (51° 29 50.3 N, 9° 55 59.9 E). The annual mean
temperature and annual precipitation are 9.2 ± 0.1°C and 651 ± 24 mm, respectively (1981–2010,
meteorological station at Goettingen, station ID 1691, German Meteorological Service). The soil
is classified as a Luvisol (IUSS Working Group WRB, 2006) with a bulk density of 1.3 g cm−3 and
a pH of 7.0 in the top 20 cm of the soil profile. The soil texture consists of 16% clay, 61% silt, and
23% sand, with an organic C content of 2% (Römer et al., 2015).

32
The crop rotation of this study was wheat–wheat–oilseed rape in a three-year cycle. Our experiment
was conducted in two adjacent fields. For the first field, we conducted our measurements from 3
March 2016 to 2 March 2018, and the field was cultivated with winter wheat (Triticum aestivum
L.) in both years (WW2016 and WW2017), which was preceded by oilseed rape in 2015. For the
adjacent field, we conducted our measurements from 3 March 2017 to 2 March 2018, and the field
was cultivated with oilseed rape (Brassica napus L.) in 2017 (WR2017), which was preceded by
two years of winter wheat in 2015 and 2016. A detailed description of the field management during
the experimental period is shown in Fig. 1. Granulated fertilizers were broadcast onto the fields.
After harvest, straw and stubble were left in the fields and the soil was ploughed to a depth of 25
cm before next sowing.
Fig. 1. Timetable and main field management. Measurements began on 1 March and continued for a full
year. The winter wheat measurements lasted for two years and the oilseed rape was measured for one year.
The two fields were in adjacent locations and had similar management. WW2016 refers to the winter wheat
after oilseed rape in 2016; WW2017 to winter wheat after winter wheat in 2017; and WR2017 to winter
oilseed rape after two years of winter wheat cultivation in 2017.

33
Five fertilization treatments were tested: control without N fertilizer input (N0), 180 kg N of CAN
(76% NH4NO3 and 24% CaCO3, 26% N), 180 kg N of ENTEC26 (18.5% NH4+ N and 7.5% NO3
−
N with 0.15% DMPP; BASF, Ludwigshafen, Germany), 180 kg N of urea (NH2CONH2, 46% N),
and 180 kg of UTEC46 (urea with added NBPT; BASF, Ludwigshafen, Germany). In treatments
with fertilizer input, 120 kg of N was applied as basal fertilizer in March (14 March 2016 and 10
March 2017, respectively) and 60 kg of N as top-dressing in May (20 May 2016 and 5 May 2017,
respectively). No fertilizer was applied in autumn, which is in accordance with local practice. The
treatments were randomized with three replicates, resulting in a total of 15 plots (each with an area
of 10 m × 8 m). Each plot was designed with two parts; one was used for the insertion of gas
chambers and the collection of soil samples and the other for crop harvest to calculate the crop
yield.
Gas sampling and measurement
Gas samples were collected from winter wheat fields using opaque closed chambers. A 0.275 m2
basal ring frame was inserted into the soil. The chamber was dark inside and wheat plants were
included during the growing season. The height of the chamber above ground was 0.35 m and this
was increased to 0.75 m as the winter wheat grew taller. A rubber band was used at the joints of
the chamber with the ring to avoid leakage. In winter oilseed rape fields, we used rectangular
chambers of 0.72 m length, 0.28 m width and 0.15 m hight. The rows were 0.4 m apart, so plants
were not included in the oilseed rape gas flux chambers. The gas samples were taken daily for one
week after additions of fertilizers, then every two or three days and after one month once each
week. The samples were also collected when the levels of emissions were expected to be high due
to precipitation or tillage events.
12-mL Labco Exetainers were evacuated the day before sampling. The chambers on the base
frames were closed and sealed with the rubber band. Gas in the headspace of the chambers was
sampled with 30-mL polypropylene syringes 0, 20 and 40 min after closure. The extracted gas was
immediately transferred to the Exetainers before being transported to the laboratory for analysis on
a Bruker SCION Model 456 gas chromatograph (Bremen, Germany). An electron capture detector
was used to determine the concentration of N2O. The flux rates were calculated by linear regression
of the gas concentration with time (Parkin et al., 2012; Wang et al., 2013). The cumulative
emissions were estimated by linear interpolation. The emission factor (EF, N2O-N emitted as a

34
percentage of fertilizer applied) was calculated by the annual N2O emissions and the amount of N
fertilizer:
EF(%) = Annual N2O−Nfertilized−Annual N2O−Nunfertilized Amount of N applied × 100 (1)
Auxiliary measurements
Soil samples were taken once a week from a depth of 15 cm in each plot for the full measurement
period and used to determine the soil moisture and mineral N (NO3− and NH4
+) content. Briefly,
50 g soil samples were dissolved in 200 mL of 0.0125 M CaCl2 solution, filtered and stored at
−20°C. The samples were analyzed using a San++ continuous flow analyzer (Skalar Analytical,
the Netherlands). The soil temperature at 5 cm depth was automatically recorded in the field at 30-
minute intervals using a temperature logger (LogTag temperature recorder, TRIX-16, Auckland,
New Zealand). Winter wheat was harvested after physiological maturity on 7 August 2016 and 9
August 2017, whereas winter oilseed rape was harvested on 4 August 2017. Grain and straw were
dried to a constant weight in an oven at 60°C before milling. Total N content of grain and straw
was analyzed to determine aboveground N uptake by the crop. Aboveground N uptake of grain and
straw were calculated as:
Aboveground N uptake = Yield × N content (2)
The apparent N recovery (ARN) was calculated as
ARN (%) = Nuptake(fertilized)−Nuptake(unfertilized)Amount of N applied × 100 (3)
Statistical analysis
Statistical data analyses were performed using the IBM SPSS Statistics 21.0 software package. For
soil N2O fluxes, we first checked for normal distribution with the Shapiro–Wilk test and Levene’s
test, and found that the data were non-normally distributed and the variance was inhomogeneous.
One-way ANOVA was used to test the significance of the differences in treatment on the
cumulative N2O emissions, grain and straw yields, total N content and the yield-scale N2O
emissions. The cumulative emissions were estimated by linear interpolation and the results were
tested for variance homogeneity and normal distribution. The mean values were compared via a
least-significant-difference test at the 5% level using Tukey’s ‘honest significant difference’ post-
hoc test. Spearman’s rank correlation tests were performed to determine the relationships between

35
soil N2O and WFPS, chamber air temperature, soil NH4+ and NO3
− concentrations (0–15 cm) across
WW2016, WW2017 and WR2017.
Results
Climate conditions
The precipitation from 1 March 2016 to 28 February 2017 was 523 mm, whereas the precipitation
from 1 March 2017 to 28 February 2018 was 806 mm (Fig. 2a). Heavy rainfall events (>60 mm)
occurred three times in 2017 (on 23 June, 24 July and 25 July), whereas the heaviest rainfall in
2016 was only 35 mm (on 24 June) (Fig. 2a). The local mean long-term air temperature is 8.7°C.
However, the mean air temperature was 9.5°C in 2016 and 10°C in 2017 (Fig. 2a). The soil water
content was regulated by precipitation events and evapotranspiration, ranging from 20 to 80%
water-filled pore space (WFPS) during the study period, with no significant difference among the
fertilizer treatments crops grown (Fig. 2b). Although in 2017 the spring (about 40% WFPS) was
drier compared to 2016 (about 50% WFPS), higher WFPS in summer was observed in summer
2017 than 2016 as a result of the heavy rainfall events (Fig. 2b).
Mrz
.16
Jun.
16
Sep
.16
Dez
.16
Mrz
.17
Jun.
17
Sep
.17
Dez
.17
Mrz
.18
WF
PS
(%
)
0
20
40
60
80
Pre
cip
ita
tio
n (
mm
da
y-1
)
0
20
40
60
80
100
Tem
pera
ture
(°C
)
-30
-20
-10
0
10
20
30
Precipitation
Mean daily air temperature
Mean daily 5 cm soil temperature
(a)
(b)Post-harvest Post-harvest

36
Fig. 2. (a) Mean daily precipitation (mm day−1) (dark cyan bars) and mean daily soil temperature (°C) at 5
cm depth (solid dark red lines) in the experimental field from March 2016 to March 2018. (b) Mean value
of WFPS in unfertilized treatments in the winter wheat field from 1 March 2016 to 1 March 2018. The
WFPS data showed no significant difference among the fertilizer treatments and crop fields. Downward
vertical dotted arrows indicate harvest events and the red solid horizontal line marks 50% WFPS.
Soil NH4+-N and NO3
--N content
01.0
3.20
17
01.0
5.20
17
01.0
7.20
17
01.0
9.20
17
01.1
1.20
17
01.0
1.20
18
01.0
3.20
180
20
40
60
80
01.0
3.20
17
01.0
5.20
17
01.0
7.20
17
01.0
9.20
17
01.1
1.20
17
01.0
1.20
18
01.0
3.20
16
01.0
5.20
16
01.0
7.20
16
01.0
9.20
16
01.1
1.20
16
01.0
1.20
17
NO
3
- -N (
kg
N h
a-1
)
0
20
40
60
80
N0
Urea
UTEC
NH
4
+-N
(kg
N h
a-1
)
0
20
40
60
80
WW2016
NO
3
- -N (
kg
N h
a-1
)
0
20
40
60
80
N0
CAN
ENTEC
WW2017 WR2017
NH
4
+-N
(kg
N h
a-1
)
a
b
c
d
Post-harvestPost-harvestPost-harvest
Fig. 3. Seasonal dynamics of (a, c) soil nitrate (NO3−) and (b, d) ammonium (NH4
+) contents (0–15 cm depth)
in different fertilizer treatments over two years of winter wheat (WW2016 and WW2017) and one year of
winter oilseed rape (WR2017). The symbols show the means of three replicates and the vertical bars show
the standard errors of the mean. The downward arrows indicate the addition of fertilizer; larger arrows
indicate basal fertilization with 120 kg N ha−1; and smaller arrows indicate the addition of a 60 kg N ha−1
dressing. Dotted vertical lines indicate harvest events. WW2016 refers to winter wheat after oilseed rape in
2016; WW2017 to winter wheat after winter wheat in 2017; and WR2017 to winter oilseed rape after two
years of winter wheat cultivation in 2017.

37
The peak soil NO3− and NH4
+ concentrations occurred one week after application of fertilizer in all
treatments (Fig. 3). The highest soil NO3− and soil NH4
+ concentrations were 60 kg N ha−1 (CAN,
WW2016) and 45 kg N ha−1 (urea, WW2016), respectively (Fig. 3a, 3b). Smaller soil NO3− peaks
were found post-harvest in both wheat and oilseed rape fields. Crop residues led to high soil NO3−
substrates in the post-harvest season and succeeding winter wheat rotations, especially in WR2017
(Fig. 3a, 3c). The background soil NO3− concentration (N0 treatment) across the year was >10 kg
N ha−1 in treatment WW2016, which was clearly higher than in treatment WW2017 (near to zero)
(Fig. 3a, 3c).
In most cases, the ENTEC treatment showed lower soil NO3− and higher NH4
+ concentrations than
the CAN treatment. Compared to urea (Fig. 3a, 3b), the UTEC treatment showed slightly higher
soil NO3− concentrations than the urea treatment after each addition of fertilizer in both fields and
measurement years (Fig. 3c), although there was no clear difference in soil NH4+ concentrations
between the urea and UTEC treatments (Fig. 3d).
Nitrous oxide fluxes
The peaks of N2O emissions were observed around one week after each fertilizer addition (Fig. 4).
In addition to the two peak N2O emissions caused by N top dressing, small peaks were also detected
in all treatments during the post-harvest season, especially in the WR2017 treatments (Fig. 4a, b, c
and d). The ENTEC treatments all had smaller peak emissions across fields and years than the
CAN treatments, especially after the top dressing, and the ENTEC treatment also resulted in lower
post-harvest emissions than the CAN treatment, especially in WW2017. There was no recognizable
difference between urea and UTEC treatments in all fields.
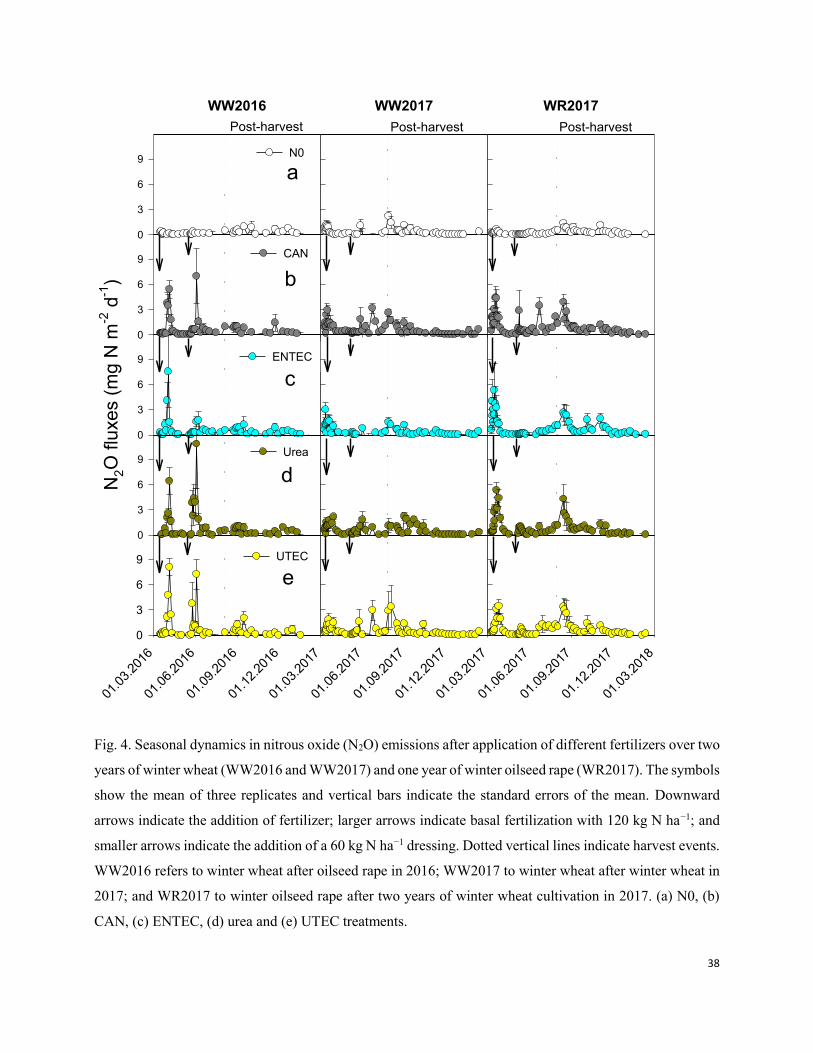
38
N2O
flu
xe
s (
mg N
m-2
d-1
)
0
3
6
9 ENTEC
01.0
3.20
16
01.0
6.20
16
01.0
9.20
16
01.1
2.20
16
0
3
6
9 UTEC
01.0
3.20
17
01.0
6.20
17
01.0
9.20
17
01.1
2.20
17
01.0
3.20
17
01.0
6.20
17
01.0
9.20
17
01.1
2.20
17
01.0
3.20
18
0
3
6
9Urea
0
3
6
9CAN
WW2016
0
3
6
9N0
WW2017 WR2017
Post-harvest Post-harvest Post-harvest
a
b
c
d
e
Fig. 4. Seasonal dynamics in nitrous oxide (N2O) emissions after application of different fertilizers over two
years of winter wheat (WW2016 and WW2017) and one year of winter oilseed rape (WR2017). The symbols
show the mean of three replicates and vertical bars indicate the standard errors of the mean. Downward
arrows indicate the addition of fertilizer; larger arrows indicate basal fertilization with 120 kg N ha−1; and
smaller arrows indicate the addition of a 60 kg N ha−1 dressing. Dotted vertical lines indicate harvest events.
WW2016 refers to winter wheat after oilseed rape in 2016; WW2017 to winter wheat after winter wheat in
2017; and WR2017 to winter oilseed rape after two years of winter wheat cultivation in 2017. (a) N0, (b)
CAN, (c) ENTEC, (d) urea and (e) UTEC treatments.
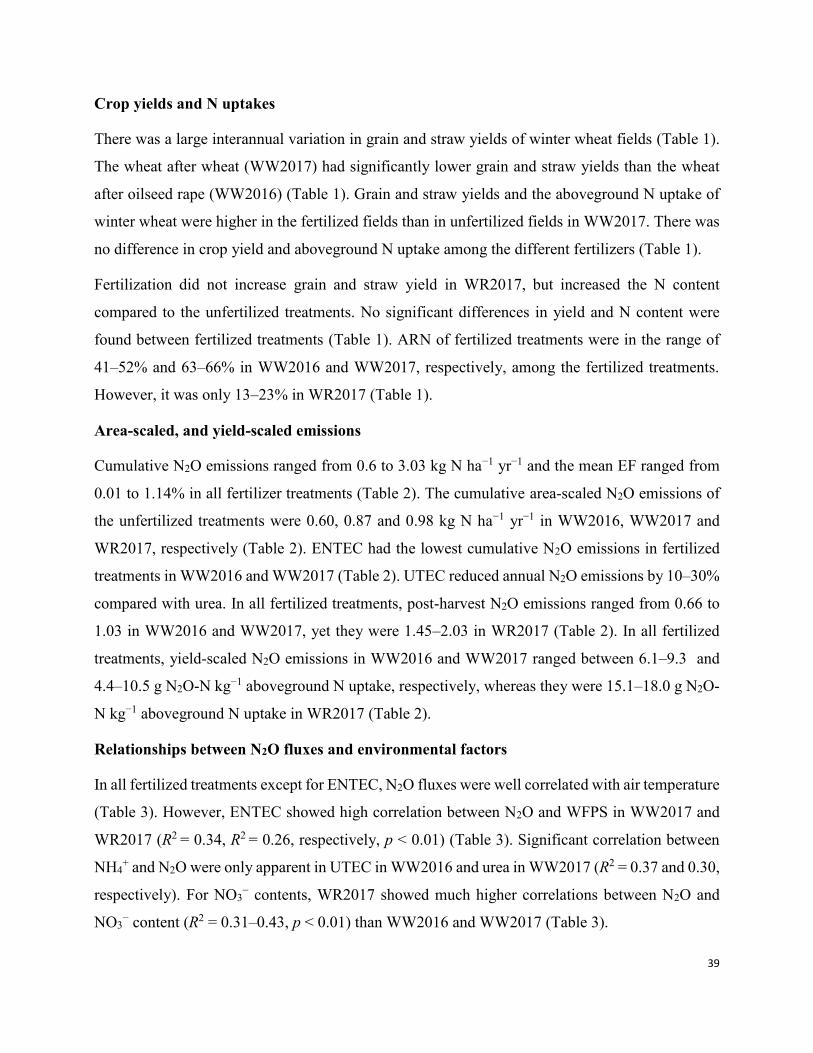
39
Crop yields and N uptakes
There was a large interannual variation in grain and straw yields of winter wheat fields (Table 1).
The wheat after wheat (WW2017) had significantly lower grain and straw yields than the wheat
after oilseed rape (WW2016) (Table 1). Grain and straw yields and the aboveground N uptake of
winter wheat were higher in the fertilized fields than in unfertilized fields in WW2017. There was
no difference in crop yield and aboveground N uptake among the different fertilizers (Table 1).
Fertilization did not increase grain and straw yield in WR2017, but increased the N content
compared to the unfertilized treatments. No significant differences in yield and N content were
found between fertilized treatments (Table 1). ARN of fertilized treatments were in the range of
41–52% and 63–66% in WW2016 and WW2017, respectively, among the fertilized treatments.
However, it was only 13–23% in WR2017 (Table 1).
Area-scaled, and yield-scaled emissions
Cumulative N2O emissions ranged from 0.6 to 3.03 kg N ha−1 yr−1 and the mean EF ranged from
0.01 to 1.14% in all fertilizer treatments (Table 2). The cumulative area-scaled N2O emissions of
the unfertilized treatments were 0.60, 0.87 and 0.98 kg N ha−1 yr−1 in WW2016, WW2017 and
WR2017, respectively (Table 2). ENTEC had the lowest cumulative N2O emissions in fertilized
treatments in WW2016 and WW2017 (Table 2). UTEC reduced annual N2O emissions by 10–30%
compared with urea. In all fertilized treatments, post-harvest N2O emissions ranged from 0.66 to
1.03 in WW2016 and WW2017, yet they were 1.45–2.03 in WR2017 (Table 2). In all fertilized
treatments, yield-scaled N2O emissions in WW2016 and WW2017 ranged between 6.1–9.3 and
4.4–10.5 g N2O-N kg−1 aboveground N uptake, respectively, whereas they were 15.1–18.0 g N2O-
N kg−1 aboveground N uptake in WR2017 (Table 2).
Relationships between N2O fluxes and environmental factors
In all fertilized treatments except for ENTEC, N2O fluxes were well correlated with air temperature
(Table 3). However, ENTEC showed high correlation between N2O and WFPS in WW2017 and
WR2017 (R2 = 0.34, R2 = 0.26, respectively, p < 0.01) (Table 3). Significant correlation between
NH4+ and N2O were only apparent in UTEC in WW2016 and urea in WW2017 (R2 = 0.37 and 0.30,
respectively). For NO3− contents, WR2017 showed much higher correlations between N2O and
NO3− content (R2 = 0.31–0.43, p < 0.01) than WW2016 and WW2017 (Table 3).
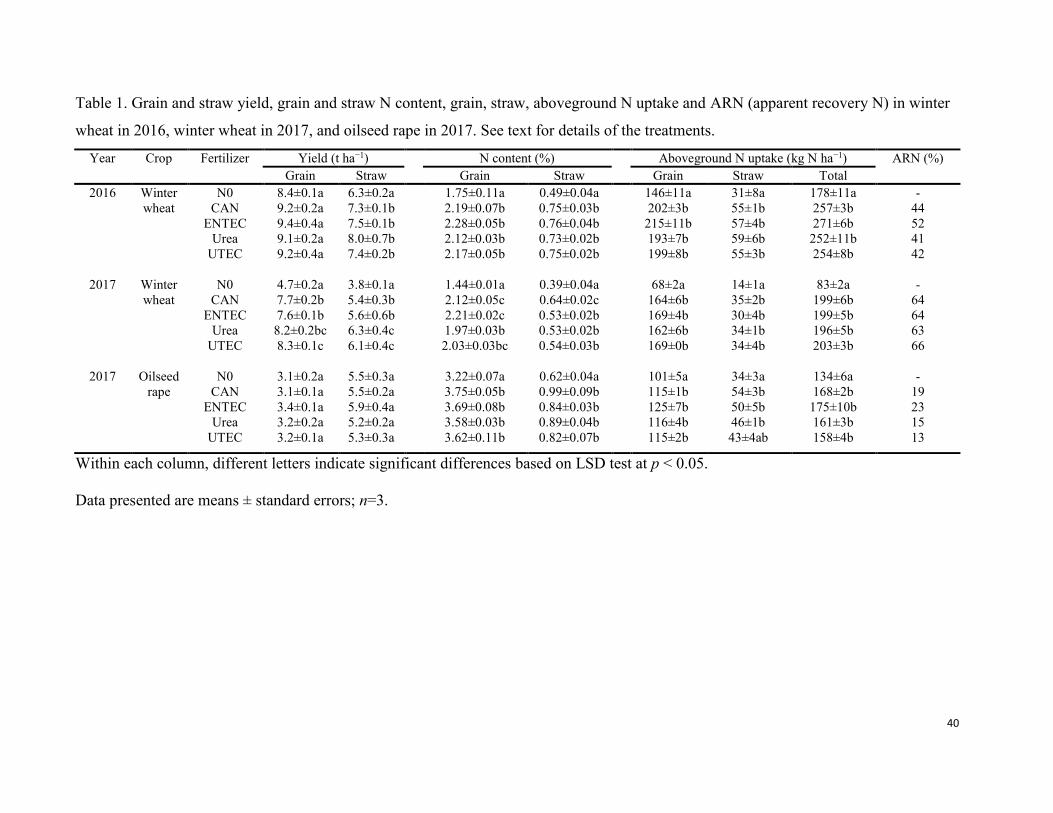
40
Table 1. Grain and straw yield, grain and straw N content, grain, straw, aboveground N uptake and ARN (apparent recovery N) in winter
wheat in 2016, winter wheat in 2017, and oilseed rape in 2017. See text for details of the treatments.
Year Crop Fertilizer Yield (t ha−1) N content (%) Aboveground N uptake (kg N ha−1) ARN (%)
Grain Straw Grain Straw Grain Straw Total
2016 Winter
wheat
N0 8.4±0.1a 6.3±0.2a 1.75±0.11a 0.49±0.04a 146±11a 31±8a 178±11a -
CAN 9.2±0.2a 7.3±0.1b 2.19±0.07b 0.75±0.03b 202±3b 55±1b 257±3b 44
ENTEC 9.4±0.4a 7.5±0.1b 2.28±0.05b 0.76±0.04b 215±11b 57±4b 271±6b 52
Urea 9.1±0.2a 8.0±0.7b 2.12±0.03b 0.73±0.02b 193±7b 59±6b 252±11b 41
UTEC
9.2±0.4a 7.4±0.2b 2.17±0.05b 0.75±0.02b 199±8b 55±3b 254±8b 42
2017 Winter
wheat
N0 4.7±0.2a 3.8±0.1a 1.44±0.01a 0.39±0.04a 68±2a 14±1a 83±2a -
CAN 7.7±0.2b 5.4±0.3b 2.12±0.05c 0.64±0.02c 164±6b 35±2b 199±6b 64
ENTEC 7.6±0.1b 5.6±0.6b 2.21±0.02c 0.53±0.02b 169±4b 30±4b 199±5b 64
Urea 8.2±0.2bc 6.3±0.4c 1.97±0.03b 0.53±0.02b 162±6b 34±1b 196±5b 63
UTEC
8.3±0.1c 6.1±0.4c 2.03±0.03bc 0.54±0.03b 169±0b 34±4b 203±3b 66
2017 Oilseed
rape
N0 3.1±0.2a 5.5±0.3a 3.22±0.07a 0.62±0.04a 101±5a 34±3a 134±6a -
CAN 3.1±0.1a 5.5±0.2a 3.75±0.05b 0.99±0.09b 115±1b 54±3b 168±2b 19
ENTEC 3.4±0.1a 5.9±0.4a 3.69±0.08b 0.84±0.03b 125±7b 50±5b 175±10b 23
Urea 3.2±0.2a 5.2±0.2a 3.58±0.03b 0.89±0.04b 116±4b 46±1b 161±3b 15
UTEC 3.2±0.1a 5.3±0.3a 3.62±0.11b 0.82±0.07b 115±2b 43±4ab 158±4b 13
Within each column, different letters indicate significant differences based on LSD test at p < 0.05.
Data presented are means ± standard errors; n=3.

41
Table 2. Cumulative N2O emissions on either an area-scaled (kg N ha−1 yr−1) or grain yield-scaled (g N2O-N kg−1 aboveground N uptake)
basis and the direct annual emission factors (EF, %) for the winter wheat in 2016 and 2017 and winter oilseed rape in 2017.
Year Crop Fertilizer Area-scaled N2O emissions (kg N2O-N ha−1 yr−1) Yield-scaled N2O
emissions (g N2O-N kg−1
aboveground N uptake)
EF (%)
Pre-harvest Post-harvest annual
2016 Winter
wheat
N0 -0.03±0.02a 0.63±0.10a 0.60±0.12a 3.3±0.5a -
CAN 0.97±0.23b 0.96±0.12a 1.94±0.28b 7.6±1.0ab 0.74±0.16a
ENTEC 0.73±0.16b 0.91±0.29a 1.65±0.38ab 6,1±1.2ab 0.58±0.21a
Urea 1.34±0.45b 1.01±0.12a 2.35±0.55b 9.3±1.7b 0.97±0.31a
UTEC
0.93±0.15b 0.80±0.07a 1.73±0.25b 6.8±0.8ab 0.67±0.14a
2017 Winter
wheat
N0 0.32±0.11a 0.55±0.04a 0.87±0.15a 10.4±1.0b -
CAN 1.34±0.05b 0.75±0.14a 2.09±0.19b 10.5±1.4b 0.68±0.11b
ENTEC 0.54±0.06a 0.35±0.06a 0.89±0.10a 4.4±0.4a 0.01±0.06a
Urea 0.77±0.27ab 1.03±0.09b 1.80±0.36b 9.2±1.1ab 0.52±0.20b
UTEC
0.80±0.30ab 0.66±0.11a 1.46±0.40ab 7.2±2.2ab 0.33±0.18ab
2017 Oilseed
rape
N0 0.22±0.01a 0.75±0.11a 0.98±0.11a 7.3±0.7a -
CAN 1.39±0.03c 1.64±0.19ab 3.03±0.22b 18.0±2.2b 1.14±0.12a
ENTEC 0.61±0.03b 2.03±0.35b 2.65±0.39b 15.1±2.6b 0.93±0.21a
Urea 1.09±0.23bc 1.60±0.50ab 2.70±0.72b 16.7±3.6b 0.96±0.40a
UTEC 1.01±0.02c 1.45±0.36ab 2.46±0.36b 15.6±0.7b 0.82±0.20a
Within each column, different letters indicate significant differences based on LSD test at p < 0.05.
Data presented are means ± standard errors; n=3.

42
Table 3. Spearman correlation coefficients (R2) between soil N2O fluxes, chamber air
temperature, water-filled pore space (WFPS) and soil NH4+ and NO3
− concentrations (0–15cm) in
WW2016, WW2017 and WR2017.
Year Crop Fertilizer Air temp. WFPS NH4+ NO3
-
2016 Winter
Wheat
N0 0.04 (n=180) 0.35** (n=75) 0.10 (n=75) 0.05 (n=75)
CAN 0.19* 0.23* 0.03 0.08
ENTEC 0.18* 0.15 0.13 0.15
Urea 0.19* 0.22† 0.17 0,20† UTEC 0.20** 0.14 0.37** 0.20†
2017 Winter
Wheat
N0 0.01 (n=204) 0.11 (n=60) 0.25*
(n=60)
0.10 (n=60)
CAN 0.23** 0.11 0.20 0.13
ENTEC 0.08 0.34** 0.15 0.02
Urea 0.11† 0.10 0.30* 0.08
UTEC 0.12† 0.18 0.16 0.01
2017 Oilseed
rape
N0 0.08 (n=204) 0.01 (n=60) 0.04 (n=60) 0.40** (n=60)
CAN 0.21** 0.13 0.10 0.35**
ENTEC 0.02 0.26* -0.14 0.43**
Urea 0.27** -0.01 0.24† 0.43**
UTEC 0.24** 0.06 0.27† 0.31**
† p ≤ 0.1, * p ≤ 0.05, **p ≤ 0.01
Discussion
Crop yields and N uptake
Crop yields showed no difference between fertilizer treatments, but there was a large interannual
variability. The variability can mainly be explained by two factors: the climatic conditions and the
crop rotation.
The heavy rain events in July 2017 delayed the harvest of the winter oilseed rape and resulted in
large yield losses. Winter wheat was also affected by the rainfall events, but the effect was smaller
because wheat matured later than oilseed rape. Heavy rainfall often causes NO3− leaching (Dai et
al., 2016; Errebhi et al., 1998; Xu et al., 2020), and correspondingly the soil NO3− content in
WW2017 and WR2017 was lower than in WW2016 (Fig. 3). There are many reports for Germany
that wheat grown after oilseed rape has higher yields than wheat grown after cereals (Angus et al.,
2015; Sieling and Christen, 2015). The ecological reasons for these so-called break-crop benefits
include an improved soil structure, better weed control, the suppression of propagation of typical
cereal pathogens, and the avoidance of phytotoxic exudates released by harvest residues (Weiser

43
et al., 2018). The nutritional reason for higher yields is the high surplus of N after oilseed rape
crops (Bouchet et al., 2016; Henke et al., 2008), also because the N content of the residual straw
was higher in WR2017 than in WW2016 and WW2017. Hence, the mineralization of plant residues
provided more mineral N than required for the uptake by wheat of N before winter (Ruser et al.,
2017). This may also explain the high background levels of NO3− in the succeeding crops of winter
wheat.
The enhanced-efficiency fertilizers ENTEC (added with the nitrification inhibitor DMPP) and
UTEC (added with the urease inhibitor NBPT) increased aboveground N uptake by only 0–5%
relative to the common fertilizers CAN and urea, with no statistical difference. Nauer et al. (2018)
and Pfab et al. (2012) also reported only minor benefits to productivity from using urease and
nitrification inhibitors. However, two meta-analyses revealed that these enhanced-efficiency
fertilizers may increase grain yields by 5.7% (Linquist et al., 2013) or 7.5% (Abalos et al., 2014).
Our results do not deny the potential of urease and nitrification inhibitors in increasing crop yields
and N uptake, but the increase of grain yield would be minor, whereas climate conditions were also
important factors affecting crop yield and aboveground N uptake.
Effect of environmental factors on N2O emissions
In our study, N2O fluxes were significantly (P < 0.05) correlated with air temperature on most
fertilized soils, except for ENTEC (Table 3), which was in line with several other studies (Ding et
al., 2019; Kroon et al., 2010; Ni et al., 2012; Shimizu et al., 2013). In 2017, annual N2O emissions
from N0 in both fields were higher than those in the wheat field in 2016, and one reason for this
might be the higher annual mean temperature in 2017, which would probably increased the
activities of temperature-dependent microbes (Butterbach-Bahl et al., 2013).
In most cases, WFPS was also positively correlated with soil N2O emissions (Table 3). In summer
2017, both wheat and oilseed rape fields showed higher N2O emission peaks than in 2016, and one
likely reason for this is the higher precipitation in summer 2017. The WFPS in our study was < 60%
in most cases and therefore nitrification may have been the dominant process (Baral et al., 2016;
Davidson, 1993; Khalil et al., 2002; Scholefield et al., 1997), with water becoming the limiting
factor for soil microbes, so the soil N2O emissions were positively correlated with WFPS (Jäger et
al., 2011; Ni et al., 2012).

44
NH4+ contents exhibited a slightly stronger associations with the N2O fluxes in urea-containing
fertilizers than in CAN and ENTEC. The results indicate that nitrification played an important role
in urea fertilizers in contributing to N2O emissions (Fu et al., 2012). It is widely accepted that soil
NO3− is the dominant factor causing N2O emissions (Ni et al., 2012; Ruser et al., 2017; Walter et
al., 2015; Yan et al., 2018). In our study in WR2017, N2O fluxes were highly correlated with soil
NO3− content. The high correlation between N2O emissions and soil NO3
− concentrations in
WR2017 was mainly attributed to straw mineralization. This was probably related to two factors:
(1) compared to wheat residues, the large amount of oilseed rape residues in WR2017 supplied not
only NO3− to the soil, but also ample organic carbon substrate (Köbke et al., 2018; Mitchell et al.,
2013; Senbayram et al., 2012); and (2) the heavy rainfall events in summer 2017 may have
accelerated straw decomposition. The high background soil NO3− in WW2016 (about 10–15 kg N
ha−1, 0–30 cm) and the post-harvest soil NO3− in WR2017 (about 10–15 kg N ha−1) can both be
explained by the large amount of oilseed rape residues post-harvest, which resulted in high-N
surpluses (Köbke et al., 2018; Ruser et al., 2017; Sieling and Kage, 2010).
Effect of urease and nitrification inhibitors on N2O emissions
Both the area-scaled and yield-scaled N2O emissions of the enhanced-efficiency fertilizers
(ENTEC and UTEC) were numerically lower than N fertilizer without inhibitors (CAN and urea)
(Table 2). Such reduction is in agreement with other studies (Hu et al., 2015; Qiao et al., 2015;
Silva et al., 2017). Only ENTEC in WW2017 showed impressively lower cumulative N2O
emissions than the other fertilizers (p < 0.05). The low cumulative N2O emissions of ENTEC in
WW2017 were mainly attributed to the reduction of N2O emissions in the pre-harvest season (Table
2). Surprisingly, although ENTEC in WR2017 showed the lowest N2O emissions in the pre-harvest
season, there was no reduction of N2O emissions in the post-harvest season (Table 2). In fact, N2O
emissions in the post-harvest season of WR2017 were quite high in all fertilized treatments. As
mentioned above, the most likely reason for this was the large amount of oilseed rape residues and
high soil moisture, which provided N substrate, an energy source, and sufficient water for
denitrification (Köbke et al., 2018; Senbayram et al., 2012; Wu et al., 2018). As a result, annual
N2O emissions of the ENTEC treatment in WR2017 did not show a statistical difference with CAN
and urea. Therefore, we are able to demonstrate that high post-harvest N2O emissions may have
masked reductions in N2O emissions by the inhibitor over the full year.

45
However, in many studies, straw amendment was recommended as a method to reduce N2O
emissions (Huang et al., 2017; Xu et al., 2019; Yao et al., 2017). A key factor of N2O emissions
with straw incorporation is the C:N ratio, or NO3− in the soil, in that a higher C:N ratio would lead
to more complete denitrification (Hu et al., 2019; Köbke et al., 2018). In WR2017, the yield-scaled
N2O emissions of the fertilized treatments were higher than 15 g N2O-N kg N aboveground N
uptake, which is seen as an indicator of excessive N application (Groenigen et al., 2010).
Considering that ARN in WR2017 was much lower than in WW2016 and WW2017, we therefore
postulate that the N application rates in the oilseed rape field might have been more than optimal.
Reducing the amount of N application in oilseed rape is therefore suggested as possible solution to
avoid high post-harvest N2O emissions. Also, it is necessary to take the N application rate into
consideration in straw management strategies (Hu et al., 2019; Yao et al., 2017).
Implications for crop production
Wheat–wheat–oilseed rape is a common crop rotation in Germany. Although this study did not
cover a three-year cycle in the same field, it nonetheless provides valuable information for such
rotation systems. Firstly, enhanced-efficiency fertilizers have the potential to reduce N2O emissions,
but their effectiveness is influenced by various environmental factors. Therefore, inhibitors should
be used with more advanced technology—for example, with more efficient broadcasting or soil
injection. Secondly, the risk of N2O emissions from oilseed residues in the post-harvest season
should be carefully assessed. And finally, N application rates should be optimized; our suggestion
is to increase the amount of N application in wheat after the wheat and to reduce N fertilization in
the oilseed rape.
Conclusions
In this study, we carried out N2O measurements during two years of winter wheat and one year of
oilseed rape. Compared to fertilizers without inhibitors, enhanced-efficiency fertilizers increased
the aboveground N uptake by only 0–5%. However, the high surplus of N in oilseed rape also
carries a risk of high post-harvest N2O emissions. Therefore, assessing the benefits of oilseed rape
as break crop should also consider the post-harvest management of crop residues. Overall, we
conclude that, both ENTEC and UTEC have the potential to increase yield and reduce N2O
emissions in wheat–wheat–oilseed rape rotations, although with the caveat that many

46
environmental factors (e.g., the accumulative temperature, soil moisture content and soil NO3−
substrate) contribute to a certain level of uncertainty in the degree to which enhanced-efficiency
fertilizers can reduce N2O emissions. We also recommend an improved fertilization strategy
towards gaining a better grain yield and reduced N2O emissions in the form of increasing the N
application level in wheat after wheat and reducing it in the oilseed rape season.
Acknowledgements
This project was supported by China Scholarship Council. We also thank Marlies Niebuhr, Simone
Urstadt, Susanne Koch, Ulrike Kierbaum, Kirsten Fladung, Oliver Caré, Reinhard Hilmer and
Jürgen Kobbe for their diligent and skillful assistance.
References
Abalos, D., Jeffery, S., Sanz-Cobena, A., Guardia, G., Vallejo, A., 2014. Meta-analysis of the effect of
urease and nitrification inhibitors on crop productivity and nitrogen use efficiency. Agric. Ecosyst.
Environ. 189, 136–144. https://doi.org/10.1016/j.agee.2014.03.036
Akiyama, H., Yan, X., Yagi, K., 2010. Evaluation of effectiveness of enhanced-efficiency fertilizers as
mitigation options for N2O and NO emissions from agricultural soils: meta-analysis. Glob.
Change Biol. 16, 1837–1846. https://doi.org/10.1111/j.1365-2486.2009.02031.x
Angus, J.F., Kirkegaard, J.A., Hunt, J.R., Ryan, M.H., Ohlander, L., Peoples, M.B., 2015. Break crops and
rotations for wheat. Crop Pasture Sci. 66, 523–552. https://doi.org/10.1071/CP14252
Baral, K.R., Arthur, E., Olesen, J.E., Petersen, S.O., 2016. Predicting nitrous oxide emissions from
manure properties and soil moisture: An incubation experiment. Soil Biol. Biochem. 97, 112–120.
https://doi.org/10.1016/j.soilbio.2016.03.005
Bhatia, A., Sasmal, S., Jain, N., Pathak, H., Kumar, R., Singh, A., 2010. Mitigating nitrous oxide emission
from soil under conventional and no-tillage in wheat using nitrification inhibitors. Agric. Ecosyst.
Environ., Estimation of nitrous oxide emission from ecosystems and its mitigation technologies
136, 247–253. https://doi.org/10.1016/j.agee.2010.01.004
Bouchet, A.-S., Laperche, A., Bissuel-Belaygue, C., Snowdon, R., Nesi, N., Stahl, A., 2016. Nitrogen use
efficiency in rapeseed. A review. Agron. Sustain. Dev. 36, 38. https://doi.org/10.1007/s13593-
016-0371-0
Bremner, 1997. Sources of nitrous oxide in soils. Nutr. Cycl. Agroecosystems 49, 7–16.
https://doi.org/10.1023/A:1009798022569
Butterbach-Bahl, Baggs Elizabeth M., Dannenmann Michael, Kiese Ralf, Zechmeister-Boltenstern
Sophie, 2013. Nitrous oxide emissions from soils: how well do we understand the processes and
their controls? Philos. Trans. R. Soc. B Biol. Sci. 368, 20130122.
https://doi.org/10.1098/rstb.2013.0122

47
Cantarella, H., Otto, R., Soares, J.R., Silva, A.G. de B., 2018. Agronomic efficiency of NBPT as a urease
inhibitor: A review. J. Adv. Res., Biotechnological and medical relevance of ureases 13, 19–27.
https://doi.org/10.1016/j.jare.2018.05.008
Dai, J., Wang, Z., Li, M., He, G., Li, Q., Cao, H., Wang, S., Gao, Y., Hui, X., 2016. Winter wheat grain
yield and summer nitrate leaching: Long-term effects of nitrogen and phosphorus rates on the
Loess Plateau of China. Field Crops Res. 196, 180–190. https://doi.org/10.1016/j.fcr.2016.06.020
Davidson, E.A., 1993. Soil Water Content and the Ratio of Nitrous Oxide to Nitric Oxide Emitted from
Soil, in: Oremland, R.S. (Ed.), Biogeochemistry of Global Change: Radiatively Active Trace
Gases Selected Papers from the Tenth International Symposium on Environmental
Biogeochemistry, San Francisco, August 19–24, 1991. Springer US, Boston, MA, pp. 369–386.
https://doi.org/10.1007/978-1-4615-2812-8_20
de Cárcer, P.S., Sinaj, S., Santonja, M., Fossati, D., Jeangros, B., 2019. Long-term effects of crop
succession, soil tillage and climate on wheat yield and soil properties. Soil Tillage Res. 190, 209–219. https://doi.org/10.1016/j.still.2019.01.012
DESTATIS, 2015. Publikation - Land- & Forstwirtschaft - Wachstum und Ernte - Feldfrüchte - Fachserie
3 Reihe 3.2.1 - 16/2015 - Statistisches Bundesamt (Destatis) [WWW Document]. URL
https://www.destatis.de/DE/Publikationen/Thematisch/LandForstwirtschaft/ErnteFeldfruechte/Fel
dfruechteJahr2030321157164.html (accessed 11.14.18).
Di, H.J., Cameron, K.C., Podolyan, A., Robinson, A., 2014. Effect of soil moisture status and a
nitrification inhibitor, dicyandiamide, on ammonia oxidizer and denitrifier growth and nitrous
oxide emissions in a grassland soil. Soil Biol. Biochem. 73, 59–68.
https://doi.org/10.1016/j.soilbio.2014.02.011
Ding, F., Sun, W., Huang, Y., 2019. Net N2O production from soil particle size fractions and its response
to changing temperature. Sci. Total Environ. 650, 97–104.
https://doi.org/10.1016/j.scitotenv.2018.08.428
Drury, C.F., Yang, X., Reynolds, W.D., Calder, W., Oloya, T.O., Woodley, A.L., 2017. Combining urease
and nitrification inhibitors with incorporation reduces ammonia and nitrous oxide emissions and
increases corn yields. J. Environ. Qual. 46, 939–949. https://doi.org/10.2134/jeq2017.03.0106
Errebhi, M., Rosen, C.J., Gupta, S.C., Birong, D.E., 1998. Potato Yield Response and Nitrate Leaching as
Influenced by Nitrogen Management. Agron. J. 90, 10–15.
https://doi.org/10.2134/agronj1998.00021962009000010003x
FAOSTAT, 2018. FAOSTAT [WWW Document]. URL http://www.fao.org/faostat/en/#data/QC
(accessed 11.14.18).
Fowler, D., Pyle, J.A., Raven, J.A., Sutton, M.A., 2013. The global nitrogen cycle in the twenty-first
century: introduction. Philos. Trans. R. Soc. B Biol. Sci. 368.
https://doi.org/10.1098/rstb.2013.0165
Fu, X.Q., Li, Y., Su, W.J., Shen, J.L., Xiao, R.L., Tong, C.L., Wu, J., 2012. Annual dynamics of N2O
emissions from a tea field in southern subtropical China. Plant Soil Environ. 58 (2012), 373–378.
https://doi.org/10.17221/719/2011-PSE
Galloway, J.N., Aber, J.D., Erisman, J.W., Seitzinger, S.P., Howarth, R.W., Cowling, E.B., Cosby, B.J.,
2003. The Nitrogen Cascade. BioScience 53, 341–356. https://doi.org/10.1641/0006-
3568(2003)053[0341:TNC]2.0.CO;2
Granli, T., Bockman, O.C., 1994. Nitrogen Oxide from Agriculture. Nor. J. Agric. Sci. 12, 7–127.

48
Groenigen, J.W.V., Velthof, G.L., Oenema, O., Groenigen, K.J.V., Kessel, C.V., 2010. Towards an
agronomic assessment of N2O emissions: a case study for arable crops. Eur. J. Soil Sci. 61, 903–913. https://doi.org/10.1111/j.1365-2389.2009.01217.x
Guo, Y.J., Di, H.J., Cameron, K.C., Li, B., 2014. Effect of application rate of a nitrification inhibitor,
dicyandiamide (DCD), on nitrification rate, and ammonia-oxidizing bacteria and archaea growth
in a grazed pasture soil: An incubation study. J. Soils Sediments 14, 897–903.
https://doi.org/10.1007/s11368-013-0843-7
Hamelinek, C., De Loveinfosse, L., Koper, M., et al., 2014. renewable energy progress and biofuels
sustainability. Ecofys Lond.
Henke, J., Böttcher, U., Neukam, D., Sieling, K., Kage, H., 2008. Evaluation of different agronomic
strategies to reduce nitrate leaching after winter oilseed rape (Brassica napus L.) using a
simulation model. Nutr. Cycl. Agroecosystems 82, 299–314. https://doi.org/10.1007/s10705-008-
9192-0
Hu, H.-W., Chen, D., He, J.-Z., 2015. Microbial regulation of terrestrial nitrous oxide formation:
understanding the biological pathways for prediction of emission rates. FEMS Microbiol. Rev. 39,
729–749. https://doi.org/10.1093/femsre/fuv021
Hu, N., Chen, Q., Zhu, L., 2019. The Responses of Soil N2O Emissions to Residue Returning Systems: A
Meta-Analysis. Sustainability 11, 748. https://doi.org/10.3390/su11030748
Huang, T., Yang, H., Huang, C., Ju, X., 2017. Effect of fertilizer N rates and straw management on yield-
scaled nitrous oxide emissions in a maize-wheat double cropping system. Field Crops Res. 204,
1–11. https://doi.org/10.1016/j.fcr.2017.01.004
IPCC, 2013. Climate Change 2013: The physical Science Basis. IPCC Working Group I Contribution to
AR5 pp 84.
Jäger, N., Stange, C.F., Ludwig, B., Flessa, H., 2011. Emission rates of N2O and CO2 from soils with
different organic matter content from three long-term fertilization experiments—a laboratory
study. Biol. Fertil. Soils 47, 483. https://doi.org/10.1007/s00374-011-0553-5
Khalil, M., Rosenani, A., Van Cleemput, O., Fauziah, C., Shamshuddin, J., 2002. Nitrous oxide emissions
from an ultisol of the humid tropics under maize-groundnut rotation. J. Environ. Qual. 31.
Köbke, S., Senbayram, M., Pfeiffer, B., Nacke, H., Dittert, K., 2018. Post-harvest N2O and CO2 emissions
related to plant residue incorporation of oilseed rape and barley straw depend on soil NO3-
content. Soil Tillage Res. 179, 105–113. https://doi.org/10.1016/j.still.2018.01.013
Kroon, P.S., Schrier‐Uijl, A.P., Hensen, A., Veenendaal, E.M., Jonker, H.J.J., 2010. Annual balances of
CH4 and N2O from a managed fen meadow using eddy covariance flux measurements. Eur. J. Soil
Sci. 61, 773–784. https://doi.org/10.1111/j.1365-2389.2010.01273.x
Lam, S.K., Suter, H., Bai, M., Walker, C., Davies, R., Mosier, A.R., Chen, D., 2018. Using urease and
nitrification inhibitors to decrease ammonia and nitrous oxide emissions and improve productivity
in a subtropical pasture. Sci. Total Environ. 644, 1531–1535.
https://doi.org/10.1016/j.scitotenv.2018.07.092
Linquist, B.A., Liu, L., Kessel, C. van, Groenigen, K.J. van, 2013. Enhanced efficiency nitrogen fertilizers
for rice systems: Meta-analysis of yield and nitrogen uptake. Field Crops Res. 154, 246–254.
https://doi.org/10.1016/j.fcr.2013.08.014
Liu, R., Hayden, H., Suter, H., He, J., Chen, D., 2015. The effect of nitrification inhibitors in reducing
nitrification and the ammonia oxidizer population in three contrasting soils. J. Soils Sediments 15,
1113–1118. https://doi.org/10.1007/s11368-015-1086-6
49
Liu, S., Wang, J.J., Tian, Z., Wang, X., Harrison, S., 2017. Ammonia and greenhouse gas emissions from
a subtropical wheat field under different nitrogen fertilization strategies. J. Environ. Sci. 57, 196–210. https://doi.org/10.1016/j.jes.2017.02.014
Macholdt, J., Piepho, H.-P., Honermeier, B., Perryman, S., Macdonald, A., Poulton, P., 2020. The effects
of cropping sequence, fertilization and straw management on the yield stability of winter wheat
(1986–2017) in the Broadbalk Wheat Experiment, Rothamsted, UK. J. Agric. Sci. 158, 65–79.
https://doi.org/10.1017/S0021859620000301
Mira, A.B., Cantarella, H., Souza-Netto, G.J.M., Moreira, L.A., Kamogawa, M.Y., Otto, R., 2017.
Optimizing urease inhibitor usage to reduce ammonia emission following urea application over
crop residues. Agric. Ecosyst. Environ. 248, 105–112. https://doi.org/10.1016/j.agee.2017.07.032
Mitchell, D.C., Castellano, M.J., Sawyer, J.E., Pantoja, J., 2013. Cover Crop Effects on Nitrous Oxide
Emissions: Role of Mineralizable Carbon. Soil Sci. Soc. Am. J. 77, 1765–1773.
https://doi.org/10.2136/sssaj2013.02.0074
Myhre, G.D., Shindell, F.M., Bréon, W., Collins, J., Fuglestvedt, J., Huang, D., Koch, J.F., Lamarque, D.,
Lee, B., Mendoza, T., Nakajima, A., Robock, G., Stephens, T., Takemura, H., Z., 2013.
Anthropogenic and Natural Radiative Forcing. Clim. Change 2013 Phys. Sci. Basis Contrib.
Work. Group Fifth Assess. Rep. Intergov. Panel Clim. Change.
Ni, K., Ding, W., Zaman, M., Cai, Z., Wang, Y., Zhang, X., Zhou, B., 2012. Nitrous oxide emissions from
a rainfed-cultivated black soil in Northeast China: effect of fertilization and maize crop. Biol.
Fertil. Soils 48, 973–979. https://doi.org/10.1007/s00374-012-0709-y
Parkin, T.B., Venterea, R.T., Hargreaves, S.K., 2012. Calculating the detection limits of chamber-based
soil greenhouse gas flux measurements. J. Environ. Qual. 41, 705.
Pfab, H., Palmer, I., Buegger, F., Fiedler, S., Müller, T., Ruser, R., 2012. Influence of a nitrification
inhibitor and of placed N-fertilization on N2O fluxes from a vegetable cropped loamy soil. Agric.
Ecosyst. Environ. 150, 91–101. https://doi.org/10.1016/j.agee.2012.01.001
Prather, M.J., Hsu, J., 2010. Coupling of nitrous oxide and methane by global atmospheric chemistry.
Science 330, 952–954. https://doi.org/10.1126/science.1196285
Qiao, C., Liu, L., Hu, S., Compton, J.E., Greaver, T.L., Li, Q., 2015. How inhibiting nitrification affects
nitrogen cycle and reduces environmental impacts of anthropogenic nitrogen input. Glob. Change
Biol. 21, 1249–1257. https://doi.org/10.1111/gcb.12802
Ravishankara, A.R., Daniel, J.S., Portmann, R.W., 2009. Nitrous oxide (N2O): the dominant ozone-
depleting substance emitted in the 21st century. Science 326, 123–125.
https://doi.org/10.1126/science.1176985
Römer, W., Hilmer, R., Claassen, N., Nöhren, N., Dittert, K., 2015. Einfluss einer langjährigen P-
Düngung auf Ertäge und Dynamik der CAL-P-Gehalte in einem Lösslehmboden. VDLUFA-
Schriftenreihe 71 71, 279–285.
Rose, T.J., Wood, R.H., Rose, M.T., Van Zwieten, L., 2018. A re-evaluation of the agronomic
effectiveness of the nitrification inhibitors DCD and DMPP and the urease inhibitor NBPT. Agric.
Ecosyst. Environ. 252, 69–73. https://doi.org/10.1016/j.agee.2017.10.008
Ruser, R., Fuß, R., Andres, M., Hegewald, H., Kesenheimer, K., Köbke, S., Räbiger, T., Quinones, T.S.,
Augustin, J., Christen, O., Dittert, K., Kage, H., Lewandowski, I., Prochnow, A., Stichnothe, H.,
Flessa, H., 2017. Nitrous oxide emissions from winter oilseed rape cultivation. Agric. Ecosyst.
Environ. 249, 57–69. https://doi.org/10.1016/j.agee.2017.07.039

50
Ruser, R., Schulz, R., 2015. The effect of nitrification inhibitors on the nitrous oxide (N2O) release from agricultural soils—a review. J. Plant Nutr. Soil Sci. 178, 171–188.
Scholefield, D., Hawkins, J.M.B., Jackson, S.M., 1997. Use of a flowing helium atmosphere incubation technique to measure the effects of denitrification controls applied to intact cores of a clay soil. Soil Biol. Biochem. 29, 1337–1344. https://doi.org/10.1016/S0038-0717(97)00059-X
Senbayram, M., Chen, R., Budai, A., Bakken, L., Dittert, K., 2012. N2O emission and the N2O/(N2O+N2) product ratio of denitrification as controlled by available carbon substrates and nitrate concentrations. Agric. Ecosyst. Environ. 147, 4–12.
Shi, X., Hu, H.-W., Kelly, K., Chen, D., He, J.-Z., Suter, H., 2017. Response of ammonia oxidizers and denitrifiers to repeated applications of a nitrification inhibitor and a urease inhibitor in two pasture soils. J. Soils Sediments 17, 974–984. https://doi.org/10.1007/s11368-016-1588-x
Shimizu, M., Hatano, R., Arita, T., Kouda, Y., Mori, A., Matsuura, S., Niimi, M., Jin, T., Desyatkin, A.R., Kawamura, O., Hojito, M., Miyata, A., 2013. The effect of fertilizer and manure application on CH4 and N2O emissions from managed grasslands in Japan. Soil Sci. Plant Nutr. 59, 69–86. https://doi.org/10.1080/00380768.2012.733926
Sieling, K., Christen, O., 2015. Crop rotation effects on yield of oilseed rape, wheat and barley and residual effects on the subsequent wheat. Arch. Agron. Soil Sci. 61, 1531–1549. https://doi.org/10.1080/03650340.2015.1017569
Sieling, K., Kage, H., 2010. Efficient N management using winter oilseed rape. A review. Agron. Sustain. Dev. 30, 271–279. https://doi.org/10.1051/agro/2009036
Silva, A.G.B., Sequeira, C.H., Sermarini, R.A., Otto, R., 2017. Urease Inhibitor NBPT on Ammonia Volatilization and Crop Productivity: A Meta-Analysis. Agron. J. 109, 1–13. https://doi.org/10.2134/agronj2016.04.0200
Tian, Z., Wang, J.J., Liu, S., Zhang, Z., Dodla, S.K., Myers, G., 2015. Application effects of coated urea and urease and nitrification inhibitors on ammonia and greenhouse gas emissions from a subtropical cotton field of the Mississippi delta region. Sci. Total Environ. 533, 329–338. https://doi.org/10.1016/j.scitotenv.2015.06.147
Wagner-Riddle, C., Congreves, K.A., Abalos, D., Berg, A.A., Brown, S.E., Ambadan, J.T., Gao, X., Tenuta, M., 2017. Globally important nitrous oxide emissions from croplands induced by freeze–thaw cycles. Nat. Geosci. 10, 279–283. https://doi.org/10.1038/ngeo2907
Walter, K., Don, A., Fuß, R., Kern, J., Drewer, J., Flessa, H., 2015. Direct nitrous oxide emissions from oilseed rape cropping – a meta-analysis. GCB Bioenergy 7, 1260–1271. https://doi.org/10.1111/gcbb.12223
Wang, H., Köbke, S., Dittert, K., 2020. Use of urease and nitrification inhibitors to reduce gaseous nitrogen emissions from fertilizers containing ammonium nitrate and urea. Glob. Ecol. Conserv. 22, e00933. https://doi.org/10.1016/j.gecco.2020.e00933
Wang, K., Zheng, X., Pihlatie, M., Vesala, T., Liu, C., Haapanala, S., Mammarella, I., Rannik, Ü., Liu, H., 2013. Comparison between static chamber and tunable diode laser-based eddy covariance techniques for measuring nitrous oxide fluxes from a cotton field. Agric. For. Meteorol. 171–172, 9–19.
Weiser, C., Fuss, R., Kage, H., Flessa, H., 2018. Do farmers in Germany exploit the potential yield and nitrogen benefits from preceding oilseed rape in winter wheat cultivation? Arch. Agron. Soil Sci. 64, 25–37. https://doi.org/10.1080/03650340.2017.1326031

51
WMO, 2018. WMO Greenhouse Gas Bulletin (GHG Bulletin) - No. 14 : The State of Greenhouse Gases in the Atmosphere Based on Global Observations through 2017. WMO.
Wu, D., Wei, Z., Well, R., Shan, J., Yan, X., Bol, R., Senbayram, M., 2018. Straw amendment with
nitrate-N decreased N2O/(N2O+N2) ratio but increased soil N2O emission: A case study of direct
soil-born N2 measurements. Soil Biol. Biochem. 127, 301–304.
https://doi.org/10.1016/j.soilbio.2018.10.002
Xu, C., Han, X., Ru, S., Cardenas, L., Rees, R.M., Wu, D., Wu, W., Meng, F., 2019. Crop straw
incorporation interacts with N fertilizer on N2O emissions in an intensively cropped farmland.
Geoderma 341, 129–137. https://doi.org/10.1016/j.geoderma.2019.01.014
Xu, J., Cai, H., Wang, Xiaoyun, Ma, C., Lu, Y., Ding, Y., Wang, Xiaowen, Chen, H., Wang, Y.,
Saddique, Q., 2020. Exploring optimal irrigation and nitrogen fertilization in a winter wheat-
summer maize rotation system for improving crop yield and reducing water and nitrogen leaching.
Agric. Water Manag. 228, 105904. https://doi.org/10.1016/j.agwat.2019.105904
Yan, Y., Ganjurjav, H., Hu, G., Liang, Y., Li, Y., He, S., Danjiu, L., Yang, J., Gao, Q., 2018. Nitrogen
deposition induced significant increase of N2O emissions in an dry alpine meadow on the central
Qinghai–Tibetan Plateau. Agric. Ecosyst. Environ. 265, 45–53.
https://doi.org/10.1016/j.agee.2018.05.031
Yao, Z., Yan, G., Zheng, X., Wang, R., Liu, C., Butterbach-Bahl, K., 2017. Straw return reduces yield-
scaled N2O plus NO emissions from annual winter wheat-based cropping systems in the North
China Plain. Sci. Total Environ. 590–591, 174–185.
https://doi.org/10.1016/j.scitotenv.2017.02.194
Zaman, M., Zaman, S., Nguyen, M.L., Smith, T.J., Nawaz, S., 2013. The effect of urease and nitrification
inhibitors on ammonia and nitrous oxide emissions from simulated urine patches in pastoral
system: A two-year study. Sci. Total Environ., Soil as a Source & Sink for Greenhouse Gases 465,
97–106. https://doi.org/10.1016/j.scitotenv.2013.01.014

52
Chapter 4: The potential of ryegrass as cover crop to reduce soil N2O emissions and
increase the population size of denitrifying bacteria
Haitao Wanga, Lukas Beuleb, Birgit Pfeifferc, Shutan Mad, e*, Petr Karlovskyb, Klaus Ditterta,
a Department of Crop Science, Section of Plant Nutrition and Crop Physiology, University of Goettingen,
Carl-Sprengel-Weg 1, 37075 Göttingen, Germany
b Molecular Phytopathology and Mycotoxin Research, Faculty of Agricultural Sciences, University of
Goettingen, 37077 Göttingen, Germany
c Institute of Microbiology and Genetics, Department of Genomic and Applied Microbiology,
Grisebachstr. 8, 37077 Göttingen, Germany
d State Key Laboratory of Soil and Sustainable Agriculture, Institute of Soil Science, Chinese Academy of
Science, Nanjing 210008, China
e University of Chinese Academy of Sciences, Beijing 100049, China
This manuscript was published in European Journal of Soil Science
Wang, H., Beule, L., Zang, H., Pfeiffer, B., Ma, S., Karlovsky, P., Dittert, K., 2020. The potential
of ryegrass as cover crop to reduce soil N2O emissions and increase the population size of
denitrifying bacteria. European Journal of Soil Science. https://doi.org/10.1111/ejss.13047

OR I G I N A L AR T I C L E
The potential of ryegrass as cover crop to reduce soil N2O
emissions and increase the population size of denitrifying
bacteria
Haitao Wang1 | Lukas Beule2 | Huadong Zang3 | Birgit Pfeiffer4 |
Shutan Ma1,5 | Petr Karlovsky2 | Klaus Dittert1
1Department of Crop Science, Division ofPlant Nutrition and Crop Physiology,University of Göttingen, Göttingen,Germany2Molecular Phytopathology andMycotoxin Research, Faculty ofAgricultural Sciences, University ofGöttingen, Göttingen, Germany3College of Agronomy and Biotechnology,China Agricultural University, Beijing,China4Institute of Microbiology and Genetics,Department of Genomic and AppliedMicrobiology, University of Göttingen,Göttingen, Germany5School of Ecology and Environment,Anhui Normal University, Wuhu, China
Correspondence
Shutan Ma, Department of Crop Science,Division of Plant Nutrition and CropPhysiology, University of Göttingen,Germany, School of Ecology andEnvironment, Anhui Normal University,Wuhu 241002, China.Email: [email protected]
Funding information
China Scholarship Council; The NationalScience Project for University of AnhuiProvince, Grant/Award Number: (No.KJ2019A0494)
Abstract
Nitrogen (N) fertilization is the major contributor to nitrous oxide (N2O)
emissions from agricultural soil, especially in post-harvest seasons. This study
was carried out to investigate whether ryegrass serving as cover crop affects
soil N2O emissions and denitrifier community size. A microcosm experiment
was conducted with soil planted with perennial ryegrass (Lolium perenne L.)
and bare soil, each with four levels of N fertilizer (0, 5, 10 and 20 g N m−2;
applied as calcium ammonium nitrate). The closed-chamber approach was
used to measure soil N2O fluxes. Real-time PCR was used to estimate the bio-
mass of bacteria and fungi and the abundance of genes involved in denitrifica-
tion in soil. The results showed that the presence of ryegrass decreased the
nitrate content in soil. Cumulative N2O emissions of soil with grass were lower
than in bare soil at 5 and 10 g N m−2. Fertilization levels did not affect the
abundance of soil bacteria and fungi. Soil with grass showed greater abun-
dances of bacteria and fungi, as well as microorganisms carrying narG, napA,
nirK, nirS and nosZ clade I genes. It is concluded that ryegrass serving as a
cover crop holds the potential to mitigate soil N2O emissions in soils with mod-
erate or high NO3− concentrations. This highlights the importance of cover
crops for the reduction of N2O emissions from soil, particularly following N
fertilization. Future research should explore the full potential of ryegrass to
reduce soil N2O emissions under field conditions as well as in different soils.
Highlights
1. This study was to investigate whether ryegrass serving as cover crop affects
soil N2O emissions and denitrifier community size;
2. Plant reduced soil N substrates on one side, but their root exudates stimu-
lated denitrification on the other side;
Received: 19 May 2020 Revised: 4 September 2020 Accepted: 7 September 2020
DOI: 10.1111/ejss.13047
This is an open access article under the terms of the Creative Commons Attribution License, which permits use, distribution and reproduction in any medium, provided
the original work is properly cited.
© 2020 The Authors. European Journal of Soil Science published by John Wiley & Sons Ltd on behalf of British Society of Soil Science.
Eur J Soil Sci. 2020;1–15. wileyonlinelibrary.com/journal/ejss 1

3. N2O emissions were lower in soil with grass than bare soil at medium fertil-
izer levels, and growing grass stimulated the proliferation of almost all the
denitrifying bacteria except nosZ clade II;
4. Ryegrass serving as a cover crop holds the potential to mitigate soil N2O
emissions.
KEYWORD S
denitrification, perennial ryegrass (Lolium perenne L.), soil bacteria, soil CO2 emissions, soil N2O
emissions
1 | INTRODUCTION
Increasing nitrous oxide (N2O) concentration in theatmosphere is among the most serious consequences ofthe anthropogenic alteration of the global nitrogen(N) cycle (Bakken & Frostegard, 2017). In addition to itshigh global warming potential and long atmospheric life-time (IPCC, 2013), N2O has been shown to be the mostimportant emitted compound involved in stratosphericozone depletion (Ravishankara, Daniel, & Portmann,2009). The intensive input of mineral N into agriculturalsoils is one of the crucial factors contributing to soil N2Oemissions (Ju et al., 2009; Song et al., 2018). Denitrifica-tion is the predominant N2O-producing biological processin soils (Bremner, 1997; Hu, Chen, & He, 2015), which isstrongly affected by the soil nitrate (NO3
−) concentration(Köbke, Senbayram, Pfeiffer, Nacke, & Dittert, 2018; Sag-gar et al., 2013). In the denitrification pathway, den-itrifying microorganisms use NO3
− as an electronacceptor and reduce it to gaseous N2 in a stepwise man-ner. Incomplete denitrification results in the emission ofgaseous intermediates such as N2O.
Soil denitrification is regulated by enzymes such asNO3
−, nitrite (NO2−) and N2O reductases that are pro-
duced by microorganisms. In arable soils, plant rootarchitecture and exudation alter soil structure, aerationand biological activity (Bertin, Yang, & Weston, 2003;Kuzyakov & Xu, 2013), as well as soil microbial commu-nities (Berg & Smalla, 2009). The majority of laboratorystudies of soil N2O emissions, however, have notincluded plants, although it is known that growing plantsmay increase denitrification activities in soil (Guyonnetet al., 2017; Klemedtsson, Svensson, & Rosswall, 1987).Recent studies investigated how plant and rhizosphereprocesses affect soil N2O emissions (Lenhart et al., 2019;Senbayram et al., 2020). On the one hand, plants competewith soil microorganisms for N (Moreau, Bardgett, Fin-lay, Jones, & Philippot, 2019), on the other hand, plantsprovide carbon (C) to the soil via root exudates that mod-ulate microbial communities and denitrification activity(Achouak et al., 2019). Apart from effects on the soil N
pool, plants consume O2 and increase soil CO2 concentra-tions through root respiration as compared to unplantedsoil. It has been estimated that 5% to 21% of all photosyn-thetically assimilated C is released into the soil in theform of root exudates (Derrien, Marol, & Balesdent, 2004;Nguyen, 2003). Consequently, the C turnover rate in thesoil rhizosphere is estimated to be at least one order ofmagnitude greater than in the bulk soil(Kuzyakov, 2010). It has been suggested that root exuda-tion will increase denitrification (Bijay-singh &Whitchead, 1988), as root-released C can serve as an elec-tron donor (Philippot, Hallin, & Schloter, 2007). Indeed,planted soils are several times greater in density of deni-trifiers than unplanted soils (Chèneby et al., 2004; Her-man, Johnson, Jaeger, Schwartz, & Firestone, 2006).Growing perennial grasses, such as Festuca paniculata,Bromus erectus and Dactylis glomerata (Guyonnetet al., 2017), barley (Hordeum vulgare L.) (Klemedtssonet al., 1987) and maize (Zea mays L.) (Mahmood, Ali,Malik, & Shamsi, 1997) has been shown to increase deni-trification activities in soil. The stimulation of soil denitri-fication activity by plants depends on the plant speciesand soil water content (Bakken, 1988). Furthermore, rootexudates have been shown to modulate soil microbialcommunities (Haichar et al., 2008; Haichar, Santaella,Heulin, & Achouak, 2014).
However, increased denitrification activity does notnecessarily mean higher N2O emissions from soil.Ammonium (NH4
+) and NO3− have different motilities
in soil due to the charge-dependent interaction with soilcolloids. As a consequence, a depletion zone of NH4
+ inthe rhizosphere can be created by plant root uptake ofNH4
+ as it shows low mobility in most temperate soils(Orcutt, 2000). In contrast, no such depletion zones inthe rhizosphere can be expected for NO3
− due its highmobility in most temperate soils (Kuzyakov & Xu, 2013).The concentration of NO3
− in soil, however, can rapidlydecrease owing to uptake by plant roots (Tinker &Nye, 2000). Therefore, the availability of mineral N in soilis regarded as a major factor limiting denitrification(Philippot et al., 2007; Saggar et al., 2013). The response
2 WANG ET AL.

of soil N2O emissions to the application of mineral N fer-tilizer is exponential rather than linear (Shcherbak, Mil-lar, & Robertson, 2014). Senbayram, Chen, Budai,Bakken, & Dittert (2012) reported that increasing the soilNO3
− concentration resulted in a higher N2O/N2 ratio.The competition for NO3
− between plants and denitrifierscan result in lower denitrification rates in planted soils(Qian, Doran, & Walters, 1997). Similarly, regulation ofdenitrifying soil communities by NO3
− has been reportedfrom different ecosystems (Correa-Galeote et al., 2017;Deiglmayr, Philippot, & Kandeler, 2006; Enwall, Phi-lippot, & Hallin, 2005); however, the effect of the soilNO3
− concentration on the abundance and diversity ofdenitrifiers remains to be determined.
Ryegrass is a common cover crop that is used toreduce nitrate leaching (Bergström & Jokela, 2001;Poeplau, Aronsson, Myrbeck, & Kätterer, 2015; Tho-msen & Hansen, 2014) and increase soil organic C stocks(Poeplau et al., 2015). The effect of ryegrass on soil N2Oemissions, however, is under-studied. A recent meta-analysis revealed that cover crops have the potential tomitigate N2O emissions in post-harvest seasons, yet fewstudies focused on ryegrass (Muhammad et al., 2019).The main aim of this study was therefore to investigateN2O emissions from soil with ryegrass compared to baresoil under varying fertilizer levels. To achieve this, weused an incubation experiment with two experimentalfactors: soil planted with grass and unplanted bare soil,each with four levels of N fertilizer addition. Soil N2Ofluxes were determined using the closed-chamberapproach. Real-time PCR (qPCR) assays were performedto estimate the abundance of soil bacteria and fungi, aswell as microorganisms harbouring genes involved indenitrification. We hypothesized that the presence ofgrass and the associated belowground modulations would(i) lower soil N2O emissions at each fertilizer level and(ii) promote the abundance of bacteria, fungi and denitri-fiers, as compared to bare soil.
2 | MATERIAL AND METHODS
2.1 | Soil collection
Topsoil (0 to 25 cm) was collected from Reinshof agricul-tural research station (51�29050.3”N, 9�55059.900E), Uni-versity of Göttingen, Lower Saxony, Germany. Meanannual precipitation was 651 ± 24 mm and mean annualtemperature was 9.2 ± 0.1�C (1981–2010, meteorologicalstation at Göttingen, station ID: 1691, Germany's Meteo-rological Service). The site had been cropped with winteroilseed rape (Brassica napus L.) (2015), winter wheat(Triticum aestivum L.) (2016) and winter barley (2017)
prior to soil collection on March 23, 2018. The soil wasclassified as Luvisol (IUSS, 2015) and the texture of thetopsoil (0 to 25 cm) was composed of 61% silt, 23% sandand 16% clay. The bulk density was 1.3 g cm−3, the pHwas 7.1 ± 0.1, the soil total C concentration was 1.3% andthe total N concentration was 0.13%. Following collec-tion, the soil was stored in a polyvinyl chloride (PVC)container for 3 months at room temperature until incuba-tion. Before incubation, the soil was air-dried to 2% gravi-metric water content and sieved through a 2-mm mesh toachieve higher homogeneity. PVC cylinders (diameter,20 cm; height, 20 cm) were used for incubation andsealed with removable lids (height, 5 cm) carrying butyl-rubber septa for headspace gas sampling. Soil moisturewas first adjusted to 35% water-filled pore space (WFPS)and soil (equivalent to 4.49 kg dry soil) was filled into theexperimental pots in three layers of approximately 3.7 cmeach (11 cm in total) for manual compaction to the origi-nal bulk density of 1.3 g cm−3, resulting in 4,398 cm3 ofair space (9 cm headspace + 5 cm lid) for gas accumula-tion when the chambers were closed. The following day,the soil was carefully irrigated in a stepwise procedure toavoid soil compaction and finally adjusted to 60% WFPS.
2.2 | Experimental setup
The experiment was conducted in a fully controlled cli-mate chamber (Fitotron Walk in Plant Growth Room,Type SGR221 LED, Weiss Technik, Leicester, UK). Theclimate chamber was set to a light intensity of520 μmol m−2 s−1 photosynthetically active photon fluxdensity at 25�C air temperature from 6.00 am to 10.00 pmas “day mode” (16 hr), and from 10.30 pm to 6.00 am(8 hr) as “night mode” with no light at 12�C air tempera-ture. The relatively large temperature discrepancy was setin order to mimic conditions close to those in the field.
The experiment consisted of two groups: soil withperennial ryegrass (Lolium perenne L.) (DSV AG,Salzkotten, Germany) and bare soil. Each group had fourdifferent fertilizer levels (0, 5, 10 and 20 g N m−2, equiva-lent to 0, 50, 100 and 200 kg N ha−1), resulting in a total ofeight treatments. Each treatment was performed in tripli-cate, yielding a total of 24 pots. Before the first samplingdate, grass was sown at a density of approximately 5,000seeds m−2 and pre-incubated for 4 weeks to allow grassestablishment in the pots. The treatments with bare soilwere treated equally but without plant cultivation. Cal-cium ammonium nitrate N fertilizer (76% ammoniumnitrate (NH4NO3) and 24% calcium carbonate (CaCO3))was applied after dissolution in distilled water. Half of thetotal N fertilizer was applied after the first collection of soiland gas samples on day 1 (August 3, 2018); the other half
WANG ET AL. 3
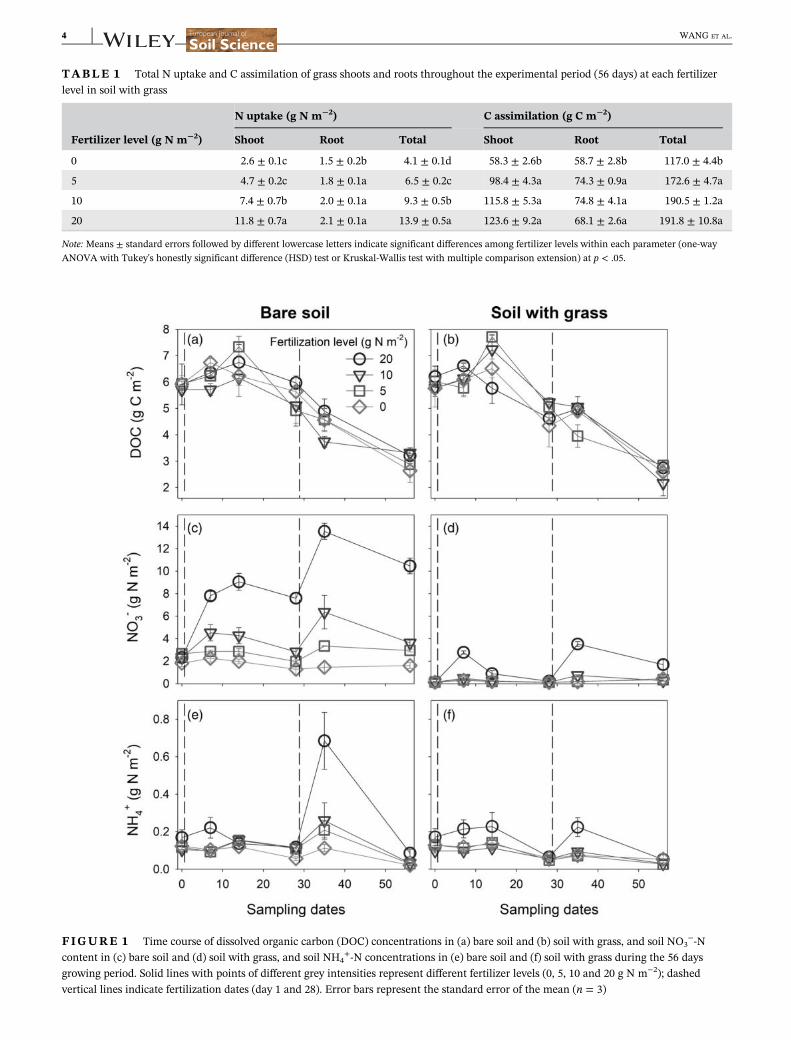
TABLE 1 Total N uptake and C assimilation of grass shoots and roots throughout the experimental period (56 days) at each fertilizerlevel in soil with grass
Fertilizer level (g N m−2)
N uptake (g N m−2) C assimilation (g C m−2)
Shoot Root Total Shoot Root Total
0 2.6 ± 0.1c 1.5 ± 0.2b 4.1 ± 0.1d 58.3 ± 2.6b 58.7 ± 2.8b 117.0 ± 4.4b
5 4.7 ± 0.2c 1.8 ± 0.1a 6.5 ± 0.2c 98.4 ± 4.3a 74.3 ± 0.9a 172.6 ± 4.7a
10 7.4 ± 0.7b 2.0 ± 0.1a 9.3 ± 0.5b 115.8 ± 5.3a 74.8 ± 4.1a 190.5 ± 1.2a
20 11.8 ± 0.7a 2.1 ± 0.1a 13.9 ± 0.5a 123.6 ± 9.2a 68.1 ± 2.6a 191.8 ± 10.8a
Note: Means ± standard errors followed by different lowercase letters indicate significant differences among fertilizer levels within each parameter (one-wayANOVA with Tukey's honestly significant difference (HSD) test or Kruskal-Wallis test with multiple comparison extension) at p < .05.
FIGURE 1 Time course of dissolved organic carbon (DOC) concentrations in (a) bare soil and (b) soil with grass, and soil NO3−-N
content in (c) bare soil and (d) soil with grass, and soil NH4+-N concentrations in (e) bare soil and (f) soil with grass during the 56 days
growing period. Solid lines with points of different grey intensities represent different fertilizer levels (0, 5, 10 and 20 g N m−2); dashedvertical lines indicate fertilization dates (day 1 and 28). Error bars represent the standard error of the mean (n = 3)
4 WANG ET AL.

was applied after 28 days, with a full measuring period of56 days. After fertilization, soil was irrigated daily, and upto every 2 days in the later period by weighing the pots, tokeep the soil moisture at 60 ± 5% WFPS.
Two days before the first fertilization, the grass wascut to a height of 4 cm. Following this, the grass was cutevery 2 weeks and the shoot dry matter was determinedfrom air-dried material. At the end of the experiment, theroots were collected as well. Roots were carefully washed,air-dried and weighed. The total C and N of finely grounddry grass shoots and roots were determined on a NA-1500 N elemental analyzer (Carlo Erba, Milano, Italy).Grass N uptake and C assimilation were calculated as:
Nuptake = DMshoot × Nconcentrationshoot + DMroot
× N concentrationroot;ð1Þ
and
Cassimilation = DMshoot × Cconcentrationshoot
+ DMroot × C concentrationroot;ð2Þ
where DM refers to the dry matter of the harvested grass.Apparent N recovery (ARN) was calculated as:
ARN %ð Þ=Nuptake fertilizedð Þ-Nuptake unfertilizedð Þ
amount of N applied× 100:
ð3Þ
Gas samples of 25 mL in volume were collected usinga syringe inserted in the headspace of sealed lids. Sam-ples were directly transferred to a pre-evacuated 12-mLExetainer vial (Labco, Lampeter, UK). Gas samples werecollected at 0, 20 and 40 min after the pots were sealed.In the first week after each fertilization, gas samples werecollected every day to capture the fertilization-inducedpeaks. In the following 3 weeks, gas samples were takenat larger intervals of 2 to 4 days.
In order to avoid the disturbance of soil structure bysoil sampling during the incubation period, we incubateda spare set of pots in parallel to the gas sampling pots forsoil sample collection. The setup of these pots was identi-cal to that for pots for gas sampling. Soil samples weretaken on day 0 (1 day before the first fertilization), day
FIGURE 2 CO2 emission dynamics and cumulative CO2 emission during the growing period (56 days) from bare soil (a) and soil with grass(b). Error bars represent the standard error of the mean of each treatment (n = 3). Solid lines with points of different grey intensities representdifferent fertilizer levels (0, 5, 10 and 20 g N m−2). Dashed vertical lines indicate fertilization dates (day 1 and day 28). Asterisks indicate significantdifferences in cumulative CO2 emission between bare soil and soil with grass at the same fertilizer level (t-test or Mann–Whitney U-test);lowercase letters indicate significant differences in cumulative CO2 emission among fertilizer levels within bare soil or within soil with grass (one-way ANOVA with Tukey's honestly significant difference (HSD) test or Kruskal-Wallis test with multiple comparison extension) at p < .05
WANG ET AL. 5

7, day 14, day 28 (before the second fertilization), day35 and day 56 (final collection of samples). On day 0, day7 and day 14, soil samples were collected from the firstspare pot; on day 35 and day 56, they were collected fromthe second spare pot. The last soil samples were takenfrom the pots on which gas measurements were per-formed. The soil samples (0–11 cm depth) were takenusing a 16-mm diameter auger. Remaining holes werefilled with reagent glasses (16 mm diameter) to avoid extrawater and nutrient losses. Approximately 60 g of fresh soilwas taken and sieved through a 2-mm mesh. Soil sampleswere homogenized and divided for soil NH4
+ and NO3−,
and dissolved organic carbon (DOC) analysis. Soil pH,total C and N, and WFPS did not differ among treatments.From the last set of soil samples, aliquots were used forsoil DNA extraction and subsequent qPCR analysis.
2.3 | Gas and soil sample analysis
Gas samples were analysed on an Agilent 7890A gaschromatograph (Agilent Technologies, Santa Clara, CA,USA) equipped with a thermal conductivity detector for
the determination of carbon dioxide (CO2) concentrationsand an electron capture detector for the determination ofN2O concentrations. The flux rates of CO2 and N2O werecalculated using linear regression of the gas concentra-tion over time (Parkin, Venterea, & Hargreaves, 2012;Wang et al., 2013). Cumulative emissions were calculatedby interpolating the values of CO2 and N2O emissions.
To determine soil NH4+ and NO3
− concentrations,subsamples (10 g) of sieved fresh soil were extractedby adding 50 mL of 0.0125 M calcium chloride (CaCl2).Mixtures were shaken for 1 hr, filtered (MN615 1/4;pore size, 4–12 μm; Macherey-Nagel, Düren, Germany)and subsequently stored at −20�C until analysis. NH4
+
and NO3− concentrations in the extracts were deter-
mined using a San++ continuous flow analyzer (SkalarAnalytical, Breda, The Netherlands). Soil pH was mea-sured from 10 g of air-dried soil suspended in 50 mLof 0.01 M CaCl2 solution using a pH meter. Total Cand N measurements were performed with finely gro-und air-dried soil using an NA-1500 elemental ana-lyzer (Carlo Erba, Milano, Italy). Prior to themeasurement of total C and N, the air-dried soil wasfumigated in a hydrogen chloride (HCl) atmosphere
FIGURE 3 N2O emission dynamics and cumulative N2O emission during the growing period (56 days) from bare soil (a) and soil with grass(b). Error bars represent the standard error of the mean of each treatment (n = 3). Solid lines with points of different grey intensities representdifferent fertilizer levels (0, 5, 10 and 20 g N m−2). Dashed vertical lines indicate fertilization dates (day 1 and day 28). Asterisks indicatesignificant differences in cumulative N2O emission between bare soil and soil with grass at the same fertilizer level (t-test or Mann–Whitney U-test); lowercase letters indicate significant difference in cumulative N2O emissions among fertilizer levels within bare soil or within soil with grass(one-way ANOVA with Tukey's honestly significant difference (HSD) test or Kruskal-Wallis test with multiple comparison extension) at p < .05
6 WANG ET AL.

using 3 M HCl for 1 week to remove carbonates(Harris, Horwath, & Kessel, 2001). For DOC measure-ments, 10 g of fresh soil was extracted using 40 mL of0.5 M potassium sulphate (K2SO4). The solution wasshaken for 2 hr and filtered (MN615 1/4; pore size,4–12 μm; Macherey-Nagel, Düren, Germany). Extractswere stored at −20�C until determination of organic Cand total C concentrations using a Total organic car-bon/Total inorganic carbon (TOC/TIC) analyser (MultiC/N 2100, Analytik Jena, Jena, Germany).
2.4 | DNA extraction from soil and qPCR
For qPCR analysis, soil was freeze-dried for 72 hr. Thefreeze-dried material was finely ground using a swing mill(MM400, Retsch, Haan, Germany) for 60 s at 25 Hz. TotalDNA was extract from 50 mg ground soil using a modifiedcetyltrimethylammonium bromide-based protocol(Brandfass & Karlovsky, 2008) as described previously (Beuleet al., 2019). Following DNA extraction, the quality andquantity of DNA were examined on 0.8% (w/v) agarose gelsstained with ethidium bromide. The extracts were tested forPCR inhibitors as described previously (Guerra, Beule,Lehtsaar, Liao, & Karlovsky, 2020) and diluted 1:50 (v/v) indouble-distilled water (ddH2O) prior to qPCR analysis. Wequantified bacterial 16S rRNA and fungal 18S rRNA genes,as well as genes involved in denitrification, namely narG andnapA for NO3
− reduction, nirK and nirS for NO2− reduction,
and nosZ clade I and II for N2O reduction. All reactions werecarried out in 4 μL reaction volume (3 μL mastermix +1 μLtemplate DNA or ddH2O for negative controls) on a CFX384Thermocycler (Biorad, Rüdigheim, Germany). A detaileddescription of the mastermix composition and thermocyclingconditions can be found in Beule et al. (2019).
2.5 | Statistical analysis
All data were tested for homogeneity of variance(Levene's test) and normal distribution (Shapiro–Wilktest). Differences among treatments of cumulative data(N uptake and C assimilation by grass and cumulativeCO2 and N2O emissions) or data without repeated mea-surements (soil bacteria, fungi and denitrifiers) wereassessed by performing a t-test or one-way ANOVA withTukey's honestly significant difference (HSD) post-hoc testfor parametric data, or the Mann–Whitney U-test orKruskal–Wallis test with multiple comparison extension fornon-parametric data. Differences among treatments ofrepeatedly measured data (DOC, NO3
−, NH4+, CO2 and
N2O fluxes) were analysed using linear mixed effect (LME)models. In the models, either the fertilizer level or the
treatment of bare soil versus soil with grass were set as afixed effect, and sampling date and replicate pot set as ran-dom effects. The data were partially log10- or square-root-transformed to meet the criteria for an LME model. Statisti-cal significance was considered as p < .05, with marginalstatistical significance at p < .1. All statistical analyses wereperformed in R version 3.5.2 (R Core Team, 2018).
3 | RESULTS
3.1 | Grass N uptake and C assimilation
In soil with grass, total plant N uptake, which was calcu-lated by the dry matter of grass shoots and roots, rangedfrom 6.5 to 13.9 g N m−2 in fertilized pots, compared to4.1 g N m−2 in the unfertilized treatment. The ARNs offertilized treatments were 50% ± 2%. Plant shoot Nuptake at the 10 g N m−2 fertilizer level was lower than
FIGURE 4 Bacterial 16 s rRNA (a) and fungal 18 s rRNA(b) gene copy number per g dry soil in bare soil and soil with grassunder different fertilizer levels (0, 5, 10 and 20 g N m−2) at the endof the growing period (day 56). Error bars represent standard errorof the mean of each treatment (n = 3); asterisks denote differencesbetween bare soil and soil with grass (* p < .05); daggers representmarginal differences between bare soil and soil with grass († p < .1)
WANG ET AL. 7

that at 20 g N m−2 (p = 0.006) and greater than those at0 and 5 g N m−2 (p < .01) (Table 1). Plant root N uptakein unfertilized treatments was lower than in the treat-ments in which 5, 10 and 20 g N m−2 were added(p < .04) (Table 1). The total N uptake throughout theincubation period (56 days) increased along with increas-ing fertilizer application (p < .03) (Table 1). Shoot C, rootC and total C assimilation were greater in fertilized thanunfertilized pots (p < .04) (Table 1), but did not differamong the 5, 10 and 20 g N m−2 fertilization treatments.
3.2 | Soil DOC, NO3− and NH4
+ dynamicsduring incubation
Dissolved organic carbon was slightly increased in thefirst 2 weeks, and gradually decreased in the followingweeks in both bare soil and soil with grass (Figure 1a,b). DOC concentrations did not differ among bare soiland soil with grass, nor among fertilizer levels(Figure 1a,b). Soil NO3
−-N content in bare soil wasalways greater than in soil with grass at all fertilizerlevels (p ≤ .001) (Figure 1c,d). Fertilization led toincreased NO3
−-N concentrations in bare soil as com-pared to unfertilized treatments (p ≤ .05) (Figure 1c).Compared to the background NO3
− (approximately 2 gof NO3
−-N m−2) in unfertilized bare soil, soil NO3−-N
was close to zero in the unfertilized treatment of soilwith grass (Figure 1d). Furthermore, in soil with grass,at the 20 g N m−2 fertilizer level, soil NO3
−-N wasgreater than at all other fertilizer levels (p ≤ .05)(Figure 1d). When N fertilizer was applied, NH4
+-Nwas marginally greater in bare soil than in soil withgrass (p < .1) (Figure 1e,f).
3.3 | CO2 and N2O emissions
The presence of grass strongly enhanced CO2 emissionscompared to bare soil, especially in treatments with fertil-izer (p ≤ .003) (Figure 2). Fertilization had no effect onCO2 emissions (neither on short-term rates nor on cumu-lative fluxes) in bare soil (Figure 2a). In soil with grass,however, CO2 emission rates and cumulative fluxes wereincreased by fertilizer application (p ≤ .001) (Figure 2b).
In contrast to CO2 fluxes, N2O emissions from baresoil were greater than from soil with grass at each fertil-izer level (p < .05) (Figure 3). At the 5 and 10 g N m−2
fertilizer levels, bare soil showed greater cumulative N2Oemissions than soil with grass (p < .05). Cumulative N2Oemissions from soil with grass at the 0, 5 and 10 g N m−2
fertilizer levels were lower than at 20 g N m−2 (p < .05)(Figure 3b).
3.4 | Soil microbial gene abundances inbare soil and soil with grass
At the end of the experiment (day 56), the abundances ofbacteria, fungi and denitrification genes in soil werequantified. The fertilization rate did not affect the abun-dances of bacteria, fungi and denitrification genes(Figure 4, Figure 5). At the 0 and 20 g N m−2 fertilizerlevels, the soil with grass showed marginally greater bac-terial 16S rRNA gene copy numbers than bare soil(p < .08) (Figure 4a). Similarly, the number of fungal 18SrRNA gene copies did not differ among fertilizer levels,but were greater in soil with grass than bare soil at the0, 10 and 20 g N m−2 fertilizer levels (p < .05)(Figure 4b). The abundance of narG was greater in thesoil with grass than bare soil at the fertilizer level of20 g N m−2 (p < .005) (Figure 5a). At the 0 and 5 g N m−2
fertilizer levels, gene copy numbers of napA in soil withgrass were greater than in bare soil (p < .06) (Figure 5b).At each fertilizer level, nirK gene copy numbers weregreater in soil with grass than in bare soil (p < .09)(Figure 5c). The abundance of nirS was increased in soilwith grass compared to bare soil when 5, 10 or20 g N m−2 of fertilizer was applied (p < .1) (Figure 5d).At the fertilization rate of 20 g N m−2, nosZ clade I genecopies were marginally greater in soil with grass than inbare soil (p < .07) (Figure 5e). No differences betweensoil with grass and bare soil at any fertilizer level weredetected for nosZ clade II genes (Figure 5f).
4 | DISCUSSION
4.1 | Soil organic C turnover and CO2
emissions
The soil microbial community is the main driver of soilrespiration and organic C mineralization in bare soils(Li et al., 2018; Liu et al., 2018). The slight increase inDOC in the first 2 weeks may have been due to therewetting of the dry soil to 60% WFPS (Kalbitz, Solinger,Park, Michalzik, & Matzner, 2000). For example, whenLundquist, Jackson, & Scow (1999) exposed soil to wet–dry cycles, soil aggregates were partly decomposed andtheir C was found in the DOC fraction. In the first3 weeks of the experiment, soil CO2 emissions increasedgradually in bare soils, indicating a recovery of the micro-bial respiration from the rewetted air-dried soil(Figure 2a). As the soil was already pre-incubated for4 weeks before the application of fertilizer, this may beseen as an indication that the recovery of the soil micro-bial activity in the bare soil may take approximately7 weeks under the given conditions. One reason for this
8 WANG ET AL.
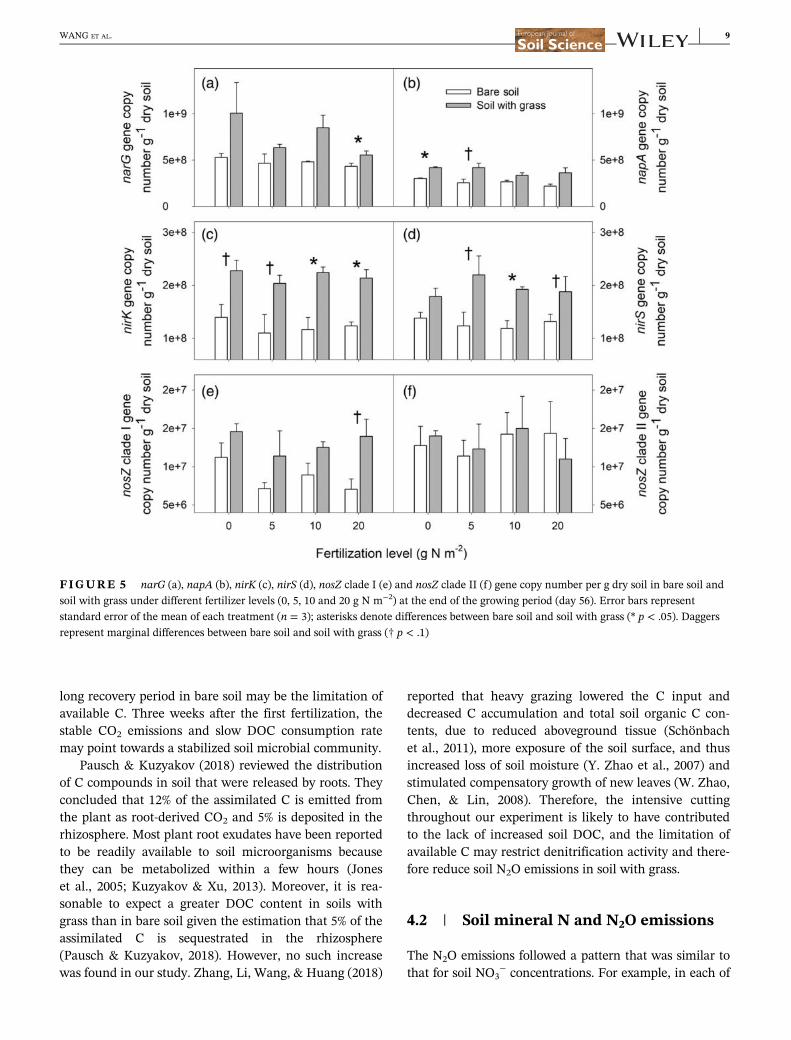
long recovery period in bare soil may be the limitation ofavailable C. Three weeks after the first fertilization, thestable CO2 emissions and slow DOC consumption ratemay point towards a stabilized soil microbial community.
Pausch & Kuzyakov (2018) reviewed the distributionof C compounds in soil that were released by roots. Theyconcluded that 12% of the assimilated C is emitted fromthe plant as root-derived CO2 and 5% is deposited in therhizosphere. Most plant root exudates have been reportedto be readily available to soil microorganisms becausethey can be metabolized within a few hours (Joneset al., 2005; Kuzyakov & Xu, 2013). Moreover, it is rea-sonable to expect a greater DOC content in soils withgrass than in bare soil given the estimation that 5% of theassimilated C is sequestrated in the rhizosphere(Pausch & Kuzyakov, 2018). However, no such increasewas found in our study. Zhang, Li, Wang, & Huang (2018)
reported that heavy grazing lowered the C input anddecreased C accumulation and total soil organic C con-tents, due to reduced aboveground tissue (Schönbachet al., 2011), more exposure of the soil surface, and thusincreased loss of soil moisture (Y. Zhao et al., 2007) andstimulated compensatory growth of new leaves (W. Zhao,Chen, & Lin, 2008). Therefore, the intensive cuttingthroughout our experiment is likely to have contributedto the lack of increased soil DOC, and the limitation ofavailable C may restrict denitrification activity and there-fore reduce soil N2O emissions in soil with grass.
4.2 | Soil mineral N and N2O emissions
The N2O emissions followed a pattern that was similar tothat for soil NO3
− concentrations. For example, in each of
FIGURE 5 narG (a), napA (b), nirK (c), nirS (d), nosZ clade I (e) and nosZ clade II (f) gene copy number per g dry soil in bare soil andsoil with grass under different fertilizer levels (0, 5, 10 and 20 g N m−2) at the end of the growing period (day 56). Error bars representstandard error of the mean of each treatment (n = 3); asterisks denote differences between bare soil and soil with grass (* p < .05). Daggersrepresent marginal differences between bare soil and soil with grass († p < .1)
WANG ET AL. 9
the eight treatments, the second N2O emissions peak,which followed the second fertilizer application, wasgreater than the first peak (Figure 3a,b). Additionally, incontrast to soil with grass, bare soil treatments showedconsiderably greater N2O emissions, which lasted over theentire study period. In soil with grass, N2O emissions fellto nearly zero 2 weeks after each fertilizer application,which was associated with exploited soil NO3
−. The rela-tionships between soil NO3
− and N2O emissions indicatethat, under these conditions, soil NO3
− is the predominantfactor controlling soil N2O emissions (Dong et al., 2018; Jiet al., 2018; Zhou, Zhu, Wang, & Wang, 2017).
At 60% WFPS, both nitrification and denitrificationare expected to be important contributors to soil N2Oemissions, as this moisture level is seen as the thresholdbetween aerobic and anaerobic conditions (Köbkeet al., 2018; Menéndez, Barrena, Setien, González-Murua, & Estavillo, 2012; Volpi, Laville, Bonari, o diNasso, & Bosco, 2017). One week post the first fertiliza-tion, only 0.2 g N NH4
+ was found and 7.9 g N NO3−
were detected in the fertilized bare soil treatment at20 g N m−2 (Figure 1c,e). Because the fertilizer was cal-cium ammonium nitrate at a ratio of NH4
+ and NO3− N
of 1:1, we assume that the vast majority of NH4+ was
converted to NO3− through nitrification. Additionally, we
assume that a certain proportion of the added NH4+ was
released as N2O during nitrification (Bremner, 1997).After 1 week, nitrification was unlikely to happenbecause the amount of NH4
+ (0.2 g N) was low. Althoughnitrification was not investigated in this study, our obser-vations agree with other incubation studies that morethan 50% of the NH4
+ is converted to NO3− within the
first week after fertilizer application (Senbayram, Chen,Mühling, & Dittert, 2009; Wu et al., 2017). We anticipatethat, in the first week after fertilization, both pathways(nitrification and denitrification) contributed to theobserved N2O emissions. In the following weeks, denitri-fication is likely to have become the predominant processcontributing to N2O emissions owing to NH4
+ removal(Figure 1e,f) and lowered oxygen partial pressure inducedby root O2 consumption (Klemedtsson et al., 1987).
Due to root activity, two opposing effects on denitrifi-cation are likely to have occurred: (i) O2 consumption byaerobic root activity (root respiration consuming O2)(Kuzyakov & Razavi, 2019); and (ii) plant transpiration,leading to drainage of coarse soil pores and thusincreased air-filled pore space, which will result inincreased oxygen availability. In our study, althoughwater content was adjusted every 1–2 days, soil withgrass had about 5% lower WFPS than bare soil prior toirrigation. The loss of water was due to plant transpira-tion. Therefore, lower soil moisture due to plant transpi-ration may increase oxygen diffusion into the soil and
thereby suppress denitrification (Menéndez et al., 2012;Volpi et al., 2017). Several previous studies reported thatthe presence of plants would increase denitrification(Guyonnet et al., 2017; Klemedtsson et al., 1987;Mahmood et al., 1997). However, our study was not aperfect proof of the opposite, but at least it provides evi-dence that the earlier reported promotion of denitrifica-tion does not always happen; at least, plants do notalways induce higher N2O emissions.
4.3 | Influence of the presence of plantson soil microbial abundances
The population size and diversity of microbial communi-ties have repeatedly been shown to increase in the pres-ence of plants (Guyonnet et al., 2018; Haicharet al., 2008; Li et al., 2018). In line with this, our resultsshowed that population densities of both soil bacteriaand fungi increased with the presence of ryegrass. Con-sidering C-limited conditions in unplanted soil, weassume that root-derived input of easily available C pro-moted these microbial populations.
Plant root exudates are known to modulate bothmicrobial biomass and community composition (Benizri,Nguyen, Piutti, Slezack-Deschaumes, & Philippot, 2007;Henry et al., 2008; Langarica-Fuentes, Manrubia, Giles,Mitchell, & Daniell, 2018; Zhalnina et al., 2018). How-ever, a limited number of studies have explored howplants influence genes involved in denitrification (Henryet al., 2008; Pivato et al., 2017). We found that, with theexception of nosZ clade II, all denitrification genes werepromoted in the presence of ryegrass, which may be dueto the root exudation of easily available C. Graf (2015)proposed a greater affinity of nosZ clade I-carrying micro-organisms to root exudates than for those carrying nosZ
clade II. Our findings agree with the suggestions ofGraf (2015): there was a trend showing that nosZ clade Igenes were greater in soil with grass, whereas nosZ cladeII showed no preference for bare versus planted soil.
4.4 | Relationship of reduced N2Oemissions and increased denitrifying geneabundances in soil with grass
In our study, N2O emissions were reduced even thoughdenitrification genes increased under grass. Recovery ofN by crops is usually somewhat less than 50% (Fageria &Baligar, 2005). In our study, the high N recovery rate ofryegrass (�50% ARN) indicates that the incubation con-ditions (60% WFPS, 25�C day temperature and 12�Cnight temperature) were favourable for plant growth. The
10 WANG ET AL.

ARN agrees well with the emission factors of bare soiland soil with ryegrass, which were 1.4%–1.8% and 0.5%–0.8%, respectively. Our results indicate that for soil N2Oproduction, the availability of mineral N was a moreimportant factor than the population size of denitrifiers.It should be mentioned that, due to the limitation of theexperimental design, soil samples and gas samples werenot taken from the same pots, and N2O emissions werehighly variable. Therefore, it was not possible to correlateN2O emissions and NO3
− concentrations in this study.In soil with grass at the 20 g N m−2 fertilizer level, soil
NO3− concentrations were not depleted by plant uptake
and, concurrently, cumulative N2O emissions at this levelwere more than twice as high as those at the 10 g N m−2
fertilizer level, suggesting that an N input that exceedsthe plant's needs can exponentially increase soil N2Oemissions. Previous field studies have shown congruentresults (Groenigen, Velthof, Oenema, Groenigen, &Kessel, 2010; Philibert, Loyce, & Makowski, 2012;Shcherbak et al., 2014). The much lower cumulative N2Oemission levels in soil with grass, as compared to baresoil, at the 5 and 10 g N m−2 fertilizer levels, were mostlikely to be due to plant uptake of soil mineral N.
It was recently suggested that soil NO3− availability
affects denitrifying communities (Deiglmayr et al., 2006;Saggar et al., 2013; Tang et al., 2016). However, our datarevealed no link between fertilizer level and denitrifica-tion genes. The reason may be the limitation of availableC in both bare soil and planted soil. In planted soil, inten-sive cutting may have limited C input from root exudatesinto the soil. It should be noted, however, that this obser-vation requires further study, because denitrifiers wereonly quantified at the end of our experiment. Therefore,potential changes in microbial communities during thecourse of our experiment may have remained undetected.Our study aimed to explore the potential of ryegrass toreduce soil N2O emissions under laboratory conditions.We considered the homogenization of the soil as impor-tant for a comparable starting point for the developmentof the soil microbial community. Our incubation studyused sieved soil, which altered the soil structure and islikely to have affected the microbial community as com-pared to the field conditions. The incubation temperatureused in the present study was higher than that expectedunder field conditions, which may have caused greaterammonia (NH3) volatilization (Bremner, 2007; Forrestalet al., 2016) and higher nitrification and denitrificationrates (Bremner, 1997; Saggar et al., 2013). Furthermore,NO3
− loss by leaching was absent in our study becausethe incubation pots were not drained. These methodolog-ical drawbacks may have led to an overestimation of soilN2O emissions in our study as compared to field
conditions. Follow-up field studies should be carried outto explore the full potential of ryegrass under field condi-tions and in different soils.
5 | CONCLUSION
Our incubation experiment compared N2O emissions andpopulation sizes of denitrifying bacteria in soil plantedwith ryegrass and in bare soil under different N fertilizerlevels. We found that 50% of fertilized N was recovered inplant tissues and emissions of N2O were lower in soilwith grass than in bare soil, although the proliferation ofdenitrifying bacteria in soil with grass was stimulated.We infer that soil mineral N is more related to N2O emis-sions than soil denitrifying genes. However, because ofthe higher potential of denitrification in soil with grass,the risk of high N2O emissions should also be noted,especially when N fertilizer exceeds the requirements ofplants. Altogether, we conclude that ryegrass serving as acover crop holds the potential to mitigate soil N2O emis-sions in soils with moderate or high NO3
− concentra-tions. Future studies should focus on how different plantspecies and their root exudates affect soil N2O emissionsand related soil microorganisms under field conditionsand in different soils.
ACKNOWLEDGEMENTS
This project was supported by the China ScholarshipCouncil. This project was also supported by TheNational Science Project for University of Anhui Prov-ince (No. KJ2019A0494). We also thank Susanne Koch,Simone Urstadt, Marlies Niebuhr, Ulrike Kierbaumand Jürgen Kobbe for diligent and skillful assistance.Open access funding enabled and organized byProjekt DEAL.
AUTHORSHIP STATEMENTS
K.D., B.P., S.M. and H.W. designed the experiment,H.W. carried out the incubation experiment,L.B. performed qPCR and the analysis of the gene abun-dance data, H.W. drafted the manuscript, L.B., S.M., P.K.,H.Z., K.D. and B.P. contributed to the final version ofmanuscript. K.D. supervised the project.
CONFLICT OF INTERESTS
None.
DATA AVAILABILITY STATEMENT
The data that support the findings of this study are avail-able from the corresponding author upon reasonablerequest.
WANG ET AL. 11

ORCID
Haitao Wang https://orcid.org/0000-0003-4056-329XLukas Beule https://orcid.org/0000-0003-1107-7540Birgit Pfeiffer https://orcid.org/0000-0002-1820-4533
REFERENCES
Achouak, W., Abrouk, D., Guyonnet, J., Barakat, M., Ortet, P.,Simon, L., … Haichar, F. e. Z. (2019). Plant hosts control micro-bial denitrification activity. FEMS Microbiology Ecology, 95(3),1–13. https://doi.org/10.1093/femsec/fiz021
Bakken, L. R. (1988). Denitrification under different cultivatedplants: Effects of soil moisture tension, nitrate concentration,and photosynthetic activity. Biology and Fertility of Soils, 6(4),271–278. https://doi.org/10.1007/BF00261011
Bakken, L. R., & Frostegard, A. (2017). Sources and sinks for N2O,can microbiologist help to mitigate N2O emissions? Environ-
mental Microbiology, 19(12), 4801–4805. https://doi.org/10.1111/1462-2920.13978
Benizri, E., Nguyen, C., Piutti, S., Slezack-Deschaumes, S., &Philippot, L. (2007). Additions of maize root mucilage to soilchanged the structure of the bacterial community. Soil Biologyand Biochemistry, 39(5), 1230–1233. https://doi.org/10.1016/j.soilbio.2006.12.026
Berg, G., & Smalla, K. (2009). Plant species and soil type coopera-tively shape the structure and function of microbial communi-ties in the rhizosphere. FEMS Microbiology Ecology, 68(1), 1–13.https://doi.org/10.1111/j.1574-6941.2009.00654.x
Bergström, L. F., & Jokela, W. E. (2001). Ryegrass cover crop effectson nitrate leaching in spring barley fertilized with15NH415NO3. Journal of Environmental Quality, 30(5),1659–1667. https://doi.org/10.2134/jeq2001.3051659x
Bertin, C., Yang, X., & Weston, L. A. (2003). The role of root exu-dates and allelochemicals in the rhizosphere. Plant and Soil,256(1), 67–83. https://doi.org/10.1023/A:1026290508166
Beule, L., Corre, M. D., Schmidt, M., Göbel, L., Veldkamp, E., &Karlovsky, P. (2019). Conversion of monoculture cropland andopen grassland to agroforestry alters the abundance of soil bac-teria, fungi and soil-N-cycling genes. PLoS One, 14(6),e0218779. https://doi.org/10.1371/journal.pone.0218779
Bijay-singh, R.,. J. C., & Whitchead, D. C. (1988). Some relationshipsbetween denitrification potential and fractions of organic carbonin air-dried and field-moist soils. Soil Biology and Biochemistry,20(5), 737–741. https://doi.org/10.1016/0038-0717(88)90160-5
Brandfass, C., & Karlovsky, P. (2008). Upscaled CTAB-based DNAextraction and real-time PCR assays for Fusarium culmorumand F. graminearum DNA in plant material with reduced sam-pling error. International Journal of Molecular Sciences, 9(11),2306–2321. https://doi.org/10.3390/ijms9112306
Bremner. (1997). Sources of nitrous oxide in soils. Nutrient Cyclingin Agroecosystems, 49(1), 7–16. https://doi.org/10.1023/A:1009798022569
Bremner, J. M. (2007). Problems in the use of urea as a nitrogen fer-tilizer. Soil Use and Management, 6, 70–71.
Chèneby, D., Perrez, S., Devroe, C., Hallet, S., Couton, Y.,Bizouard, F., … Philippot, L. (2004). Denitrifying bacteria inbulk and maize-rhizospheric soil: Diversity and N2O-reducingabilities. Canadian Journal of Microbiology, 50(7), 469–474.https://doi.org/10.1139/w04-037
Correa-Galeote, D., Tortosa, G., Moreno, S., Bru, D.,Philippot, L., & Bedmar, E. J. (2017). Spatiotemporal variationsin the abundance and structure of denitrifier communities insediments differing in nitrate content. Current Issues in Molecu-
lar Biology, 24, 71–102. https://doi.org/10.21775/cimb.024.071Deiglmayr, K., Philippot, L., & Kandeler, E. (2006). Functional sta-
bility of the nitrate-reducing community in grassland soilstowards high nitrate supply. Soil Biology and Biochemistry, 38(9), 2980–2984. https://doi.org/10.1016/j.soilbio.2006.04.034
Derrien, D., Marol, C., & Balesdent, J. (2004). The dynamics of neu-tral sugars in the rhizosphere of wheat. An approach by13Cpulse-labelling and GC/C/IRMS. Plant and Soil, 267(1),243–253. https://doi.org/10.1007/s11104-005-5348-8
Dong, Z., Zhu, B., Jiang, Y., Tang, J., Liu, W., & Hu, L. (2018). Sea-sonal N2O emissions respond differently to environmental andmicrobial factors after fertilization in wheat–maizeagroecosystem. Nutrient Cycling in Agroecosystems, 112(2),215–229. https://doi.org/10.1007/s10705-018-9940-8
Enwall, K., Philippot, L., & Hallin, S. (2005). Activity and composi-tion of the denitrifying bacterial community respond differentlyto long-term fertilization. Applied and Environmental Microbi-
ology, 71(12), 8335–8343. https://doi.org/10.1128/AEM.71.12.8335-8343.2005
Fageria, N. K., & Baligar, V. C. (2005). Enhancing nitrogen use effi-ciency in crop plants. In Advances in Agronomy (Vol. 88,pp. 97–185). USA: Academic Press. https://doi.org/10.1016/S0065-2113(05)88004-6
Forrestal, P. J., Harty, M., Carolan, R., Lanigan, G. J., Watson, C. J.,Laughlin, R. J., … Richards, K. G. (2016). Ammonia emissionsfrom urea, stabilized urea and calcium ammonium nitrate:Insights into loss abatement in temperate grassland. Soil Useand Management, 32, 92–100. https://doi.org/10.1111/sum.12232
Graf, D. R. H. (2015). Ecology and genomics of microorganismsreducing the greenhouse gas N2O, Doctor thesis of SwedishUniversity of Agricultural Sciences, Uppsala, Sweden. Retrivedfrom https://pub.epsilon.slu.se/12667/
Groenigen, J. W. V., Velthof, G. L., Oenema, O.,Groenigen, K. J. V., & Kessel, C. V. (2010). Towards an agro-nomic assessment of N2O emissions: A case study for arablecrops. European Journal of Soil Science, 61(6), 903–913. https://doi.org/10.1111/j.1365-2389.2009.01217.x
Guerra, V., Beule, L., Lehtsaar, E., Liao, H.-L., & Karlovsky, P.(2020). Improved protocol for DNA extraction from subsoilsusing phosphate Lysis buffer. Microorganisms, 8(4), 1–16.https://doi.org/10.3390/microorganisms8040532
Guyonnet, J. P., Guillemet, M., Dubost, A., Simon, L., Ortet, P.,Barakat, M., … Haichar, F. e. Z. (2018). Plant nutrient resourceuse strategies shape active rhizosphere microbiota through rootexudation. Frontiers in Plant Science, 9, 1–13. https://doi.org/10.3389/fpls.2018.01662
Guyonnet, J. P., Vautrin, F., Meiffren, G., Labois, C.,Cantarel, A. A. M., Michalet, S., … Haichar, F. E. Z. (2017). Theeffects of plant nutritional strategy on soil microbial denitrifica-tion activity through rhizosphere primary metabolites. FEMS
Microbiology Ecology, 93(4), 1–13. https://doi.org/10.1093/femsec/fix022
Haichar, F. e. Z., Marol, C., Berge, O., Rangel-Castro, J. I.,Prosser, J. I., Balesdent, J., … Achouak, W. (2008). Plant host
12 WANG ET AL.

habitat and root exudates shape soil bacterial community struc-ture. The ISME Journal, 2(12), 1221–1230. https://doi.org/10.1038/ismej.2008.80
Haichar, F. e. Z., Santaella, C., Heulin, T., & Achouak, W. (2014).Root exudates mediated interactions belowground. Soil Biologyand Biochemistry, 77, 69–80. https://doi.org/10.1016/j.soilbio.2014.06.017
Harris, D., Horwath, W., & Kessel, C. v. (2001). Acid fumigation ofsoils to remove carbonates prior to total organic carbon orcarbon-13 isotopic analysis. Soil Science Society of America Jour-
nal, 65(6), 1853–1856.Henry, S., Texier, S., Hallet, S., Bru, D., Dambreville, C.,
Chèneby, D., … Philippot, L. (2008). Disentangling the rhizo-sphere effect on nitrate reducers and denitrifiers: Insight intothe role of root exudates. Environmental Microbiology, 10(11),3082–3092. https://doi.org/10.1111/j.1462-2920.2008.01599.x
Herman, D. J., Johnson, K. K., Jaeger, C. H., Schwartz, E., &Firestone, M. K. (2006). Root influence on nitrogen mineraliza-tion and nitrification in Avena barbata rhizosphere soil. SoilScience Society of America Journal, 70(5), 1504–1511. https://doi.org/10.2136/sssaj2005.0113
Hu, H.-W., Chen, D., & He, J.-Z. (2015). Microbial regulation of ter-restrial nitrous oxide formation: Understanding the biologicalpathways for prediction of emission rates. FEMS Microbiology
Reviews, 39(5), 729–749. https://doi.org/10.1093/femsre/fuv021IPCC. (2013). Climate Change 2013: The physical science basis.
IPCC Working Group I Contribution to AR5, Stocker, T.F., D.Qin, G.-K. Plattner, M. Tignor, S.K. Allen, J. Boschung, A. Nauels,
Y. Xia, V. Bex and P.M. Midgley (eds.), 167–168. http://www.ipcc.ch/report/ar5/wg1/
Ji, Q., Frey, C., Sun, X., Jackson, M., Lee, Y.-S., Jayakumar, A., …Ward, B. B. (2018). Nitrogen and oxygen availabilities controlwater column nitrous oxide production during seasonal anoxiain the Chesapeake Bay. Biogeosciences, 15(20), 6127–6138.https://doi.org/10.5194/bg-15-6127-2018
Jones, D. L., Kemmitt, S. J., Wright, D., Cuttle, S. P., Bol, R., &Edwards, A. C. (2005). Rapid intrinsic rates of amino acid bio-degradation in soils are unaffected by agricultural managementstrategy. Soil Biology and Biochemistry, 37(7), 1267–1275.https://doi.org/10.1016/j.soilbio.2004.11.023
Ju, X.-T., Xing, G.-X., Chen, X.-P., Zhang, S.-L., Zhang, L.-J.,Liu, X.-J., … Zhang, F.-S. (2009). Reducing environmental riskby improving N management in intensive Chinese agriculturalsystems. Proceedings of the National Academy of Sciences of the
United States of America, 106(9), 3041–3046. https://doi.org/10.1073/pnas.0813417106
Kalbitz, K., Solinger, S., Park, J. -h., Michalzik, B., & Matzner, E.(2000). Controls on the dynamics of dissolved organic matter insoils: A review. Soil Science, 165(4), 277–304.
Klemedtsson, L., Svensson, B. H., & Rosswall, T. (1987). Dinitrogenand nitrous oxide produced by denitrification and nitrificationin soil with and without barley plants. Plant and Soil, 99(2),303–319. https://doi.org/10.1007/BF02370877
Köbke, S., Senbayram, M., Pfeiffer, B., Nacke, H., & Dittert, K.(2018). Post-harvest N2O and CO2 emissions related to plantresidue incorporation of oilseed rape and barley straw dependon soil NO3- content. Soil and Tillage Research, 179, 105–113.https://doi.org/10.1016/j.still.2018.01.013
Kuzyakov, Y. (2010). Priming effects: Interactions between livingand dead organic matter. Soil Biology and Biochemistry, 42(9),1363–1371. https://doi.org/10.1016/j.soilbio.2010.04.003
Kuzyakov, Y., & Razavi, B. S. (2019). Rhizosphere size and shape:Temporal dynamics and spatial stationarity. Soil Biology and
Biochemistry, 135, 343–360. https://doi.org/10.1016/j.soilbio.2019.05.011
Kuzyakov, Y., & Xu, X. (2013). Competition between roots andmicroorganisms for nitrogen: Mechanisms and ecological rele-vance. New Phytologist, 198(3), 656–669. https://doi.org/10.1111/nph.12235
Langarica-Fuentes, A., Manrubia, M., Giles, M. E., Mitchell, S., &Daniell, T. J. (2018). Effect of model root exudate on denitrifiercommunity dynamics and activity at different water-filled porespace levels in a fertilised soil. Soil Biology & Biochemistry, 120,70–79. https://doi.org/10.1016/j.soilbio.2018.01.034
Lenhart, K., Behrendt, T., Greiner, S., Steinkamp, J., Well, R.,Giesemann, A., & Keppler, F. (2019). Nitrous oxide effluxesfrom plants as a potentially important source to the atmo-sphere. New Phytologist, 221(3), 1398–1408. https://doi.org/10.1111/nph.15455
Li, Z., Zhao, B., Olk, D. C., Jia, Z., Mao, J., Cai, Y., & Zhang, J.(2018). Contributions of residue-C and -N to plant growth andsoil organic matter pools under planted and unplanted condi-tions. Soil Biology and Biochemistry, 120, 91–104. https://doi.org/10.1016/j.soilbio.2018.02.005
Liu, Y.-R., Delgado-Baquerizo, M., Wang, J.-T., Hu, H.-W.,Yang, Z., & He, J.-Z. (2018). New insights into the role of micro-bial community composition in driving soil respiration rates.Soil Biology and Biochemistry, 118, 35–41. https://doi.org/10.1016/j.soilbio.2017.12.003
Lundquist, E. J., Jackson, L. E., & Scow, K. M. (1999). Wet–drycycles affect dissolved organic carbon in two California agricul-tural soils. Soil Biology and Biochemistry, 31(7), 1031–1038.https://doi.org/10.1016/S0038-0717(99)00017-6
Mahmood, T., Ali, R., Malik, K. A., & Shamsi, S. R. A. (1997). Deni-trification with and without maize plants (Zea mays L.) underirrigated field conditions. Biology and Fertility of Soils, 24(3),323–328. https://doi.org/10.1007/s003740050251
Menéndez, S., Barrena, I., Setien, I., González-Murua, C., &Estavillo, J. M. (2012). Efficiency of nitrification inhibitor DMPPto reduce nitrous oxide emissions under different temperatureand moisture conditions. Soil Biology and Biochemistry, 53,82–89. https://doi.org/10.1016/j.soilbio.2012.04.026
Moreau, D., Bardgett, R. D., Finlay, R. D., Jones, D. L., &Philippot, L. (2019). A plant perspective on nitrogen cycling inthe rhizosphere. Functional Ecology, 33(4), 540–552. https://doi.org/10.1111/1365-2435.13303
Muhammad, I., Sainju, U. M., Zhao, F., Khan, A., Ghimire, R.,Fu, X., & Wang, J. (2019). Regulation of soil CO2 and N2Oemissions by cover crops: A meta-analysis. Soil and Tillage
Research, 192, 103–112. https://doi.org/10.1016/j.still.2019.04.020
Nguyen, C. (2003). Rhizodeposition of organic C by plants: Mecha-nisms and controls. Agronomie, 23(5–6), 375–396. https://doi.org/10.1051/agro:2003011
Parkin, T. B., Venterea, R. T., & Hargreaves, S. K. (2012). Calculat-ing the detection limits of chamber-based soil greenhouse gas
WANG ET AL. 13

flux measurements. Journal of Environment Quality, 41(3),705–715.
Pausch, J., & Kuzyakov, Y. (2018). Carbon input by roots into thesoil: Quantification of rhizodeposition from root to ecosystemscale. Global Change Biology, 24(1), 1–12. https://doi.org/10.1111/gcb.13850
Philibert, A., Loyce, C., & Makowski, D. (2012). Quantifying uncer-tainties in N(2)O emission due to N fertilizer application in cul-tivated areas. PLoS One, 7(11), e50950. https://doi.org/10.1371/journal.pone.0050950
Philippot, L., Hallin, S., & Schloter, M. (2007). Ecology of den-itrifying prokaryotes in agricultural soil. Donald L. Sparks InAdvances in agronomy (Vol. 96, , pp. 249–305). USA: AcademicPress. https://doi.org/10.1016/S0065-2113(07)96003-4
Pivato, B., Bru, D., Busset, H., Deau, F., Matejicek, A.,Philippot, L., & Moreau, D. (2017). Positive effects of plant asso-ciation on rhizosphere microbial communities depend on plantspecies involved and soil nitrogen level. Soil Biology and Bio-
chemistry, 114, 1–4. https://doi.org/10.1016/j.soilbio.2017.06.018Poeplau, C., Aronsson, H., Myrbeck, Å., & Kätterer, T. (2015). Effect
of perennial ryegrass cover crop on soil organic carbon stocksin southern Sweden. Geoderma Regional, 4, 126–133. https://doi.org/10.1016/j.geodrs.2015.01.004
Qian, J. H., Doran, J. W., & Walters, D. T. (1997). Maize plant con-tributions to root zone available carbon and microbial transfor-mations of nitrogen. Soil Biology and Biochemistry, 29(9),1451–1462. https://doi.org/10.1016/S0038-0717(97)00043-6
Core Team, R. (2018). R: A language and environment for statistical
computing, R Foundation for Statistical Computing. Vienna,Austria: The R foundation. Retrieved from http://www.R-project.org
Ravishankara, A. R., Daniel, J. S., & Portmann, R. W. (2009).Nitrous oxide (N2O): The dominant ozone-depleting substanceemitted in the 21st century. Science, 326(5949), 123–125.https://doi.org/10.1126/science.1176985
Saggar, S., Jha, N., Deslippe, J., Bolan, N. S., Luo, J., Giltrap, D. L.,… Tillman, R. W. (2013). Denitrification and N2O:N2 produc-tion in temperate grasslands: Processes, measurements, model-ling and mitigating negative impacts. Science of the Total
Environment, 465, 173–195. https://doi.org/10.1016/j.scitotenv.2012.11.050
Schönbach, P., Wan, H., Gierus, M., Bai, Y., Müller, K., Lin, L., …Taube, F. (2011). Grassland responses to grazing: Effects ofgrazing intensity and management system in an inner Mongo-lian steppe ecosystem. Plant and Soil, 340(1), 103–115. https://doi.org/10.1007/s11104-010-0366-6
Senbayram, M., Chen, R., Budai, A., Bakken, L., & Dittert, K.(2012). N2O emission and the N2O/(N2O+N2) product ratio ofdenitrification as controlled by available carbon substrates andnitrate concentrations. Agriculture, Ecosystems & Environment,147, 4–12.
Senbayram, M., Chen, R., Mühling, K. H., & Dittert, K. (2009). Con-tribution of nitrification and denitrification to nitrous oxideemissions from soils after application of biogas waste and otherfertilizers. Rapid Communications in Mass Spectrometry, 23(16),2489–2498. https://doi.org/10.1002/rcm.4067
Senbayram, M., Well, R., Shan, J., Bol, R., Burkart, S.,Jones, D. L., & Wu, D. (2020). Rhizosphere processes in nitrate-rich barley soil tripled both N2O and N2 losses due to enhanced
bacterial and fungal denitrification. Plant and Soil, 448(1),509–522. https://doi.org/10.1007/s11104-020-04457-9
Shcherbak, I., Millar, N., & Robertson, G. P. (2014). Globalmetaanalysis of the nonlinear response of soil nitrous oxide(N2O) emissions to fertilizer nitrogen. Proceedings of the
National Academy of Sciences, 111(25), 9199–9204. https://doi.org/10.1073/pnas.1322434111
Song, X., Liu, M., Ju, X., Gao, B., Su, F., Chen, X., & Rees, R. M.(2018). Nitrous oxide emissions increase exponentially whenoptimum nitrogen fertilizer rates are exceeded in the NorthChina plain. Environmental Science & Technology, 52(21),12504–12513. https://doi.org/10.1021/acs.est.8b03931
Tang, Y., Zhang, X., Li, D., Wang, H., Chen, F., Fu, X., … Yu, G.(2016). Impacts of nitrogen and phosphorus additions on theabundance and community structure of ammonia oxidizers anddenitrifying bacteria in Chinese fir plantations. Soil Biology andBiochemistry, 103, 284–293. https://doi.org/10.1016/j.soilbio.2016.09.001
Thomsen, I. K., & Hansen, E. M. (2014). Cover crop growth andimpact on N leaching as affected by pre- and postharvest sow-ing and time of incorporation. Soil Use and Management, 30(1),48–57. https://doi.org/10.1111/sum.12083
Tinker, P. B., & Nye, P. H. (2000). Solute movement in the Rhizo-
sphere, Oxford, UK: . Oxford University Press.Volpi, I., Laville, P., Bonari, E., o di Nasso, N. N., & Bosco, S.
(2017). Improving the management of mineral fertilizers fornitrous oxide mitigation: The effect of nitrogen fertilizer type,urease and nitrification inhibitors in two different texturedsoils. Geoderma, 307, 181–188. https://doi.org/10.1016/j.geoderma.2017.08.018
Wang, K., Zheng, X., Pihlatie, M., Vesala, T., Liu, C., Haapanala, S.,… Liu, H. (2013). Comparison between static chamber and tun-able diode laser-based eddy covariance techniques for measur-ing nitrous oxide fluxes from a cotton field. Agricultural andForest Meteorology, 171–172, 9–19.
Wu, D., Senbayram, M., Well, R., Brueggemann, N., Pfeiffer, B.,Loick, N., … Bol, R. (2017). Nitrification inhibitors mitigateN2O emissions more effectively under straw-induced condi-tions favoring denitrification. Soil Biology & Biochemistry, 104,197–207. https://doi.org/10.1016/j.soilbio.2016.10.022
Zhalnina, K., Louie, K. B., Hao, Z., Mansoori, N., daRocha, U. N., Shi, S., … Brodie, E. L. (2018). Dynamic rootexudate chemistry and microbial substrate preferences drivepatterns in rhizosphere microbial community assembly.Nature Microbiology, 3(4), 470–480. https://doi.org/10.1038/s41564-018-0129-3
Zhang, M., Li, X., Wang, H., & Huang, Q. (2018). Comprehensiveanalysis of grazing intensity impacts soil organic carbon: Acase study in typical steppe of Inner Mongolia, China.Applied Soil Ecology, 129, 1–12. https://doi.org/10.1016/j.apsoil.2018.03.008
Zhao, W., Chen, S.-P., & Lin, G.-H. (2008). Compensatory growthresponses to clipping defoliation in Leymus chinensis (Poaceae)under nutrient addition and water deficiency conditions. PlantEcology, 196(1), 85–99. https://doi.org/10.1007/s11258-007-9336-3
Zhao, Y., Peth, S., Krümmelbein, J., Horn, R., Wang, Z.,Steffens, M., … Peng, X. (2007). Spatial variability of soil proper-ties affected by grazing intensity in Inner Mongolia grassland.
14 WANG ET AL.

Ecological Modelling, 205(1), 241–254. https://doi.org/10.1016/j.ecolmodel.2007.02.019
Zhou, M., Zhu, B., Wang, X., & Wang, Y. (2017). Long-term fieldmeasurements of annual methane and nitrous oxide emissionsfrom a Chinese subtropical wheat-rice rotation system. Soil
Biology and Biochemistry, 115, 21–34. https://doi.org/10.1016/j.soilbio.2017.08.005
How to cite this article: Wang H, Beule L,Zang H, et al. The potential of ryegrass as covercrop to reduce soil N2O emissions and increase thepopulation size of denitrifying bacteria. Eur J SoilSci. 2020;1–15. https://doi.org/10.1111/ejss.13047
WANG ET AL. 15

68
Chapter 5: General Discussion
5.1 Effect of urease and nitrification inhibitors on N2O emission
We have introduced a popular urease inhibitor NBPT with both incubation and field experiment in
our study (Paper I and II). NBPT-added urea was not only intended to decrease soil N2O emission,
but also to reduce NH3 volatilization, which can account for 25% of urea applied to soil surface
(FAOSTAT, 2015). The reduction of NH3 volatilization was more certain and effective in recently
reviewed studies (Dawar et al., 2011; Drury et al., 2017; Liu et al., 2017; Mira et al., 2017; Tian et
al., 2015). In our incubation experiment, adding NBPT on urea reduced 50% of cumulative NH3
emission (Paper I). Considering 1-2% of NH3 converted to N2O (Wulf et al., 2002), it counts for
10-20% extra reduction of N2O than urea alone. Moreover, in field conditions, the reduction of
NH3 volatilization increases N use efficiency, which potentially increases crop yield (Linquist et
al., 2013). The reduction of yield-scaled N2O emission should be more effective.
Direct N2O emissions reduced by NBPT was also observed in many other studies (Abalos et al.,
2012; Dawar et al., 2011; Ding et al., 2011; Singh et al., 2013), though with a higher uncertainty
(X. Fan et al., 2018). In our incubation experiment, NBPT reduced 31% of direct N2O emission,
compared with urea alone (Paper I), but the reduction of N2O emission under field studies was
inconsistent, 26%, 19% and 9% of N2O emission were reduced, under a wheat- wheat- oilseed rape
rotation, respectively, and the results were not statistically significant (Paper II). Our postulation
was that background NO3- substrate in the soil plays an important role on the effectiveness of NBPT.
When there was a high NO3- content even in unfertilized soil, N2O emission (induced by soil-borne
NO3-) masks the effect of NBPT reduced N2O emission.
Piadin (1H-1, 2, 4-triazole and 3-methylpyrazole) served as a nitrification inhibitor showed its
effectiveness on N2O reduction in a few related studies (Barneze et al., 2015; Pietzner et al., 2017;
Wolf et al., 2014; Wu et al., 2017). In our incubation experiment, cumulative N2O emission was
reduced from 0.98 g N2O-N m−2 to 0.15 g N2O-N m−2 (Paper I). The effect of delaying the
transformation of NH4+ to NO3
- was also clearly observed. Such astonishing effectiveness was
achieved, probably because our experiment condition was very in favor to denitrification (25°C
and 80% WFPS). However, it was still worth mentioning that adding Piadin increased NH3

69
volatilization by 44%, compared with urea alone. Similar findings were also reported by others (C.
Fan et al., 2018; Ferm et al., 2006; Lam et al., 2018, 2017; Pan et al., 2016; Qiao et al., 2015; Webb
et al., 2010).
DMPP was also tested in our field experiment using the commercial fertilizer ENTEC (7.5 % N of
NO3- and 18.5 % N of NH4
+ with 0.15% DMPP, BASF, Ludwigshafen, Germany) (Paper II).
Similar with UTEC (urea + NBPT), no yield increase was found, the reduction of N2O emission in
the wheat- wheat- oilseed rape rotation was 15%, 58% and 13%, respectively. Only in the wheat
after wheat season, N2O was statistically lower in ENTEC. Our postulation that high soil NO3-
substrate caused by high N surplus of oilseed rape was also valid to explain the ineffectiveness of
DMPP on reducing N2O emissions (in oilseed rape and following wheat fields).
5.2 Effect of crop rotation on yield and yield-scaled N2O emissions
Our field experiment shows a clear break crop effect (BCB), that wheat after oilseed rape had a
higher crop yield than wheat after wheat (Paper II). Though wheat after wheat in 2017 suffers
extreme heavy rainfalls during the harvest, which may cause some yield losses. But the obviously
higher NO3- content in wheat after oilseed rape field is a clear evidence of break crop effect and
partly explains its high crop yield. The break crop effect was also well documented in other studies
(Angus et al., 2015; Sieling and Christen, 2015; Weiser et al., 2018).
From the plant nutritional aspect, higher crop yield of wheat after wheat was as a result of high N
surplus after oilseed rape cultivation. Residues of oilseed rape in post-harvest season provides more
mineral N than needed for N uptakes before winter (Ruser et al., 2017). Moreover, residues in post-
harvest season provide an impeccable environment for denitrification. It provides not only
denitrification-needed NO3- substrates, but also sufficient organic C as energy source (Köbke et al.,
2018; Ruser et al., 2017). In our study, the climate also additionally provides a high temperature
and a high WFPS, which also favors denitrification. The huge amount of N2O emission at post-
harvest season in oilseed rape field in 2017 is consistent with our speculation.
5.3 The presence of plant affect N2O emissions
In Paper III, we explored how the presence of Lolium perenne affect soil C and N cycles and
microbial community, by comparing Lolium Perenne planted soils and bare soils. Though it is
widely agreed that 5-21% of photosynthesis-derived C is released into the soil in the form of root
70
exudates (Derrien et al., 2004; Nguyen, 2003), we did not find a difference of DOC-content
between bare soil and planted soils. The reason could be possibly: i) the majority of root exudates
was directly consumed by root and microbes respiration in a few hours (Fischer and Kuzyakov,
2010; Jones et al., 2005; Jones and Kielland, 2002; Kuzyakov and Xu, 2013); ii) intensive cutting
decreased organic C accumulation (Zhang et al., 2018).
N2O emission of soil with grass was presumed to be lower than bare soil, while a large amount of
soil NO3- can be absorbed by the growth of Lolium Perenne. In our study (Paper III), we found a
ca. 50% apparent N recovery efficiency in fertilized soil with grass, accompanying with a lower
NO3- content in soil with grass than bare soil. Not surprisingly, N2O emission in soil with grass was
lower than that in bare soil. Aside from lower NO3- in soil with grass, a slightly lower WFPS (55%)
during gas measurement, which was caused by plant respiration, might be another reason for lower
N2O emission in soil with grass. However, our results also suggest that the potential of N2O
emission could increase exponentially, when the soil NO3- were excessive for plant uptake (Hayashi
et al., 2015; Philippot et al., 2013; Uchida et al., 2011). In our study, a 20 g N m-2 fertilization level
caused more than doubled N2O emission than a 10 g N m-2 fertilization level, and at 20 g N m-2
fertilization level, the discrepancy of N2O emission in soil with grass and bare soil was narrowed,
compared with lower fertilized levels.
Root exudates increase soil microbial biomass and community diversity was well documented in
various studies (Berg and Smalla, 2009; Guyonnet et al., 2018; Haichar et al., 2008; Li et al., 2019,
2018; Qian et al., 2018). Our results showed that both bacterial 16S rRNA and fungal 18S rRNA
gene abundances were increased by the presence of Lolium perenne, and soil bacteria may be more
favored by plant roots than fungi (Paper III). We also found that rather than other denitrifying genes
(narG, napA, nirK, nirS, nosZ clade I), nosZ clade II was not stimulated by the presence of Lolium
Perenne. This is correspondent with Graf et al. (2015), that organisms carrying the nosZ clade I
have an affinity to plant roots which are not shared by those with nosZ clade II. The fact that nitrate
and nitrite reductase genes (narG, napA, nirK and nirS) increases more than nitrous oxide reductase
genes (nosZ), also indicates that soil with grass has a higher potential of incomplete denitrification,
when soil NO3- content was not the limiting factor. The incomplete denitrification might lead to a
higher N2O/N2O+N2 ratios.

71
5.4 Approaches for N2O mitigation in arable lands
This study provide some information on the effectiveness of urease and nitrification inhibitors. But
the complexity of soil microenvironment increases its uncertainty. How to improve the
effectiveness of enhanced-efficiency fertilizers, still needs more research. From the view of our
study, we suggest three possible directions for future research:
1) Investigate on the environmental factors that affect the effectiveness of urease and nitrification
inhibitors. In our field experiment, we found that post-harvest residues of oilseed rape leads to
high N2O emission, which masks the effectiveness of urease and nitrification inhibitors (Paper
II). For that, appropriate field management (straw removal) could be done, to reduce post-
harvest N2O emission. In other studies, they found urease inhibitors can be more effective to
reduce NH3 volatilization, when the soil was exposed to high risk of NH3 volatilization, for
example high soil temperature and low soil moisture (Grant et al., 1996). Or when the soil
suffers high leaching risk, for example sandy soil texture, heavy rainfalls or irrigation after
fertilization, nitrification inhibitor could be more effective (Ni et al., 2015).
2) Combine current available inhibitors and additives to improve its effectiveness. The
combination of both urea and nitrification is a possible attempt (Drury et al., 2017; Rajkovich
et al., 2017; Zaman et al., 2013). Other additives, for example biochar (Cayuela et al., 2014;
Palanivell et al., 2017; Roberts et al., 2010), urea coated with zinc sulfate (ZnSO4) (Adotey et
al., 2017; Shivay et al., 2008), urea coated with humic acids and zeolites (de Sousa Gurgel et
al., 2016), when combined with current available inhibitors, might show a different
effectiveness.
3) Research on new inhibitors. Although developing new inhibitors is more likely to face failure,
for example NZONE MAX in our study was proved to be ineffective in reducing either NH3 or
N2O emissions, new compounds is always worth to explore. Some literature shows that
Limus® (A formulation containing NBPT and NPPT (N-(n-propyl) thiophosphoric triamide)
was an new effective urease inhibitor (Cantarella et al., 2018; Li et al., 2015). A more
fascinating inhibitor is 1,9‐decanediol (Sun et al., 2016), which is a newly observed biological
nitrification inhibitors (BNI) and might receive more attention in the following years.

72
References
Abalos, D., Sanz-Cobena, A., Misselbrook, T., Vallejo, A., 2012. Effectiveness of urease inhibition on the
abatement of ammonia, nitrous oxide and nitric oxide emissions in a non-irrigated Mediterranean
barley field. Chemosphere 89, 310–318. https://doi.org/10.1016/j.chemosphere.2012.04.043
Adotey, N., Kongchum, M., Li, J., Whitehurst, G.B., Sucre, E., Harrell, D.L., 2017. Ammonia
Volatilization of Zinc Sulfate-Coated and NBPT-Treated Urea Fertilizers. Agron. J. 109, 2918–2926. https://doi.org/10.2134/agronj2017.03.0153
Angus, J.F., Kirkegaard, J.A., Hunt, J.R., Ryan, M.H., Ohlander, L., Peoples, M.B., 2015. Break crops and
rotations for wheat. Crop Pasture Sci. 66, 523–552. https://doi.org/10.1071/CP14252
Barneze, A.S., Minet, E.P., Cerri, C.C., Misselbrook, T., 2015. The effect of nitrification inhibitors on
nitrous oxide emissions from cattle urine depositions to grassland under summer conditions in the
UK. Chemosphere 119, 122–129. https://doi.org/10.1016/j.chemosphere.2014.06.002
Berg, G., Smalla, K., 2009. Plant species and soil type cooperatively shape the structure and function of
microbial communities in the rhizosphere. Fems Microbiol. Ecol. 68, 1–13.
https://doi.org/10.1111/j.1574-6941.2009.00654.x
Cantarella, H., Otto, R., Soares, J.R., Silva, A.G. de B., 2018. Agronomic efficiency of NBPT as a urease
inhibitor: A review. J. Adv. Res., Biotechnological and medical relevance of ureases 13, 19–27.
https://doi.org/10.1016/j.jare.2018.05.008
Cayuela, M.L., van Zwieten, L., Singh, B.P., Jeffery, S., Roig, A., Sánchez-Monedero, M.A., 2014.
Biochar’s role in mitigating soil nitrous oxide emissions: A review and meta-analysis. Agric.
Ecosyst. Environ., Environmental Benefits and Risks of Biochar Application to Soil 191, 5–16.
https://doi.org/10.1016/j.agee.2013.10.009
Dawar, K., Zaman, M., Rowarth, J.S., Blennerhassett, J., Turnbull, M.H., 2011. Urease inhibitor reduces
N losses and improves plant-bioavailability of urea applied in fine particle and granular forms
under field conditions. Agric. Ecosyst. Environ. 144, 41–50.
https://doi.org/10.1016/j.agee.2011.08.007
Derrien, D., Marol, C., Balesdent, J., 2004. The dynamics of neutral sugars in the rhizosphere of wheat.
An approach by13C pulse-labelling and GC/C/IRMS. Plant Soil 267, 243–253.
https://doi.org/10.1007/s11104-005-5348-8
de Sousa Gurgel, G.C., Ferrari, A.C., Fontana, A., Polidoro, J.C., Martins Coelho, L. de A., Zonta, E.,
2016. Ammonia volatilization from mixed mineral fertilizers containing urea. Pesqui. Agropecu.
Bras. 51, 1686–1694. https://doi.org/10.1590/S0100-204X2016000900069
Ding, W.X., Yu, H.Y., Cai, Z.C., 2011. Impact of urease and nitrification inhibitors on nitrous oxide
emissions from fluvo-aquic soil in the North China Plain. Biol. Fertil. Soils 47, 91–99.
https://doi.org/10.1007/s00374-010-0504-6
Drury, C.F., Yang, X., Reynolds, W.D., Calder, W., Oloya, T.O., Woodley, A.L., 2017. Combining urease
and nitrification inhibitors with incorporation reduces ammonia and nitrous oxide emissions and
increases corn yields. J. Environ. Qual. 46, 939–949. https://doi.org/10.2134/jeq2017.03.0106
Fan, C., Li, B., Xiong, Z., 2018. Nitrification inhibitors mitigated reactive gaseous nitrogen intensity in
intensive vegetable soils from China. Sci. Total Environ. 612, 480–489.
https://doi.org/10.1016/j.scitotenv.2017.08.159
73
Fan, X., Yin, C., Yan, G., Cui, P., Shen, Q., Wang, Q., Chen, H., Zhang, N., Ye, M., Zhao, Y., Li, T.,
Liang, Y., 2018. The contrasting effects of N-(n-butyl) thiophosphoric triamide (NBPT) on N2O
emissions in arable soils differing in pH are underlain by complex microbial mechanisms. Sci.
Total Environ. 642, 155–167. https://doi.org/10.1016/j.scitotenv.2018.05.356
FAOSTAT, 2015. Food and Agricultural Organization of the United Nations. Statistics Division [WWW
Document]. URL http://www.fao.org/faostat/en/#data/QC (accessed 2.3.18).
Ferm, M., Kasimir-Klemedtsson, å., Weslien, P., Klemedtsson, L., 2006. Emission of NH3 and N2O after
spreading of pig slurry by broadcasting or band spreading. Soil Use Manag. 15, 27–33.
Fischer, H., Kuzyakov, Y., 2010. Sorption, microbial uptake and decomposition of acetate in soil:
transformations revealed by position-specific 14C labeling. Soil Biol. Amp Biochem. 42, 186–192.
Graf, D.R.H., 2015. Ecology and genomics of microorganisms reducing the greenhouse gas N₂O. Dr. Thesis.
Grant, C.A., Jia, S., Brown, K.R., Bailey, L.D., 1996. Volatile losses of NH3 from surface-applied urea
and urea ammonium nitrate with and without the urease inhibitors NBPT or ammonium
thiosulphate. Can. J. Soil Sci. 76, 417–419. https://doi.org/10.4141/cjss96-050
Guyonnet, J.P., Guillemet, M., Dubost, A., Simon, L., Ortet, P., Barakat, M., Heulin, T., Achouak, W.,
Haichar, F. el Z., 2018. Plant Nutrient Resource Use Strategies Shape Active Rhizosphere
Microbiota Through Root Exudation. Front. Plant Sci. 9. https://doi.org/10.3389/fpls.2018.01662
Haichar, F. el Z., Marol, C., Berge, O., Rangel-Castro, J.I., Prosser, J.I., Balesdent, J., Heulin, T.,
Achouak, W., 2008. Plant host habitat and root exudates shape soil bacterial community structure.
ISME J. 2, 1221–1230. https://doi.org/10.1038/ismej.2008.80
Hayashi, K., Tokida, T., Kajiura, M., Yanai, Y., Yano, M., 2015. Cropland soil–plant systems control
production and consumption of methane and nitrous oxide and their emissions to the atmosphere.
Soil Sci. Plant Nutr.
Jones, D.L., Kemmitt, S.J., Wright, D., Cuttle, S.P., Bol, R., Edwards, A.C., 2005. Rapid intrinsic rates of
amino acid biodegradation in soils are unaffected by agricultural management strategy. Soil Biol.
Biochem. 37, 1267–1275. https://doi.org/10.1016/j.soilbio.2004.11.023
Jones, D.L., Kielland, K., 2002. Soil amino acid turnover dominates the nitrogen flux in permafrost-
dominated taiga forest soils. Soil Biol. Biochem. 34, 209–219. https://doi.org/10.1016/S0038-
0717(01)00175-4
Köbke, S., Senbayram, M., Pfeiffer, B., Nacke, H., Dittert, K., 2018. Post-harvest N2O and CO2
emissions related to plant residue incorporation of oilseed rape and barley straw depend on soil
NO3- content. Soil Tillage Res. 179, 105–113. https://doi.org/10.1016/j.still.2018.01.013
Kuzyakov, Y., Xu, X., 2013. Competition between roots and microorganisms for nitrogen: mechanisms
and ecological relevance. New Phytol. 198, 656–669. https://doi.org/10.1111/nph.12235
Lam, S.K., Suter, H., Davies, R., Bai, M., Mosier, A.R., Sun, J., Chen, D., 2018. Direct and indirect
greenhouse gas emissions from two intensive vegetable farms applied with a nitrification
inhibitor. Soil Biol. Biochem. 116, 48–51. https://doi.org/10.1016/j.soilbio.2017.10.008
Lam, S.K., Suter, H., Mosier, A.R., Chen, D., 2017. Using nitrification inhibitors to mitigate agricultural
N2O emission: a double-edged sword? Glob. Change Biol. 23, 485–489.
https://doi.org/10.1111/gcb.13338

74
Li, H., Su, J.-Q., Yang, X.-R., Zhu, Y.-G., 2019. Distinct rhizosphere effect on active and total bacterial
communities in paddy soils. Sci. Total Environ. 649, 422–430.
https://doi.org/10.1016/j.scitotenv.2018.08.373
Linquist, B.A., Liu, L., Kessel, C. van, Groenigen, K.J. van, 2013. Enhanced efficiency nitrogen fertilizers
for rice systems: Meta-analysis of yield and nitrogen uptake. Field Crops Res. 154, 246–254.
https://doi.org/10.1016/j.fcr.2013.08.014
Li, Q., Yang, A., Wang, Z., Roelcke, M., Chen, X., Zhang, F., Pasda, G., Zerulla, W., Wissemeier, A.H.,
Liu, X., 2015. Effect of a new urease inhibitor on ammonia volatilization and nitrogen utilization
in wheat in north and northwest China. Field Crops Res. 175, 96–105.
https://doi.org/10.1016/j.fcr.2015.02.005
Liu, S., Wang, J.J., Tian, Z., Wang, X., Harrison, S., 2017. Ammonia and greenhouse gas emissions from
a subtropical wheat field under different nitrogen fertilization strategies. J. Environ. Sci. 57, 196–210. https://doi.org/10.1016/j.jes.2017.02.014
Li, Z., Zhao, B., Olk, D.C., Jia, Z., Mao, J., Cai, Y., Zhang, J., 2018. Contributions of residue-C and -N to
plant growth and soil organic matter pools under planted and unplanted conditions. Soil Biol.
Biochem. 120, 91–104. https://doi.org/10.1016/j.soilbio.2018.02.005
Mira, A.B., Cantarella, H., Souza-Netto, G.J.M., Moreira, L.A., Kamogawa, M.Y., Otto, R., 2017.
Optimizing urease inhibitor usage to reduce ammonia emission following urea application over
crop residues. Agric. Ecosyst. Environ. 248, 105–112. https://doi.org/10.1016/j.agee.2017.07.032
Nguyen, C., 2003. Rhizodeposition of organic C by plants: mechanisms and controls. Agronomie 23, 375–396. https://doi.org/10.1051/agro:2003011
Ni, K., Köster, J.R., Seidel, A., Pacholski, A., 2015. Field measurement of ammonia emissions after
nitrogen fertilization—A comparison between micrometeorological and chamber methods. Eur. J.
Agron. 71, 115–122.
Palanivell, P., Ahmed, O.H., Ab Majid, N.M., 2017. Minimizing Ammonia Volatilization from Urea in
Waterlogged Condition Using Chicken Litter Biochar. Commun. Soil Sci. Plant Anal. 48, 2083–2092. https://doi.org/10.1080/00103624.2017.1406497
Pan, B., Lam, S.K., Mosier, A., Luo, Y., Chen, D., 2016. Ammonia volatilization from synthetic fertilizers
and its mitigation strategies: A global synthesis. Agric. Ecosyst. Environ. 232, 283–289.
https://doi.org/10.1016/j.agee.2016.08.019
Philippot, L., Raaijmakers, J.M., Lemanceau, P., van der Putten, W.H., 2013. Going back to the roots: the
microbial ecology of the rhizosphere. Nat. Rev. Microbiol. 11, 789–799.
https://doi.org/10.1038/nrmicro3109
Pietzner, B., Rücknagel, J., Koblenz, B., Bednorz, D., Tauchnitz, N., Bischoff, J., Köbke, S., Meurer,
K.H.E., Meißner, R., Christen, O., 2017. Impact of slurry strip-till and surface slurry incorporation
on NH3 and N2O emissions on different plot trials in Central Germany. Soil Tillage Res. 169, 54–64.
Qian, H., Zhu, Y., Chen, S., Jin, Y., Lavoie, M., Ke, M., Fu, Z., 2018. Interacting effect of diclofop-
methyl on the rice rhizosphere microbiome and denitrification. Pestic. Biochem. Physiol. 146, 90–96. https://doi.org/10.1016/j.pestbp.2018.03.002
Qiao, C., Liu, L., Hu, S., Compton, J.E., Greaver, T.L., Li, Q., 2015. How inhibiting nitrification affects
nitrogen cycle and reduces environmental impacts of anthropogenic nitrogen input. Glob. Change
Biol. 21, 1249–1257. https://doi.org/10.1111/gcb.12802

75
Rajkovich, S., Osmond, D., Weisz, R., Crozier, C., Israel, D., Austin, R., 2017. Evaluation of nitrogen-
loss prevention amendments in maize and wheat in North Carolina. Agron. J. 109, 1811–1824.
https://doi.org/10.2134/agronj2016.03.0153
Roberts, K.G., Gloy, B.A., Joseph, S., Scott, N.R., Lehmann, J., 2010. Life Cycle Assessment of Biochar
Systems: Estimating the Energetic, Economic, and Climate Change Potential. Environ. Sci.
Technol. 44, 827–833. https://doi.org/10.1021/es902266r
Ruser, R., Fuß, R., Andres, M., Hegewald, H., Kesenheimer, K., Köbke, S., Räbiger, T., Quinones, T.S.,
Augustin, J., Christen, O., Dittert, K., Kage, H., Lewandowski, I., Prochnow, A., Stichnothe, H.,
Flessa, H., 2017. Nitrous oxide emissions from winter oilseed rape cultivation. Agric. Ecosyst.
Environ. 249, 57–69. https://doi.org/10.1016/j.agee.2017.07.039
Shivay, Y.S., Kumar, D., Prasad, R., Ahlawat, I.P.S., 2008. Relative yield and zinc uptake by rice from
zinc sulphate and zinc oxide coatings onto urea. Nutr. Cycl. Agroecosystems 80, 181–188.
https://doi.org/10.1007/s10705-007-9131-5
Sieling, K., Christen, O., 2015. Crop rotation effects on yield of oilseed rape, wheat and barley and
residual effects on the subsequent wheat. Arch. Agron. Soil Sci. 61, 1531–1549.
https://doi.org/10.1080/03650340.2015.1017569
Singh, J., Kunhikrishnan, A., Bolan, N.S., Saggar, S., 2013. Impact of urease inhibitor on ammonia and
nitrous oxide emissions from temperate pasture soil cores receiving urea fertilizer and cattle urine.
Sci. Total Environ., Soil as a Source & Sink for Greenhouse Gases 465, 56–63.
https://doi.org/10.1016/j.scitotenv.2013.02.018
Sun, L., Lu, Y., Yu, F., Kronzucker, H.J., Shi, W., 2016. Biological nitrification inhibition by rice root
exudates and its relationship with nitrogen-use efficiency. New Phytol. 212, 646–656.
https://doi.org/10.1111/nph.14057
Tian, Z., Wang, J.J., Liu, S., Zhang, Z., Dodla, S.K., Myers, G., 2015. Application effects of coated urea
and urease and nitrification inhibitors on ammonia and greenhouse gas emissions from a
subtropical cotton field of the Mississippi delta region. Sci. Total Environ. 533, 329–338.
https://doi.org/10.1016/j.scitotenv.2015.06.147
Uchida, Y., Clough, T.J., Kelliher, F.M., Hunt, J.E., Sherlock, R.R., 2011. Effects of bovine urine, plants
and temperature on N2O and CO2 emissions from a sub-tropical soil. Plant Soil 345, 171–186.
https://doi.org/10.1007/s11104-011-0769-z
Webb, J., Pain, B., Bittman, S., Morgan, J., 2010. The impacts of manure application methods on
emissions of ammonia, nitrous oxide and on crop response—A review. Agric. Ecosyst. Environ.
137, 39–46.
Weiser, C., Fuss, R., Kage, H., Flessa, H., 2018. Do farmers in Germany exploit the potential yield and
nitrogen benefits from preceding oilseed rape in winter wheat cultivation? Arch. Agron. Soil Sci.
64, 25–37. https://doi.org/10.1080/03650340.2017.1326031
Wolf, U., Fuss, R., Hoeppner, F., Flessa, H., 2014. Contribution of N2O and NH3 to total greenhouse gas
emission from fertilization: results from a sandy soil fertilized with nitrate and biogas digestate
with and without nitrification inhibitor. Nutr. Cycl. Agroecosystems 100, 121–134.
https://doi.org/10.1007/s10705-014-9631-z
Wu, D., Senbayram, M., Well, R., Brueggemann, N., Pfeiffer, B., Loick, N., Stempfhuber, B., Dittert, K.,
Bol, R., 2017. Nitrification inhibitors mitigate N2O emissions more effectively under straw-
induced conditions favoring denitrification. Soil Biol. Biochem. 104, 197–207.
https://doi.org/10.1016/j.soilbio.2016.10.022
76
Wulf, S., Maeting, M., Clemens, J., 2002. Application technique and slurry co-fermentation effects on
ammonia, nitrous oxide, and methane emissions after spreading. J. Environ. Qual. 31, 1795.
Zaman, M., Zaman, S., Nguyen, M.L., Smith, T.J., Nawaz, S., 2013. The effect of urease and nitrification
inhibitors on ammonia and nitrous oxide emissions from simulated urine patches in pastoral
system: A two-year study. Sci. Total Environ., Soil as a Source & Sink for Greenhouse Gases 465,
97–106. https://doi.org/10.1016/j.scitotenv.2013.01.014
Zhang, M., Li, X., Wang, H., Huang, Q., 2018. Comprehensive analysis of grazing intensity impacts soil
organic carbon: A case study in typical steppe of Inner Mongolia, China. Appl. Soil Ecol. 129, 1–12. https://doi.org/10.1016/j.apsoil.2018.03.008

77
Chapter 6: Summary
Nitrous oxide (N2O) is an important greenhouse gas which contributes to climate change and ozone
depletion. Mineral N fertilizers are one of the most important sources of N2O emission in
agricultural systems. Enhanced-efficiency fertilizers (e.g., N fertilizers with added urease and
nitrification inhibitors) represent possible approaches to N2O emission reduction and improved
efficiency of N use. However, their adoption has been limited by the uncertainty of their
effectiveness across different ecosystems. The present study aims to evaluate the effectiveness of
several inhibitors under various environmental conditions. We found some of them showed their
ability to reduce N2O emissions, for example Piadin and NBPT under laboratory conditions, while
some of them are inefficient (NZONE MAX), and some exhibit inconsistent mitigation in N2O
emissions (for example DMPP and NBPT under the wheat- wheat- oilseed rape rotation system).
Although the nitrification inhibitor Piadin reduced N2O emissions from soil, it also increased the
risk of higher NH3 volatilization. Our results reveal the complexity of soil microbial activity in
relation to nitrification and denitrification, and provide some references to improve the efficiency
of urease and nitrification inhibitors.
These inconsistencies in effectiveness highlights the gap between laboratory and field conditions.
One of the most important differences is that incubation experiments do not usually include plants.
Our third experiment included both unplanted and planted soils. The results confirm our hypothesis
that the presence of Lolium perenne increases the activity of microorganisms (probably through
the release of root exudates) and lowers N2O emission through intense competition for mineral N
between plant and soil microorganisms. However, further scientific questions have arisen from the
results which require investigation. For example: how do root exudates regulate denitrifying
communities, are root exudates stimulating or inhibiting nitrification and denitrification; how do
plant species (e. g. leguminous and non-leguminous) affect the microbial communities; and how
does the application of urease and nitrification inhibitors root exudates? In recent projects,
researchers have discovered several compounds released from plant root exudates which have
significant nitrification inhibition capacity. These biological nitrification inhibitors may provide an
effective method of increasing the efficiency of N use and reducing N2O emission in future
agricultural systems.

78
Acknowledgements
This three-year PhD study is financially supported by China Scholarship Council, and is further
supported by my supervisor Prof. Dr. Dittert. I greatly thank my supervisor Prof. Dr. Dittert, who
gives me the opportunity to study and work in his group. It’s my great honor that I met him in the
first semester when I came to Göttingen. I thank for his help, his advice, his encouragement and
above all, his patience. I also thank for his valuable suggestions throughout the work, from
designing the experiments to drafting manuscripts. For me, he is the most important person during
my Master and PhD study.
I acknowledge Prof. Dr. Petr Karlovsky for his willingness to be co-supervisor of my thesis and
sincerely appreciate his patient guidance. The corporation with his group is joyful and enlightening.
It’s a pity that I met his group member Lukas Beule too late. His skillfulness, intelligence and
discretion is impressive to me. Of course, with his help, I have also learnt lot of things that is helpful
for my future career.
I am also very grateful to Prof. Dr. Michaela Dippold for kindly accepting to take part of the
examination board. Her lab also helped me to measure soil DOC content, the collaboration is neat
and delightful.
I want to thank all the member of the Department of Plant Nutrition and Crop Physiology and
Institute of Applied Plant nutrition (IAPN), especially thanks to Marlies Niebuhr, Susanne Koch,
Christiane Lüers, Reinhard Hilmer, Jürgen Kobbe, Simona Urstadt, Ulrike Kierbaum and Kirsten
Fladung for their diligent and professional assistance.
I also want to thank my colleague and friend Shutan Ma, without whose advice, I would not have
overcome some seemingly formidable barriers during my scientific career.
My thanks also go to my friend Lingwei Meng who read through my thesis and corrected some
grammatical errors in the writing.
Most of all, I want to express the deepest thanks to my parents and my wife, for their support and
encouragement.

79
E r k l ä r u n g e n
1. Hiermit erkläre ich, dass diese Arbeit weder in gleicher noch in ähnlicher Form bereits anderen Prüfungsbehörden vorgelegen hat. Weiter erkläre ich, dass ich mich an keiner anderen Hochschule um einen
Doktorgrad beworben habe.
Göttingen, den...............................
.............................................................
(Unterschrift)
2. Hiermit erkläre ich eidesstattlich, dass diese Dissertation selbständig und ohne
unerlaubte Hilfe angefertigt wurde.
Göttingen, den..........................................
.......................................................................
(Unterschrift)