Hom M. Pant and Brian S. Fisher Assessing the role of energy technology in mitigating GHG emissions.
Upload
dwayne-hubbardCategory
view
215download
0
Mitigating GHG EmissionsAn EPA Perspective
Georgia Institute of TechnologyMarch 4, 2015
Ken Mitchell, Ph.D.U.S. Environmental Protection Agency
Atlanta, GA
• The Clean Air Act: A 40K foot view
• Some Key EPA Actions on Climate Change Mitigation
• Mobile Sources
• EPA’s Clean Power Plan
• Oil and Gas
• Voluntary Programs
Outline
www.epa.gov/climatechange and www.epa.gov/cleanpowerplan
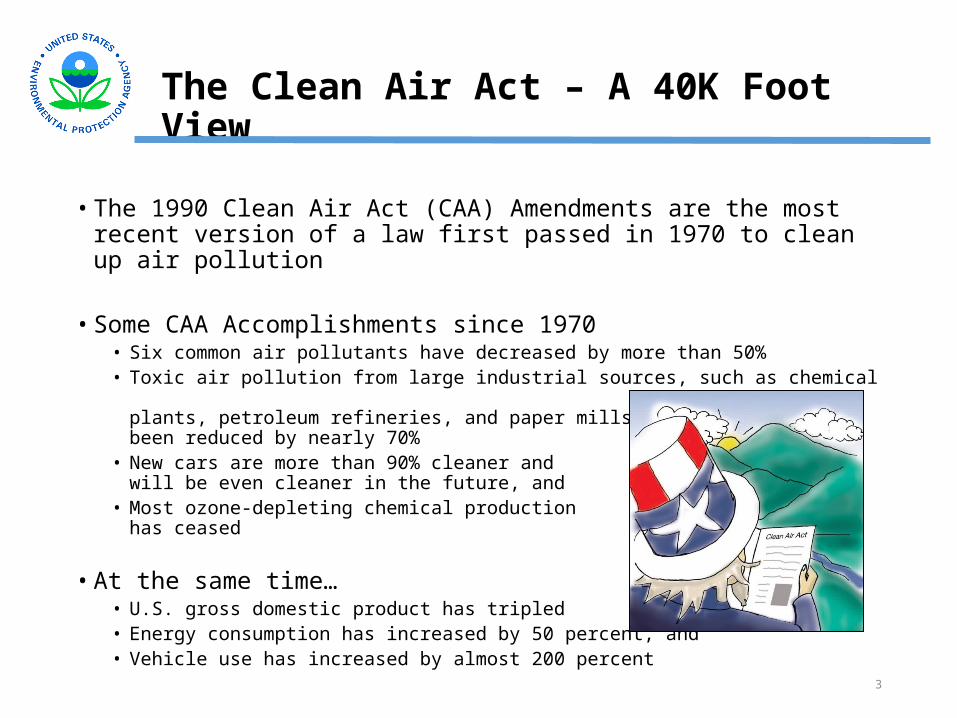
The Clean Air Act – A 40K Foot View
• The 1990 Clean Air Act (CAA) Amendments are the most recent version of a law first passed in 1970 to clean up air pollution
• Some CAA Accomplishments since 1970 • Six common air pollutants have decreased by more than 50%• Toxic air pollution from large industrial sources, such as chemical
plants, petroleum refineries, and paper mills have been reduced by nearly 70%
• New cars are more than 90% cleaner and will be even cleaner in the future, and
• Most ozone-depleting chemical production has ceased
• At the same time… • U.S. gross domestic product has tripled• Energy consumption has increased by 50 percent, and• Vehicle use has increased by almost 200 percent
3
4
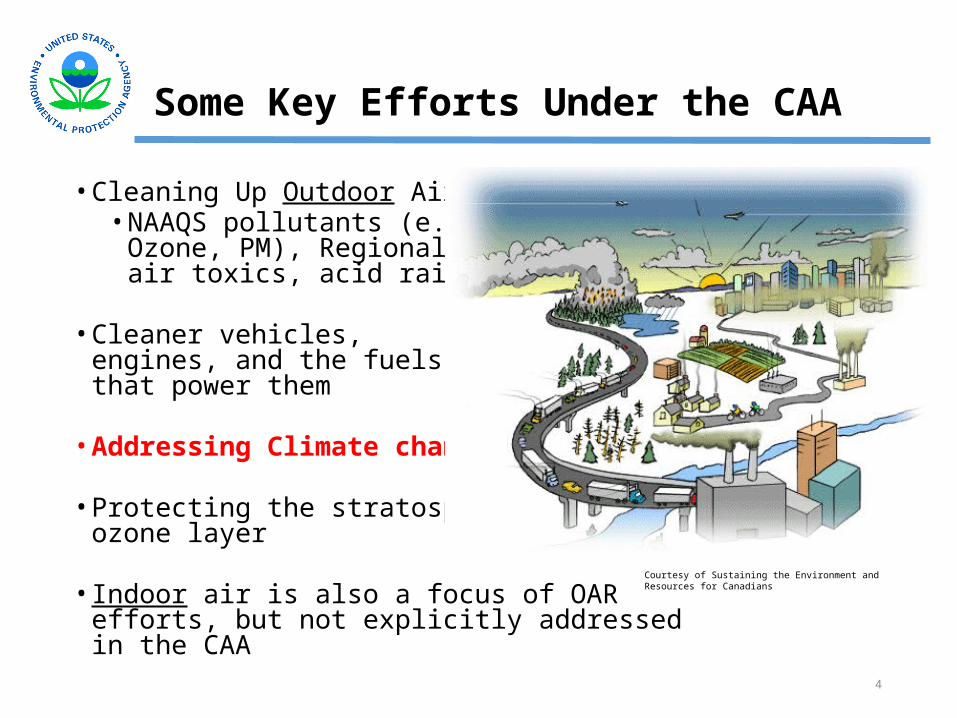
Some Key Efforts Under the CAA
• Cleaning Up Outdoor Air• NAAQS pollutants (e.g.,
Ozone, PM), Regional Haze, air toxics, acid rain
• Cleaner vehicles, engines, and the fuels that power them
• Addressing Climate change
• Protecting the stratosphericozone layer
• Indoor air is also a focus of OARefforts, but not explicitly addressed in the CAA
Courtesy of Sustaining the Environment and Resources for Canadians

CAA Chemicals of Focus
5
CAA
Six Common Pollutants
(Criteria or NAAQS Pollutants)
O3, PM, CO, SO2, NO2, Pb
Hazardous Air Pollutants from
Industry
188 Chemicals and Compounds
Greenhouse Gases
CO2, CH4, N2O, Fluorinated
GasesEmissions from
Cars, Trucks, and Nonroad
Equipment
Diesel Exhaust, Toxic Pollutants,
Greenhouse Gases
Stratospheric O3 Depleting Chemicals
Indoor Air Pollutants*
*Indoor air pollutants are not formally regulated under the CAAOur Focus for Today
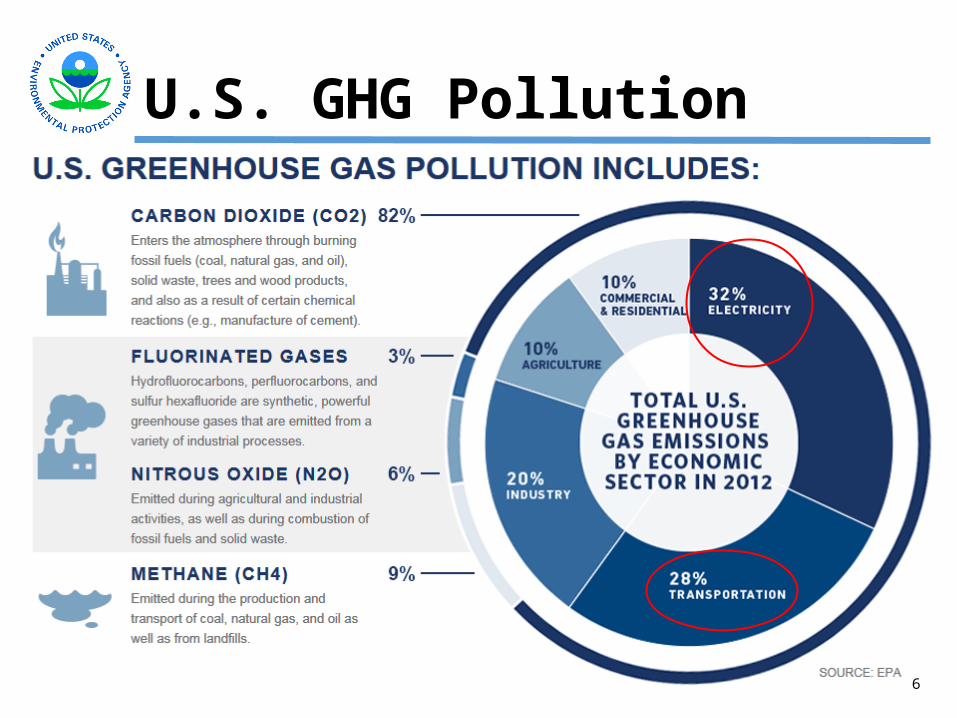
U.S. GHG Pollution
6

7
Early Outreach Informed This ProposalThe U.S. Energy System – It’s Complicated!
EPA Actions to Reduce Carbon Pollution
• Building a 21st century transportation sector
• Cutting energy waste in homes, businesses, and factories
• Reducing methane and HFCs
• Preparing the U.S. for the impacts of climate change
• Helping lead international efforts to address global climate change
• Reducing carbon pollution from power plants (e.g., EPA’s “Clean Power Plan”)8
Mobile Sources
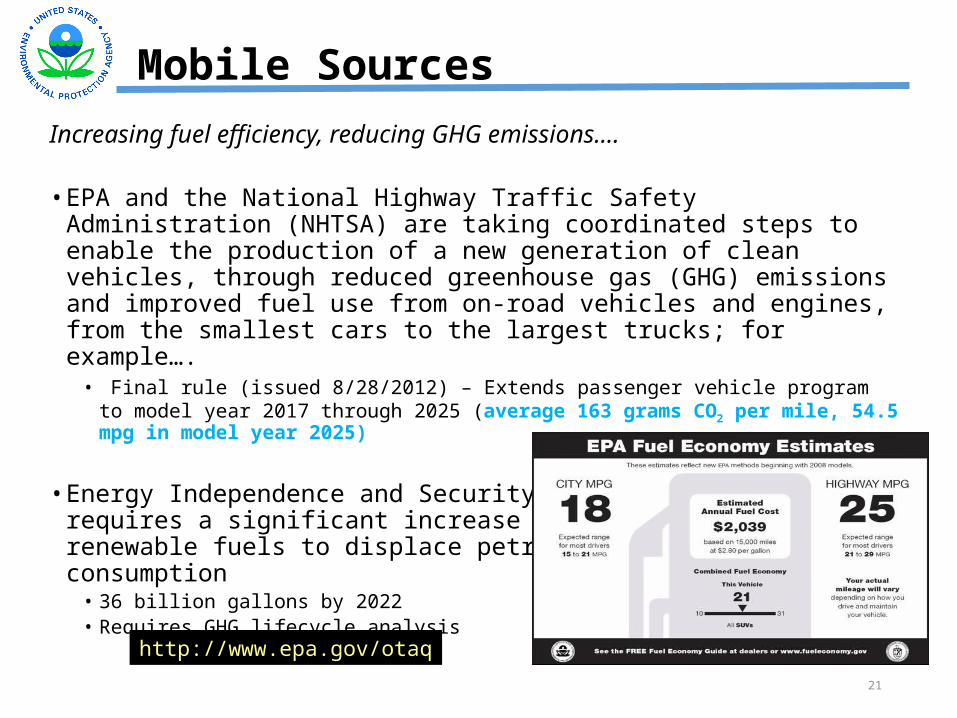
Increasing fuel efficiency, reducing GHG emissions….
• EPA and the National Highway Traffic Safety Administration (NHTSA) are taking coordinated steps to enable the production of a new generation of clean vehicles, through reduced greenhouse gas (GHG) emissions and improved fuel use from on-road vehicles and engines, from the smallest cars to the largest trucks; for example….
• Final rule (issued 8/28/2012) – Extends passenger vehicle program to model year 2017 through 2025 (average 163 grams CO2 per mile, 54.5 mpg in model year 2025)
• Energy Independence and Security Act requires a significant increase in renewable fuels to displace petroleum consumption
• 36 billion gallons by 2022• Requires GHG lifecycle analysis
21
http://www.epa.gov/otaq
Addressing Methane
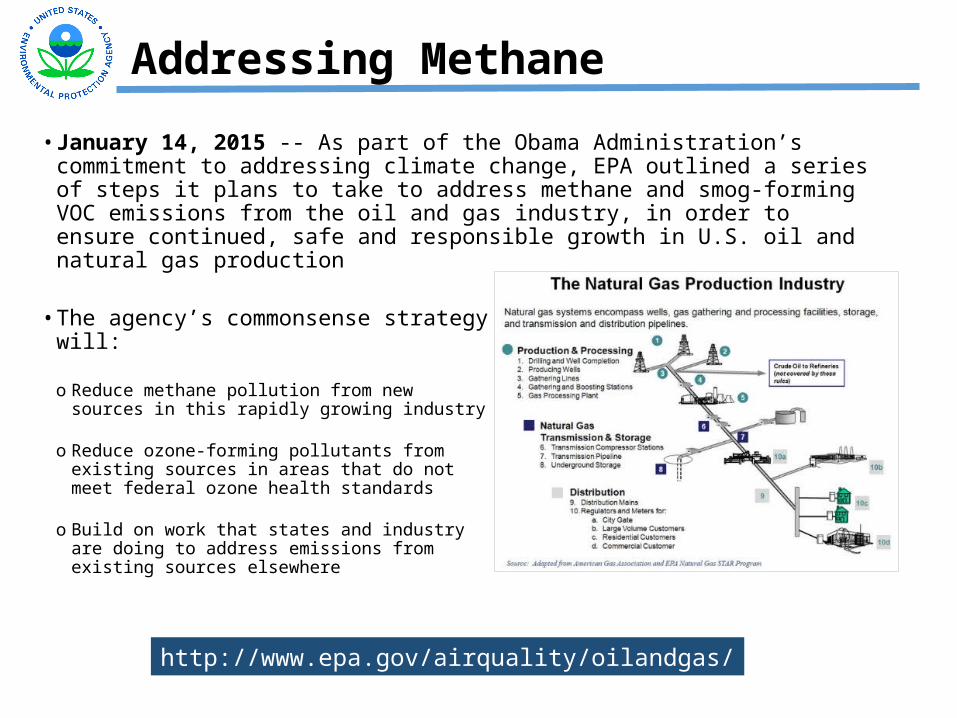
• January 14, 2015 -- As part of the Obama Administration’s commitment to addressing climate change, EPA outlined a series of steps it plans to take to address methane and smog-forming VOC emissions from the oil and gas industry, in order to ensure continued, safe and responsible growth in U.S. oil and natural gas production
• The agency’s commonsense strategy will:
o Reduce methane pollution from new sources in this rapidly growing industry
o Reduce ozone-forming pollutants from existing sources in areas that do not meet federal ozone health standards
o Build on work that states and industry are doing to address emissions from existing sources elsewhere
http://www.epa.gov/airquality/oilandgas/

Mitigation – Multiple Voluntary/Partnership Programs
11

• Our climate is changing, and we’re feeling the dangerous and costly effects right nowo Average temperatures have risen in most states since 1901, with seven of the top 10
warmest years on record occurring since 1998o Climate and weather disasters in 2012 cost the American economy more than $100
billion
• Although there are limits at
power plants for other pollutants like arsenic and mercury, there are currently no national limits on carbon o Children, the elderly, and the
poor are most vulnerable to a range of climate-related health effects, including those related to heat stress, air pollution, extreme weather events, and others
GHG NSPS Requirements for Fossil Fuel-Fired Power Plants
http://www.epa.gov/cleanpowerplan
15
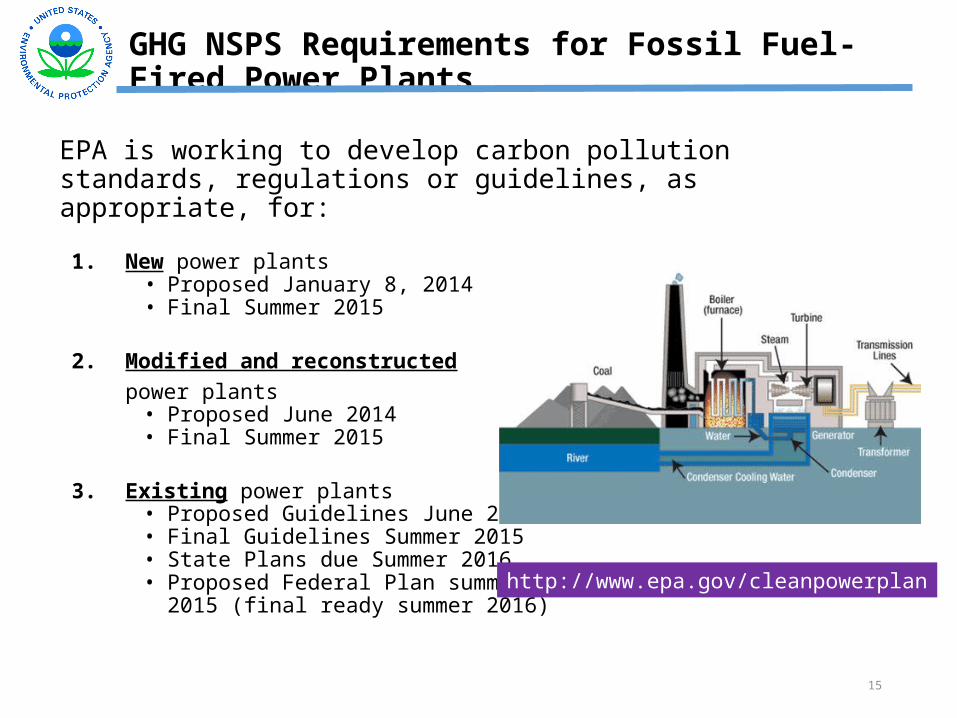
EPA is working to develop carbon pollution standards, regulations or guidelines, as appropriate, for:
1. New power plants• Proposed January 8, 2014• Final Summer 2015
2. Modified and reconstructed power plants
• Proposed June 2014• Final Summer 2015
3. Existing power plants• Proposed Guidelines June 2014• Final Guidelines Summer 2015• State Plans due Summer 2016• Proposed Federal Plan summer
2015 (final ready summer 2016)
GHG NSPS Requirements for Fossil Fuel-Fired Power Plants
http://www.epa.gov/cleanpowerplan
15
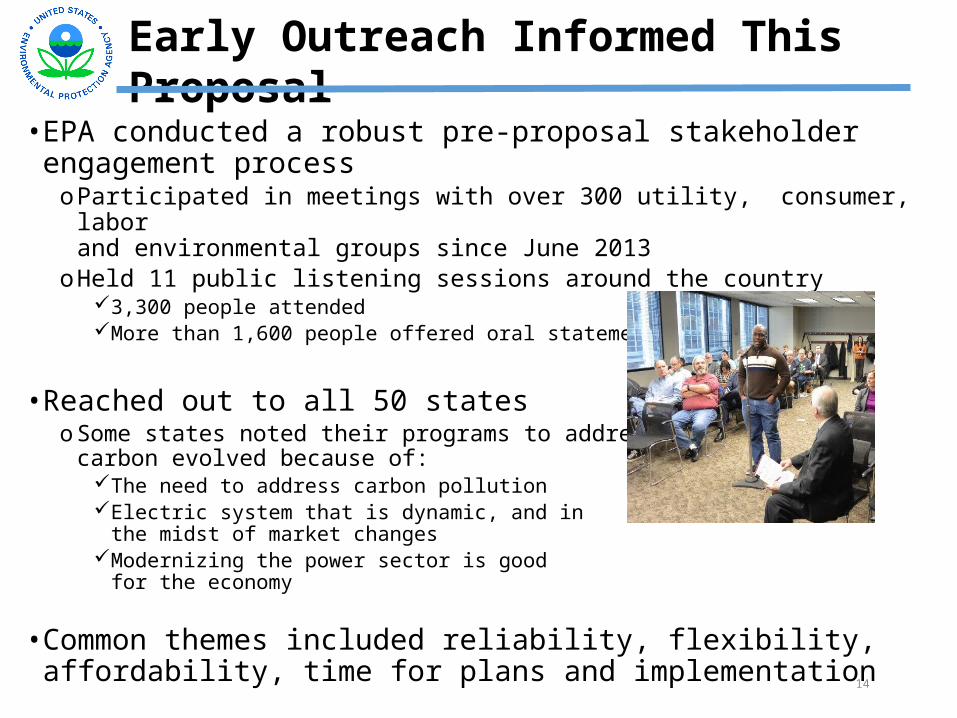
• EPA conducted a robust pre-proposal stakeholder engagement processoParticipated in meetings with over 300 utility, consumer, labor
and environmental groups since June 2013oHeld 11 public listening sessions around the country
3,300 people attendedMore than 1,600 people offered oral statements
• Reached out to all 50 stateso Some states noted their programs to address
carbon evolved because of:The need to address carbon pollutionElectric system that is dynamic, and in
the midst of market changesModernizing the power sector is good
for the economy
• Common themes included reliability, flexibility, affordability, time for plans and implementation
14
Early Outreach Informed This Proposal

This Clean Power Plan (CPP) proposal will:
• Reduce carbon pollution from existing power plants, for which there are currently no national limits
• Maintain an affordable, reliable energy system and will help move us toward a cleaner, more stable environment for future generations
• By 2030, reduce nationwide carbon dioxide emissions, from the power sector by approximately 30% from 2005 levels, with significant reductions to begin by 2020
• Cut hundreds of thousands of tons of harmful particle pollution, sulfur dioxide and nitrogen oxides as a co-benefit
• Proposal will avoid an estimated 2,700 to 6,600 premature deaths and 140,000 to 150,000 asthma attacks in 2030
• Provide important health protections to the most vulnerable, such as children and older Americans
• Lead to health and climate benefits worth an estimated $55 billion to $93 billion in 2030
• From soot and smog reductions alone, for every dollar invested through the Clean Power Plan - - American families will see up to $7 in health benefits
15
Summary - 111(d) Existing Power Plant Proposal
• Build on actions states, cities and businesses across the country are already taking to address the risks of climate change
• Spur investment in cleaner and more efficient technologies, creating jobs and driving innovation
• Require a reasonable emission reduction glidepath starting in 2020
• Provide a flexible timeline—up to 15 years from guideline issuance—for all emission reduction measures to be fully implemented in 2030o Recognizing that investments in infrastructure can take time to put in place and
o Avoiding stranded assets
• Provide an array of tools states can use to formulate approvable plans.
Summary - 111(d) Existing Power Plant Proposal
16
http://www.epa.gov/cleanpowerplan
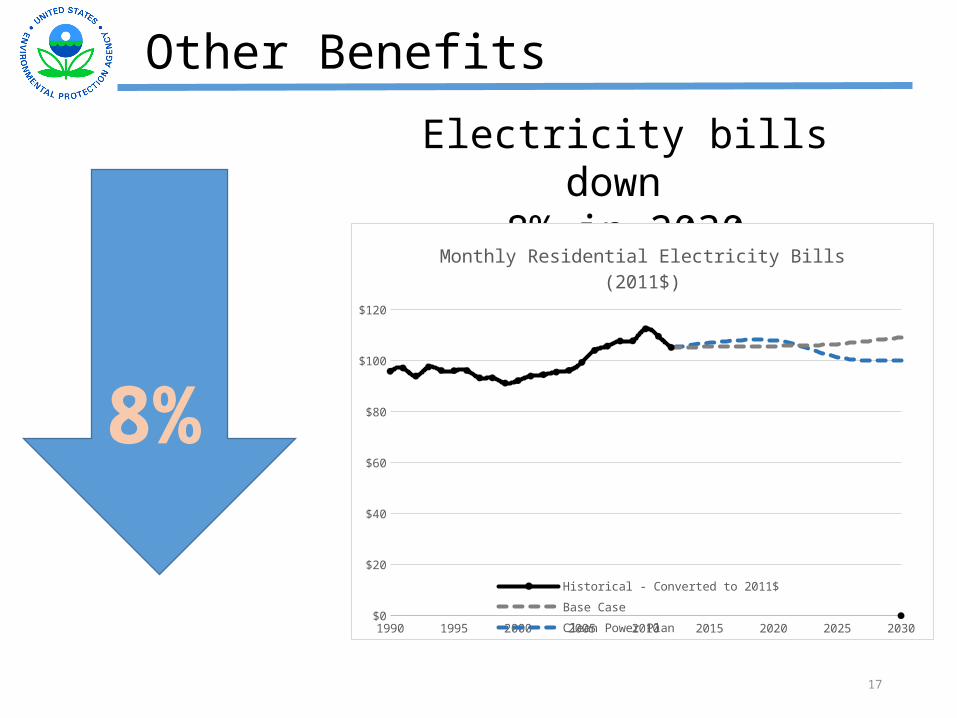
Other Benefits
17
Electricity bills down 8% in 2030
8%
1990 1995 2000 2005 2010 2015 2020 2025 2030$0
$20
$40
$60
$80
$100
$120
Monthly Residential Electricity Bills (2011$)
Historical - Converted to 2011$ Base CaseClean Power Plan
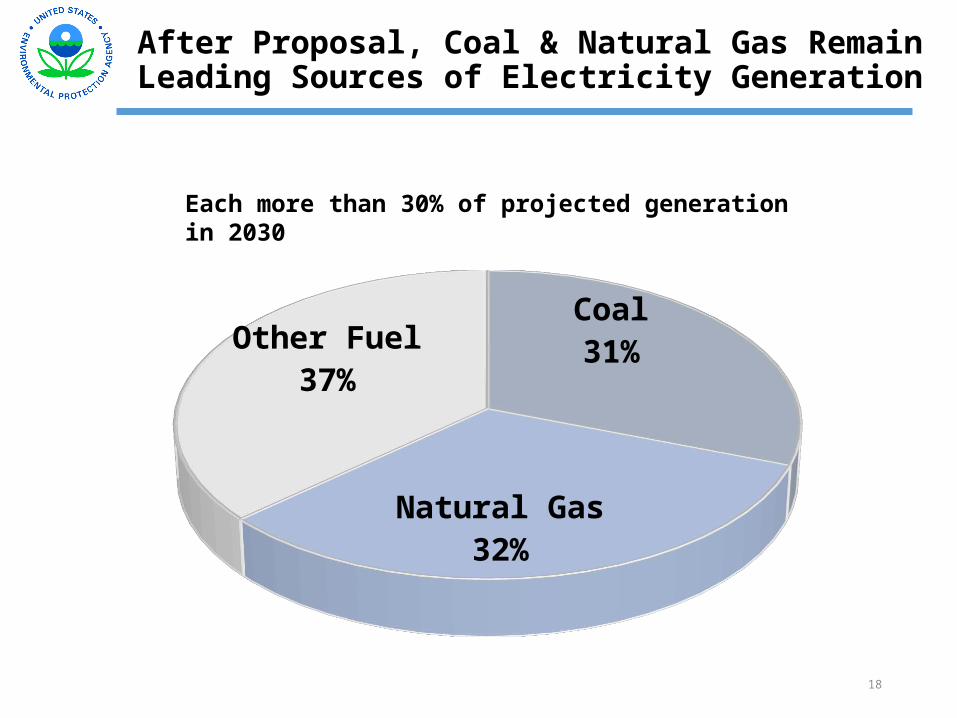
After Proposal, Coal & Natural Gas Remain Leading Sources of Electricity Generation
18
Each more than 30% of projected generation in 2030
Coal31%
Natural Gas32%
Other Fuel37%
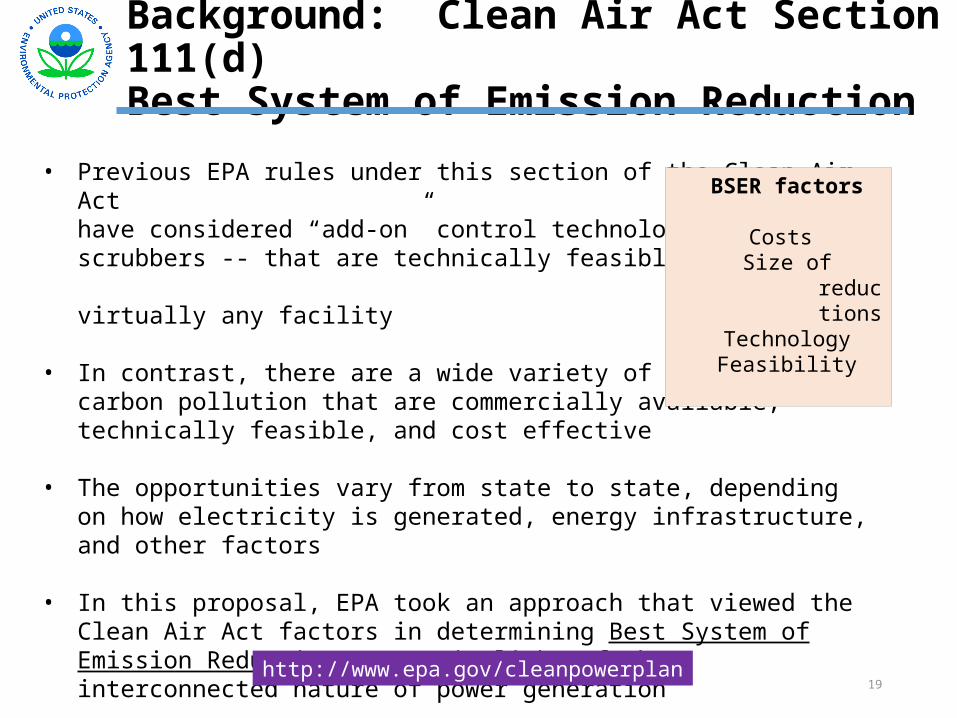
Background: Clean Air Act Section 111(d)Best System of Emission Reduction
19
• Previous EPA rules under this section of the Clean Air Act have considered “add-on” control technologies – like scrubbers -- that are technically feasible to deploy at virtually any facility
• In contrast, there are a wide variety of ways to reducecarbon pollution that are commercially available, technically feasible, and cost effective
• The opportunities vary from state to state, depending on how electricity is generated, energy infrastructure, and other factors
• In this proposal, EPA took an approach that viewed the Clean Air Act factors in determining Best System of Emission Reduction (BSER) in light of the interconnected nature of power generation
http://www.epa.gov/cleanpowerplan
BSER factors
Costs Size of reductions
TechnologyFeasibility
EPA Establishes a Goal for Every State
• EPA analyzed the practical and affordable strategies that states and utilities are already using to lower carbon pollution from the power sector
• Proposed goals are based on a consistent national formula, calculated with state and regional specific information
• Each state goal is expressed as a rate (pounds of CO2 per MWh) – a statewide number for the future carbon intensity of covered existing fossil-fuel-fired power plants in a state
• The state rate goal is calculated to account for the mix of power sources in each state and the application of four “building blocks” that make up the best system of emission reduction
• States will need to meet an interim goal and a final goal 20
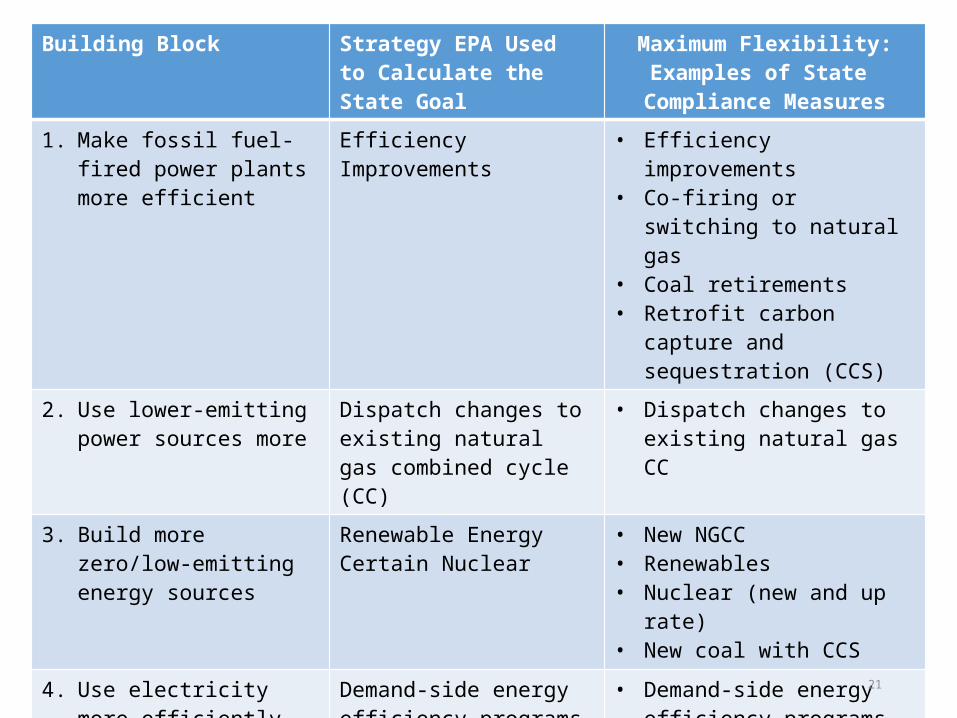
Building Block Strategy EPA Used to Calculate the State Goal
Maximum Flexibility:Examples of State
Compliance Measures
1. Make fossil fuel-fired power plants more efficient
Efficiency Improvements • Efficiency improvements• Co-firing or switching to
natural gas• Coal retirements• Retrofit carbon capture and
sequestration (CCS)
2. Use lower-emitting power sources more
Dispatch changes to existing natural gas combined cycle (CC)
• Dispatch changes to existing natural gas CC
3. Build more zero/low-emitting energy sources
Renewable EnergyCertain Nuclear
• New NGCC• Renewables• Nuclear (new and up rate)• New coal with CCS
4. Use electricity more efficiently
Demand-side energy efficiency programs
• Demand-side energy efficiency programs
• Transmission efficiency improvements
• Energy storage
21
Flexibilities Available To States
• Timing o Up to 15-year window in which to plan for and achieve reductions in carbon pollution o Up to two or three years to submit final plans
• Form of goalo States can use either a rate-based or mass-based goal
• Single or multi-state planso States can collaborate and develop plans on a multi-state basis
• Selection of measures o States will choose how to meet the goal through whatever
collection of measures reflects its particular circumstances and policy objectives
o State measures may impact and, in fact may be explicitly designed to reduce, CO2 emissions from utilities on a regional basis
o EPA would support building off existing reduction programs
22
http://www.epa.gov/cleanpowerplan

States Have Flexibility
Basis for state goal – Potential emissions pathway reflecting EPA’s analysis
2020 2021 2022 2023 2024 2025 2026 2027 2028 2029
A state can choose any trajectory of emission improvement as long as the interim performance goal is met on average over 10 years, and the final goal is met by 2030
23
Car
bon
emis
sion
s fr
om a
ffect
ed p
ower
pl
ants
in a
n ex
ampl
e st
ate
As an example, states could do less in the early years, and more in the later years, as long as on average it meets the goal
Timing of Power Plant Emission Reductions
When States Plan, They Can…
• Look broadly across the power sector for strategies that get reductions
• Choose to rely to varying degrees on measures that EPA used to calculate the goal, or on other measures that were not part of the state goal-setting analysis
• Invest in existing energy efficiency programs or create new ones
• Consider market trends toward improved energy efficiency and a greater reliance on lower carbon energy
• Tap into investments already being made to upgrade aging infrastructure
• Expand renewable energy capacity
• Integrate their plans into existing power sector planning processes
• Design plans that use innovative, cost-effective regulatory strategies
• Develop a state-only plan or collaborate with each other to develop plans on a multi-state basis
• Decide how to treat plants nearing the end of their useful life and how to help plants avoid “stranded investments”
24
25
By June 30, 2016State submits initial multi-state plan and request for
2-year extension
EPA reviews initial plan and determines if
extension is warranted
by June 30, 2017State submits progress
report of plan
by June 30, 2018States submits multi-
state plan
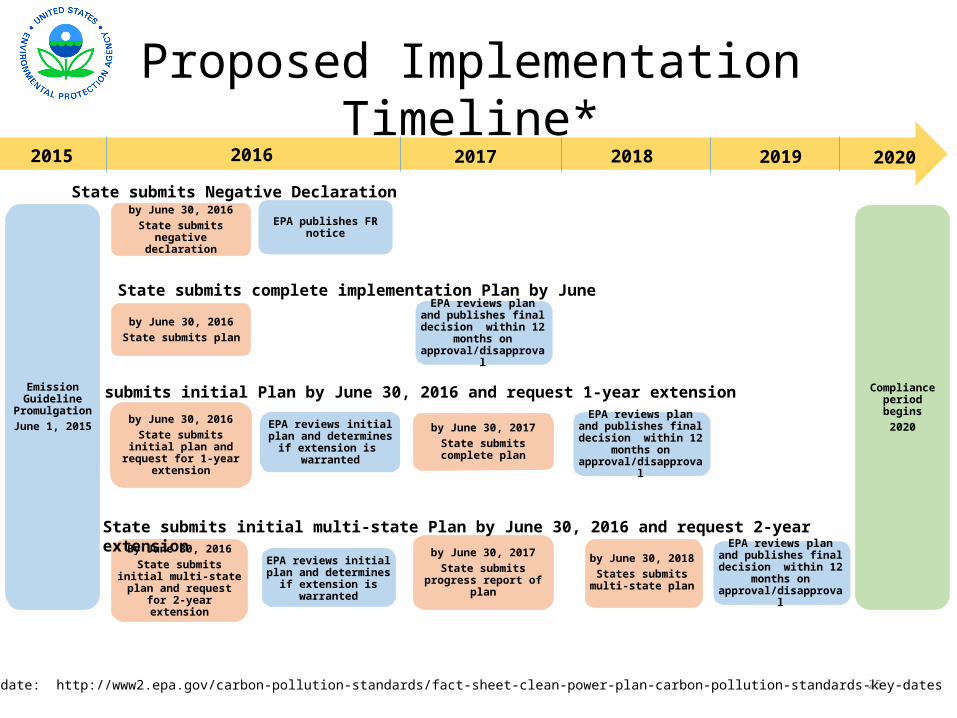
State submits Negative Declaration
State submits complete implementation Plan by June 30, 2016
State submits initial Plan by June 30, 2016 and request 1-year extension
State submits initial multi-state Plan by June 30, 2016 and request 2-year extension
Emission Guideline
PromulgationJune 1, 2015
by June 30, 2016State submits negative
declarationEPA publishes FR notice
by June 30, 2016State submits plan
by June 30, 2016State submits initial plan
and request for 1-year extension
EPA reviews initial plan and determines if extension is
warranted
by June 30, 2017State submits complete plan
2015 2019
Proposed Implementation Timeline*
Compliance period begins
2020
2020
EPA reviews plan and publishes final decision
within 12 months on approval/disapproval
EPA reviews plan and publishes final decision
within 12 months on approval/disapproval
EPA reviews plan and publishes final decision
within 12 months on approval/disapproval
2016 2017 2018
*See Update: http://www2.epa.gov/carbon-pollution-standards/fact-sheet-clean-power-plan-carbon-pollution-standards-key-dates

Actions since the proposal
• October 28, 2014 - EPA issued a supplemental proposal to its proposed CPP that sets area-specific goals for Indian country and territories
• October 28, 2014 - EPA issued a Notice of Data Availability (NODA) related to the proposed CPP
• November 6, 2014 – EPA issued a Technical Support Document (TSD) on converting rate-to-mass
• November 19, 2014 – EPA issued second draft of Framework for Assessing Biogenic Carbon Dioxide for Stationary Sources and associated memo from Janet McCabe
26

During the comment period….
• The proposed rule and supporting technical information, are available online at: http://www.epa.gov/cleanpowerplan
• EPA held 4 public hearings the week of July 28th in Denver, Atlanta, Pittsburgh and Washington, D.C. – over 2,700 people attended
• Comments on the CPP proposed rule and NODA closedDecember 1, 2014; almost 4 million comments received
• Comments on the proposal are identified by Docket ID Number: EPA-HQ-OAR-2013-0602
27