Ministry of Finance and Na Release Date: December, 2012 At ...
3
Ministry of At a G HIGHLI • T p w • T m p ra U H co • E p 1 p fu • T m ce S C • T p in co b • T m la fa 1 Source f Finance and Na Glance- IGHTS The annual revious m which offse Total cash r mainly for rofit organ ate in Aust US and NZ However th ompared to Export rece roceeds fro ,500 tonne revious mo uel and con Tourism re mainly supp ertain even how, Don Conference The level o revious m ncrease in overage re alance of g Total recurr mainly due arge busine all in intere e: Quaranti ational Planning -Octob inflation r onth, whic et a fall in d remittance household nizations. D tralia coup dollars; co his slight o October m eipts increa om agricul es 1 were ex onth. Impo nstruction m ceipts reco ported by nts that m nors Foru . of foreign month main remittanc emained th goods durin rent revenu to an incre esses. On t est paymen ine g er 2012 rate record ch was ma domestic p s slightly p recipients During the led with a ontributed pick up in months of ased in Oc ltural prod xported in orts paymen materials. orded an i an increa may have a um Meetin reserves s nly due to ces. And d e same at ng the sam ue improve ease in rec the other h nts on publ 1 2 ded 1.2% i ainly drive ower and i picked up s, which of e same per depreciati to the incr n remittan previous y ctober 2012 ducts – par October 2 nts howeve increase in se in usag also contrib ng and th slightly de o import p despite the 8.1 month me period. ed in Octo ceipts from hand, recur ic debts, w n October en by local imported fo in October ffset a 30% riod, a slig on of the T rease in the nces in Oc years. 2 from the rticularly s 012 compa er declined n October ge of forei buted, inc he Pacific eclined in payments f e decline s, mainly s ober 2012 c m income a rrent expen which is not Release Da 2012 com l food and ood prices. r 2012 from % decline i ht decline Tongan Pa e October 2 ctober 201 e previous quash exp ared to aro d mainly du 2012 from ign credit luded the Maritime October 2 for oil wh in reserve supported b compared and corpora nditure dec t unusual d ate: December, 2 mpared to - d imported . m the prev in remittan in the une a’anga agai 2012 cash 12 still rem month ma orts, where ound 700 to ue to lowe m the prev card trans National A e Transpo 2012 comp hich more es, months by the imp to the prev ate tax from clined main during this 2012 -0.6% in th d fuel price vious month nces to non employmen inst both th remittance mains wea ainly due t e more tha onnes in th er imports o vious mont sactions an Agricultur ort Allianc pared to th than offs s of impo proved trad vious mont m small an nly due to period. he es h, n- nt he es. ak to an he of th nd al ce he et ort de th nd a
Transcript of Ministry of Finance and Na Release Date: December, 2012 At ...

Ministry of
At a G
HIGHLI
• Tpw
• TmpraUHco
• E
p1pfu
• TmceSC
• Tpincob
• Tmlafa
1Source
f Finance and Na
Glance-
IGHTS
The annual revious m
which offse
Total cash rmainly for
rofit organate in Aust
US and NZ However thompared to
Export receroceeds fro,500 tonnerevious mouel and con
Tourism remainly suppertain evenhow, Don
Conference
The level orevious mncrease in overage realance of g
Total recurrmainly due arge busineall in intere
e: Quaranti
ational Planning
-Octob
inflation ronth, whic
et a fall in d
remittancehousehold
nizations. Dtralia coupdollars; co
his slight o October m
eipts increaom agricules1 were exonth. Imponstruction m
ceipts recoported by nts that mnors Foru.
of foreign month main
remittancemained thgoods durin
rent revenuto an incre
esses. On test paymen
ine
g
er 2012
rate recordch was madomestic p
s slightly precipients
During theled with a ontributed pick up inmonths of
ased in Ocltural prodxported in orts paymenmaterials.
orded an ian increa
may have aum Meetin
reserves snly due toces. And de same at ng the sam
ue improveease in recthe other hnts on publ
1
2
ded 1.2% iainly driveower and i
picked up s, which ofe same per
depreciatito the incrn remittanprevious y
ctober 2012ducts – parOctober 2nts howeve
increase inse in usag
also contribng and th
slightly deo import pdespite the8.1 month
me period.
ed in Octoceipts fromhand, recuric debts, w
n October en by localimported fo
in Octoberffset a 30%riod, a sligon of the T
rease in thences in Ocyears.
2 from therticularly s012 compaer declined
n October ge of foreibuted, inc
he Pacific
eclined in payments fe decline s, mainly s
ober 2012 cm income arrent expen
which is not
Release Da
2012 coml food andood prices.
r 2012 from% decline iht decline Tongan Pae October 2ctober 201
e previous quash expared to arod mainly du
2012 fromign credit luded the
Maritime
October 2for oil whin reserve
supported b
compared and corporanditure dect unusual d
ate: December, 2
mpared to -d imported.
m the previn remittanin the une
a’anga agai2012 cash 12 still rem
month maorts, where
ound 700 toue to lowe
m the prevcard transNational A
e Transpo
2012 comphich more es, monthsby the imp
to the prevate tax fromclined mainduring this
2012
-0.6% in thd fuel price
vious monthnces to nonemploymeninst both thremittancemains wea
ainly due te more thaonnes in th
er imports o
vious montsactions anAgricultur
ort Allianc
pared to ththan offs
s of impoproved trad
vious montm small annly due toperiod.
he es
h, n-nt he es. ak
to an he of
th nd ral ce
he et
ort de
th nd
a
Ministry of Finance and National Planning Release Date: December, 2012
2
2Nominal GDP 2012/13: T$784.5 million (estimate) 3Note there is difficulty in separation of tourism receipts from private remittances
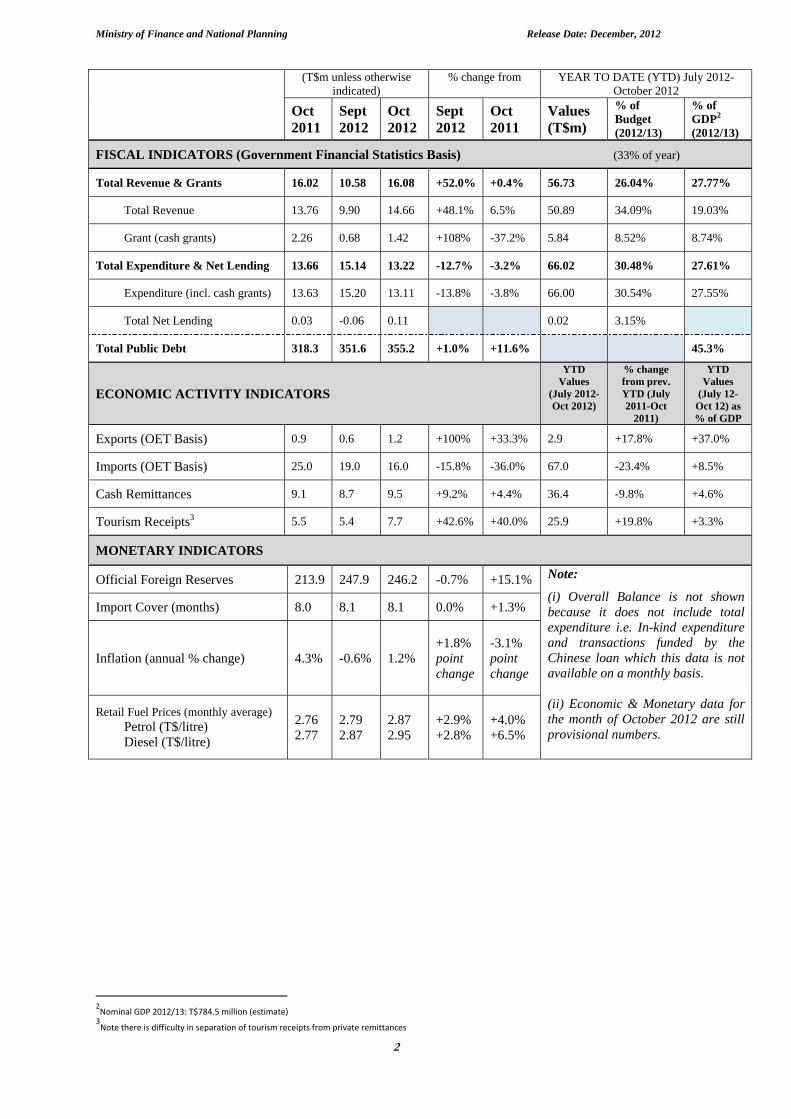
(T$m unless otherwise indicated)
% change from YEAR TO DATE (YTD) July 2012-October 2012
Oct 2011
Sept 2012
Oct 2012
Sept 2012
Oct 2011
Values (T$m)
% of Budget (2012/13)
% of GDP2 (2012/13)
FISCAL INDICATORS (Government Financial Statistics Basis) (33% of year)
Total Revenue & Grants 16.02 10.58 16.08 +52.0% +0.4% 56.73 26.04% 27.77%
Total Revenue 13.76 9.90 14.66 +48.1% 6.5% 50.89 34.09% 19.03%
Grant (cash grants) 2.26 0.68 1.42 +108% -37.2% 5.84 8.52% 8.74%
Total Expenditure & Net Lending 13.66 15.14 13.22 -12.7% -3.2% 66.02 30.48% 27.61%
Expenditure (incl. cash grants) 13.63 15.20 13.11 -13.8% -3.8% 66.00 30.54% 27.55%
Total Net Lending 0.03 -0.06 0.11 0.02 3.15%
Total Public Debt 318.3 351.6 355.2 +1.0% +11.6% 45.3%
ECONOMIC ACTIVITY INDICATORS
YTD Values
(July 2012-Oct 2012)
% change from prev. YTD (July 2011-Oct
2011)
YTD Values
(July 12-Oct 12) as % of GDP
Exports (OET Basis) 0.9 0.6 1.2 +100% +33.3% 2.9 +17.8% +37.0%
Imports (OET Basis) 25.0 19.0 16.0 -15.8% -36.0% 67.0 -23.4% +8.5%
Cash Remittances 9.1 8.7 9.5 +9.2% +4.4% 36.4 -9.8% +4.6%
Tourism Receipts3 5.5 5.4 7.7 +42.6% +40.0% 25.9 +19.8% +3.3%
MONETARY INDICATORS
Official Foreign Reserves 213.9 247.9 246.2 -0.7% +15.1% Note:
(i) Overall Balance is not shown because it does not include total expenditure i.e. In-kind expenditure and transactions funded by the Chinese loan which this data is not available on a monthly basis.
(ii) Economic & Monetary data for the month of October 2012 are still provisional numbers.
Import Cover (months) 8.0 8.1 8.1 0.0% +1.3%
Inflation (annual % change) 4.3% -0.6% 1.2% +1.8% point change
-3.1% point change
Retail Fuel Prices (monthly average) Petrol (T$/litre) Diesel (T$/litre)
2.76 2.77
2.79 2.87
2.87 2.95
+2.9% +2.8%
+4.0% +6.5%

Ministry of Finance and National Planning Release Date: December, 2012
3
0
1
2
3
4
5
6
7
8
9
T$millions
Figure 1: Consumer Price Index (Inflation)
Figure 2: Retail Fuel Prices (monthly average)
Figure 3: Cash Remittances
Source: National Reserve Bank of Tonga
Source: Tonga Bureau of Statistics
Source: National Reserve Bank of Tonga
Figure 4: Cash remittances for October months in previous years
Source: Tonga Bureau of Statistics
Figure 5: Foreign Reserves & Import Coverage
Figure 6: Balance of Trade (OET Basis)
Source: National Reserve Bank of Tonga
Source: National Reserve Bank of Tonga
Figure 8: Tongan Pa’anga Exchange Rates
Source: National Reserve Bank of Tonga
Figure 7: Tourism Receipts
Source: National Reserve Bank of Tonga
Source: National Reserve Bank of Tonga
Source: Tonga Bureau of Statistics
‐2.0%
0.0%
2.0%
4.0%
6.0%
8.0%
10.0%
Oct‐11 Dec‐11 Feb‐12 Apr‐12 Jun‐12 Aug‐12 Oct‐12
Annual % Change
Local Items
Imported Items
All Items
2.0
2.2
2.4
2.6
2.8
3.0
3.2TOP$/litre
Petrol Diesel
0
2
4
6
8
10
12
14
16
TOP $m
Non‐profit organizations Household
0
5
10
15
20
25
Oct‐07 Oct‐08 Oct‐09 Oct‐10 Oct‐11 Oct‐12
TOP%millions
‐30
‐20
‐10
0
10
20
30
T$millions
Balance of Trade Export (OET Basis) Import (OET Basis)
0
1
2
3
4
5
6
7
8
9
10
100
150
200
250
300
Mon
ths of Im
port Coverage
TOP$m
Gross Foreign Reserves (LHS)
Import Cover
0.30
0.40
0.50
0.60
0.70
0.80
0.90
USD NZD AUD