MINISTRY FOR THE CIVIL SERVICE - Fonction publique
16
FACTS AND FIGURES thématiques Dossiers, analyses x%±¾€ DIRECTORATE GENERAL FOR ADMINISTRAT ION AND THE CIVIL SERVICE ANNUAL REPORT The French Civil Service Key Figures for 2016 MINISTRY FOR THE CIVIL SERVICE
Transcript of MINISTRY FOR THE CIVIL SERVICE - Fonction publique
FACTS AND FIGURES
thém
atiq
ues
Dos
sier
s, a
naly
ses
x%±¾€
D I R E C T O R AT E G E N E R A L F O R A D M I N I S T R AT I O N A N D T H E C I V I L S E R V I C E
ANNUAL REPORT
The French Civil Service
Key Figures for 2016
MINISTRY FOR THE CIVIL SERVICE
Key civil service figures
As at 31 December 2014, there were 5.448 million staff employed in the three branches of the civil service, excluding 192,300 people on government-subsidised employment contracts. They accounted for 20% of all workers (salaried and non-salaried) in metropolitan France and the French overseas départements.
2.393 million employees worked in the state civil service (FPE), i.e. 43.9% of total civil servants: 79.9% in ministerial departments and 20.1% in national government-funded administrative institutions (EPA).
1.895 million employees worked in the local civil service (FPT), i.e. 34.8% of total civil servants. Three-quarters worked in the regions, départements and communes of France and one-quarter worked in local government-funded administrative institutions (EPA).
1.161 million employees worked in the hospital civil service (FPH), i.e. 21.3% of total civil servants: 88.4% work in hospitals, 8.3% in residential homes for the elderly and 3.4% in other medical-social establishments.
The rate of representation across the three branches of the civil service (excluding the armed forces and government-subsidised employment contracts) was 72 civil servants per 1,000 inhabitants in metropolitan France and the French overseas départements: 82 per thousand in the Greater Paris region, 84 per thousand in the French overseas départements and 69 per thousand in the rest of France.
Staff levels across all three branches rose by 0.3% from 2013 to 2014, with more or less marked shifts depending on the branch: -0.3% in the FPE, +0.8% in the FPT and +0.7% in the FPH. At end-2014, the number of government-subsidised employment contracts had recorded a relative increase of +14% (compared to +43% between end-2012 and end-2013).
Excluding government-subsidised employment contracts, the three branches employed 3,844,300 established civil servants, 942,600 non-established civil servants, 303,400 military personnel and 358,100 employees classified under “other grades and categories” (including 141,600 teachers and librarians in private schools under government contract).
In the three branches, 34% of staff were A grade employees (including 2% A+), 20% B grade and 46% C grade. In the FPE, 55% of staff were A grade employees (including 4% A+), 25% were B grade and 20% were C grade. In the FPT, 9% of staff were A grade employees (including 0.6% A+), 14% B grade and 76% C grade. In the FPH, 32% were A grade (including 0.5% A+), 20% B grade and 49% C grade.
The average age of FPH employees is 41.5 compared to 42.3 for FPE employees and 44.6 for FPT employees. The three branches employed 62% female staff (compared to 46% in the private sector), the FPE 55% (including military personnel), the FPT 61% and the FPH 78%.
In the three branches, 24% of established female civil servants worked part-time compared to 5% of male staff. In 2014, female staff members held 40% of management and executive (A+) positions (including 34% in executive and senior executive functions): 38% in the FPE (including 31% in executive and senior executive functions), 52% in the FPT (including 28% in executive and senior executive functions) and 45% in the FPH (all in executive and senior executive functions).
Internal competitive examinations or equivalent: 20,709 people in 2014 in the FPE and 27,699 in the FPT. External competitive examinations or equivalent for the FPE in 2014: 45,867 staff recruited (92.2% by external competitive examination).
66.8% of external recruitments were female. Level of education of staff recruited in the FPE: 79,4% of recruits were for A grade positions, 93% of which require a PhD or Master’s qualification. 24.2% of candidates admitted to B grade positions had a baccalauréat plus four or more years of higher education (required level: baccalauréat to baccalauréat plus three years of higher education); 68.3% of grade C recruits had a baccalauréat or higher (required level: lower secondary school certificate) (figures are incomplete since the level of education is unknown for 24.4% of B grade recruits and 10.4% of C grade recruits).
The FPT, City of Paris and City of Paris Social Services Centre (CASVP) recruited 30,687 employees through external competitive examinations or equivalent in 2014.
A total of 41,344 new pensions were paid in 2015 to established civilian civil servants from the FPE, 11,193 to military personnel, 2,136 to state operatives, 33,167 to established civil servants from the FPT and 21,026 to established civil servants from the FPH (excluding hospital doctors).
The average age at which pensions were paid to FPE retirees (excluding La Poste and France Télécom) was 61.6 years old in 2015.
At 31 December 2015, 2.8 million direct entitlement pensions were paid across all three branches by the Public Pensions Service (excluding La Poste and France Télécom), the National Pension Fund for Local Government Employees (CNRACL) and the National Pension Scheme for State operatives (FSPOEIE).
Average monthly direct entitlement pension paid in 2015: 1,781 euros for all three branches. Average monthly net salary in 2014: 2,205 euros across all three branches; 2,477 euros in the FPE (ministries and government-funded administrative institutions); 1,877 euros in the FPT; 2,223 euros in the FPH. Private sector: 2,226 euros.
Between 2013 and 2014, the average per capita wage (SMPT) across all three branches fell by 0.2% in current euros; the average net salary for civil servants who had been in the same position for two years (RMPP) improved 1.9% in current euros; in the FPE (ministerial departments and government-funded administrative institutions), the average per capita wage decreased by 0.2% in current euros, while the average net salary for civil servants who had been in the same position for two years (RMPP) grew by 1.6% in current euros. In the FPT, the average per capita wage (SMPT) and the RMPP increased respectively 0.8% and 2.1% in current euros. In the FPH, the average per capita wage (SMPT) contracted by 0.3% in current euros over the same period, while the RMPP increased 1.5% in current euros.
Gross grade-related remuneration growth spread in the FPE (2010-2014): 12.8% of staff received a wage rise (in current euros) below the rate of inflation (4.3% including tobacco); half received a raise of over 7.9%; and the wages of 10% of the staff increased more than 15.2%.
Average annual increase in the gross salary index-grade-related pay scale (ITB-GI) +0.3% in 2014. Civil servants’ salary grading: stable since July 2010. Taking the definition of mobility as a change of employer, employment area or category (or employment situation), among the staff working in the civil service in 2013 and 2014, 8.5% were mobile in 2014, 4% changed public employer (0.6% of whom changed branch), 3.9% changed employment area and 3.2% changed category or employment situation. Some 0.9% of established civilian civil servants changed grade in 2014.
At the end of 2014, 8.3% of state civil servants were no longer working in their initial administration (permanent positions).
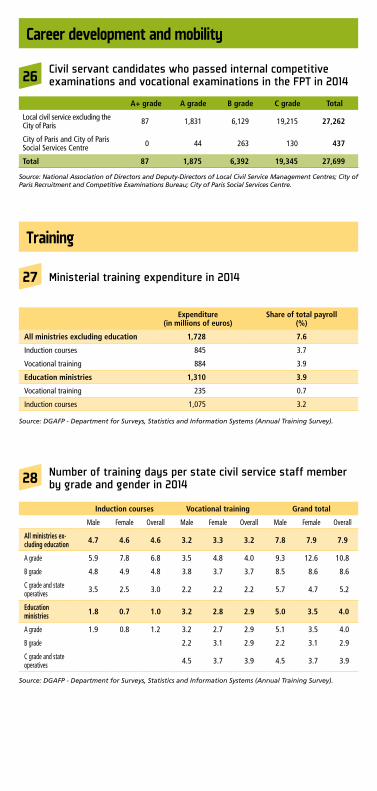
Ministerial training expenditure in 2014, excluding education: 1.7 billion euros, equivalent to 7.6% of payroll. In the three civil service branches, 36.7% of civil service staff worked on Sundays and public holidays (even occasionally) and 17.5% worked nightshift.

Staff in the three civil service branches
Civil service, public service and total employment in France (metropolitan France and French overseas départements) as at 31 December 2014
1
Sources: Information System on Civil Servants (SIASP), Annual Payroll Declaration (DADS), Recme, INSEE. Data processed by DGAFP - Department for Surveys, Statistics and Information Systems.Coverage: Main positions in all civil service staff categories in France (Metropolitan France and French overseas départements, excluding overseas authorities and foreign countries), excluding Mayotte. Excluding government-subsidised employment contracts.
Private sector employees outside the civil service 75.1%
Civil service excluding subsidised positions
20.0%
Subsidised positions within the civil service
0.7%
Public organisations outside the civil service
0.7%
Predominantly state-�nanced private organisations 1.3%
State-owned companies 2.2%
Breakdown of staff among the three civil service branches in 20142
Sources: Information System on Civil Servants (SIASP), INSEE. Data processed by DGAFP- Department for Surveys, Statistics and Information Systems.Coverage: Main positions in all civil service staff categories in France (Metropolitan France and French overseas départements, excluding overseas authorities and foreign countries), excluding Mayotte. Excluding government-subsidised employment contracts.
State civil service (ministerial departments)
1,911,702 (35.1%)
State civil service (EPA – government-funded administrative institutions)
480,877 (8.8%)
Local civil service 1,894,655 (34.8%)
Hospital civil service 1,161,087 (21.3%)
Individual staff numbers in the three civil service branches in 2014 and full time equivalents (FTE) (in millions)3
Source: SIASP (Information System on Civil Servants), INSEE. Data processed by DGAFP - Department for Surveys, Statistics and Information Systems.Coverage: Main positions in all civil service staff categories in France (Metropolitan France and French overseas départements, excluding overseas authorities and foreign countries), excluding Mayotte. Excluding government-subsidised employment contracts.
Ministerial departments and local/regional
authorities
Staff in government-funded administrative institutions recruited with public employee
status
Total
Total FTE Total FTE Total FTE
FPE 1,911,702 1,844,050 480,877 436,743 2,392,579 2,280,793
Civilian civil servants
1,609,425 1,544,908 479,762 435,673 2,089,187 1,980,581
Military personnel 302,277 299,142 1,115 1,071 303,392 300,212
FPT 1,411,608 1,281,384 483,038 432,909 1,894,646 1,714,293
FPH 1,161 087 1,075,517 1,161,087 1,075,517
Total civil service 3,323,310 3,125,434 2,125,002 1,945,170 5,448,312 5,070,603

Staff in the three civil service branches
Change in staffing levels in the three civil service branches since 2004 (Base: 100 in 2004)4
Source: INSEE – Civil Servants Payroll File Data (FGE), Survey of Employees of Local Authorities and Local Public Institutions (COLTER), Annual Payroll Declaration (DADS) and Information System on Civil Servants (SIASP). DREES: Annual Statistical Survey of Healthcare Establishments (SAE). Data processed by DGAFP- Department for Surveys, Statistics and Information Systems.Coverage - All three civil service branches: main positions in all civil service staff categories. Metropolitan France and French overseas départements (excluding overseas authorities and foreign countries), excluding Mayotte. Excluding government-subsidised employment contracts.Coverage - All employees: salaried and non-salaried staff in the public and private sectors, including government-subsidised employment contracts.
80
90
100
110
120
130
140
2004 2005 2006 2007 2008 2009 2010 2011 2012 2013(2) 2014
FPE
FPT
FPH
Ensemble FP
Emploi total(1)
Change in average annual staffing levels 2014/2004FPE: -0.9% FPT: 2.0% FPH: 1.0% All three: 0.4% Total employees: 0.4%
Change 2014/2013 FPE: -0.3% FPT: 0.8% FPH: 0.7% All three: 0.3 % Total employees: 0.1%
Rate of representation by département as at 31 December 20145
Source: SIASP (Information System on Civil Servants), INSEE. Data processed by DGAFP-DES.Coverage: main positions in all civil service staff categories.Rate of representation in France as a whole = 72,1‰ Rate of representation in Metropolitan France = 71.8‰
Source: SIASP (Information System on Civil Servants), INSEE. Data processed by DGAFP-DES. Coverage: main civilian positions (ex. military personnel), excluding government-subsidised employment contracts.Rate of representation in France as a whole = 29.9‰ Rate of representation in Metropolitan France = 29.8‰
Rate of representation in the three civil service branches by département as at 31 December 2014
Rate of representation for the state civil service by département as at 31 December 2014
Source: SIASP (Information System on Civil Servants), INSEE. Data processed by DGAFP-DES.Coverage: main positions in all civil service staff categories.Rate of representation in France as a whole = 25.9‰Rate of representation in Metropolitan France = 25.6‰
Source: SIASP (Information System on Civil Servants), INSEE. Data processed by DGAFP-DES. Coverage: main positions in all civil service staff categories. Rate of representation in France as a whole = 16.3‰Rate of representation in Metropolitan France = 16.3‰
Rate of representation for the local civil service by département as at 31 December 2014
Rate of representation for the hospital civil service by département as at 31 December 2014
67 à 73
80 à 13973 à 80
63 à 6745 à 63
25 à 27
31 à 4527 à 31
23 à 2515 à 23
25 à 30
34 à 8230 à 34
23 à 2517 à 23
18 à 19
22 à 3019 à 22
14 à 189 à 14

Staff in the three civil service branches
Breakdown by staff grade in the three civil service branches in 2014(in %)6
Source : SIASP (Information System on Civil Servants), INSEE. Data processed by DGAFP - Department for Surveys, Statistics and Information Systems.Coverage: Main positions in all civil service staff categories in France (Metropolitan France and French overseas départements, excluding overseas authorities and foreign countries), excluding Mayotte. Excluding government-subsidised employment contracts.(1) Includes trainee teachers, excludes researchers, head teachers, inspectors, guidance and supervisory staff.(2) Includes management and executive positions.
0
10
20
30
40
50
60 FPE Total FPE excluding teachers(1)
0 10 20 30 40 50 60 70 80
0
10
20
30
40
50
60
0
10
20
30
40
50
60
A+ grade(2)
Other A grades
B grade
C grade
A+ grade(2)
Other A grades
B grade
C grade
A+ grade(2)
Other A grades
B grade
C grade
A+ grade(2)
Other A grades
B grade
C grade
Breakdown of staff in the three civil service branches by staff category in 2014 (in %)
7
Source : SIASP (Information System on Civil Servants), INSEE. Data processed by DGAFP-DES.Coverage: Main positions in all civil service staff categories in France (Metropolitan France and French overseas départements, excluding overseas authorities and foreign countries), excluding Mayotte. Excluding government-subsidised employment contracts.(1) In the interests of statistical secrecy, in the FPT, military personnel (2,000 firefighters in the Marseille Fire Department) are classified as established civil servants. Established civil servants include public sector employees, trainee public sector employees and magistrates.(2) “Other grades and categories” covers teachers and librarians in private schools under government contract and FPE state operatives, FPT childminders and home helps, FPH doctors and 700 apprentices in all three branches.
0
20
40
60
80
100
10
30
50
70
90
13
16
64
319
77
76
17
70
10
17
73
7
FPE FPT FPH Ensemble FP
Non-established civil servantsOther grades and categories(2)
Military personnel
Established civil servants
Change in the number of non-established civil servants in the three civil service branches from 2004 to 20148
Source: INSEE – Civil Servants Payroll File Data (FGE), Survey of Employees of Local Authorities and Local Public Institutions (COLTER), Annual Payroll Declaration (DADS) and Information System on Civil Servants (SIASP). DREES: Annual Statistical Survey of Healthcare Establishments (SAE). Data processed by DGAFP - Department for Surveys, Statistics and Information Systems.Coverage: Main positions in all civil service staff categories in France (Metropolitan France and French overseas départements, excluding overseas authorities and foreign countries), excluding Mayotte. Excluding government-subsidised employment contracts.
2004 2014 Change 2014/2004
Change 2014/2013
Non- established
Non- established
(%)
Non- established
Non- established
(%)In numbers %
Annual average
(%)In numbers %
FPE (including EPAs)
299,563 11.3 375,652 15.7 76,089 4.4 2.3 9,878 2.6
FPT (including EPAs)
303,381 19.9 364,199 19.2 60,818 -0.7 1.8 1,372 0.4
FPH 142,683 13.7 202,778 17.5 60,095 3.7 3.6 4,070 2.0All three 745,627 14.3 942,629 17.3 197,002 3.0 2.4 4,435 0.5

Staff in the three civil service branches
Number of staff 2014
Change 2014/2013
(in staff numbers)
Change 2014/2013
(%)
FPE
Ministerial departments 1,911,702 -14,339 -0.7Foreign Affairs 3,583 -182 -4.8Agriculture, Agrifood and Forestry 32,306 129 +0.4Culture and Communication 11,189 48 +0.4Defence 262,388 -10,376 -3.8Ecology, Sustainable Development and Energy 56,902 -5,316 -8.5Economy and Finance 149,410 -3,076 -2.0Education 1,000,053 362 +0.0Interior and Overseas France 286,249 2,615 +0.9Justice 78,857 1,536 +2.0Entities reporting to the Prime Minister 9,818 352 +3.7Social Ministries 20,947 -431 -2.0EPA in the FPE 480,877 6,316 +1.3FPE total 2,392,579 -8,023 -0.3
FPT
Communes(1) 1,034,795 6,532 +0.6Départements 295,337 1 +0.0Regions 81,476 287 +0.4Local and regional authorities total 1,411,608 6,820 +0.5EPA(1) total 483,047 9,089 +1.9FPT total 1,894,655 15,909 +0.8
FPHHospitals 1,025,884 5,506 +0.5Residential homes for the elderly (EHPA) 96,107 2,414 +2.6Other medical-social establishments 39,096 460 +1.2Total FPH 1,161,087 8,380 +0.7
Total FPE+FPT+FPH 5,448,321 16,266 +0.3
Staff numbers in all three civil service branches by type of employer as at 31 December 2014 9
Source: SIASP (Information System on Civil Servants), INSEE. Data processed by DGAFP - Department for Surveys, Statistics and Information Systems.Coverage: Main positions in all civil service staff categories in France (Metropolitan France and French overseas départements, excluding overseas authorities and foreign countries), excluding Mayotte. Excluding government-subsidised employment contracts.(1) Changes to staff in communes, communal and intercommunal establishments should be interpreted with caution given the probable changes in the way authorities declare their figures (e.g. figures grouped together) as a result of the creation of intercommunal bodies.
Civil service and private sector age pyramids as at 31 December 201410
Source: INSEE Labour Survey, Q4-2014 for the private sector, INSEE – Information System on Civil Servants (SIASP) for all three branches. Data processed by DGAFP - Department for Surveys, Statistics and Information Systems.Coverage: Main positions in all civil service staff categories in France (Metropolitan France and French overseas départements, excluding overseas authorities and foreign countries), excluding Mayotte. Excluding government-subsidised employment contracts.Private sector coverage: Metropolitan France. Excluding government-subsidised employment contracts.
15
20
25
30
35
40
45
50
55
60
65
70
Female (%) Female staff Male staffMale (%)
Private sector All three branches
15
20
25
30
35
40
45
50
55
60
65
70
Age Age
FPEFPTFPH
50 000 40 000 30 000 20 000 10 000 0 10 000 20 000 30 000 40 000 50 000 4,0 3,5 3,0 2,5 2,0 1,5 1,0 0,5 0,0 0,5 1,0 1,5 2,0 2,5 3,0 3,5 4,0

Staff in the three civil service branches
Civil service gender equality and diversity
Civil service staff numbers and breakdown by socioeconomic group (as defined by INSEE) in 201411
Source: SIASP (Information System on Civil Servants), INSEE. Data processed by DGAFP - Department for Surveys, Statistics and Information Systems.Coverage: Main positions in all civil service staff categories in France (Metropolitan France and French overseas départements, excluding overseas authorities and foreign countries), excluding Mayotte. Excluding government-subsidised employment contracts.NB: INSEE’s classification of occupations and socioeconomic groups is the institute’s employment and wage monitoring benchmark. It must be rounded out with the statutory civil service categories.
Staff numbers as at 31 December 2014
Breakdown (%)
Executives and senior executives (INSEE) 1,111,528 20.4
A grade 1,110,674 20.4
B grade 771 0.0
Middle-ranking staff (INSEE) 1,627,789 29.9
A grade 733,910 13.5
B grade 887,898 16.3
C grade 5,924 0.1
Semi- and unskilled workers (INSEE) 2,686,530 49.3
B grade 201,305 3.7
C grade 2,454,628 45.1
Not defined 24,569 0.5
Total all three branches 5,448,321 100.0
Demographic indicators for the civil service and the private sector as at 31 December 201412
Source: INSEE – Information System on Civil Servants (SIASP) for all three branches. INSEE labour survey, Q4-2014 for the private sector. Data processed by DGAFP - Department for Surveys, Statistics and Information Systems.Coverage: Main positions in all civil service staff categories in France (Metropolitan France and French overseas départements, excluding overseas authorities and foreign countries), excluding Mayotte. Excluding government-subsidised employment contracts.Private sector coverage: Metropolitan France. Excluding interns and government-subsidised employment contracts.
Women (%)Average age Under 30 (%) Over 50 (%)
Total Female Total Female Total Female
FPE 54.7 42.3 42.8 15.2 13.0 29.3 30.4
FPT 61.2 44.6 44.7 10.9 10.9 37.5 37.8
FPH 77.5 41.5 41.1 19.1 19.8 29.1 27.4
Total civil service 61.8 42.9 43.0 14.5 14.1 32.1 32.1
Private sector 46.0 40.8 41.2 20.5 19.8 26.9 28.0
Source: SIASP (Information System on Civil Servants), INSEE. Data processed by DGAFP - Department for Surveys, Statistics and Information Systems.Coverage: Main positions in all civil service staff categories in France (Metropolitan France and French overseas départements, excluding overseas authorities and foreign countries), excluding Mayotte. Excluding government-subsidised employment contracts.
0%
20%
40%
60%
80%
100%
FPE FPE excluding teachers
FPT FPH Ensemble FP
A gradeB grade C grade Total
Percentage of females in each civil service grade in 201413

Civil service gender equality and diversity
Working hours and conditions
14Number of established civil servants working part-time and proportion of females working part-time in 2014
Source: SIASP (Information System on Civil Servants), INSEE. Data processed by DGAFP - Department for Surveys, Statistics and Information Systems.Coverage: Main positions in all civil service staff categories in France (Metropolitan France and French overseas départements, excluding overseas authorities and foreign countries), excluding Mayotte. Excluding government-subsidised employment contracts.
Part-time employees (%)
Women working part-time (%)
Men working part-time (%)
FPE
A grade 9.9 13.6 3.4B grade 12.1 22.2 3.1C grade 16.4 23.0 4.7Total 11.3 16.5 3.6
FPT
A grade 16.0 22.3 5.6B grade 21.3 28.1 9.0C grade 20.4 31.0 6.6Total 20.2 29.7 6.8
FPH
A grade 21.9 24.7 6.5B grade 27.1 30.9 7.7C grade 19.2 22.9 6.1Total 21.7 25.3 6.5
All three
A grade 12.3 16.6 3.9B grade 19.1 27.3 5.4C grade 19.6 27.5 6.2Total 17.0 23.5 5.3
Number and proportion of females in management and executive (A+) positions in the three civil service branches in 201415
Source: SIASP (Information System on Civil Servants), INSEE. Data processed by DGAFP - Department for Surveys, Statistics and Information Systems.Coverage: Main positions, established and non-established civil servants in Metropolitan France and French overseas départements (excluding Mayotte) excluding overseas authorities and foreign countries. Excluding government-subsidised employment contracts.NB: A+ grade established civil servants in a given corps who are seconded to a managerial position are included here in the position to which they have been seconded and not in their original corps.
Situation as at 31 December 2014 Change 2014/2013
Staff Women (%) Average age (in years) Over 50 (%) Staff
(%)Women (%
points)Over 50 (%
points)
FPE 103,663 38.1 47.6 43.4 0.5 0.5 0.6
FPT 12,269 51.7 52.0 66.0 -2.2 -0.5 0.6
FPH 5,558 45.6 48.8 52.8 -0.9 0.8 -0.5
Breakdown of sick leave by type and length in the ministries in 2012
Source: “Absenteeism for health reasons in 2012”, DGAFP survey - Department for Surveys, Statistics and Information Systems. Coverage: Ministerial departments, civil servants.NB: Excluding work-related illnesses in the prison service, sick leave for lengthy illnesses, serious illnesses and long-term illnesses in the Ministry of Foreign Affairs, and work accidents and occupational illnesses.
general illness < 4 days
general illness 4 days or more
lengthy illness, serious illness or long-term illnesswork accident or occupational illness
36%52%
7%5%
16

Working hours and conditions
Number of employees subject to constraints due to their pace or intensity of work in 2013(%)
17
Source: 2013 Working Conditions Survey, DARES, DGAFP, DREES, INSEE. Data processed by DARES and Department for Surveys, Statistics and Information Systems (DGAFP).Coverage: Employees in France.(1) Including automatic movement of a product or part, automatic rate of a machine, other technical constraints, immediately dependent on the work of one or more co-workers, production standards or deadlines to be met in one day, production standards or deadlines to be met in one hour, external demand requiring an immediate response, constant checks or monitoring by hierarchical superiors.Key: 25% of FPT employees are subject to at least three constraints relating to pace.NB: Additional data on employees’ exposure to risks is available on the DGAFP website.
FPE FPT FPH All three Private sector Total
At least three constraints relating to pace of work (1) 25.1 24.9 40.4 28.2 37.3 35.2
Pace set by...
automatic movement of a product or part 2.1 3.6 5.1 3.2 9.5 8.0
automatic rate of a machine 1.6 4.2 3.9 3.0 8.5 7.2
other technical constraints 11.6 13.2 17.7 13.4 18.4 17.3
immediately dependent on the work of one or more co-workers 25.7 25.7 42.2 29.2 29.8 29.6
production standards or deadlines to be met in one day
12.8 15.3 16.6 14.5 19.5 18.4
or to be met in one hour 18.1 19.8 28.5 20.9 29.2 27.3
external demand 13.4 10.8 8.0 11.4 11.3 11.3
requiring an immediate response 50.7 53.5 62.4 54.2 58.7 57.7
constant checks or monitoring by hierarchical superiors
26.2 25.0 35.4 27.7 32.6 31.5
checks or monitoring by computer 33.9 23.2 39.4 31.3 36.3 35.2
unable to take a rest when required 43.6 30.3 45.8 39.4 27.8 30.4
often or always has to hurry 46.1 37.5 63.0 46.7 46.2 46.3
frequently stop doing one task to do another unplanned one
62.7 63.5 78.0 66.2 63.5 64.1
change job function to suit company’s needs
16.3 21.9 20.1 19.0 24.2 23.0
Sunday working, non-standard working hours and working hour constraints in 2013(%)
18
Source: 2013 Working Conditions Survey, DARES, DGAFP, DREES, INSEE. Data processed by DARES and Department for Surveys, Statistics and Information Systems (DGAFP). Coverage: Employees in France.Key: 28.6% of FPE employees work on a Sunday, including occasionally.(1) The occupations that work most on Sundays are in healthcare, security-defence and justice.
FPE FPT FPH All three Private sector Total
Work 40 hours or more per week 38.6 19.5 21.3 28.3 31.7 31.0
On call 16.1 16.1 15.9 16.1 8.4 10.1
Not have at least 48 consecutive hours of rest per week
12.4 12.3 26.2 15.3 16.9 16.5
Saturday working (including occasionally)
40.3 40.7 70.3 46.7 (1) 48.3 47.9
Sunday working (including occasionally)
28.6 30.3 64.0 36.7 (1) 25.8 28.3
Nightshift (from midnight to 5 a.m., including occasionally)
14.4 12.5 32.3 17.5 14.9 15.5
Recruitment
Breakdown of state civil service external recruitment by type of competitive examination in 2014
Source: DGAFP - Department for Surveys, Statistics and Information Systems (Annual Survey of State Civil Service Recruitment).(1) Estimates.
Total number recruited: 45,035 (1)
External competitive exam
Special competitive exam
Single competitive exam
External without competitive exam
National Education Pact2.1 %
1.6 %
2.6 %
0.3 %
93.4 %
19
State civil service external recruitment (1) by grade in 2014
Source: DGAFP - Department for Surveys, Statistics and Information Systems (Annual Survey of State Civil Service Recruitment).(1) External recruitment (with/without competitive examination), special and single competitive examinations.(2) Excluding direct recruitment without competitive examination and National Education Pact: no data available.
20
Vacancies Enrolled Present Recruited SelectivityA grade 42,519 409,646 214,292 36,402 5.8B grade 4,024 122,686 62,628 4,171 15.8C grade 4,761 117,370 (2) 57,116(2) 5,294 17.5(2)
Including recruit-ment without competitive exam
1,499 nd nd 1,476 nd
Total 51,304 679,702 334,036 45,867 7.6 (2)
Recruitment through external competitions in the local civil service (1), the City of Paris and the City of Paris Social Services Centre (CASVP) by grade in 2014
Source: National Association of Directors and Deputy-Directors of Local Civil Service Management Centres; City of Paris Recruitment and Competitive Examinations Bureau; City of Paris Social Services Centre.(1) External recruitment (with/without competitive examination), special and single competitive examinations.(2) A+ grade: Regional Administrator, Heritage Curator, Regional Senior Engineer, Library Curator.(3) Excluding direct recruitment without competitive examination to C grade in the FPT: no data available.
21
Vacancies Enrolled Present AcceptedA+(2) grade 75 2,064 1,010 52A grade 2,805 30,848 16,306 2,604B grade 5,536 35,689 21,279 4,250C grade 10,376 (3) 69,243 (3) 56,094 (3) 23,781Total 18,792 (3) 137,844 (3) 94,689 (3) 30,687
Level of education of state civil service recruits by grade in 2014(1)
(%)
Source: DGAFP - Department for Surveys, Statistics and Information Systems (Annual Survey of State Civil Service Recruitment).(1) Partial coverage: the ministries replied in relation to 468 competitive examinations out of 478 held.The theoretical level required is: for A grade = Bac +3 to +5; for B grade = Bac to Bac +3; for C grade = lower secondary school certificate or no qualifications.
0%10%20%30%40%50%60%70%80%90%
100%
A grade B grade C grade
Bac +5
Bac +4
Bac +3
Bac +2
Bac
Lower secondary school certificate or no qualificationsUnknown
22
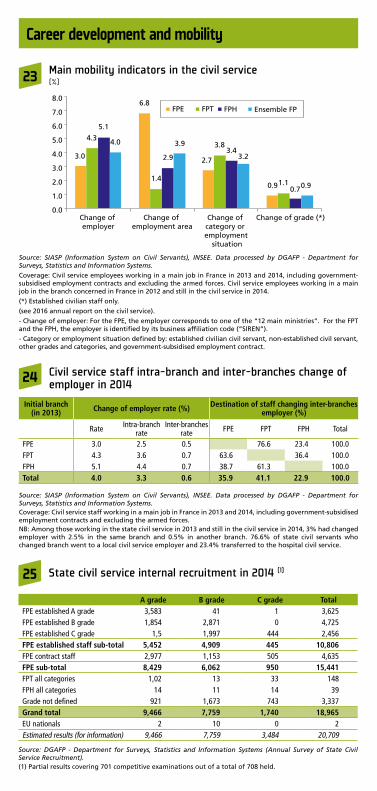
Career development and mobility
3.0
6.8
2.7
0.9
4.3
1.4
3.8
1.1
5.1
2.93.4
0.7
4.0 3.9
3.2
0.9
0.0
1.0
2.0
3.0
4.0
5.0
6.0
7.0
8.0
Change of employer
Change of employment area
Change of category or employment
situation
Change of grade (*)
FPE FPT FPH Ensemble FP
Main mobility indicators in the civil service(%)
Source: SIASP (Information System on Civil Servants), INSEE. Data processed by DGAFP - Department for Surveys, Statistics and Information Systems.
Coverage: Civil service employees working in a main job in France in 2013 and 2014, including government-subsidised employment contracts and excluding the armed forces. Civil service employees working in a main job in the branch concerned in France in 2012 and still in the civil service in 2014.
(*) Established civilian staff only.
(see 2016 annual report on the civil service).
- Change of employer: For the FPE, the employer corresponds to one of the “12 main ministries”. For the FPT and the FPH, the employer is identified by its business affiliation code (“SIREN”).
- Category or employment situation defined by: established civilian civil servant, non-established civil servant, other grades and categories, and government-subsidised employment contract.
23
Civil service staff intra-branch and inter-branches change of employer in 2014
Source: SIASP (Information System on Civil Servants), INSEE. Data processed by DGAFP - Department for Surveys, Statistics and Information Systems.Coverage: Civil service staff working in a main job in France in 2013 and 2014, including government-subsidised employment contracts and excluding the armed forces.NB: Among those working in the state civil service in 2013 and still in the civil service in 2014, 3% had changed employer with 2.5% in the same branch and 0.5% in another branch. 76.6% of state civil servants who changed branch went to a local civil service employer and 23.4% transferred to the hospital civil service.
24
Initial branch (in 2013) Change of employer rate (%) Destination of staff changing inter-branches
employer (%)
Rate Intra-branch rate
Inter-branches rate FPE FPT FPH Total
FPE 3.0 2.5 0.5 76.6 23.4 100.0FPT 4.3 3.6 0.7 63.6 36.4 100.0FPH 5.1 4.4 0.7 38.7 61.3 100.0Total 4.0 3.3 0.6 35.9 41.1 22.9 100.0
Source: DGAFP - Department for Surveys, Statistics and Information Systems (Annual Survey of State Civil Service Recruitment).(1) Partial results covering 701 competitive examinations out of a total of 708 held.
State civil service internal recruitment in 2014 (1)25
A grade B grade C grade TotalFPE established A grade 3,583 41 1 3,625FPE established B grade 1,854 2,871 0 4,725FPE established C grade 1,5 1,997 444 2,456FPE established staff sub-total 5,452 4,909 445 10,806FPE contract staff 2,977 1,153 505 4,635FPE sub-total 8,429 6,062 950 15,441FPT all categories 1,02 13 33 148FPH all categories 14 11 14 39Grade not defined 921 1,673 743 3,337Grand total 9,466 7,759 1,740 18,965EU nationals 2 10 0 2Estimated results (for information) 9,466 7,759 3,484 20,709
Career development and mobility
Training
26Civil servant candidates who passed internal competitive examinations and vocational examinations in the FPT in 2014
Source: National Association of Directors and Deputy-Directors of Local Civil Service Management Centres; City of Paris Recruitment and Competitive Examinations Bureau; City of Paris Social Services Centre.
A+ grade A grade B grade C grade Total
Local civil service excluding the City of Paris 87 1,831 6,129 19,215 27,262
City of Paris and City of Paris Social Services Centre 0 44 263 130 437
Total 87 1,875 6,392 19,345 27,699
Ministerial training expenditure in 2014
Source: DGAFP - Department for Surveys, Statistics and Information Systems (Annual Training Survey).
27
Expenditure (in millions of euros)
Share of total payroll (%)
All ministries excluding education 1,728 7.6
Induction courses 845 3.7
Vocational training 884 3.9
Education ministries 1,310 3.9
Vocational training 235 0.7
Induction courses 1,075 3.2
Number of training days per state civil service staff member by grade and gender in 2014
Source: DGAFP - Department for Surveys, Statistics and Information Systems (Annual Training Survey).
28
Induction courses Vocational training Grand total
Male Female Overall Male Female Overall Male Female Overall
All ministries ex-cluding education 4.7 4.6 4.6 3.2 3.3 3.2 7.8 7.9 7.9
A grade 5.9 7.8 6.8 3.5 4.8 4.0 9.3 12.6 10.8
B grade 4.8 4.9 4.8 3.8 3.7 3.7 8.5 8.6 8.6
C grade and state operatives 3.5 2.5 3.0 2.2 2.2 2.2 5.7 4.7 5.2
Education ministries 1.8 0.7 1.0 3.2 2.8 2.9 5.0 3.5 4.0
A grade 1.9 0.8 1.2 3.2 2.7 2.9 5.1 3.5 4.0
B grade 2.2 3.1 2.9 2.2 3.1 2.9
C grade and state operatives 4.5 3.7 3.9 4.5 3.7 3.9

Remuneration
Average monthly net salary (*) by socioeconomic group (as defined by INSEE) in the civil service and the private sector in 2014 (in euros)
Sources: INSEE – Annual Payroll Declaration (DADS), Information System on Civil Servants (SIASP). Data processed by INSEE-DREES, Department for Local Surveys and Statistics, and Department for Surveys, Statistics and Information Systems (DGAFP).Coverage: Metropolitan France and French overseas départements (excluding Mayotte), excluding overseas authorities and foreign countries.Coverage for the state civil service: Excluding military personnel, including government-subsidised employment contracts.Coverage for the local civil service: Excluding childminders and home helps, including government-subsidised employment contracts.Coverage for the public hospital sector: Excluding government-subsidised employment contracts, interns and contract staff. Coverage for the social and medical/social sector including government-subsidised employment contracts.Coverage for the private sector: Private sector employees and staff of state-owned companies, including government-subsidised employment contracts.(*) Annualised full-time equivalent
29
2,477
1,8772,223 2,226
3,0543,273
4,725
4,109
2,243 2,224 2,288 2,2711,996
1,657 1,698 1,667
0
1,000
2,000
3,000
4,000
5,000
6,000
7,000
8,000
FPE
FPT
FPH
Priv
é
FPE
FPT
FPH
Priv
é
FPE
FPT
FPH
Priv
é
FPE
FPT
FPH
Priv
é
Semi- and unskilled workersMiddle-ranking staffManagersTotal
FPE excluding teachers: 2,432 euros Including managers: 3,617 euros Including middle-ranking staff: 2,179 euros
Teachers: 2,531 euros Including managers: 2,753 euros Including middle-ranking staff: 2,293 euros
2,288 : average
9th decile
median
1st decile
Breakdown of average monthly net salaries by civil service branch and in the private and semi-public sector in 2014 (in euros)
Sources: INSEE – Annual Payroll Declaration (DADS), Information System on Civil Servants (SIASP). Data processed by INSEE-DREES, Department for Local Surveys and Statistics (DGCL), and Department for Surveys, Statistics and Information Systems (DGAFP).Coverage: Metropolitan France and French overseas départements (excluding Mayotte), excluding overseas authorities and foreign countries.Coverage for the local civil service: Excluding childminders and home helps, including government-subsidised employment contracts.Coverage for the public hospital sector: Excluding government-subsidised employment contracts, interns and contract staff. Coverage for the social and medical/social sector including government-subsidised employment contracts.Coverage for the private sector: Private sector employees and staff of state-owned companies, including government-subsidised employment contracts. Coverage for the social and medical/social sector including government-subsidised employment contracts.Coverage for the private sector: Private sector employees and staff of state-owned companies, including government-subsidised employment contracts.
30
2,205
1,376
1,957
3,228
2,477
1,483
2,276
3,579
1,877
1,314
1,688
2,633
2,223
1,437
1,881
3,105
2,226
1,206
1,783
3,609
0
500
1,000
1,500
2,000
2,500
3,000
3,500
4,000
Average D1 D2 D3 D4 D5 D6 D7 D8 D9
Three civil service branches FPE (ministries and government-funded institutions)
FPHPrivate sector
FPT

Staff elections
Remuneration
Latest changes in remuneration in the three civil service branches and in private sector(%)
Sources: INSEE – Annual Payroll Declaration (DADS), Information System on Civil Servants (SIASP). Data processed by INSEE-DREES, Department for Local Surveys and Statistics (DGCL), and Department for Surveys, Statistics and Information Systems (DGAFP).Coverage for the state civil service: France as a whole. Excluding milita-ry personnel, including government-subsidised employment contracts. Coverage for the local civil service: France as a whole. Excluding childminders and home helps, including government-subsidised employment contracts.Coverage for the hospital civil service: France as a whole. Including government-subsidised employment contracts, excluding interns and contract staff.(1) Change in the consumer price index including tobacco (+0.5% in 2014).
31
In current euros
In constant euros(1)
Three civil service branchesNet change in average wage per capita (2014/2013) 0.7 0.2Net change in average salary for active public-service employment (2014/2013)
2.4 1.9
FPE (ministries and government-funded institutions)Net change in average wage per capita (2014/2013) 0.3 -0.2Net change in average salary for active public-service employment (2014-2013)
2.2 1.6
FPE (ministries)Net change in average wage per capita (2014/2013) 0.6 0.1Net change in average salary for active public-service employment (2014-2013)
2.1 1.6
FPTNet change in average wage per capita (2014/2013) 1.3 0.8Net change in average salary for active public-service employment (2014-2013)
2.7 2.1
FPHNet change in average wage per capita (2014-2013) 0.8 0.3Net change in average salary for active public-service employment (2014-2013)
2.0 1.5
Private sectorNet change in average wage per capita (2014-2013) 1.1 0.6Net change in average salary for active public-service employment (2014-2013)
- -
Source: Budget Outturn/Budget Directorate. Data processed by DGAFP - Department for Surveys, Statistics and Information Systems. Coverage: General budget
Class 1 – Amounts allocated to state governing bodies 0.3% - €0.99bn
Class 2 – Employer’s social security contributions and taxes 17.0% €51.23bn
Class 2 – Welfare benefits 0.3% - €0.76bn
Class 3 – Operating expenditure 17.1% €51.61bn
Class 4 – Public debt
interest payments 14.0% -
€42.14bn
Class 5 – Capital
expenditure 3.6% -
€10.85bn
Class 6 – Intervention expenditure
24.4% - €73.62bn
Class 7 – Expenditure on financial transactions
0.3% - €0.81bn
Total state budget:301.6 billion euros
Personnel expenditure totalled 5.6% of GDP in 2015
Class 2 – Earned remuneration 23.1% €69.58bn
Personnel expenditure in the state budget in 2015 (net of tax refunds and tax relief)32
Results of staff elections (to the technical committees*) in the three civil service branches in 2014
Sources: DGAFP; DGCL; DGOS. Data processed by DGAFP - Department for Surveys, Statistics and Information Systems.*for union representation in official organisations (ministerial technical committees and certain other technical committees)
33FPE Turnout FPT Turnout FPH Turnout Civil Service Total
Turnout 2014 (%) 2014 (%) 2014 (%) (%)
Enrolled 2,255.728 1,892,961 1,064,268 5,212,957Voters 1,179,915 52.3 1,039,382 54.9 534,243 50.2 2,753,540 52.8Votes cast 1,117,840 988,630 512,890 2,619,360Results by trade union Share (%) Share (%) Share (%) Share (%)
CFDT 156,006 14.0 220,777 22.3 128,021 25.0 504,804 19.3 CFTC 37,472 3.4 34,787 3.5 14,936 2.9 87,195 3.3 CGC 61,083 5.5 12,689 1.3 2,375 0.5 76,147 2.9CGT 150,134 13.4 291,964 29.5 162,526 31.7 604,624 23.1FA-FP 73,858 7.5 1,491 0.3 75,349 2.9 FGAF 29,062 2.6 11,040 1.1 2,356 0.5 42,458 1.6FO 189,883 17.0 175,129 17.7 121,845 23.8 486,857 18.6FSU 174,30 15.6 32,788 3.3 167 0.0 207,085 7.9Solidaires 100,37 9.0 35,697 3.6 43,444 8.5 179,378 6.8UNSA 165,684 14.8 80,723 8.2 25,458 5.0 271,865 10.4 Other 54,149 4.8 19,178 1.9 10,271 2.0 83,598 3.2

Pensions
Number of new individual retirement pensions for staff affiliated to the Public Pensions Service (SRE excluding La Poste and Orange), the National Pension Fund for Local Government Employees (CNRACL) and the National Pension Scheme for State operatives (FSPOEIE), 2000-2015
Sources: DGFiP – Public Pensions Service, CNRACL and FSPOEIE. These are final figures. Data processed by DGAFP - Department for Surveys, Statistics and Information Systems.(1) Established civil servants affiliated with the National Pension Fund for Local Government Employees (CNRACL), with a minimum working week of 28 hours. Hospital doctors, whose pensions are paid by the general pension scheme and by the supplementary pension fund for contract public employees (IRCANTEC), are not included. (2) Including reserve allowances and excluding fixed pensions.(3) Fully-retired pensioners and pensions paid in advance since 2004.
34
41,344
0
10,000
20,000
30,000
40,000
50,000
60,000
70,000
2000 2001 2002 2003 2004 2005 2006 2007 2008 2009 2010 2011 2012 2013 2014 2015
33,167
21,026
11,193
2,136
FPE: Established civilian staff (excluding La Poste and France Télécom)
FPE: Military personnel(2)
FPE: State operatives(3)
FPH: Established civil servants(1)
FPT: Established civil servants(1)
Number of new pensions paid in 2015 to established civil servants, military personnel and state operatives, average age and average pension rate
Sources: DGFiP – Public Pensions Service, CNRACL and FSPOEIE. Data processed by DGAFP - Department for Surveys, Statistics and Information Systems.(1) Excluding civil service pensions for La Poste and France Télécom employees.(2) Excluding fixed pensions and including reserve allowances.(3) Including fully-retired pensioners and pensions paid in advance. The other data are based solely on fully-retired pensioners.(4) Established civil servants affiliated with the National Pension Fund for Local Government Employees (CNRACL), with a minimum working week of 28 hours. Hospital doctors, whose pensions are paid by the general pension scheme and by the supplementary pension fund for contract public employees (IRCANTEC), are not included.
35
New individual retirement pensions paid in 2015
FPE established(1) FPE military(2) FPE state
operatives(3)FPT
established(4)FPH
established(4)
Total 41,344 11,193 2,136 33,167 21,026
Female staff (%) 55.9 9.7 13,9 52.4 77.4
Average age on date of first payment (in years) 61.3 45.4 60.09 61.2 59.3
Average pension rate (%) 68.7 61.4 63.9 53.8 61.4
Number of civil service pensioners and average annual pension as at 31 December 2015
Sources: DGFiP – Public Pensions Service, CNRACL and FSPOEIE. Data processed by DGAFP - Department for Surveys, Statistics and Information Systems.(1) Excluding civil service pensions for La Poste and France Télécom employees.(2) Pensions paid to FPT and FPH established civil servants, with a minimum working week of 28 hours. Hospital doctors, whose pensions are paid by the general pension scheme and by the supplementary pension fund for contract public employees (IRCANTEC), are not included.
36
Individual retirement pensions paid as at 31/12/2015 Number Average total pension
(in euros)
FPE civilian pensions(1) (Public Pensions Service) 1,282,854 2,152
FPE military pensions (Public Pensions Service) 386,849 1,732
State operative pensions (FSPOEIE) 68,734 1,816
FPT pensions(2) (CNRACL) 537,577 1,275
FPH pensions(2) (CNRACL) 509,281 1,404
Total pensions paid to established civil servants in the three civil service branches, military personnel and state operatives
2,785,295 1,779

www.fonction-publique.gouv.fr
This excerpt presents a summary of the key figures from the Facts and Figures section of the Rapport Annuel sur l’État de la Fonction Publique.
The French Civil ServiceKey Figures2016
© D
GAFP
- B
urea
u de
la c
omm
unic
atio
n -
Déce
mbr
e 20
16
THE DGAFP COLLECTIONS
ANNUAL REPORT
The Rapport Annuel collection covers all the annual reports published by the DGAFP. The Rapport Annuel sur l’État de la Fonction Publique’s Human Resources Policies and Practices section presents the main human resources management data and the Facts and Figures statistics section reports on the social civil service data. This collection also contains the annual report on gender equality at work in the civil service, first published in 2014. Excerpts are available in leaflets such as Key Figures and Summary Table.
PUBLIC EMPLOYMENT POLICIES
The Politiques d’Emploi Public collection addresses HR forward planning, from knowledge to skills management. It also contains memoranda of understanding drawn up following negotiations with representative civil service trade unions.
MANAGERS IN THE CIVIL SERVICE
This new collection is aimed at all upper, mid-level and local managers in the civil service. It addresses general management and HRM issues with an eye to providing these managers with the means to take action.
THE BASICS
The Les Essentiels collection is designed for a wide audience, with information sheets and booklets on recruitment, competitive exami-nations, careers, training and generally all as-pects of civil service career advancement.
HRM TOOLS
Geared mainly towards HR managers, the Ou-tils de la GRH collection contains a large num-ber of steering tools used every day by the HR departments. For example, the Interministerial Directory of Central Government jobs (RIME), the Dictionnaire des Compétences, specialised guides and the Démarches, Outils et Acteurs de la Mobilité kit are also part of the collection.
STATISTICS AND RESEARCH ON THE CIVIL SERVICE
The Statistiques et Recherche sur la FP collection has four sub-collections designed for decision-makers, managers, statisticians and researchers. Stats Rapides presents indicators and initial findings. Point Stat briefly analyses the findings of statistical surveys and studies in a few pages. Documents et Méthodes presents progress reports on research and methodology. Études, Recherche et Débats contains in-depth quantitative and qualitative analyses.