Mining social media tracking content and predicting behavior - manos tsagkias
229
Downloaded from UvA-DARE, the institutional repository of the University of Amsterdam (UvA) http://hdl.handle.net/11245/2.113995 File ID uvapub:113995 Filename Thesis Version unknown SOURCE (OR PART OF THE FOLLOWING SOURCE): Type PhD thesis Title Mining social media: tracking content and predicting behavior Author(s) M. Tsagkias Faculty FNWI: Informatics Institute (II) Year 2012 FULL BIBLIOGRAPHIC DETAILS: http://hdl.handle.net/11245/1.377411 Copyright It is not permitted to download or to forward/distribute the text or part of it without the consent of the author(s) and/or copyright holder(s), other than for strictly personal, individual use, unless the work is under an open content licence (like Creative Commons). UvA-DARE is a service provided by the library of the University of Amsterdam (http://dare.uva.nl) (pagedate: 2014-11-23)
-
Upload
socialmediadna -
Category
Social Media
-
view
255 -
download
2
Transcript of Mining social media tracking content and predicting behavior - manos tsagkias

Downloaded from UvA-DARE, the institutional repository of the University of Amsterdam (UvA)http://hdl.handle.net/11245/2.113995
File ID uvapub:113995Filename ThesisVersion unknown
SOURCE (OR PART OF THE FOLLOWING SOURCE):Type PhD thesisTitle Mining social media: tracking content and predicting behaviorAuthor(s) M. TsagkiasFaculty FNWI: Informatics Institute (II)Year 2012
FULL BIBLIOGRAPHIC DETAILS: http://hdl.handle.net/11245/1.377411
Copyright It is not permitted to download or to forward/distribute the text or part of it without the consent of the author(s) and/orcopyright holder(s), other than for strictly personal, individual use, unless the work is under an open content licence (likeCreative Commons). UvA-DARE is a service provided by the library of the University of Amsterdam (http://dare.uva.nl)(pagedate: 2014-11-23)


Mining Social Media:Tracking Content andPredicting Behavior
Manos Tsagkias


Mining Social Media:Tracking Content andPredicting Behavior
ACADEMISCH PROEFSCHRIFT
ter verkrijging van de graad van doctor aan deUniversiteit van Amsterdam
op gezag van de Rector Magnificusprof.dr. D.C. van den Boom
ten overstaan van een door het college voor promoties ingesteldecommissie, in het openbaar te verdedigen in
de Agnietenkapelop woensdag 5 december 2012, te 14:00 uur
door
Manos Tsagkias
geboren te Athene, Griekenland

Promotiecommissie
Promotor:Prof. dr. M. de Rijke
Overige leden:Dr. J. GonzaloProf.dr. C.T.A.M. de LaatDr. C. MonzProf.dr. A.P. de Vries
Faculteit der Natuurwetenschappen, Wiskunde en Informatica
SIKS Dissertation Series No. 2012-47The research reported in this thesis has been carriedout under the auspices of SIKS, the Dutch ResearchSchool for Information and Knowledge Systems.
This research was supported by the Netherlands Organisation for Scientific Re-search (NWO) under project number 612.061.815.
Copyright © 2012 Manos Tsagkias, Amsterdam, The NetherlandsCover by Mark AssiesPrinted by Offpage, Amsterdam
ISBN: 978-94-6182-198-0

To the unseen heroes,including you.
You hold the result of five years of work. Writing this book has been a non-trivial,yet exciting, process. Although I claim sole authorship, I cannot forget the manyother people who have contributed to this book in different ways, levels and stages.Without them the journey would not have been as easy. I want to say Thank you!
Αντὼνη, και Κατερὶνα
για την πὶστη σας σε εμὲνα.
Δημὴτρη, Τζ., και Θανὰση
για το μὶτο της Αριὰδνης.
Maartenfor being my Teacher.
Wouter, Simon, and Edgarfor keeping the mojo flowing.
Katja, Jiyin, and Marcfor belaying me while I was climbing my way to a Ph.D.
My co-authorsfor the stories and dialogues.
All former and current ILPSersfor transforming daily routine into an inspiring process.

Contents
1 Introduction 11.1 Research outline and questions . . . . . . . . . . . . . . . . . . . . 31.2 Main contributions . . . . . . . . . . . . . . . . . . . . . . . . . . . 61.3 Thesis overview . . . . . . . . . . . . . . . . . . . . . . . . . . . . . 71.4 Origins . . . . . . . . . . . . . . . . . . . . . . . . . . . . . . . . . . 8
2 Background 92.1 Social media analysis . . . . . . . . . . . . . . . . . . . . . . . . . . 92.2 Content representation . . . . . . . . . . . . . . . . . . . . . . . . . 122.3 Ranking . . . . . . . . . . . . . . . . . . . . . . . . . . . . . . . . . 162.4 Link generation . . . . . . . . . . . . . . . . . . . . . . . . . . . . . 192.5 Prediction . . . . . . . . . . . . . . . . . . . . . . . . . . . . . . . . 21
I. Tracking Content 25
3 Linking Online News and Social Media 293.1 Introduction . . . . . . . . . . . . . . . . . . . . . . . . . . . . . . . 293.2 Approach . . . . . . . . . . . . . . . . . . . . . . . . . . . . . . . . 333.3 Methods . . . . . . . . . . . . . . . . . . . . . . . . . . . . . . . . . 34
3.3.1 Retrieval model . . . . . . . . . . . . . . . . . . . . . . . . . 343.3.2 Query modeling . . . . . . . . . . . . . . . . . . . . . . . . 363.3.3 Late fusion . . . . . . . . . . . . . . . . . . . . . . . . . . . 40
3.4 Experimental setup . . . . . . . . . . . . . . . . . . . . . . . . . . . 413.4.1 Experiments . . . . . . . . . . . . . . . . . . . . . . . . . . . 413.4.2 Data set and data gathering . . . . . . . . . . . . . . . . . . 423.4.3 Evaluation . . . . . . . . . . . . . . . . . . . . . . . . . . . . 433.4.4 Weight optimization for late fusion . . . . . . . . . . . . . . 44
3.5 Results and analysis . . . . . . . . . . . . . . . . . . . . . . . . . . 453.5.1 Query modeling . . . . . . . . . . . . . . . . . . . . . . . . 453.5.2 Late fusion . . . . . . . . . . . . . . . . . . . . . . . . . . . 48
3.6 Conclusions and outlook . . . . . . . . . . . . . . . . . . . . . . . . 51
4 Hypergeometric Language Models 554.1 Introduction . . . . . . . . . . . . . . . . . . . . . . . . . . . . . . . 564.2 Hypergeometric distributions . . . . . . . . . . . . . . . . . . . . . 59
v
CONTENTS vi
4.2.1 The central hypergeometric distribution . . . . . . . . . . . 594.2.2 The non-central hypergeometric distribution . . . . . . . . . 604.2.3 An example . . . . . . . . . . . . . . . . . . . . . . . . . . . 60
4.3 Retrieval models . . . . . . . . . . . . . . . . . . . . . . . . . . . . 614.3.1 A log-odds retrieval model . . . . . . . . . . . . . . . . . . . 624.3.2 A linear interpolation retrieval model . . . . . . . . . . . . . 644.3.3 A Bayesian retrieval model . . . . . . . . . . . . . . . . . . 66
4.4 Experimental setup . . . . . . . . . . . . . . . . . . . . . . . . . . . 684.4.1 Experiments . . . . . . . . . . . . . . . . . . . . . . . . . . . 684.4.2 Dataset . . . . . . . . . . . . . . . . . . . . . . . . . . . . . 704.4.3 Ground truth and metrics . . . . . . . . . . . . . . . . . . . 70
4.5 Results and analysis . . . . . . . . . . . . . . . . . . . . . . . . . . 714.6 Discussion . . . . . . . . . . . . . . . . . . . . . . . . . . . . . . . . 75
4.6.1 Hypergeometric vs. multinomial . . . . . . . . . . . . . . . 754.6.2 Mixture ratios, term weighting, and smoothing
parameters . . . . . . . . . . . . . . . . . . . . . . . . . . . 764.6.3 Ad hoc retrieval . . . . . . . . . . . . . . . . . . . . . . . . . 78
4.7 Conclusions and outlook . . . . . . . . . . . . . . . . . . . . . . . . 79
II. Predicting Behavior 83
5 Podcast Preference 875.1 Introduction . . . . . . . . . . . . . . . . . . . . . . . . . . . . . . . 885.2 The PodCred framework . . . . . . . . . . . . . . . . . . . . . . . . 90
5.2.1 Motivation for the framework . . . . . . . . . . . . . . . . . 915.2.2 Presentation of the framework . . . . . . . . . . . . . . . . 935.2.3 Derivation of the framework . . . . . . . . . . . . . . . . . . 96
5.3 Validating the PodCred framework . . . . . . . . . . . . . . . . . . 1035.3.1 Feature engineering for predicting podcast preference . . . 1035.3.2 Experimental setup . . . . . . . . . . . . . . . . . . . . . . . 1085.3.3 Results on predicting podcast preference . . . . . . . . . . . 110
5.4 Real-world application of the PodCred framework . . . . . . . . . . 1205.5 Conclusions and outlook . . . . . . . . . . . . . . . . . . . . . . . . 122
6 Commenting Behavior on Online News 1256.1 Introduction . . . . . . . . . . . . . . . . . . . . . . . . . . . . . . . 1266.2 Exploring news comments . . . . . . . . . . . . . . . . . . . . . . . 128
6.2.1 News comments patterns . . . . . . . . . . . . . . . . . . . 1286.2.2 Temporal variation . . . . . . . . . . . . . . . . . . . . . . . 130
6.3 Modeling news comments . . . . . . . . . . . . . . . . . . . . . . . 1336.4 Predicting comment volume prior to publication . . . . . . . . . . . 136
6.4.1 Feature engineering . . . . . . . . . . . . . . . . . . . . . . 136
vii CONTENTS
6.4.2 Results and discussion . . . . . . . . . . . . . . . . . . . . . 1386.5 Predicting comment volume after publication . . . . . . . . . . . . 146
6.5.1 Correlation of comment volume at early and late time . . . 1476.5.2 Prediction model . . . . . . . . . . . . . . . . . . . . . . . . 1476.5.3 Results and discussion . . . . . . . . . . . . . . . . . . . . . 149
6.6 Conclusions . . . . . . . . . . . . . . . . . . . . . . . . . . . . . . . 151
7 Context Discovery in Online News 1537.1 Introduction . . . . . . . . . . . . . . . . . . . . . . . . . . . . . . . 1537.2 Problem definition . . . . . . . . . . . . . . . . . . . . . . . . . . . 1577.3 Approach . . . . . . . . . . . . . . . . . . . . . . . . . . . . . . . . 1587.4 Modeling . . . . . . . . . . . . . . . . . . . . . . . . . . . . . . . . 160
7.4.1 Article models . . . . . . . . . . . . . . . . . . . . . . . . . 1607.4.2 Article intent models . . . . . . . . . . . . . . . . . . . . . . 1627.4.3 Query models . . . . . . . . . . . . . . . . . . . . . . . . . . 1637.4.4 Weighting schemes . . . . . . . . . . . . . . . . . . . . . . . 165
7.5 Retrieval . . . . . . . . . . . . . . . . . . . . . . . . . . . . . . . . . 1667.6 Experimental setup . . . . . . . . . . . . . . . . . . . . . . . . . . . 168
7.6.1 Dataset . . . . . . . . . . . . . . . . . . . . . . . . . . . . . 1687.6.2 Evaluation . . . . . . . . . . . . . . . . . . . . . . . . . . . . 169
7.7 Results and analysis . . . . . . . . . . . . . . . . . . . . . . . . . . 1707.8 Discussion . . . . . . . . . . . . . . . . . . . . . . . . . . . . . . . . 1727.9 Conclusions and outlook . . . . . . . . . . . . . . . . . . . . . . . . 174
8 Conclusions 1798.1 Main findings . . . . . . . . . . . . . . . . . . . . . . . . . . . . . . 1798.2 Future directions . . . . . . . . . . . . . . . . . . . . . . . . . . . . 184
Bibliography 187
Samenvatting 205

1Introduction
Since the advent of blogs in the early 2000s, social media has been gainingtremendous momentum. Blogs have rapidly evolved into a plethora of socialmedia platforms that enabled people to connect, share and discuss anythingand everything, from personal experiences, to ideas, facts, events, music, videos,movies, and the list goes on forevermore. The technological advances in portabledevices facilitated this process even further. People no longer need to sit behind acomputer to access the online world, but they can be connected from their mobilephones from anywhere, anytime. This new phenomenon has started transformingthe way we communicate with our peers. We have started digitizing our real-world lives by recording our daily activities in social media. From a researchperspective, social media can be seen as a microscope to study and understandhuman online behavior. In this thesis, we will use social media as our microscopefor understanding the content that is published therein, and for understandingand predicting human behavior.
Social media has facilitated easy communication and broadcasting of infor-mation, most typically, via commenting, sharing and publishing (Pew ResearchProject for Excellence in Journalism, 2012). Social media has rapidly become astrong channel for news propagation (Kwak et al., 2010). Effortless publishing insocial media has pushed people beyond “just” sharing and commenting the newsthey read to instantly report what is happening around them; think of local eventsthat break out, e.g., political unrest, natural disasters (Domingo et al., 2008). Thisphenomenon has sparked a symbiotic relationship between news and social media,where much of what is discussed in social media is inspired by the news, and viceversa, the news benefit from instantaneous reports about breaking events in socialmedia (Leskovec et al., 2009).
Understanding this symbiotic relationship can prove valuable for a broadspectrum of use cases, including news publishers, online reputation managers,and consumers. For example, news publishers can increase their revenues by
1

1. Introduction 2
adapting their pricing strategies to the reach of a news article. Online reputationmanagers can better track and analyze what consumers think about a particularbrand, product, or person. Consumers can better navigate through the sheeramount of information by having content filtered to their interests. These usecases are examples that motivate the importance of examining the relationshipbetween news and social media, and form the basis of this work.
We focus on two particular dimensions: tracking content in social media, andpredicting human behavior. Why these two? Both are key characteristics of socialmedia: the easy and rapid dissemination of content and the fact that we havealmost direct access to people’s lives and behavior through social media.
Tracking content
Describing the exact mechanics of content diffusion and mutation between newsand social media is an active research area (Kiciman, 2012; Kim et al., 2012;Leskovec et al., 2009; Luu et al., 2012). Typically, content travels from one domainto another in the form of hyperlinks which link to a news article or social mediautterance (e.g., blog post, status update, comment). During the diffusion process,the original content is altered, and new content is created, often resulting inforgetting the original hyperlink that triggered the propagation. Recovering thelinks to the original article among content that no longer carries a hyperlink to theoriginal article is a challenging task, and central to many of the use cases as theones we described above.
The unedited, user generated nature of social media content adds to thechallenge as people often copy and paste entire or parts of articles, and blog postswithout providing a hyperlink to the source. This type of behavior can inevitablybreak a tracking mechanism which is based only on the existence of hyperlinks,as it will miss all social media utterances without hyperlinks and the discussionsthat started from them. This has negative effects in media analysis and onlinereputation management because both depend on content analysis.
Predicting behavior
What makes online objects attractive to people to interact with (and thereforepopular)? We will try to answer this question by looking at user behavior in threetypes of environment: “closed,” “semi-open,” and “open.” An object is consideredto live in a closed environment if a user has to use an application or a particularwebsite to interact with it (e.g., a users comments on a news article, or subscribingto a podcast in iTunes), otherwise the object’s environment is considered open(e.g., a user searches and browses the web to fulfill an information need). Withthis classification in mind, we study three scenarios using a bottom-up approach,

3 1.1. Research outline and questions
from closed to open environments. The first two relate to measuring attention foran object, while the third relates to user browsing behavior.
The first two scenarios relate to measuring attention. Although attention spansmultiple dimensions, we will consider only two of them. First, we look at ratingson multimedia content, i.e., podcasts, in the “closed” environment of iTunes asproxy of user preference. Second, we move to “semi-open” environments and lookat news comments volume on news articles from several news agents. Scoringnews articles on an attention scale allows us to group them and analyze theircontent. This analysis can help in revealing what makes news articles attractattention, and give leads for developing methods that predict the attention anarticle will attract both before and after it is published.
The third scenario is slightly different from the previous two in the sense thatinstead of measuring attention, it aims at modeling user browsing behavior in“open” environments. In this particular setting, a user with an information need issearching for news on the web. Does their information need change after they readan article? What, if anything, should they read next? How can this be modeledin a retrieval setting? The answers to these questions can prove valuable to webowners for increasing revenue via user engagement (Attenberg et al., 2009).
1.1 Research outline and questions
The work in this thesis focuses on developing algorithmic methods for addressingthe challenges raised in the two general research themes described above: trackingcontent, and predicting behavior. Much of the related research in these areas aimsat describing the dynamics of the respective phenomena. Our goal is slightly differ-ent. We aim at developing robust and effective methods that can be implementedin real-world, online applications.
In the volatile domain of news, and rapidly evolving domain of social media,viable methods are those that are capable of dealing with large volumes of datain short time. Information Retrieval has a long standing history on retrievinginformation from large data repositories. Text Mining offers methods for derivinghigh-quality information from textual content. To this end, our methods draw from,revisit, and build upon practices employed in the areas of Information Retrieval(IR) and Text Mining (TM).
We view the problem of tracking content as an IR problem. Given a sourcearticle and a social media index, the goal is for the system to retrieve social mediautterances that are republished versions of the source article or discuss it. Thetask of predicting behavior as in preference and popularity is cast as a regressionand classification problem where the label is the attention measure. For predictinguser browsing behavior, we follow an IR approach. We model a user query and
1. Introduction 4
the article the user read first, along with the potential user intent aggregated overother users who read the article as a query which we then issue to an index ofnews articles.
The thesis is grouped in two parts; the first is concerned with tracking content,and the second with predicting behavior. Next, we list the research questions weare interested in answering for both parts.
The main question of the first part we aim at answering is whether languagemodeling methods can be effective for retrieving implicitly linked social media utter-ances given a source news article. More specifically:
RQ 1. What is the retrieval effectiveness of modeling source articlesusing different strategies for retrieving implicitly linked socialmedia utterances?
We exploit the existence if several channels for modeling a source article. Theystem either from the structure of the article (e.g., title, lead, body), or from sourcesthat explicitly link to it (e.g., news comments, bookmarking sites, (micro-)blogposts with explicit links). What if we used representations of a news articlegenerated from these different channels of information? Given these options, weapproach the task at hand as a late data fusion problem. We are interested infinding:
RQ 2. What is the effect on retrieval effectiveness from using het-erogeneous channels of information for modeling a sourcearticle?
RQ 3. Can we achieve better effectiveness when using late datafusion methods for merging the returned ranked lists frommodels trained on different channels?
To answer these research questions, we conduct our study using retrieval methodsthat build on language modeling. Our studies indicates that standard languagemodeling builds on assumptions that are violated in the task of republished articlefinding, i.e., finding social media utterances that republish entire or key parts ofthe source article, due to the similar length of the input query, and the documentsto be retrieved. We revisit these assumptions, and propose a remedy using twohypergeometric distributions for modeling queries and documents. Here, ourresearch question is twofold:

5 1.1. Research outline and questions
RQ 4. What is the retrieval effectiveness of hypergeometric languagemodels compared to standard language models for the taskof republished article finding?
RQ 5. What are optimal smoothing methods for hypergeometriclanguage models? We propose, and compare three smoothingtechniques using: log-odds, Jelinek-Mercer smoothing, andBayesian inference.
Research questions 1–3 are answered in Chapter 3, and research question 4 inChapter 4. Chapters 3, 4 complete the first part of the thesis on tracking content.
In the second part of the thesis we focus on predicting behavior. First weaddress prediction of attention as preference. For this we turn to podcasts, atype of user generated spoken audio. Our task is to predict podcast preference,namely, whether a podcast will be highly popular in iTunes. We are interested inthe following research questions:
RQ 6. Can surface features be used to predict podcast preference?
RQ 6/1. Must the podcast feed be monitored over time to collectinformation for generating features?
RQ 6/2. Can the size and composition of the feature set be optimized?
Next we set our measure for attention as the volume of comments that a newsarticle attracts. We are interested in:
RQ 7. Do patterns of news commenting behavior exist? And if theydo, how can they be used for predicting how much attentiona news article will attract?
We discover similar patterns of commenting behavior over a range of news agents.Next, we try to use these patterns for predicting the volume of comments beforeand after an article is published:
RQ 8. Among textual, semantic, and real-world sets of features, andtheir combination, which leads to the best prediction accuracyfor prior to publication prediction of volume of comments?

1. Introduction 6
RQ 9. What is the prediction accuracy for predicting volume ofcomments after publication? How observation time correlateswith prediction accuracy?
In our last step in studying behavior, we turn to how people search and navigatenews. Given a search query, and an article that a user reads, we want to predictthe news article they will read next. We do so by introducing language intentmodels. We ask:
RQ 10. What is the effectiveness of language intent models on pre-dicting news articles that a user is likely to read next?
Research question 6 is addressed in Chapter 5. RQs 7–9 in Chapter 6, and RQ10 in Chapter 7. Having formulated our research questions, we list the maincontributions of this thesis below.
1.2 Main contributions
This work makes several contributions in the following areas: new models, newanalyses, datasets, and assessments. We begin with contributions in new models:
1. Models that build on heterogeneous sources for discovering implicitly linkednews articles in social media.
2. Hypergeometric language models for retrieval tasks where the query lengthis close to the length of documents to be retrieved.
3. Models for predicting attention both in terms of volume, and preference.
4. Language intent models for predicting user browsing behavior.
The main contributions in new analyses are:
1. An analysis of commenting behavior of user on seven news agents.
2. Understanding behavior of podcast subscribers.
For several of our experiments we built and made available new datasets. Theseinclude:
1. A dataset for linking online news and social media.
2. A dataset for republished article finding.

7 1.3. Thesis overview
3. A dataset for predicting attention in terms of volume of comments.
4. A dataset for predicting podcast preference.
5. A dataset for predicting user browsing behavior.
1.3 Thesis overview
The main body of the thesis is organized in two parts. The first part addresses theproblem of tracking content, and the second part focus on predicting behavior.Below, we describe each part in more detail.
Part I: Tracking Content The main aim underlying our work on tracking isto find social media utterances that are republished versions of a source newsarticle or discuss it. In Chapter 3 we begin our study with modeling a sourcearticle using several sources of information, both intrinsic and extrinsic to thearticle. For retrieving social media utterances we use standard language modelingretrieval methods. In Chapter 4, we find that the assumptions in standard languagemodeling do not apply for the task of republished article because the query lengthis close to the length of documents to be retrieved. We remedy this by introducingtwo hypergeometric language models with significant improvements in retrievaleffectiveness.
Part II: Predicting Behavior Chapters 5, 6 address the problem of predictingattention. Chapter 5 measures attention as user preference, while Chapter 6 usesvolume of content as handle. The later presents an analysis of user commentingbehavior on seven news agents, and proposes methods for predicting the volumeof comments before and after the publication of a news article. Chapter 7 focuseson predicting user browsing behavior when people search for news on the web.For this purpose we develop language intent models, language models that capturereaders’ intent.
Related work is presented in Chapter 2, and conclusions in Chapter 8. Parts I andII can be read independently, neither is a prerequisite for the other.
1. Introduction 8
1.4 Origins
Part I builds on work presented in:
• Tsagkias et al. (2011b): Linking Online News and Social Media, appeared inWSDM 2011.
• Tsagkias et al. (2011a): Hypergeometric Language Models for RepublishedArticle Finding, appeared in SIGIR 2011.
Part II builds on work presented in:
• Tsagkias et al. (2010a): Predicting podcast preference: An analysis frame-work and its application, appeared in JASIST in 2010.
• Tsagkias et al. (2009b): Predicting the volume of comments on online newsstories, appeared in CIKM 2009.
• Tsagkias et al. (2010b): News comments: exploring, modeling, and onlineprediction, appeared in ECIR 2010.
• Tsagkias and Blanco (2012): Language Intent Models for Inferring UserBrowsing Behavior, appeared in SIGIR 2012.
In addition, we build on insights and experiences gained in (Balog et al., 2009a,b;Berendsen et al., 2012; Bron et al., 2011a; Carter et al., 2011, 2012; Fuller et al.,2008; He et al., 2010; Hofmann et al., 2009; Larson et al., 2009; Massoudi et al.,2011; Oghina et al., 2012; Tsagkias and Balog, 2010; Tsagkias et al., 2008a,b,2009a; Weerkamp et al., 2010, 2011).

2Background
This chapter frames the research of this thesis with respect to prior related work onsocial media analysis and related tasks. Mining social media is a type of text miningtask which, in turn, involves, among others, information retrieval, informationextraction, and text categorization (Hearst, 1999); these themes will occupy us inthe chapters to come.1 We begin with a review of research in social media analysis,and describe several social media tasks addressed in the literature. Next, we zoomin on three tasks, namely, ranking, linking, and prediction, and how they have beentackled so far. Before doing so, however, we provide an overview of prior work oncontent representation since it is a core component in each of the three tasks.
2.1 Social media analysis
Social media consists of forums, blogs, bookmarking and video sharing websites,and more recently, collaborative coding websites (e.g., GitHub) (Dabbish et al.,2012), and social networking sites such as Twitter, Facebook, Google Plus, andLinkedIN. Regardless of the platform, however, content published in social mediais typically user generated and takes the form of text, audio, or video. Thesetwo aspects, i.e., the social aspect, and the user generated content aspect, led tothe development of two main research branches in social media analysis. Thefirst focuses on characterizing and modeling the network and content of eachplatform, and the second aims at understanding the content dynamics for a rangeof applications. This thesis leans towards the second branch, which we willthoroughly visit in next sections. Next, we proceed with an overview of researchdevelopments in both research branches.
1Excellent resources on the history and theoretical and practical developments in text mining canbe found in (Manning et al., 2008; Weiss et al., 2004; Witten and Frank, 2005).
9

2. Background 10
Imagine that we are faced with a new type of social media platform, howwould we approach it in order to characterize and understand it? Ahn et al. (2007)look at four topological network characteristics in Cyworld, MySpace, and Orkut:degree distribution, clustering property, degree correlation, and evolution overtime. They find that each network exposes a unique scaling behavior of the degreedistribution, and similar patterns in degree correlation emerge between real-lifesocial networks and social networks that encourage online activities which canbe copied in real life. Ugander et al. (2011) look at Facebook’s social graph fromseveral angles, and find that the network is nearly fully connected in a single largeconnected component, confirming the ‘six degrees of separation’ phenomenon.Looking at demographics, they find friendship preferences to be biased by age,and community structures to be based on nationality. Backstrom et al. (2011)continue previous efforts and report on the evolution of Facebook’s network densitymeasured in degrees of separation; in 2012 it was found to be 4.74, less thanthought in the original six degrees of separation experiment. Huberman et al.(2009) put Twitter under the microscope and analyze user activity in relation tothe user’s social network, i.e., followers, followees, and friends (users at whomthe user has directed at least two posts). Their findings suggest that a user’sposting activity is mostly correlated with the number of friends and not withthe number of followers or followees. On a similar note with a stronger focuson community formation, Backstrom et al. (2006) analyze group formation onLiveJournal, MySpace, and DBLP. They find that the tendency of an individual tojoin a community is influenced not only by the number of friends they have inthe community, but also, importantly, by how those friends are connected to oneanother.
But what is all the chatter about in social media? Nardi et al. (2004) inter-viewed 26 bloggers living in California or New York, aged 19 to 60. They found adiverse range of reasons why people blog, e.g., “document my life,” commentary,outlet for thoughts and feelings, community forum. This was also reflected onthe types of blog content which ranged from journals of daily activities to seriouscommentaries on important issues. Java et al. (2007) conduct similar research onTwitter, with different outcomes, quite likely due to the nature of each medium.In Twitter, they find that people engage in talking about their daily activities,and in seeking and sharing information. Weerkamp et al. (2011) looked at theways people engage in conversation on Twitter, and found differences betweennationalities (inferred from the language of the posts). For example, on the oneend, German tweets were found as structured broadcasts, characterized by highusage of hashtags and links, and a limited usage of personal communicationoptions. On the other end, Spanish and Dutch tweets are examples of mostlyunstructured personal communications: limited usage of hashtags and links, butmany mentions and conversations. According to Jansen et al. (2009), Twitter is

11 2.1. Social media analysis
also a kind of electronic word of mouth, where 19% of the users direct a post to aconsumer brand, with 50% of it being positive and 33% negative. Romero et al.(2011a) look at the influence of users in Twitter. An information propagation studyreveals that the majority of users passively consumes information, and does notforward the content to the network. They conclude that high influence is not onlydependent on high popularity, but also on information forwarding activity. Similarresults were obtained by Cha et al. (2010) where they measured user influenceon in-degree, retweets, and mentions. They find that, high in-degree users do notnecessarily spawn retweets or mentions, most influential users have influence onmore than one topic, and influence is built on limiting tweets to a specific topic.Several attempts have been made to predict information propagation in socialmedia (Artzi et al., 2012; Bolourian et al., 2009; Romero et al., 2011b); however,this still remains an open and active research area (Kiciman, 2012; Kim et al.,2012; Luu et al., 2012).
Findings on social network modeling and understanding the content discussedin social media triggered researchers interest on whether social media can beused as a signal for enhancing models in several tasks, such as human computerinteraction (HCI), identifying political sentiment, and predicting movie ratings andbox office revenues, book sales, mood, and recommendation, among others. Adamset al. (2012) developed a feed-reader-plus-social-network aggregator that minescomments from social media in order to display a users relational neighborhood asa navigable social network. Rowe et al. (2012) conduct a behavior analysis acrossdifferent types of enterprise online communities, and assess the characteristicsof these types and identify key differences in the behavior that users exhibitin these communities. Mascaro et al. (2012) investigate how users experiencepolitical discourse online, Park et al. (2011) identify the political orientation ofnews articles via sentiment analysis of their news comments, and Sobkowicz andSobkowicz (2012) predict political sympathy in online Polish political fora. Theyuse information from the most active users to predict political sympathy for the“silent majority.” Efforts have been made to predict election outcomes in 2009German (Tumasjan et al., 2010), and 2010 U.S. Congressional elections (Livneet al., 2011), however, the robustness of the methods developed is found debatableby an other body of researchers (Jungherr et al., 2012; Metaxas et al., 2011). Inthe movies domain, Mishne and Glance (2006b); Sadikov et al. (2009) predictbox office revenues from blog posts, while, later, Asur and Huberman (2010) usecontent from Twitter. Oghina et al. (2012) use signals from Twitter and YouTubemovie trailers to predict movie ratings on the Internet Movie Database. Ko et al.(2011) develop a collaborative filtering system for recommending movies basedon users’ opinions extracted from movie comments. Kim et al. (2011) tackle asimilar recommendation problem for movies on a Korean movie portal, wherethey combine user ratings and user comments. In a similar fashion, Gruhl et al.

2. Background 12
(2005) predict book sales by tracking the content of blog posts, media, and webpages, and Bollen et al. (2011) find correlations between the mood in Twitter andthe stock market. Tracking and predicting the collective mood in social mediahas also attracted some attention. Balog et al. (2006); Mishne and de Rijke(2006a) capture, identify and explain spikes in mood levels in the blogosphere,and Thelwall (2006) analyze the bloggers’ reactions during the London attacks in2006. Signals from social media are also becoming increasingly popular among therecommender systems community. Shmueli et al. (2012) develop a recommendersystem that suggests, for a given user, suitable news stories for commenting.Phelan et al. (2009) use Twitter to recommend real-time topical news. Chen et al.(2012) recommend personalized tweets to users based on their interests usingcollaborative ranking methods. On a different type of task, Sadilek et al. (2012)try to model the spread of diseases through Twitter, and Sakaki et al. (2010) detectthe course of an earthquake from what users report on Twitter.
An important aspect of social media analysis, with regard to this thesis, is itsrelationship to the news, and vice versa (Kwak et al., 2010; McLean, 2009). Theimportance of this relationship is also supported by the increasing research indiscovering news events in social media (Becker, 2011; Hu et al., 2012; Sayyadiet al., 2009). Even search in social media is to an important degree influenced bynews events (Mishne and de Rijke, 2006b). As a consequence, the text analysisand retrieval communities have begun to examine the relationship between thetwo—news and social media—from a range of angles. In the sections to follow, wewill look at this relationship through three tasks, namely, ranking, link generation,and prediction. But before this we need to say a bit about content representation.
2.2 Content representation
The majority of text mining tasks builts upon some notion of content similarity.But on what basis is one piece of content similar to another? Salton et al. (1975a)addressed this problem with the vector space model where a document dj is repre-sented by a multidimensional vector in which each dimension corresponds to aseparate term (unigram) wi:
dj = (w1,j , w2,j , . . . , wN,j),
where wi,j is the term weight for wi in dj (term weights will be discussed below),andN is the total number of unique terms in the vocabulary, defined over the entirecollection. A different, but equivalent, formulation of this idea is the bag-of-wordsmodel where a document dj is represented as a set of terms wi:
dj = {w1,j , w2,j , . . . , wN,j}.
13 2.2. Content representation
Both formulations build on the assumption that terms occur independently ofeach other. This rather strong assumption of word independence has partiallybeen relaxed by encoding word dependencies using higher order n-grams asterms, and led to improvements in retrieval effectiveness but at the expense ofstorage space (Salton et al., 1975b). Among the many studies on capturing termdependencies, a particularly influential one has been that by Metzler and Croft(2005). They introduced a Markov Random Field model which uses a mixtureof single terms, ordered and unordered phrases for representing queries anddocuments.
The natural language processing (NLP) community has developed more elabo-rate models for content representation based on linguistic analysis. However, theuse of these models has had little impact in IR, so far (Smeaton, 1997); Lease(2010) provides a thorough overview of NLP approaches for IR along with recentdevelopments. Kraaij and Pohlmann (1996) studied the use of part-of-speechtagging on IR tasks, and found that for Dutch, most query terms that appear inrelevant documents are nouns. Arampatzis et al. (1999) compared using onlynouns to all stemmed query terms and found an improvement of 4%. Chen (2002)investigated the effectiveness of compound splitting in Dutch, and found a relativeimprovement of 4–13%; determining which compound words to split and whichto keep can further increase retrieval effectiveness. Hollink et al. (2004) studiedthe use of linguistic analysis in retrieval effectiveness over eight European lan-guages (Dutch, English, Finnish, French, German, Italian, Spanish, and Swedish)and found that a combination of removing diacritics, stemming, and compoundsplitting can improve retrieval effectiveness. Chunking and shallow parsing havealso been studied, but they did not outperform the use of n-grams (Brants, 2003).Word sense disambiguation has been found useful only when the ontology isadapted to the target domain (Volk et al., 2002; Voorhees, 1993; Vossen, 1998).Finally, an important aspect of temporal document collections, such as socialmedia, is time (Alonso et al., 2007). Berberich et al. (2010) enhance contentwith temporal expressions—references to points in time or periods of time—andreport substantial improvements in retrieval effectiveness. Alonso et al. (2011)enhance search result snippets with temporal information, and find that usersprefer them over snippets without temporal information. Finally, Kanhabua (2012)gives a thorough register on the advantages of leveraging temporal informationin temporal document collections, and describes several models that take intoaccount this type of information.
In the majority of the methods above content is represented by the termsit consists of, and therefore the representation is dependent on the languageused leading to a vocabulary gap problem. Several attempts have been madeto bridge this gap. Meij (2010) develops methods for extracting concepts froman ontology which are then merged with the original content. Jijkoun et al.
2. Background 14
(2008) build a name entity normalization system optimized for user generatedcontent, and Khalid et al. (2008) find that representing content with named entitiesleads to improved retrieval effectiveness. Laniado and Mika (2010) investigatehow hashtags are used in Twitter, and develop methods to detect hashtags thatcan be linked to real-world entities. Meij et al. (2012) contextualize tweets byproviding links to Wikipedia pages. Another type of approach is to use informationfrom explicitly linked sources, such as documents that link to the document tobe augmented. Koolen and Kamps (2010); Metzler et al. (2009) enhance webdocument representation using the anchor text from in-links. In the context ofblog post retrieval, Arguello et al. (2008) enhance the content of blog posts withanchor text from Wikipedia pages, and also, represent a blog with the contents ofits individual posts. Another approach is to enhance documents with content fromsimilar documents within the same collection, a process called internal expansionand is based on pseudo relevance feedback (Croft and Harper, 1979; Ruthvenand Lalmas, 2003; Salton, 1971; Salton and Buckley, 1997). The document tobe expanded is regarded as a query and issued to an index (Yang et al., 2009).Then, terms are selected from the top-N retrieved documents as expansion termsto the query. Diaz and Metzler (2006) move beyond internal expansion and useexternal corpora to expand queries for ad hoc retrieval. Weerkamp et al. (2009)also enhance queries using external collections, i.e., a parallel corpus of news, andWikipedia, for blog post search. More recently, on Twitter, Abel et al. (2011) modeluser interests and activities in Twitter by mapping user tweets to news articles forpersonalization purposes. In Chapter 3, we build on the above methods to enhancethe representation of news articles with information from several explicitly linkedsources for discovering social media utterances that discuss a source article.
Next to defining a notion of similarity between documents, a recurring themein content representation, is to compute statistics over the content representationof our choice, e.g., terms, n-grams, concepts. Originally, IR systems were boolean,i.e., the term frequency (or n-grams, concepts, etc.) was neglected. In the vectorspace model, terms were represented by the term frequency, i.e., the number oftimes a term occurs in the document (tf ) Salton et al. (1975a). Another flavor ofterm frequency is the normalized term frequency, which is the raw term frequencydivided by the document length. An extension to this weighting scheme was theinverse document frequency (idf ) defined as the number of documents in which aterms occurs, divided by the number of documents in the collection (Sparck Jones,1972). This resulted in the widely used tf · idf statistic. The intuition behindtf · idf is that the weight (importance) of a term to a document should not onlybe proportional to its frequency, but also to how common it is in the collection,i.e., if it appears in all documents, then it is non-discriminative for any document.
A problem with tf -based methods is that terms that do not occur in the doc-ument are assigned with a zero weight. That means that the similarity measure

15 2.2. Content representation
will operate only on the overlapping terms, increasing the probability of errors.What if we could assign some weight even to unseen terms? This brings us toanother extensively researched topic, that of smoothing (Chen and Goodman,1996; Losada and Azzopardi, 2008; Zhai and Lafferty, 2001b, 2004). Among themany smoothing methods, Jelinek-Mercer smoothing and Dirichlet smoothing arethe most popular in IR. Both methods try to re-estimate the probability of a termwi in a document dj given additional information from the document collection.The original probability of a term is defined as:
P (wi|dj) =n(wi, dj)∑N n(wi, dj)
, (2.1)
where n(wi, dj) is term frequency of wi in dj . Jelineck-Mercer smoothing is thendefined as the linear interpolation of the original term probability with the termprobability in the collection:
P (wi|dj) = λP (wi|dj) + (1− λ)P (wi|C), (2.2)
where C is the collection, and λ is a parameter regulating the weight of eachmodel. When λ = 0 there is no smoothing from the collection, and when λ = 1information from the document is disregarded.
Dirichlet smoothing is more solidly grounded as is it may be derived fromBayesian inference under the condition that terms are sampled from a documentusing the multinomial distribution (we will study this in detail in Chapter 4). Theestimated probability under Dirichlet smoothing becomes:
P (wi|dj) =n(wi, dj) + µP (wi|C)
µ+∑N n(wi, dj)
, (2.3)
where µ is a parameter regulating the amount of smoothing. Typical values for µrange between 1, 500 and 2, 500, however, they are sensitive to the query lengthand the collection (Losada and Azzopardi, 2008).
We have seen several approaches for content representation and for computingstatistics over the representation of choice, each with advantages and disadvan-tages. Is there a way we can take the best of all worlds? The idea of combiningmultiple representations of a query or its underlying information need has a longhistory; Belkin et al. (1995) summarize work on the theme that builds off theearly TREC collections. More broadly, combinations of approaches—either atthe level of queries, sources, or result rankings—have been met with differentdegrees of success. Snoek et al. (2005) identify two types of combination approachdepending on whether the combination occurs at the query level (early fusion) orat the result level (late fusion). In the setting of blog post retrieval, Weerkampet al. (2009) show that the use of multiple query representations (in the form
2. Background 16
of complex query models) helps improve blog post retrieval effectiveness. Inter-estingly, Beitzel et al. (2004) find that combinations of highly effective systemshurt performance as compared to the performance of the individual approaches.McCabe et al. (2001) find that combinations of a poorly performing approach witha good system, using weights where the good system is weighted highly, leads toperformance gains over the good system. In Chapter 3, we apply standard (late)data fusion approaches (Shaw and Fox, 1993), re-examine insights on data fusionfrom the literature and shed new light on the effectiveness of combinations in thecontext of finding implicitly linked utterances task.
Having discussed a few options for representing content, we now move to thethree tasks that we consider in this thesis: ranking, link generation, and prediction.
2.3 Ranking
Viewed abstractly, the tasks we consider in Part I—discovering social media ut-terances that are (implicitly) linked to a given news article or that are verbatimor near-verbatim copies of it—are similar to the (topical) blog post finding taskthat has been examined at the TREC Blog track between 2006 and 2009 (Ouniset al., 2007). There are important differences, though, that motivate approachesto the task of discovering social media utterances that are technically and con-ceptually different from existing approaches to the blog post finding task. Fora start, the information need, and therefore the notion of relevance is different:instead of posts that discuss a topic, we seek to identify utterances that referencea specific article—not a different article that is possibly about the same topic.Among other things, this leads to a dramatically different technical setting, withelaborate information needs (the source article) as opposed to the typical two orthree word queries or two or three line narratives. Moreover, relevant utterancesare necessarily published after the source news article and tend to be publishedreasonably shortly after the source article (Leskovec et al., 2009). Conceptually,we are crossing genres, from edited news (on the query side) to user generatedcontent (on the result side). Below, we proceed with an overview of work onblog post retrieval, near-duplicate detection, and text-reuse. Before doing so, weneed to discuss the main retrieval model that we consider for ranking social mediautterances given a source news article.
Language modeling The main retrieval model we consider builds upon thelanguage modeling paradigm. A statistical language model is simply a probabilitydistribution over all possible representation units (Rosenfeld, 2000). Statisti-cal language models gained popularity in the 1970’s in the setting of automaticspeech recognition (Jelinek, 1997). The first suggestion to use language models

17 2.3. Ranking
in information retrieval came from Ponte and Croft (1998). This work was soonfollowed by work from Hiemstra (1998) and Miller et al. (1999), who both use amultinomial language model. This model honors the probability ranking princi-ple (Robertson, 1977) which postulates that documents with higher probabilitiesto generate the query should rank higher:
Score(Q,D) = P (Q|D) =∏wi∈Q
P (wi|D)n(wi,Q), (2.4)
where P (w|D) is typically defined as one in (2.1), (2.2), or (2.3). This model isstill the most commonly used application of language models for IR. Both OkapiBM25 (Sparck Jones et al., 2000) and language modeling are now often used asbaselines against which new retrieval models are compared or on top of whichnew techniques are applied.
Multinomial language models build on the idea of sampling query terms fromdocuments with replacement. This process works well for query lengths that area small fraction of the length of the documents to be retrieved. In our settingin Chapter 4, however, queries are as long as the documents to be retrieved andthis fact violates the underlying assumption of multinomial language models.The remedy to this problem, as we will see in Chapter 4, is to sample queryterms without replacement. This change in the sampling method replaces themultinomial distribution with the hypergeometric distribution. The univariatecentral hypergeometric distribution has been firstly used in the past to provide atheoretical framework for understanding performance and evaluation measures inIR (Egghe and Rousseau, 1998; Shaw et al., 1997), and for proving the document-query duality (Egghe and Rousseau, 1997).
Wilbur (1993) was the first to use the central hypergeometric distribution ina retrieval setting. The vocabulary overlap of two documents is modeled as ahypergeometric distribution for determining the relevance to each other. Wilbur’smodel initially ignored local and global term weights, such as term frequencieswithin documents or term document frequency. Term weights are integratedinto the final score only later through multiple iterations of the main model.Our retrieval models are able to support local and global term weights in astraightforward manner.
More recently, Bravo-Marquez et al. (2010) derived a query reduction methodfor document long queries using the extended hypergeometric distribution. Bravo-Marquez et al. (2011) develop an efficient method using the central hypergeo-metric distribution for finding similar documents on the web using documents asqueries. Amati (2006a) used the central hypergeometric distribution within theDivergence from Randomness (DFR) framework for deriving the binomial distri-bution, a readily accepted distribution for the generative model. Amati’s modelhas applications in query expansion (He and Ounis, 2007), pseudo-relevance

2. Background 18
feedback (Amati, 2006b), and enterprise search (Macdonald and Ounis, 2007).Hypergeometric retrieval models, just like other retrieval models, are sensitive
to smoothing; Zhai and Lafferty (2001a) investigate the dual role of smoothing inlanguage modeling approaches. A major difference, though, is that smoothing hasto occur on the term frequencies, and not term probabilities limiting the numberof applicable smoothing methods. Chen and Goodman (1996) study severalsmoothing techniques, including Jelinek-Mercer, Dirichlet, Katz, and Good-Turing.Due to the constraints imposed by hypergeometric retrieval models, in Chapter 4we consider only the Jelinek-Mercer and Dirichlet smoothing methods. Smuckerand Allan (2006) compare Jelinek-Mercer and Dirichlet smoothing on standardlanguage modeling and find that the latter has advantages over the former. Losadaand Azzopardi (2008) suggest that the utility of either smoothing method dependson the type of the query, and conclude that Jelinek-Mercer outperforms Dirichletfor long queries. In Chapter 4 we compare hypergeometric retrieval methods usingboth Jelinek-Mercer and Dirichlet smoothing.
Retrieval in social media The first coordinated attempt at evaluating informa-tion retrieval in a social media setting was inaugurated by the blog search taskat TREC in 2007 and 2008 (Macdonald et al., 2009). Participants explored var-ious techniques for improving effectiveness on the blog feed search task: queryexpansion using Wikipedia (Elsas et al., 2008), topic maps (Lee et al., 2008),and a particularly interesting approach—one that tries to capture the recurrencepatterns of a blog—using the notion of time and relevance (Seki et al., 2008).Although some of the techniques used proved to be useful in both years (e.g.,query expansion), most approaches did not lead to significant improvements overa baseline, or even led to a decrease in performance, proving the challengingnature of the task. Other approaches that were applied to this task use randomwalks (Keikha et al., 2009), where connections between blogs, posts, and termsare considered. Weerkamp (2011) offers a thorough description of informationretrieval techniques developed for blog search, and introduces new ones for findingpeoples’ utterances in social media.
One of the themes that has emerged around blog (post) retrieval is the use ofnon-content features. Timeliness is one such feature that is particularly relevantfor our setting. Keikha et al. (2011) propose a method that does take timeinto account and use time-dependent representations of queries and blogs tomeasure the recurring interest of blogs. Another one concerns quality indicators;in Chapter 3 and 5 we use the credibility indicators in (Weerkamp and de Rijke,2012).
With the advent of microblogs, microblog search has become a growing re-search area. The dominant microblogging platform that most research focuseson is Twitter. Microblogs have characteristics that introduce new problems, and
19 2.4. Link generation
challenges for retrieval (Efron, 2011; Teevan et al., 2011). Massoudi et al. (2011)report on an early study of retrieval in microblogs, and introduce a retrieval andquery expansion method to account for microblog search challenges. Efron andGolovchinsky (2011) investigate the temporal aspects of documents on queryexpansion using pseudo-relevance feedback. Efron et al. (2012) study queryexpansion methods for microblog search and find improvements on retrieval effec-tiveness. Naveed et al. (2011) develop a retrieval model that takes into accountdocument length and interestingness defined over a range of features.
In 2011, TREC launched the microblog search track, where systems are askedto return relevant and interesting tweets given a query (Lin et al., 2012). Thetemporal aspect of Twitter and its characteristics, e.g., hashtags, existence ofhyperlinks, were exploited by many participants, for query expansion, filtering, orlearning to rank (Alhadi et al., 2011; Bron et al., 2011c; Cao et al., 2011; Metzlerand Cai, 2012; Miyanishi et al., 2012; Obukhovskaya et al., 2012).
A different perspective to blogs and microblogs is the one of (Potthast et al.,2012) who give an overview of information retrieval tasks on the commentsphere.
In sum, enhancing the document representation with information from eitherthe document collection or external corpora, as well as taking into account cred-ibility indicators and timeliness have proved useful for ranking and retrieval insocial media. We take these findings into account when we develop retrieval andprediction models in the chapters to come. Next, we move on to a particular typeof retrieval, that of link generation.
2.4 Link generation
Link generation has been central in several tasks so far (Bron et al., 2011b; Cohnand Hofmann, 2000; He et al., 2011; Lu and Getoor, 2003). Early research on linkgeneration aimed at automatically constructing hyperlinks for documents (Allan,1995; Green, 1999) for better accessing and browsing the collection (Melucci,1999).
Another widely researched linking task is topic tracking, in which items areconnected when they discuss the same seminal event or related events (Allan,2002). Commonly, this is done within a collection consisting of either a single newssource (Franz et al., 2001) or a collection of multiple textual news services (Radevet al., 2005; Zhang et al., 2002). Work on topic detection and tracking includeswork on detecting novelty and redundancy using language models (Zhang et al.,2002) and new event detection using an adaptation of the vector space model withnamed entities (Kumaran and Allan, 2004). These methods use techniques frominformation retrieval to find link targets, based on similarity. In Chapter 3 we willuse similar methods for identifying links between news and social media posts.
2. Background 20
An early paper on the topic of cross-media linking investigates generatingconnections between news photos, videos, and text on the basis of dates andnamed entities present in texts associated with the items (Carrick and Watters,1997). Ma et al. (2006) investigated cross-media news content retrieval to providecomplementary news information. This was done on the basis of news articlesand closed captions from news broadcasts, and focused on differences in topicstructure in the captions to find complementary news articles for broadcasts. Alsorelevant is work on linking passages from the closed captioning of television newsbroadcasts to online news articles (Henzinger et al., 2005).
In social media, link identification has been used to track short informationcascades through the blogosphere (Adar et al., 2004; Gruhl et al., 2004; Kumaret al., 2004; Leskovec et al., 2007). Yang et al. (2009) investigate methods foridentifying blog posts reporting similar content given a news article. They extractphrases from a “query document” (the news article) and from relevant Wikipediapages, which they later use as queries to a blog post index. Meij et al. (2012)contextualize microblog posts by linking them to Wikipedia pages, and Du et al.(2011) link entities found in fora to Wikipedia entries. Of particular relevance to us,though, is the work by Ikeda et al. (2006) who use similarity between term vectorsthat represent news articles and blog posts to decide on the existence of linksbetween the two. On top of that, Takama et al. (2006) use the difference betweenpublication times of news articles and blog posts to decide on the existence of alink. Gamon et al. (2008) use a graph-based approach to create context for newsarticles out of blog posts. We are interested in discovering utterances that implicitlylink to a specific news article and not to the news event(s) that the article is about.As we will see in Chapters 3 and 4 it is not uncommon for social media utterancesto republish the source article verbatim or near-verbatim. To this end, methods onnear-duplicate detection and text re-use can prove useful in our setting. Below, weproceed with an overview of work on these two areas.
Near-duplicate detection Garcia-Molina et al. (1996) introduce the problem offinding document copies across multiple databases. Manku et al. (2007) adoptsimhash, a document fingerprinting method and hamming distance for efficientnear-duplicate detection in web crawling; we used simhash as a baseline in ourcomparisons. Chang et al. (2007) focus on finding event-relevant content usinga sliding window over lengths of sentences. Muthmann et al. (2009) discovernear-duplicates within web forums for grouping similar discussion threads together.They construct a document’s fingerprint from a four dimensional vector whichconsists of domain (in-)dependent text-based features, external links, and semanticfeatures. Kolak and Schilit (2008) find popular quoted passages in multiple sources,and use them to link these sources. Abdel-Hamid et al. (2009) detect the origin oftext segments using shingle selection algorithms. Zhang et al. (2010) use a two

21 2.5. Prediction
stage approach for finding partial duplicates with applications to opinion miningand enhanced web browsing: sentence level near-duplicate detection (Jaccarddistance) and sequence matching. The tasks considered in this paper are similar toours, however: the authors focus on pruning techniques, whereas in Chapter 4,we aim at discovering effective and robust methods, the output of which needslittle, if any, further processing.
Text re-use Broder (1997) introduces the mathematical notions of “resemblance”and “containment” to capture the informal notions of “roughly the same” and“roughly contained” and proposes efficient methods using document fingerprintingtechniques. These notions correspond to our “strict” and “loose” interpretationsof the republished article finding task to be defined in Chapter 4 below. Seo andCroft (2008) compare a set of fingerprinting techniques for text reuse on newswireand blog collections. One of their findings, which we also share, is how text inblogs layout affects the performance of fingerprinting methods. Kim et al. (2009)propose an efficient overlap and content reuse detection in blogs and news articles.They find that blog posts contain large amounts of exact quotations from thenews articles. However, for the particular task, they find that blog posts raisesignificant challenges against retrieval (Kim et al., 2010). Bendersky and Croft(2009) consider the issue of text reuse on the web. They address the task usingthree methods: word overlap, query likelihood, and mixture models. This work isof particular interest to us, as we focus on a better understanding the effectivenessof query likelihood using hypergeometric document models in Chapter 4.
2.5 Prediction
So far we have concentrated on content and have left out the people who generatethis content. Here, we put users back on stage. In Part II, we look at threeprediction tasks where the understanding of user behavior plays an important role.Below we review related work on activity patterns in social media, prediction, anduser browsing behavior.
Activity patterns in social media Lifshits (2010) find that more than 80% of theactivity around a news article happens in the first 24 hours after publication. Onaverage, a story has 5–20 social actions per 1,000 pageviews. For most news feeds,the top 7 stories in a week capture 65% of Facebook actions and 25% of retweetsover all stories. Yin et al. (2012) found two groups of news readers based on theirinteraction patterns with the news. The first group follows the majority trend, i.e.,they like articles that most people like, and the second group does not. Based onthis finding they develop a model to simulate the voting process for predicting

2. Background 22
potential popular articles. Duarte et al. (2007) engage in describing blogosphereaccess patterns from the blog server point, and identified three groups of blogsusing the ratio of posts over comments: broadcast-, parlor-, and register-type.Kaltenbrunner et al. (2007b) measured community response time in terms ofcomment activity on Slashdot stories, and discovered regular temporal patternson people’s commenting behavior. Lee and Salamatian (2008) report that theamount of comments in a discussion thread is inverse proportional to its lifespanafter experimenting with clustering threads for two online discussion fora, and fora social networking site. Choudhury et al. (2009) characterizes conversations inon-line media through their interestingness. Mishne and Glance (2006a) looked atweblog comments and revealed their usefulness for improving retrieval and foridentifying blog post controversy. Schuth et al. (2007) explore the news commentsspace of four on-line Dutch media. They describe the commenters, the peopleleaving comments, and derive a method for extracting discussion threads fromcomments. Similar to our work in Chapter 6, Tatar et al. (2011) explore how thenumber of users’ comments during a short observation period after publication canbe used to predict the expected popularity of articles published in a countrywideonline newspaper. Another body of work engaged in finding whether differenttypes of activity, e.g., comments, likes, diggs, follow similar patterns. Spiliotopoulos(2010) compares diggs and comments on digg stories on the collaborative newssite Digg. They measure comments-to-diggs ratio across digg categories, and findthat the distribution of comments-to-diggs is far from uniform and depends on thecategory. This finding is an indication that commenting and digging are driven bydifferent processes. Xia (2012) undertake a similar task in the domain of onlineopen courses, and find that views and comments are not always correlated, andthat the number of comments on an online course depends on the subject of thecourse. In Chapter 6, we look at patterns of commenting behavior on news articlesfrom seven Dutch news agents.
How can we model user activity behavior? Previous work finds that the distribu-tion of comments over blog posts is governed by Zipf’s law (Mishne and de Rijke,2006a; Mishne and Glance, 2006a; Schuth et al., 2007). Lee and Salamatian(2008) uses the Weibull distribution for modeling comments in discussion threads.Kaltenbrunner et al. (2007a) point to discussions in the literature for selectingthe log-normal over the Zipf distribution for modeling. For their experiments,they use four log-normal variants to model response times on Slashdot stories.Ogilvie (2008) models the distribution of comment counts in RSS feeds usingthe negative binomial distribution. Szabo and Huberman (2010) model diggsand YouTube views with an exponential distribution. Yang et al. (2012) analyzethe users posting behavior on Twitter, Friendfeed, and Sina Weibo (a Chinesemicroblogging website), and find that user behavior follows a heavy tailed orpower-law distribution both in collective and individual scale, and not the tradi-
23 2.5. Prediction
tional Poisson processes hypothesis. Wang et al. (2012) engage in understandingthe different modeling decisions of user posting behavior, and find both heavy andlight tailed distributions emerging from the Weibull distribution, however, the useof either family of distributions depends on the platform for which user behavioris being modeled. In Chapter 6, we model user commenting behavior using bothheavy and light tailed distributions, i.e., the log-normal, and the negative binomialdistribution.
Prediction in social media Based, in part, on the models just listed, variousprediction tasks and correlation studies have recently been considered in socialmedia. Mishne and de Rijke (2006a) use textual features as well as temporal meta-data of blog posts to predict the mood of the blogosphere. Carmel et al. (2010)predict the number of comments on blogs using novelty measures. De Choudhuryet al. (2008); Kharratzadeh and Coates (2012) correlate blog dynamics with stockmarket activity, and Gruhl et al. (2005) perform a similar task with blogs/reviewsand book sales. Bothos et al. (2010) use content from Twitter, and several movierelated web sites for predicting the Oscar award winners. Lerman et al. (2008)forecast the public opinion of political candidates from objective news articles.They use four types of feature: bag of words, news focus change, names entities,and dependency features. In the domain of user-contributed reviews, structural,lexical, syntactic, semantic and metadata features have been used for automaticassessment of review helpfulness (Kim et al., 2006). In the domain of onlinediscussions, the quality of posts has been automatically assessed using a combina-tion of features from categories with the following designations: surface, lexical,syntactic, forum specific and similarity (Weimer et al., 2007). Community-basedanswers to questions have also been automatically assessed for quality, expressedas user satisfaction (Agichtein et al., 2008). In the same line of work, Liu et al.(2008) try to predict whether a question author will be satisfied with the answerssubmitted by the community participants. They develop a prediction model usinga variety of content, structure, and community-focused features for this task. Ina web setting, Konig et al. (2009) develop a model for predicting click-throughrate on news articles using query-only, query-context, and the retrieval score usingBM25. Query-context features are extracted from Wikipedia, blogs, and news.
Szabo and Huberman (2010) predict the popularity of a news story or a videoon Digg or YouTube, given an item’s statistics over a certain time period afterpublication. Traffic fluctuates between day and night, and to compensate for this,they introduce per source relative time based on the total number of “diggs” or“video views” across the source divided by the total number of hours they havedata for. They discover that the required time before an item becomes populardepends on the source and the medium: 7 hours for a story to become popularon Digg, compared to 10 days for a video on YouTube. Lerman and Hogg (2010)
2. Background 24
extend on this work by introducing stochastic models of user behavior. Bandariet al. (2012) engage in predicting the popularity of online news before they arepublished, a setting we will look closely in Chapter 6. Finally, in the same line ofwork but aimed at news events instead of individual news articles is the work ofGaugaz et al. (2012). They use features similar to ours for predicting the numberof news articles that will be published for a news event.
Researchers in the area of text-based user generated content tackle issues ofwide quality fluctuations that also pose a challenge in the podosphere, the totalityof the totality of all podcasts on the internet. Moving away from textual content,in the multimedia analysis community, much work has been dedicated to assessingquality of service which can be used as predictor for preference or popularity. Ofparticular relevance here is the concept of quality of perception, cf., e.g., (Ghineaand Thomas, 2005), which emphasizes the user perspective on the technical issuesof quality of service. This work recognizes the impact of topic-independent videocharacteristics on user satisfaction during the multimedia consumption experience.In the domain of multimedia, surface features such as length and temporal patternshave been shown to contain useful information for retrieval (Westerveld et al.,2006). Waters et al. (2012) perform a content analysis of 67 environmentalpodcasts partially based on the PodCred framework we develop in Chapter 5,and find that although inclusion of these strategies and techniques has statisticalcorrelation to podcast popularity, organizations are only modestly incorporatingthem into their podcasts.
User browsing behavior The increased availability of query sessions comingfrom the logs of search engines has grown a research area that deals with studying,mining and making use of trails and user actions to improve search (Joachims,2002). Search trails are sequences starting with a query and ending on a destina-tion page, with a series of intermediate pages browsed by the user. For instance,these trails are a useful signal in order to learn a ranking function (Agichtein et al.,2006; Bilenko and White, 2008) or to display the trails directly to the user (Singlaet al., 2010) to help in the information seeking process. These approaches try toemploy the query session information as implicit feedback in order to incorporate itinto the ranking process. Part of this process is to identify the user intent, which isa challenging task (Calderon-Benavides et al., 2010). Jansen et al. (2008) presenta classification of user intent in web searching. Following early work by Broder(2002), they group user intent into transactional, navigational or informational,and derive features for each group for the purpose of classifying web queriesinto one of these classes. They find that 80% of web queries are informationalin nature. Gonzalez-Caro and Baeza-Yates (2011) extended this work by takinginto account the multi-faceted nature of queries. Most of these approaches aretrained on click-through data (Lee et al., 2005), and they are used in personalizing
25 2.5. Prediction
search results to predicting ad click-through (Ashkan et al., 2009), or search resultdiversification (Chapelle et al., 2011; Santos et al., 2011).
Guo et al. (2011) look at intent-aware query similarity for query recommenda-tion. Intent is identified in search result snippets, and click-through data, over anumber of latent topic models. Our approach as defined in Chapter 7 differs inthat intent is modeled to capture the characteristics of the news domain and wedo not recommend queries, but rather news articles. We also do not attempt toclassify queries into a predefined set of categories, but rather we use the content ofthe clicked articles as an extended representation of the user intent. Finally, thereexist other possibilities for article recommendation, for instance those based onthe exploration-exploitation framework, e.g., (Li et al., 2010). Those approachesrequire a significant amount of click-through traffic and in general are content-agnostic, using as similarity features clicks shared between users.


Part ITracking Content
The first part of the thesis focuses on the first research theme: tracking content.A key process within content tracking is link generation where links need to beestablished between a source document (the document we want to track), andother documents within the same or other domains. This process can be repeatedfor every document in the collection for generating a hierarchy of links startingfrom the source document. In the setting of timestamped collections, such associal media, this hierarchy can be laid out over time, resulting in an analogousrepresentation to a discussion thread as witnessed in fora or commenting facilitiesand as such can reveal the evolution of the discussion around a source document.Analysis of this hierarchy of content over time can prove helpful for a range oftasks that we have reviewed in Chapter 2.
Our focus in the next two chapters is to develop robust methods for cross-domain link generation. We concentrate on two particular domains, these of onlinenews and social media. Our choice is motivated from the symbiotic relationshipof the two. One of the challenges here is to bridge the vocabulary gap betweenedited (news) and unedited (social media) content; we will elaborate more onthis in the next chapter. In particular, in Chapter 3 we undertake the task ofdiscovering implicitly linked social media utterances for a news article using an IRapproach: a source article is regarded as a query which is issued to an index ofsocial media utterances. Then, the retrieved utterances are candidate links to thesource article. Our main concern is on how to model the source article for bridgingthe vocabulary gap between the two domains. For this purpose, we use contentfrom utterances across several social media platforms that are explicitly linked tothe article (i.e., they provide a hyperlink to it). In Chapter 4 we revisit this taskwith a focus on social media utterances that repost verbatim or near-verbatim asource article. We use the same IR approach as before, however, this setting is verydifferent from ad hoc IR because of the different average query length of queries.In ad hoc retrieval, query lengths are typically a small fraction of the length ofthe documents to be retrieved, however, here, the query (source article) and theutterances to be retrieved are of similar length. This characteristic violates theassumption behind the widely used query likelihood model in IR, i.e., samplingquery terms from a document with replacement. We provide a remedy by samplingquery terms without replacement.
27


3Linking Online News
and Social Media
In this chapter, we address the following linking task: given a news article, find so-cial media utterances that implicitly reference it. We follow a three-step approach:we derive multiple query models from a given source news article, which are thenused to retrieve utterances from a target social media index, resulting in multipleranked lists that we then merge using data fusion techniques. Query models arecreated by exploiting the structure of the source article and by using explicitlylinked social media utterances that discuss the source article. To combat querydrift resulting from the large volume of text, either in the source news article itselfor in social media utterances explicitly linked to it, we introduce a graph-basedmethod for selecting discriminative terms.
For our experimental evaluation, we use data from Twitter, Digg, Delicious, theNew York Times Community, Wikipedia, and the blogosphere to generate querymodels. We show that different query models, based on different data sources,provide complementary information and manage to retrieve different social mediautterances from our target index. As a consequence, data fusion methods manageto significantly boost retrieval performance over individual approaches. Our graph-based term selection method is shown to help improve both effectiveness andefficiency.
3.1 Introduction
A symbiotic relation has emerged between online news and social media such asblogs, microblogs, social bookmarking sites, news comments and Wikipedia. Muchof what is discussed in social media is inspired by the news (e.g., 85% of Twitterstatuses are news-related (Kwak et al., 2010)) and, vice versa, social media provide
29

3. Linking Online News and Social Media 30
us with a handle on the impact of news events (Becker et al., 2010; Leskovec et al.,2009; Mathioudakis et al., 2010). A key ingredient is to discover and establishlinks between individual news articles and the social media that discuss them.
Social media utterances (such as blog posts, tweets, diggs, etc) may be linkedexplicitly or implicitly to a news article. In explicitly linked utterances there is ahyperlink pointing to the article; automatic discovery of such utterances is trivial.In implicitly linked utterances, however, there is no hyperlink to the source article—the utterance is not merely about the same topic as the source news article butit directly discusses the article’s content. Consider an utterance discussing theFIFA World Cup 2010 final, expressing the utterance writer’s opinion on the match.This is not considered an implicitly linked utterance; would this utterance criticizethe match report given in a news article, however, then it would be an implicitlylinked utterance for this news article.
The task on which we focus in this chapter is discovering implicitly linked socialmedia utterances: for a given news article we discover social media utterancesthat discuss the article. Both the notion of relevance (detailed above) and the factthat, to address the task, one needs to cross from edited content to the uneditedand strongly subjective language usage of user generated content, make the taskchallenging. To quantify the potential “vocabulary gap” (Bell, 1991; Chen, 1994;Furnas et al., 1987) we conduct an exploratory experiment. We consider a setof news articles plus a range of social media platforms; for each news article wecompute the (symmetric) Kullback-Leibler (KL) divergence between the article andthe social media utterances explicitly linked to it (grouped by platform) as a wayof approximating the difference in vocabularies; see Fig. 3.1 for a visualization. Weobserve varying levels of difference in vocabulary between news and social media.The vocabularies of blog posts, Digg and Twitter seem relatively close to that ofthe news articles—anecdotal evidence suggests that this is due to these sourcescopying parts of the original news article. Moreover, the social media platformsshow varying degrees of difference between their vocabularies.
When attempting to link social media utterances to a given news article, themain question is: how do we represent the article as a query? Typically, thearticle itself has a fielded structure (title, lead, body, headers, etc) that can beexploited (Allan, 2002; Bell, 1991; LDC, 2008). Which of these is helpful inidentifying implicitly linked social media utterances? Alternatively, one can try toidentify a selection of “representative” terms from the article (Allan, 2002; Beckeret al., 2010; Ikeda et al., 2006). Given the noisy or unedited character of manysocial media utterances, the selection procedure needs to be very robust. Thereis a third alternative, based on the observation that there may be many socialmedia utterances that explicitly reference a given news article. For a sample ofnews articles (described in Section 3.4.3), Table 3.6 displays the number of articlesthat are explicitly referenced by the six social media platforms considered above.

31 3.1. Introduction
News comm.NYT
DiggTwitte
r
Blog posts
Delicious
Wikipedia
News comm.
NYT
Digg
Blog posts
Delicious
Wikipedia
Figure 3.1: Average symmetric Kullback-Leibler divergence between New YorkTimes articles and explicitly linked social media utterances from Digg, Twitter, blogposts, New York Times comments, Delicious, Wikipedia. Larger circles indicate ahigher degree of divergence and hence a bigger difference in vocabulary.
What if we used representations of a news article generated from social mediautterances that explicitly link to it?
Given these options, we approach the task of discovering implicitly linkedsocial media utterances for a news article as a data fusion problem. We generatemultiple query models for an article, based on three strategies: (i) its internaldocument structure, (ii) explicitly linked social media utterances, and (iii) termselection strategies. This yields ranked lists per strategy and these ranked lists arethen merged using data-fusion methods. The main research question we aim toanswer is:
RQ 1. What is the retrieval effectiveness of modeling source articlesusing different strategies for retrieving implicitly linked socialmedia utterances?
We break down this research question into five sub-questions:

3. Linking Online News and Social Media 32
RQ 1/1. Does the internal document structure of a news article helpto retrieve implicitly linked social media utterances?
RQ 1/2. Do query models derived from social media models outper-form models based on internal document structure?
RQ 1/3. Is implicit link discovery effectiveness affected by using re-duced query models that only use a limited selection ofwords?
RQ 1/4. How can ranked lists from individual strategies be fused toimprove performance?
RQ 1/5. What is the effect on retrieval effectiveness when we usea fusion strategy dependent on the news article for whichwe are seeking implicitly linked utterances versus a fusionstrategy that is independent of the news article?
When talking about effectiveness of a method, we consider the performance of themethod in terms of recall or precision-oriented metrics. Efficiency on the otherhand deals with a method’s performance in terms of speed.
Our main contributions in this chapter are the following: (a) we introducethe task of discovering social media utterances implicitly linked to a news article;(b) we offer a comparison of query models derived from (i) the document itself and(ii) auxiliary social media platforms in terms of the effectiveness of finding implic-itly linked utterances; (c) we propose a robust graph-based term selection method,apply it to document and social media models, and compare the effectiveness andefficiency of these reduced models to the original models; and (d) we comparethree types of late data fusion methods for combining ranked lists: (i) withouttraining, (ii) query independent training, and (iii) query dependent training.
The rest of the chapter is organized as follows: We present our approach inSection 3.2, our models are presented in Section 3.3, our experimental setupis described in Section 3.4, we report on results and discuss our findings inSection 3.5, and conclude in Section 3.6.

33 3.2. Approach
3.2 Approach
Starting from a source news article, we need to identify, in a target index, utterancesthat reference the source article. We view this task as a data fusion problem: startingfrom the source article, we derive and apply query models to generate multiplequeries, which are then used to retrieve utterances from the target index, resultingin multiple ranked lists that we then merge into a single result list; see Fig. 3.2.Let us motivate these steps.
q1
qn
sourcenewsarticle
targetindex
...
multipleresultlists
mergedresultlist
multiplequeries
query modeling retrieving social media fusion
...
Figure 3.2: Approach to finding linked social media utterances.
Most of our attention in this chapter will be devoted to the query modeling step.Importantly, in the process of identifying social media utterances that reference agiven source news article, we are crossing genres, from news to social media. Whencrossing genres, the vocabulary gap between source article (“the query”) and targetutterances (“the documents”) is wider than within genres, especially when one ofthe genres involved is a social media genre (Weerkamp et al., 2009). To bridgethe gap, we follow multiple alternative routes: starting from the source article,we consider multiple query modeling strategies, i.e., ways of arriving at a queryto be fired against the target index. First, we consider different representationsof the source news article itself. It is a semi-structured document that featureselements such as title, lead and body. Derived representations such as the namedentities mentioned in the article and quotations from interviews can also be usedto represent the article and generate queries. Second, to help generate queriesthat represent the source article we also use auxiliary social media. Intuitively, to

3. Linking Online News and Social Media 34
bridge between the language usage of the source article and that of the utterancesin the target index, we can exploit social media where the two types of languageusage are, to some degree, mixed. E.g., a Digg story usually consists of thenews article title and summary (edited content) and the user comments (uneditedcontent), tweets mix the article title (edited ) with the twitterer’s opinion/comment(unedited).
The textual representations from which queries are derived may be quite longas compared to, for example, article titles. E.g., when focusing on the source newsarticle, the entire title and body of the article can be used as a query (Metzleret al., 2005); such long queries, however, are costly to process and may introducenoise and cause topic drift. For this reason, we identify and extract terms that arediscriminative and characteristic of language usage pertinent to the source article(or auxiliary social media) and use these to derive a query.
In the retrieval step, we submit queries representing the source news articleto an index of social media utterances, and retrieve ranked lists for each of thesequeries.
In the fusion step, we use late data fusion methods (Shaw and Fox, 1993; Snoeket al., 2005) to merge results lists produced by alternative query modeling methods.For the methods that support weighted fusion, we investigate two approachesfor weight optimization: query independent and query dependent. In the formerapproach, the system learns weights for each query model from a training set soa given metric is maximized, and then these weights are used for fusing rankedlists in response to future articles. In the latter approach, weights are learned persource article (“query”) so the given metric is maximized for an article-specifictraining ground truth.
3.3 Methods
We describe the methods used in addressing the three steps identified in the ap-proach outlined in Section 3.2: retrieving social media utterances, query modelingand data fusion.
3.3.1 Retrieval model
For the retrieval step, we use a language modeling approach. We compute thelikelihood of generating a news article a from a language model estimated froman utterance u:
Plm(a|u) =∏w∈a P (w|u)n(w,a), (3.1)
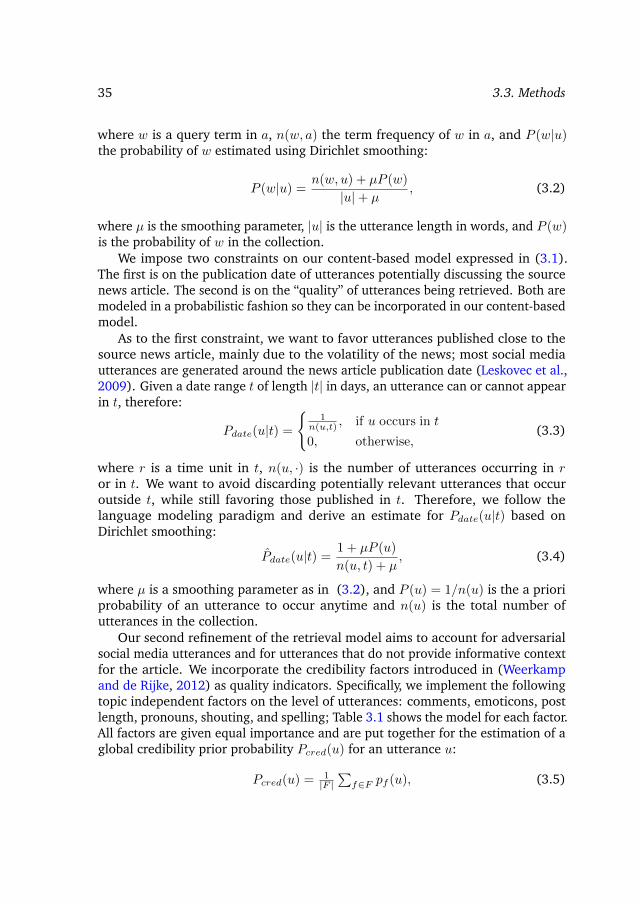
35 3.3. Methods
where w is a query term in a, n(w, a) the term frequency of w in a, and P (w|u)the probability of w estimated using Dirichlet smoothing:
P (w|u) =n(w, u) + µP (w)
|u|+ µ, (3.2)
where µ is the smoothing parameter, |u| is the utterance length in words, and P (w)is the probability of w in the collection.
We impose two constraints on our content-based model expressed in (3.1).The first is on the publication date of utterances potentially discussing the sourcenews article. The second is on the “quality” of utterances being retrieved. Both aremodeled in a probabilistic fashion so they can be incorporated in our content-basedmodel.
As to the first constraint, we want to favor utterances published close to thesource news article, mainly due to the volatility of the news; most social mediautterances are generated around the news article publication date (Leskovec et al.,2009). Given a date range t of length |t| in days, an utterance can or cannot appearin t, therefore:
Pdate(u|t) =
{1
n(u,t) , if u occurs in t
0, otherwise,(3.3)
where r is a time unit in t, n(u, ·) is the number of utterances occurring in ror in t. We want to avoid discarding potentially relevant utterances that occuroutside t, while still favoring those published in t. Therefore, we follow thelanguage modeling paradigm and derive an estimate for Pdate(u|t) based onDirichlet smoothing:
Pdate(u|t) =1 + µP (u)
n(u, t) + µ, (3.4)
where µ is a smoothing parameter as in (3.2), and P (u) = 1/n(u) is the a prioriprobability of an utterance to occur anytime and n(u) is the total number ofutterances in the collection.
Our second refinement of the retrieval model aims to account for adversarialsocial media utterances and for utterances that do not provide informative contextfor the article. We incorporate the credibility factors introduced in (Weerkampand de Rijke, 2012) as quality indicators. Specifically, we implement the followingtopic independent factors on the level of utterances: comments, emoticons, postlength, pronouns, shouting, and spelling; Table 3.1 shows the model for each factor.All factors are given equal importance and are put together for the estimation of aglobal credibility prior probability Pcred(u) for an utterance u:
Pcred(u) = 1|F |∑f∈F pf (u), (3.5)
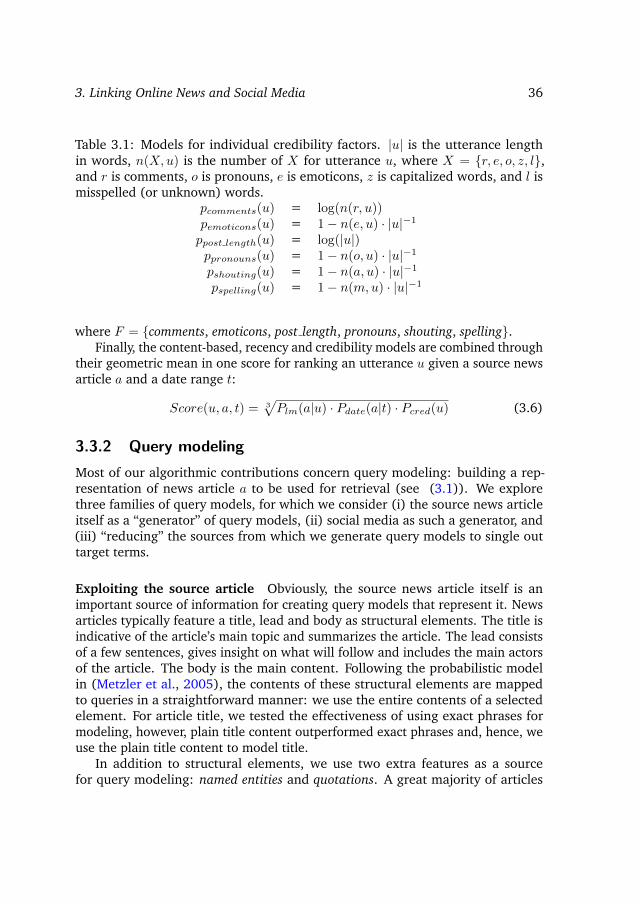
3. Linking Online News and Social Media 36
Table 3.1: Models for individual credibility factors. |u| is the utterance lengthin words, n(X,u) is the number of X for utterance u, where X = {r, e, o, z, l},and r is comments, o is pronouns, e is emoticons, z is capitalized words, and l ismisspelled (or unknown) words.
pcomments(u) = log(n(r, u))pemoticons(u) = 1− n(e, u) · |u|−1
ppost length(u) = log(|u|)ppronouns(u) = 1− n(o, u) · |u|−1
pshouting(u) = 1− n(a, u) · |u|−1
pspelling(u) = 1− n(m,u) · |u|−1
where F = {comments, emoticons, post length, pronouns, shouting, spelling}.Finally, the content-based, recency and credibility models are combined through
their geometric mean in one score for ranking an utterance u given a source newsarticle a and a date range t:
Score(u, a, t) = 3√Plm(a|u) · Pdate(a|t) · Pcred(u) (3.6)
3.3.2 Query modeling
Most of our algorithmic contributions concern query modeling: building a rep-resentation of news article a to be used for retrieval (see (3.1)). We explorethree families of query models, for which we consider (i) the source news articleitself as a “generator” of query models, (ii) social media as such a generator, and(iii) “reducing” the sources from which we generate query models to single outtarget terms.
Exploiting the source article Obviously, the source news article itself is animportant source of information for creating query models that represent it. Newsarticles typically feature a title, lead and body as structural elements. The title isindicative of the article’s main topic and summarizes the article. The lead consistsof a few sentences, gives insight on what will follow and includes the main actorsof the article. The body is the main content. Following the probabilistic modelin (Metzler et al., 2005), the contents of these structural elements are mappedto queries in a straightforward manner: we use the entire contents of a selectedelement. For article title, we tested the effectiveness of using exact phrases formodeling, however, plain title content outperformed exact phrases and, hence, weuse the plain title content to model title.
In addition to structural elements, we use two extra features as a sourcefor query modeling: named entities and quotations. A great majority of articles
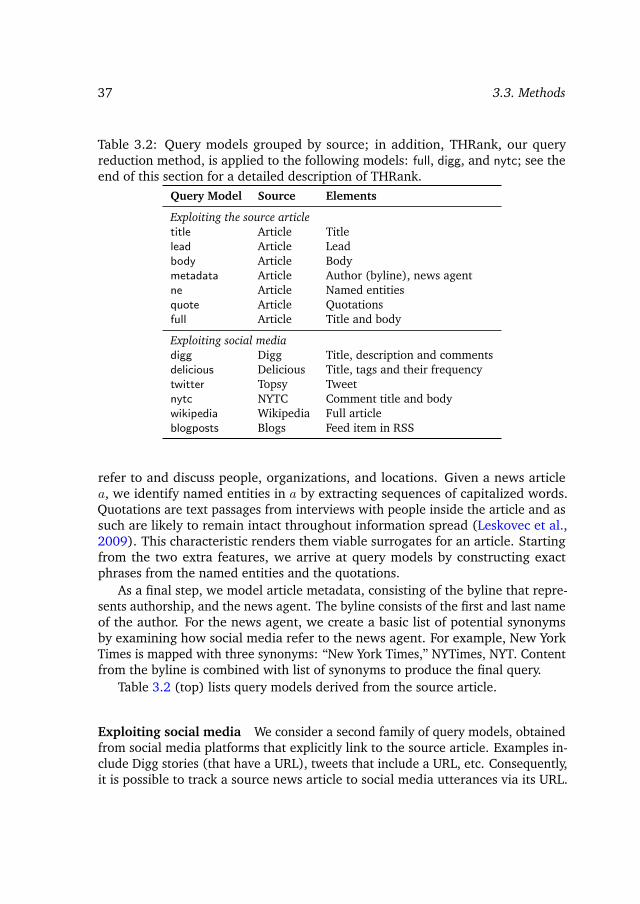
37 3.3. Methods
Table 3.2: Query models grouped by source; in addition, THRank, our queryreduction method, is applied to the following models: full, digg, and nytc; see theend of this section for a detailed description of THRank.
Query Model Source Elements
Exploiting the source articletitle Article Titlelead Article Leadbody Article Bodymetadata Article Author (byline), news agentne Article Named entitiesquote Article Quotationsfull Article Title and body
Exploiting social mediadigg Digg Title, description and commentsdelicious Delicious Title, tags and their frequencytwitter Topsy Tweetnytc NYTC Comment title and bodywikipedia Wikipedia Full articleblogposts Blogs Feed item in RSS
refer to and discuss people, organizations, and locations. Given a news articlea, we identify named entities in a by extracting sequences of capitalized words.Quotations are text passages from interviews with people inside the article and assuch are likely to remain intact throughout information spread (Leskovec et al.,2009). This characteristic renders them viable surrogates for an article. Startingfrom the two extra features, we arrive at query models by constructing exactphrases from the named entities and the quotations.
As a final step, we model article metadata, consisting of the byline that repre-sents authorship, and the news agent. The byline consists of the first and last nameof the author. For the news agent, we create a basic list of potential synonymsby examining how social media refer to the news agent. For example, New YorkTimes is mapped with three synonyms: “New York Times,” NYTimes, NYT. Contentfrom the byline is combined with list of synonyms to produce the final query.
Table 3.2 (top) lists query models derived from the source article.
Exploiting social media We consider a second family of query models, obtainedfrom social media platforms that explicitly link to the source article. Examples in-clude Digg stories (that have a URL), tweets that include a URL, etc. Consequently,it is possible to track a source news article to social media utterances via its URL.

3. Linking Online News and Social Media 38
The idea is to create query models by aggregating content from a range of socialmedia sources, for two reasons:
1. not all sources cover all news articles with the same intensity;2. different social media may exhibit different language usage around the same
source article.
By sampling content from multiple social media sources we increase the possibilityof capturing the creativity in the language usage. We use a small number of socialmedia platforms with frequent explicit links to news articles: Digg, Delicious,Twitter and NYT Community (NYTC); see Section 3.4 for details. We also usecontent from blog posts that hyperlink to a source article and Wikipedia articlesrelevant to the article (Weerkamp et al., 2009).
Data harvested from social media platforms that explicitly links to a sourcenews article is used as follows for the purposes of query modeling. Similarly tohow we modeled internal structure elements, we use the entire contents from allelements in a source to model the news article. E.g., for a Digg story that linksto a news article, we take all text from the story title, from the story descriptionand from all comments, if any, attached to the story. For blog posts that includea hyperlink to the article, we consider the text of the post in the blog’s feed.For Wikipedia, we use the source article’s title to retrieve the ten most relevantWikipedia articles from a Wikipedia index and use their content to model the newsarticle.
Using social media for query modeling purposes raises issues. First, accumu-lating content from multiple blog posts and Wikipedia articles can lead to noisyqueries. We reduce the model size by applying a graph-based term selectionmethod (see below). Second, looking at other social media platforms, some newsarticles are “comment magnets,” accumulating thousands of comments. Third,with platforms that allow for the creation of hierarchical discussion threads, therelevancy of a comment to the source news article is dependent on its level in thethread. To limit potential topical noise, we perform comment selection (dependenton the platform) based on comment metadata. Next, we look at two methods forranking comments for Digg and NYTC.
For a Digg comment dc, we consider the number of positive (up) and negative(down) votes, the number of replies (replies) to the comment and the depth (level)of the comment in the thread:
Rank(dc) =(replies+ 1) · (up− down)
elevel(3.7)
The formula rewards comments with a high number of positive votes that triggeredfurther discussion (replies) and that are more likely to be about the article thanabout other comments (level).

39 3.3. Methods
For a NYT comment nc, we consider the number of recommendations (rec),and whether nc was selected from the editors (se):
Rank(nc) = 2 · (se+ 1) · rec (3.8)
where se is a binary variable of value 1 when the comment is selected by the editorsand 0 otherwise. The formula biases comment selection to highly recommendedcomments that are boosted further when selected from the NYT editors.
Table 3.2 (bottom) lists query models derived using social media.
Reduced query models So far, we have used any and all the data identifiedfor a data source above as “the query model generated from the source.” As aconsequence, these query models (when viewed as lists of words) may be lengthy,which may have a negative impact on retrieval efficiency and potentially also oneffectiveness; see Table 3.6 (top half) for the average query length per source.Next, we aim to identify and extract terms that are discriminative, either for thesource news article at hand or for the discussion surrounding it. To this end weintroduce THRank (“TextHitsRank”), a variation of TextRank (Mihalcea and Tarau,2004). TextRank and other graph-based ranking methods are based on the ideaof “recommendation,” where the importance of a vertex within a word-graph iscomputed using global information recursively drawn from the entire graph. Ourmodifications to TextRank are three-fold: how the graph is constructed, the scoringalgorithm, and the cutoff threshold for the returned terms. We discuss these inturn.
To construct a directed (word) graph for a document, the text is tokenized andstemmed and multi-word named entities are collapsed into a single word. UnlikeTextRank (where only nouns are considered for constructing the graph), we use allterms due to the low recognition accuracy of nouns in noisy text (Dey and Haque,2009). For each token a vertex is created and an edge is added between tokensthat co-occur within a window of two words. Intuitively, the edges are weightedaccording to the number of occurrences of a pair of tokens in the text. Words atsentence boundaries are not connected to avoid accidental recommendations.
We are not only interested in the most discriminative words, but also in theircontext. For this purpose, instead of the PageRank algorithm used by TextRank,we use the HITS algorithm, which makes a distinction between “authorities” and“hubs” (Kleinberg, 1999), for scoring. In our setting, the authority score determineshow important a word is for the article (proceeded by how many words) and thehub score reflects the word’s contribution to the article’s context (how many wordsfollow it).
We use a document-dependent threshold for which terms to select: fromeach set (authorities or hubs), we only return terms whose score is of the samemagnitude as the highest scored term.
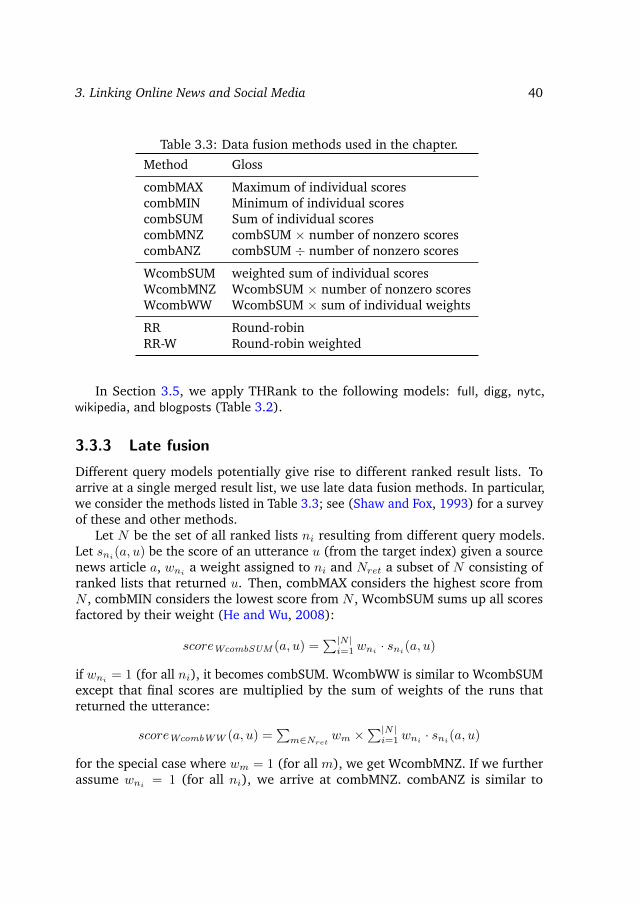
3. Linking Online News and Social Media 40
Table 3.3: Data fusion methods used in the chapter.
Method Gloss
combMAX Maximum of individual scorescombMIN Minimum of individual scorescombSUM Sum of individual scorescombMNZ combSUM × number of nonzero scorescombANZ combSUM ÷ number of nonzero scores
WcombSUM weighted sum of individual scoresWcombMNZ WcombSUM × number of nonzero scoresWcombWW WcombSUM × sum of individual weights
RR Round-robinRR-W Round-robin weighted
In Section 3.5, we apply THRank to the following models: full, digg, nytc,wikipedia, and blogposts (Table 3.2).
3.3.3 Late fusion
Different query models potentially give rise to different ranked result lists. Toarrive at a single merged result list, we use late data fusion methods. In particular,we consider the methods listed in Table 3.3; see (Shaw and Fox, 1993) for a surveyof these and other methods.
Let N be the set of all ranked lists ni resulting from different query models.Let sni(a, u) be the score of an utterance u (from the target index) given a sourcenews article a, wni a weight assigned to ni and Nret a subset of N consisting ofranked lists that returned u. Then, combMAX considers the highest score fromN , combMIN considers the lowest score from N , WcombSUM sums up all scoresfactored by their weight (He and Wu, 2008):
scoreWcombSUM (a, u) =∑|N |i=1 wni · sni(a, u)
if wni = 1 (for all ni), it becomes combSUM. WcombWW is similar to WcombSUMexcept that final scores are multiplied by the sum of weights of the runs thatreturned the utterance:
scoreWcombWW (a, u) =∑m∈Nret wm ×
∑|N |i=1 wni · sni(a, u)
for the special case where wm = 1 (for all m), we get WcombMNZ. If we furtherassume wni = 1 (for all ni), we arrive at combMNZ. combANZ is similar to

41 3.4. Experimental setup
combMNZ but final scores are averaged over the number of runs that return theutterance |Nret|:
scorecombANZ (a, u) = 1|Nret| ·
∑|N |i=1 sni(a, u)
Round-robin (RR) chooses one utterance from each ranked list, deleting anyutterance if it has occurred before. Weighted round-robin (RR-W) is similar exceptthat not all ranked lists are available at each round. Each ranked list is assigned asampling frequency, defining every how many rounds it will be sampled.
Normalization of scores between ranked lists is required before producingthe final rankings (Montague and Aslam, 2001). A standard practice is to firstnormalize the document scores per run and then merge them:
snormed,ni(a, u) =sni(a, u)−min(sni(a))
max(sni(a))−min(sni(a)).
We also consider a second normalization method, based on z-scoring, inspiredfrom work in topic detection and tracking (Allan, 2002):
sz-score,ni(a, u) =sni(a, u)− µ
σ,
where µ is the mean of the document score distribution for source news article ain ranked list ni, and σ is the standard deviation.
3.4 Experimental setup
We present our research questions, experiments, dataset and evaluation method.For the purpose of finding social media utterances that reference individual newsarticles, we choose to focus on a single target collection in our experimentalevaluation, namely the blogosphere. Nothing depends on this particular choice,though. Our choice is based on the observation that blogs, unlike many othersocial media, are not limited to a single dominant platform like Digg or Twitter.Content found on individual social media platforms can be biased according to theplatform’s user demographics.
3.4.1 Experiments
To answer our research questions in the beginning of this chapter (see p. 31), weconduct two sets of experiments, aimed at (i) query modeling and (ii) late fusion.

3. Linking Online News and Social Media 42
Performance of three families of query models In this set of experiments weanswer RQs 1/1–1/3. For each of the three families (document structure,social media, and reduced models) we construct queries, and submit themto an index of blog posts. We measure the performance of each model indi-vidually, and compare the results. Analysis of the results reveals differencesin performance between the individual models, and the families of models.
Performance of three late fusion types The second set of experiments is aimedat answering RQs 1/4 and 1/5. Here, late fusion techniques are applied tothe ranked lists produced by the individual models. We experiment with10 fusion methods from three types: (i) no training required, (ii) queryindependent training, and (iii) query dependent training. Finally, we test theutility of two different score normalization methods.
3.4.2 Data set and data gathering
The data set that we use as our target social media collection is the Blogs08collection provided by TREC; the collection consists of a crawl of feeds, permalinks,and homepages of 1.3M blogs during early 2008–early 2009. This crawl results ina total of 28.4M blogs posts (or permalinks). We only used feed data, the textualcontent of blog posts distributed by feeds and ignored the permalinks. Two mainreasons underly this decision: (i) our task is precision-oriented and benefits froma clean collection; and (ii) using feed data requires almost no preprocessing of thedata. Extracting posts from the feed data gave us a coverage of 97.7% (27.8Mposts extracted). As a second preprocessing step we perform language detectionand remove all non-English blog posts from the corpus, leaving us with 16.9Mblogs posts. Our index is constructed based on the full content of blog posts.
Our news article dataset is based on the headline collection from the top storiestask in TREC 2009. This is a collection of 102,812 news headlines from the NewYork Times and include the article title, byline, publication date, and URL. For ourexperiments we extended the dataset by crawling the full body of the articles.
As auxiliary collections used in our query modeling experiments, we use datagathered from the following five platforms:
Digg: A collaborative news platform where people submit URLs that they findinteresting.1 We collected 19,608 Digg stories corresponding to the samenumber of articles. On average each story is associated with 26 comments.
Delicious: A social bookmarking site, where people can store the addresses ofweb sites they want to keep.2 We collected 7,275 tagged articles with an
1http://www.digg.com – accessed October 28, 20122http://www.delicious.com – accessed October 28, 2012
43 3.4. Experimental setup
average of 3 unique tags per article, summing up to 3,906 unique tags.
Twitter: We use Topsy, a real-time search engine that indexes content from Twitter,a microblogging platform where people can submit short snippets of text140 characters long.3 We collected tweets that mention 21,550 news articles,with each article being mentioned in 3 tweets on average.4
NYT Community: A web service from New York Times for retrieving commentsregistered on their site.5 We collected comments for 2,037 articles with anaverage of 150 comments per article.
Wikipedia: The collaborative online encyclopedia. We use the Wikipedia dumpthat is included in the Clueweb09 collection,6 containing almost 6 millionpages.
3.4.3 Evaluation
The ideal ground truth for our task would consist of tuples consisting of newsarticles and social media utterances. As a proxy, we follow (Geva and Trotman,2010; Mihalcea and Csomai, 2007; Milne and Witten, 2008) and use items thatare explicitly linked to a given news source. We then remove the explicit links andtest our link generation methods by examining to which extent they succeed atidentifying those explicit links. The reason for choosing this evaluation scheme istwofold: (i) the generation of such ground truth is cheaper than having humanassessors judge whether a blog post is about a news article, and (ii) in thischapter we are interested in examining the relative effectiveness of the suggestedapproaches, not in absolute numbers.
Our ground truth is assembled in two phases. First, for each news article wefind blog posts that include the article’s URL. Second, for each discovered blog postwe look for other blog posts that include its URL. The process continues recursivelyuntil no more blog posts are discovered. For our experiments we sample headlineswith more than ten explicit links and where social media possibly plays a role.For each news article, we take the temporally first five explicitly linked blog postsfor using them in modeling. The remaining blog posts form the article’s groundtruth. This selection procedure results in 411 news articles with an average of 14explicitly linked (“relevant”) blog posts per article.7
3http://www.topsy.com – accessed October 28, 20124Topsy limits access to the ten most recent tweets for a URL. Consequently, the reported average
might not reflect reality.5http://developer.nytimes.com/docs/community_api – accessed October 28, 20126http://boston.lti.cs.cmu.edu/Data/clueweb09/ – accessed October 28, 20127The complete ground truth may be retrieved from http://ilps.science.uva.nl/resource/
linking-online-news-and-social-media – accessed October 28, 2012.

3. Linking Online News and Social Media 44
In our experiments we use the Indri framework (Metzler and Croft, 2004).Each experimental condition returns the top 1,000 results. We report on standardIR measures: recall, mean reciprocal rank (MRR), mean average precision (MAP),and r-precision. Statistical significance is tested using a two-tailed paired t-testand is marked as N(or H) for significant differences for α = .01, or M(and O) forα = .05.
3.4.4 Weight optimization for late fusion
For late fusion methods that allow for weighted fusion, we estimate a weight wnifor each ranked list ni using query independent and query dependent approaches.
Query independent weight optimization Given a set of news articles and a etof ground truth assessments, we seek weights that maximize MAP over a set ofsource articles. For this, we conduct two fold cross-validation and split our groundtruth in two sets of equal size: training (205 articles) and testing (206 articles).First, we learn weights that maximize MAP on the training set and then use thesefor evaluation on the test set. For estimating wni , we follow He and Wu (2008).First, for each ranked list ni in the training set, the MAP score mapni is computed.Then, mapni is used as weight for ni in the test set: wni = mapni . He and Wusuggest that the weight for the best individual run should be factored several timesits MAP score. Fig. 3.3 shows that, in our setting, increasing the weight of the bestindividual run hurts performance.
Query dependent weight optimization Given a news article and a ground truth,we seek weights wni that maximize average precision (AP). Since the weightsare dependent on the query, the ground truth for training and testing should bedifferent. For building the training ground truth, we look for good surrogates ofimplicitly linked blog posts to use as proxy. For this purpose, for an article’s trainingground truth, we consider the temporally first five explicitly linked blog posts. Thetesting ground truth is kept the same as in query independent optimization for theresults to remain comparable. In the training step, the system learns weights suchthat the blog posts in the training ground truth rank at the top. Then, in the testingstep, we report on MAP for the testing ground truth. For estimating wni we usemaximum AP training and line search (Gao et al., 2005), where wn1 , . . . , wnn isconsidered a set of directions in the range [0, 1]. We move along the first directionin steps of 0.2 so that AP is maximized; then move from there along the seconddirection to its maximum, and so on. We cycle through the whole set of directionsas many times as necessary, until AP stops increasing.
For query dependent and query independent fusion, we combine all availableranked lists except from the blogposts model. The later is excluded because it

45 3.5. Results and analysis
exploits the same explicitly linked blog posts to model the news article with thoseused as training ground truth in query dependent fusion. Also, for models that havereduced counterparts, we select the one performing the best. This selection leadsto 11 models: title, lead, ne, quote, metadata, full, digg-comm, delicious, nyt-comm,twitter, and wikipedia-graph.
3.5 Results and analysis
We report on our results from the experiments in Section 3.4 for query modelingand late fusion and conduct an analysis on our findings.
3.5.1 Query modeling
We turn to the results of our query modeling approach; each paragraph discussesone of the research questions at the start the chapter (see p. 31). Next, we performan analysis of the results to gain more insight.
RQ 1/1. Internal document structure vs. article title Our baseline is set to thequery model derived from an article’s title only. This choice is supported by twoconsiderations: first, the article’s title is the most compact representation of theentire article and second, the article’s title was chosen in prior research for rankingnews headlines according to their mentions in the blogosphere (Macdonald et al.,2010).
Table 3.4 (top) reports on results from models derived from the article’s internaldocument structure. The best performing model is the one that uses the full article,namely, content from the article’s title and body. The high performance of fullis possibly due to blog posts picking up different aspects of the article that arenot available in more compact representations such as title and lead. Both ne andquotes show a precision-enhancing effect over the baseline, at the cost of a drop inrecall. Depending on the application, these representations could be an efficientalternative to full.
RQ 1/2. Comparison of social media models over internal document struc-ture models Turning into models derived from social media, Table 3.4 (middle)shows that digg-comm, the model from Digg using only five comments (see (3.7)),is performing the best among all social media models and significantly improvesover title on all metrics. delicious shows a high recall possibly due to the natureof tags which are more likely to capture the article’s theme rather than preciselyidentify it.

3. Linking Online News and Social Media 46
Table 3.4: System performance for retrieving blog posts relevant to a source articleusing credibility priors and models derived from internal document structure andsocial media, and their reduced counterparts using THRank. Significance testedagainst baseline (title).
runID Recall MRR Rprec MAP
Baseline(A) title 0.4033 0.3812 0.1488 0.1069
Model based on: Internal document structure(B) lead 0.2937H 0.3339O 0.1276O 0.0886H
(C) metadata 0.2206H 0.1449H 0.0466H 0.0275H
(D) ne 0.3739H 0.4967N 0.1787N 0.1290N
(E) quote-#1 0.2732H 0.5101N 0.1741N 0.1259M
(F) full 0.5919N 0.6058N 0.3190N 0.2509N
Model based on: Social media(G) delicious 0.4122 0.2883H 0.0875H 0.0677H
(H) digg 0.1108H 0.1250H 0.0433H 0.0315H
(I) digg-comm 0.5797N 0.5490N 0.2508N 0.2010N
(J) nytc 0.0072H 0.0020H 0.0008H 0.0006H
(K) nytc-comm 0.0949H 0.0644H 0.0160H 0.0125H
(L) twitter 0.1543H 0.1150H 0.0545H 0.0445H
(M) blogposts 0.1233H 0.1289H 0.0424H 0.0298H
Model based on: Reduced using THRank(N) full-graph 0.4524 0.5254N 0.2177N 0.1681N
(O) digg-graph 0.2799H 0.2552H 0.0890H 0.0681H
(P) nytc-graph 0.0691H 0.0300H 0.0122H 0.0077H
(Q) wikipedia-graph 0.0412H 0.0142H 0.0030H 0.0020H
(R) blogposts-graph 0.4170 0.4448M 0.1727M 0.1362N
In general, social media models using all available content from the underlyingsource perform worse than models based on article internal structure. This ispossibly due to noise found in user generated content, a claim supported by theimproved performance of digg-comm and nytc-comm (which exploit only a subset ofavailable content using comment selection methods) over their respective baselines(using all comments).
RQ 1/3. Reduced query models using THRank For most query models, THRankleads to improved performance. Among all reduced models, full-graph andblogposts-graph perform the best; both show significant improvements on precision-oriented metrics, without hurting recall. For full-graph, when compared to full,
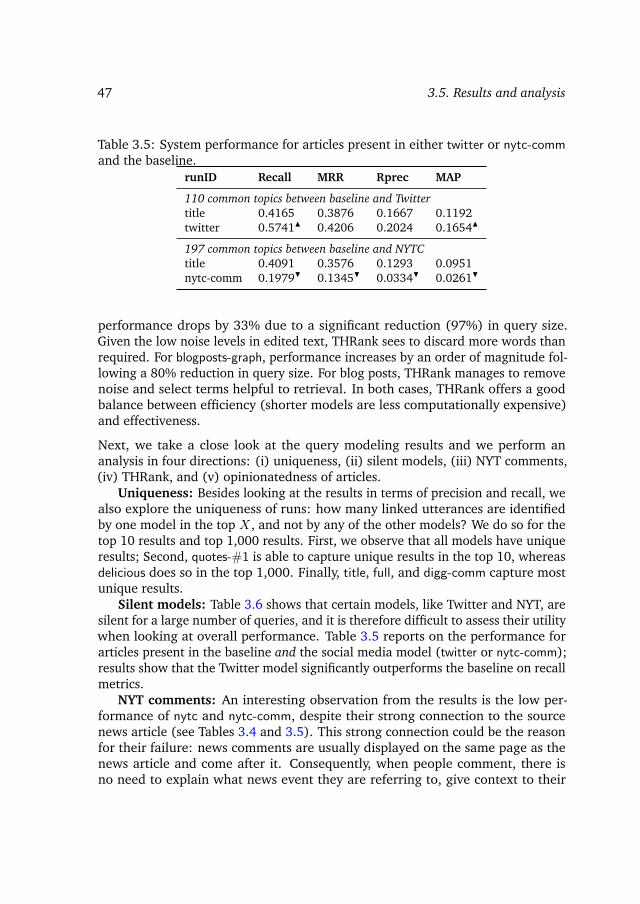
47 3.5. Results and analysis
Table 3.5: System performance for articles present in either twitter or nytc-command the baseline.
runID Recall MRR Rprec MAP
110 common topics between baseline and Twittertitle 0.4165 0.3876 0.1667 0.1192twitter 0.5741N 0.4206 0.2024 0.1654N
197 common topics between baseline and NYTCtitle 0.4091 0.3576 0.1293 0.0951nytc-comm 0.1979H 0.1345H 0.0334H 0.0261H
performance drops by 33% due to a significant reduction (97%) in query size.Given the low noise levels in edited text, THRank sees to discard more words thanrequired. For blogposts-graph, performance increases by an order of magnitude fol-lowing a 80% reduction in query size. For blog posts, THRank manages to removenoise and select terms helpful to retrieval. In both cases, THRank offers a goodbalance between efficiency (shorter models are less computationally expensive)and effectiveness.
Next, we take a close look at the query modeling results and we perform ananalysis in four directions: (i) uniqueness, (ii) silent models, (iii) NYT comments,(iv) THRank, and (v) opinionatedness of articles.
Uniqueness: Besides looking at the results in terms of precision and recall, wealso explore the uniqueness of runs: how many linked utterances are identifiedby one model in the top X, and not by any of the other models? We do so for thetop 10 results and top 1,000 results. First, we observe that all models have uniqueresults; Second, quotes-#1 is able to capture unique results in the top 10, whereasdelicious does so in the top 1,000. Finally, title, full, and digg-comm capture mostunique results.
Silent models: Table 3.6 shows that certain models, like Twitter and NYT, aresilent for a large number of queries, and it is therefore difficult to assess their utilitywhen looking at overall performance. Table 3.5 reports on the performance forarticles present in the baseline and the social media model (twitter or nytc-comm);results show that the Twitter model significantly outperforms the baseline on recallmetrics.
NYT comments: An interesting observation from the results is the low per-formance of nytc and nytc-comm, despite their strong connection to the sourcenews article (see Tables 3.4 and 3.5). This strong connection could be the reasonfor their failure: news comments are usually displayed on the same page as thenews article and come after it. Consequently, when people comment, there isno need to explain what news event they are referring to, give context to their

3. Linking Online News and Social Media 48
opinion, or write full names of entities. This leads to a lack of discriminative anddescriptive terms for that news article in the comments, potentially explaining thepoor performance of news comments-based query models.
THRank: Why does THRank help performance for blogposts but not for othersocial media? Comment threads are prone to topic drift as the discussion goes on,while explicitly linked blog posts are more likely to be focusing on one topic, thatof the article. Topical focus is likely to enable THRank in one case to reduce noiseand improve performance and in the other to capture the “general theme” of thediscussion which can be far away from what triggered the discussion initially.
The same can hold for models using comment selection methods which arefound to outperform their THRank counterparts. Highly recommended commentsare more likely to reflect what is also published in the blogosphere. On the otherhand, when THRank is ran on all available data from a source it proves unable tocapture accurately discriminative terms for the news article, although it returnsmore terms for digg and nytc (lower reduction ratio, see Table 3.6).
Opinionatedness: We measure how opinionatedness of news articles affectsthe performance of individual models. In order to do so, we split our ground truthof 411 articles into 131 opinionated and 280 non-opinionated articles dependingon whether the article title contains the term “OP’ED” (e.g., columns, editorials).
We perform a two-tailed independent t-test between the opinionated and non-opinionated scores for each model. For most models, performance is stable acrossthe two articles types with full and digg-comm performing the best. In terms ofrecall, six of the models drop significantly, when crossing from non-opinionated toopinionated articles. title is amongst them, possibly due to static titles assigned toopinionated articles, which usually consist of the column or editorial name withonly few additional terms. We also notice that digg-comm sees the highest recallon non-opinionated articles over all models, whereas this is full for opinionatedarticles. An interesting case is the metadata model for opinionated articles: Whencompared to non-opinionated articles, the recall shows a large significant increase,which is due to blog posts referring to the article author’s name (and agency).
3.5.2 Late fusion
We start by addressing the remaining research questions not answered yet. Afterthat we take a closer look at the results.
RQ 1/4. Query independent late fusion We experiment with 10 fusion meth-ods and two document score normalization methods for the combination of 11individual models; see Section 3.4.4. Table 3.7 shows that the best perform-ing method in terms of MAP is WcombMNZ, which yields statistically significant

49 3.5. Results and analysis
Table 3.6: Number of queries per news article model, and their average length forquery terms, phrases, and both.
runID # queriesAverage query length
Terms Phrases Total
Query based on: Internal document structuretitle 411 8 0 8lead 411 23 0 23metadata 411 8 1 9ne 410 0 18 18quote-#1 398 0 10 10full 411 912 0 912
Query based on: Social mediadelicious 411 47 0 47digg 411 1,476 0 1,476digg-comm 411 225 0 225nyt 197 15,048 0 15,048nytc-comm 197 288 0 288twitter 111 48 0 48wikipedia 409 6,912 1,316 8,229blogposts 408 617 41 658
Query based on: Reduced using THRankfull-graph 411 27 2 29digg-graph 395 37 1 38nytc-graph 197 131 1 132wikipedia-graph 409 117 10 127blogposts-graph 408 23 1 25
improvements over the full model. WcombSUM, WcombWW, combSUM and comb-MNZ perform similar to, but slightly less than WcombMNZ, and RR-W outperformsRR.
We investigated the effect on MAP for a range of scale factors of the bestindividual run (full), when using z-scoring and linear normalization of documentscores. Fig. 3.3 illustrates that, in our setting, WcombMNZ with z-scoring and thescale factor set to 2 achieves the best MAP among all fusion methods.
RQ 1/5. Query dependent late fusion For this experiment we use the bestperforming late fusion method from RQ 1/4: WcombMNZ with z-scoring. Thegoal here is to learn weights that maximize average precision for a training groundtruth.
From Table 3.7 we can see that query dependent fusion significantly outper-

3. Linking Online News and Social Media 50
1 2 4 8 16Scale factor of best run (full)
0.260
0.265
0.270
0.275
0.280
MA
P
WcombMNZ linearWcombMNZ z-scoreWcombSUM linearWcombSUM z-score
Figure 3.3: MAP scores for combination of 11 individual runs when increasing theweight of the best individual run for WcombMNZ and WcombSUM methods andusing linear and z-score normalization of document scores.
forms full, but performs slightly worse than query independent fusion. One reasonfor this can be that the nature of relevant blog posts is evolving as we move fartherin time from the source article publication date.
Next, we proceed with an analysis of: (i) query dependent vs. independent fusion,(ii) an oracle run, and (iii) early fusion.
Query dependent vs. independent fusion: In theory, query dependent fusionwas expected to outperform other methods because of how weights were optimized.For each individual article, weights were estimated to maximize average precision.However, query independent fusion showed to perform better. The two methodsdiffer in the training set. For query independent fusion each article in the trainingset was on average associated with 14 blog posts. For query dependent fusion,weights were estimated for a ground truth of 5 blog posts per article. It is, therefore,interesting to explore the utility of a larger sample of explicitly linked blog posts astraining ground truth or to seek time dependent evolution patterns in the weightsassigned to each ranked list.
Oracle run: For each source article we take the ranked list produced from thebest performing model according to average precision, and combine these into afinal “oracle” run. Since we only use one model per source news article and nomixture of models, this run does not achieve the maximum performance possible.Still, the oracle run gives an indication of what scores are achievable. Comparingthe performance of the oracle run (Table 3.7) to WcombMNZ, the best performingquery independent fusion method, we observe that the latter arrives remarkablyclose to the oracle run.
Early fusion: Belkin et al. (1995) conducted thorough experiments comparing

51 3.6. Conclusions and outlook
Table 3.7: System performance for query independent fusion using 10 late fusiontechniques on the test set using z-score normalization and combining 11 individualruns for the best scale factor (2) of full. Query dependent fusion results arereported for the best fusion method. Significance tested against full. Results froman oracle run and early fusion are also reported.
Method Recall MRR Rprec MAP
full 0.5860 0.6196 0.3323 0.2522
Query independentcombMAX 0.7214N 0.5871O 0.2820H 0.2283H
combMIN 0.3308H 0.0766H 0.0195H 0.0131H
combSUM 0.7194N 0.6083 0.3202 0.2665M
combMNZ 0.7265N 0.6130 0.3252 0.2722N
combANZ 0.6821N 0.4547H 0.1574H 0.1256H
WcombSUM 0.7190N 0.6141 0.3317 0.2772N
WcombMNZ 0.7248N 0.6123 0.3422 0.2788N
WcombWW 0.7169N 0.6129 0.3315 0.2723N
RR 0.7328N 0.3990H 0.2095H 0.1664H
RR-W 0.7298N 0.3999H 0.2358H 0.1882H
Query dependentWcombMNZ 0.7011N 0.6148 0.3277 0.2646M
AnalysisOracle 0.6388 0.7727 0.3645 0.3141Early fusion 0.5331 0.5356 0.5220 0.1956
performance of early and late fusion techniques. They found that by combiningindividual models at query time performance increased compared to individualmodels. As a check we use the best performing model from each family of querymodels and combine them in a query. For the reduced models of Wikipedia andblog posts, each term is weighted according to its hub or authority score. Theperformance of this run (again, Table 3.7) is less than the best individual run (i.e.,full) and the query independent and dependent fusion methods (i.e., WcombMNZ).The lower performance is likely due to noise brought in after combing all modelsand suggests that term selection and term weighting methods on the combinedquery hold potential for improving retrieval effectiveness.
3.6 Conclusions and outlook
Most of the algorithmic contributions of this chapter lie in modeling news articlesfor the task of discovering implicitly linked social media utterances. We studied the

3. Linking Online News and Social Media 52
retrieval effectiveness of multiple query models that exploit content from individualelements in article’s internal structure and from explicitly linked utterances fromsix social media platforms. Our experiments provide the following answers to thequestions raised in p. 31 at the beginning of this chapter:
RQ 1/1. Does the internal document structure of a news article helpto retrieve implicitly linked social media utterances?
Experimental evidence shows that query models based on theentire article perform the best. However, query models fromsocial media bring in previously unseen utterances.
RQ 1/2. Do query models derived from social media models outper-form models based on internal document structure?
Query models trained on anchor text from explicitly linkedblog posts are interesting to explore, however our currentexperimental setup constrains us from further investigatingtheir utility.
RQ 1/3. Is implicit link discovery effectiveness affected by using re-duced query models that only use a limited selection ofwords?
To reduce the potential topical shift in our query models fromusing the entire contents of a news articles or the contentfrom explicitly linked sources, we introduced THRank, anunsupervised graph-based method for selecting the most dis-criminative terms from each query model. We found thatcontent selection helps to improve both effectiveness andefficiency.
RQ 1/4. How can ranked lists from individual strategies be fused toimprove performance?
We studied the effect of combining ranked lists from individ-ual query models and we experimented with ten late data

53 3.6. Conclusions and outlook
fusion methods and two document score normalization meth-ods. We found that fusion methods significantly improve re-trieval when document scores are normalized using z-scoring.
RQ 1/5. Does it help effectiveness when making the fusion strategydependent on the news article for which we are seekingimplicitly linked utterances?
Query independent weight optimization helped WcombMNZto outperform all individual and fusion runs and to achieveperformance remarkably close to an oracle run.
Summing up, as to RQ 1 as a whole—What is the retrieval effectiveness of modelingsource articles using different strategies for retrieving implicitly linked socialmedia utterances?—, we found that full articles combined with term selection andnormalized result fusion achieved very high levels of effectiveness.
In future work we plan stricter recency conditions to our retrieval model,study the potential of query dependent fusion in more detail, compare our modelsto typical IR approaches such as BM25F, and experiment with additional targetindexes such as Twitter. Results from this work and its future extensions lay theground work for discovering social media utterances related to a topic of a groupof news stories.
In this chapter we looked at a key aspect of content tracking, that of identifyinglinks between news articles and social media utterances that discuss them. Ourapproach to the problem was based on IR where a news article for which wewant to discover implicitly linked utterances is the query, and the utterances aredocuments to be retrieved from a target index. The IR method we used builds onthe query likelihood model which expects the query length to be a fraction of thelength of the documents in the index—which is the typical case for web queries.However, during our experiments we found that many blog posts are of similarlength to the source news articles, which violates the assumption in the querylikelihood model. In the next chapter, we revisit this assumption and suggest a fixfor retrieval scenarios where queries and documents are of similar length.


4Hypergeometric
Language Models
We have found that for tracking online news in social media, query models trainedon the entire contents of the source article are the most effective. These querymodels are of similar length to the social media utterances to be retrieved, and raisequestions on whether retrieval methods based on standard language modelingsuffice in this particular type of retrieval scenario. In this chapter we revisit theunderlying assumptions of the query likelihood model, i.e., the query length isa small fraction of the length of the documents to be retrieved, and suggest aremedy. To study this phenomenon we introduce the task of republished articlefinding, which is a type of content tracking task, and similar to the linking onlinenews to social media utterances task we studied previously, but with an additionalconstraint: the query and the documents to be retrieved are of similar length.
Republished article finding is the task of identifying instances of articles thathave been published in one source and republished more or less verbatim inanother source, which is often a social media source. We address this task as an adhoc retrieval problem, using the source article as a query. Our approach is basedon language modeling. We revisit the assumptions underlying the query likelihoodmodel, taking into account the fact that in our setup queries are as long as completenews articles. We argue that in this case, the underlying generative assumption ofsampling words from a document with replacement, i.e., the multinomial modelingof documents, produces less accurate query likelihood estimates.
To make up for this discrepancy, we consider distributions that emerge fromsampling without replacement: the central and non-central hypergeometric distri-butions. We present three retrieval models that build on top of these distributions:a log odds model, a linear interpolation model, and a Bayesian model wheredocument parameters are estimated using the Dirichlet compound multinomialdistribution.
55
4. Hypergeometric Language Models 56
We analyze the behavior of our new models using a corpus of news articlesand blog posts and find that for the task of republished article finding, wherewe deal with queries whose length approaches the length of the documents tobe retrieved, models based on distributions associated with sampling withoutreplacement outperform traditional models based on multinomial distributions.
4.1 Introduction
Republished article finding (RAF) is the task of identifying instances of articlesthat have been published in one source and republished more or less verbatimin another. A common instance of the phenomenon occurs with news articlesthat are being republished by bloggers. The RAF task is important for a numberof stakeholders. Publishers of news content are a prime example. For us, themotivation for considering the RAF task comes from the area of online reputationmanagement.
Over the past decade, the web has come to play an increasingly importantrole in the overall communication strategy of organizations (Dellarocas, 2003).It continues to offer new opportunities for organizations to directly interact withtheir customers or audience but it also contains possible threats as online conver-sations are impossible to control, while the potential impact on an organization’sreputation may be deep and long-lasting (Jansen et al., 2009). Online reputationmanagement (ORM) is aimed at monitoring the online reputation of an organi-zation, brand or person, by mining news, social media and search engine resultpages.
A key aspect of ORM is early detection of news topics that may end up harmingthe reputation of a given company, brand or person (“customer”), so that publicrelations activities can be launched to counter such trends. For this purposeit is important to track news stories that talk about an issue that affects thecustomer. In the blogosphere news stories may be republished for a numberof reasons. In our data sets (see Section 4.4 for details), we have come acrossinstances where bloggers want to share a news item with colleagues or students1
or where a blogger aims to kick off a discussion around the original news articlewithin his own online community,2 or where someone uses excerpts from a news
1E.g., a very large part of NYT article “A Boy the Bullies Love to Beat Up, Repeatedly” http:
//www.nytimes.com/2008/03/24/us/24land.html (accessed October 28, 2012) was republishedverbatim in The Kentucky School blog written by the school’s teachers, at http://theprincipal.blogspot.com/2008/03/boy-bullies-love-to-beat-up-repeatedly.html (accessed October 28,2012).
2E.g., all of “Financial Russian Roulette” by NYT journalist Paul Krugman was reposted by MarkThoma (Professor of Economics at University of Oregon) at http://economistsview.typepad.com/economistsview/2008/09/paul-krugman-fi.html (accessed October 28, 2012), with a one sentence
57 4.1. Introduction
article as references in a post where they discuss their own opinion.3 In additionto this “strict” interpretation of the RAF task (where most or all of a sourcearticle is being republished), ORM analysts are also interested in a somewhatlooser interpretation, where a key part of a source article (e.g., its lead) is beingrepublished in social media. Republished articles matter to ORM analysts as theymay become springboards where intense, possibly negative discussions flare up.
Having motivated the task of finding republished news articles in the blogo-sphere, we now turn to addressing the task. At first glance the strict version of thetask looks like a duplicate detection task. As we show in Section 4.5 below, on astrict interpretation of the RAF task, state-of-the-art duplicate detection methodsshow very reasonable performance in terms of MRR but in terms of MAP theyleave room for improvement. Under the more liberal interpretation of the RAFtask, the performance of state-of-the-art duplicate detection methods drops rapidly,on all metrics.
These initial findings motivate the use of standard information retrieval meth-ods for the RAF task, viewing the original news article as a query to be submittedagainst an index consisting of, say, blog posts (Ikeda et al., 2006; Tsagkias et al.,2011b). We follow the latter and focus on language modeling (LM) techniquesfor the RAF task. Language modeling in IR is usually based on distributions thatemerge from sampling with replacement, e.g., 2-Poisson, bernoulli, binomial, multi-nomial (Ponte and Croft, 1998). This allows a generative model of language toserve its purpose, namely, to produce infinite amounts of word sequences from afinite word population. However, in the particular case of the RAF task, we aredealing with long (document-size) queries. Here, sampling with replacement canlead to overgeneration of unseen terms; when paired with the long query length,this can have a cumulative and negative effect on performance. It is well-knownfrom general statistics that when the sample size grows close to the populationsize, i.e., when it is less than 10 times the population, models based on samplingwith replacement become less and less accurate (Moore, 1999). In our case, weconsider documents and queries as bags of word level unigrams; unigrams fromthe document form the population, and unigrams from the query form the sample.In the standard ad hoc retrieval setting, queries tend to be much shorter thandocuments, i.e., the sample is much smaller than the population. For example,title queries in the TREC Robust 2004 test set have 3 words, while documents areon average 500 words long (Voorhees and Buckland, 2004). However, in the caseof our RAF task, the assumption that documents (blog posts) are at least 10 timeslonger than queries (source news articles) is blatantly violated: in our data set,
commentary by Thoma, followed by about 110 follow-up comments.3See, e.g., “What parts of the agenda would you sacrifice to try to put bushies in jail for tor-
ture?” http://nomoremister.blogspot.com/2009/01/what-parts-of-agenda-would-you.html
(accessed October 28, 2012).
4. Hypergeometric Language Models 58
the former are 800 words long, the latter as many as 700 words: the two are ofcomparable length.
Our main contribution is an LM-based retrieval model for the RAF task thatbuilds on statistical distributions that emerge from sampling without replacement.Documents and queries are considered as urns that contain terms where multipleexamples of each term can coexist simultaneously. A document’s relevance to aninformation need, translates into the probability of sampling the query (the sourcenews article) from the document (blog posts). Then, documents are ranked bythis probability (Robertson, 1977). A suitable statistical distribution for this modelis the hypergeometric distribution which describes the number of successes in asequence of n draws from a finite population without replacement, just as thebinomial/multinomial distribution describes the number of successes for drawswith replacement.
Our approach to the RAF task consists of deriving a document model and aretrieval model. The document model is based on one of the two multivariatehypergeometric probability distributions we present here: (a) the central hypergeo-metric distribution and (b) the Wallenius’ hypergeometric (also called non-central)distribution. Both can take into account local term weights (such as raw term fre-quency (TF), while the model based on the Wallenius’ distribution also allows oneto incorporate global term weights (such as inverse document frequency (IDF)).
The main research questions that we seek to answer are:
RQ 4. What is the retrieval effectiveness of hypergeometric languagemodels compared to standard language models for the taskof republished article finding?
RQ 5. What are optimal smoothing methods for hypergeometriclanguage models? We propose, and compare three smoothingtechniques using: log-odds, Jelinek-Mercer smoothing, andBayesian inference.
The rest of the chapter is organized as follows. We present two hypergeometricdistributions in Section 4.2, three retrieval models based on those distributions inSection 4.3 We present our experimental setup in Section 4.4, report on resultsand analysis in Section 4.5, discuss alternatives in Section 4.6, and conclude inSection 4.7.
59 4.2. Hypergeometric distributions
4.2 Hypergeometric distributions
We present two hypergeometric distributions which we will use later for samplinga query from a document: (a) the central hypergeometric, and (b) non-centralhypergeometric (also known as Wallenius’ hypergeometric distribution). Thedifference between the two is in how we perform sampling and whether bias insampling is involved. Under the non-central distribution the probability of drawinga term depends on the outcome of the previous draw, while under the centralhypergeometric distribution, terms can be sampled independently (Amati, 2006a;Hiemstra and Kraaij, 1999; Miller et al., 1999).
Let us first describe the specific form of language model that we consider inthis chapter, which builds on the query unigram model model proposed in (Zhaiand Lafferty, 2001b). This model postulates that the relevance of a documentto a query can be measured by the probability that the query is generated by thedocument.
Consider a query q and a document collection C of N documents, C :={dl}l=1,...,N , with both queries and documents being represented as vectors ofindexed term counts:
q := (q1, . . . , qi, . . . , qV ) ∈ NV
dl := (dl,1, . . . , dl,i, . . . , dl,V ) ∈ NV
where qi is the number of times the term i appears in the query and V is the sizeof the vocabulary. Let us also define the length of a query (nq) and of a document(nl) as the sum of their components: nq :=
∑i qi and nl :=
∑i dl,i. Similarly,
the length of the collection C is defined as nc :=∑l nl, and the collection term
frequency as ci :=∑l dl,i.
4.2.1 The central hypergeometric distribution
The multivariate central hypergeometric distribution is derived from the observationthat since the sampling is done without replacement, the unordered sample isuniformly distributed over the combinations of size nq chosen from dl:
Pch(q;nq, nl,dl) =
∏Vi=1
(dl,iqi
)(nlnq
) , (4.1)
Terms are sampled independently or simultaneously, reflecting the term indepen-dence assumption.

4. Hypergeometric Language Models 60
4.2.2 The non-central hypergeometric distribution
What if terms had an additional property that affected their probability of beingsampled, for example, in how many documents they occur? In the urn model,we can think about objects that, except of their different color, can be heavier orbigger than others. This additional property can bias sampling and can be modeledas a weight for each object type. We call this weight ωi for the ith term in thevocabulary.
Under the multivariate non-central hypergeometric distribution the probabilityof sampling a term depends on the terms sampled so far and also on the remainingterms in the urn. Further, it supports biased sampling allowing for the incorporationof global term weights directly in the probability calculation. The following formuladescribes the distribution:
Pwh(q;nq, nl,dl) = (4.2)[V∏i
(dl,iqi
)]∫ 1
0
V∏i=1
(1− tωi/Ξ
)qidt
where Ξ = ω · (nl − nq) =∑Vi=1 ωi(dl,i − qi) regulates the bias of qi after every
draw, and the integral stands for the recursive sampling from time t = 0 until allterms are sampled at t = 1.
The mathematical derivation, properties and efficient computation methods ofthe Wallenius’ distribution are beyond the scope of this chapter. Wallenius (1963)provides in-depth information on the characteristics of the non-central distributionand Fog (2008) presents efficient methods for sampling from it. The centraland non-central hypergeometric distributions are connected in that when ωi = 1for all i, then bias is cancelled and the non-central hypergeometric distributiondegenerates into the central hypergeometric distribution.
4.2.3 An example
Now that we have presented the hypergeometric distributions, let us look at anillustrative example on how sampling with and without replacement can lead todifferent results when the sample size is close to the population size. We startwith a query (sample) and we need to calculate the probability of a document(population) to generate the query. In the case of sampling with replacement, theprobability of sampling a query term t from a document D follows the binomialdistribution:4
binomial(k;n, p) =
(n
k
)pk(1− p)n−k (4.3)
4We use the binomial distribution instead of the multinomial for simplifying the calculations in ourexample.

61 4.3. Retrieval models
with parameters n, p where n is the number of trials (query size), p = #tD|D| is the
probability of a success, namely, the term frequency of t in D, and k is the numberof successes, i.e., the term frequency of t in Q. In the case of sampling withoutreplacement the probability of sampling a query term t from a document D followsthe hypergeometric distribution:
hypergeometric(k;m,n,N) =
(mk
)(N−mn−k
)(Nn
) (4.4)
with parameters m,n,N where m is the term frequency of t in D, n the number ofdraws (query size), N the population size (document size), and k the number ofsuccesses, namely the term frequency of t in Q.
For our example, we let query Q have 4 terms, each occurring once, and alsowe define two documents A and B of length 1,000, and 15, respectively whichshare at least one common term with Q. Let also that query term t occurs 1 timein A and B. The probability of sampling t from A or B when we sample withreplacement is given by (4.3) with k = 1, n = 4, pA = 1/1, 000, and pB = 1/15.The calculations result in values of 0.003988 for document A and 0.216810 for B.Similarly, when sampling without replacement, we use (4.4) and set k = 1, m = 1,n = 4, NA = 1, 000, and NB = 15. This results in values of 0.004000 for A andin 0.266666 for B. These numbers show that the difference in probability fromthe two models for document A is negligible (1.2 · 10−5) but when the populationis close to the sample size (document B), the difference grows three orders ofmagnitude reaching 0.049. The example illustrates that when queries are ofcomparable size to the retrieved documents, sampling with replacement can leadto poor likelihood estimates with a cumulative negative effect in the multivariatecase, i.e., we calculate probabilities for all query terms.
What is the upshot? It is known that the multinomial approximates the centralhypergeometric as the population size remains many times larger than the samplesize, i.e., when the document is much longer than the query. In the RAF task,this assumption is violated as queries and documents are expected of roughly thesame size. This motivates us to derive retrieval models based on hypergeometricmodeling of documents instead of multinomial models.
4.3 Retrieval models
Before deriving retrieval models based on hypergeometric modeling of documents,we revisit (4.1) and (4.2). We identify three constraints emerging from theseequations, which relate to smoothing and play a role in the design of a retrievalmodel:
4. Hypergeometric Language Models 62
1. only query terms that occur in the document contribute to the probability,
2. the query should be shorter than the document,
3. the frequency of a query term should be lower than or equal to the term’sfrequency in the document.
The first constraint is obvious. The other two stem from the fact that is impossibleto draw more terms than currently exist in the urn. The second constraint isimposed from the denominator
(nlnq
)which becomes zero when nq > nl and results
in infinite probability. The third constraint roots in(dl,iqi
)which becomes zero if
qi > dl,i and results in zero probability. In general, P (q) is positive only if
max(0, nq + dl,i − nl) ≤ qi ≤ min(dl,i, nq).
To address the three constraints listed above, we consider three types of smoothing.The performance of retrieval models that build on top of hypergeometric distri-butions is sensitive to the employed smoothing strategy, just like other retrievalmodels are that build on the multinomial or other distributions. In the followingthree subsections we present three approaches to smoothing. The first approachis somewhat related to relevance feedback and an estimated document modelis trained on text from both the query and the document; this approach worksfor both the central and non-central hypergeometric distribution. The secondapproach builds on linear interpolation of the maximum likelihood model withthe collection model, using the Jelinek-Mercer method; this approach works forboth the central and non-central hypergeometric distribution. The third approachis more elaborate and is based on Bayesian inference; this approach works onlyfor the central hypergeometric distribution, as we explain below.
4.3.1 A log-odds retrieval model
Our first approach to overcome the limitations on qi, nq given a document, is basicin terms that no sophisticated smoothing methods are involved for estimating theparameters of the document model. In a sense, it is remotely related to pseudo-relevance feedback but instead of re-estimating the query model from pseudo-relevant documents, the documents models are complemented with informationfrom the query. One way to visualize the process is to think of a bag with queryterms from which we sample the query. Obviously, the probability of samplingthe query from the bag is 1. Now, for a document in the collection we add thedocument terms in the bag and sample the query again. Documents with highvocabulary overlap with the query will result in high probability while documentswith only few common terms will result in low probability.

63 4.3. Retrieval models
In particular, instead of sampling the query directly from the document, wederive a hypothetical document d′ which is a mixture of the query q and thedocument d:
d′ := (d′l,1, . . . , d′l,i, . . . , d
′l,V ) ∈ NV , d′l,i = rqqi + rddl,i, (4.5)
where rq, rd are parameters for regulating the mixture. The length of this hypo-thetical document is: n′l =
∑i rqqi + rddl,i = rqnq + rdnl.
Now, it holds that P·(q;nq, n′l,d′l) ∈ (0, 1] (we use P· to denote the use of
either Pch, or Pwh) because at least some of the terms are always sampled from d′l(i.e., those originating from the query), but never all of them because nq < n′l bydefinition of d′l. The extreme case of P·(q;nq, n
′l,d′l) = 1 is reached when there is
no vocabulary overlap between dl and q and rq = 1, however, this case is hardlyencountered in practice because documents without common terms are excludedfrom ranking.
Document length and the vocabulary intersection between the query and thedocument both play an important role in the probability outcome, as in otherretrieval models. To this end, we normalize the probability given the observationthat the probability should maximize when the document is an exact duplicate ofthe query, i.e., q = dl:
Pmax· = P·(q;nq, (rq + rd)nq, (rq + rd)q). (4.6)
Given this observation, documents able to generate the query with probabilityclose to the maximum should be favored. We express this in the following rankingfunction:
Score(Q,D) =P·(q;nq, n
′l,d′l)
Pmax·
∝ P·(q;nq, n′l,d′l)). (4.7)
The denominator can be ignored for ranking since it is constant for all documents.The expression of Pmax· holds when we look at finding near or exact duplicatesof a query. Under this scenario, query terms are expected to occur in a candidate“duplicate” document in relatively similar frequencies. However, this is hardly truein other settings where retrieved documents can deviate considerably from thequery in both vocabulary and term frequencies.
In this respect, the assumption we made for deriving (4.6), can be too strict.The assumption can be relaxed if we only take into account terms common to thequery and to the document and compute the maximum probability based on those.Similarly as before, first we derive a hypothetical document:
d′′l := {d′′l,i : d′′l,i = (rq + rd)qi for i ∈ V, qi > 0, dl,i > 0, },

4. Hypergeometric Language Models 64
with length n′′l =∑i d′′l,i. Further, we also reduce the original query to a hypothet-
ical query q′′ that consists of terms common to q and dl:
q′′ := {q′′i : qi for i ∈ V, qi > 0, dl,i > 0, }.
This results in the following definition of maximum probability, previously definedin (4.6):
P ′max· = P·(q;nq, n′′l ,d
′′l ), (4.8)
and the ranking function in (4.7) becomes:
Score(Q,D) =P·(q;nq, n
′l,d′l)
P ′max·. (4.9)
In this representation, P ′max· cannot be ignored because it is dependent on thevocabulary overlap of the query and the document.
4.3.2 A linear interpolation retrieval model
A second approach to overcome the limitation of query terms not occurring in thedocument is to interpolate the query probability from the central and non-centralhypergeometric with the collection model, using a parameter λ for regulating themixture. This is a widely used approach known as Jelinek-Mercer smoothing, alsofound in other retrieval systems (Chen and Goodman, 1996; Zhai and Lafferty,2004). When applied to unigram language modeling, the probability of a documentto generate a query term is linearly interpolated with the term’s a priori probability:
Pjm(q|dl) =
|q|∏i=1
λP (i|dl) + (1− λ)P (i|C),
where P (·) = qidl,i
is the maximum likelihood estimator for sampling a term fromthe document or the collection, and λ controls the influence of each model. In thecase of the hypergeometric distributions, Jelinek-Mercer smoothing can be appliedeither before or after computing the probability of sampling a query term from adocument. When it is applied before, the term frequencies in the document aresmoothed, while when it is applied after, the end probability is smoothed. We lookat both ways of smoothing, and motivate our choice for the latter.
In the first case, term counts within the document is smoothed based on theprobability that they occur in the collection. However attractive this is, in theory itturns unfeasible because it creates a cyclic dependency: translating the a prioriprobability to raw counts depends on the document length, which in turn dependson the document term counts. In practice, one could simultaneously map the a

65 4.3. Retrieval models
priori probabilities of all terms to raw counts using the original document lengthand then re-estimate the document length over the updated term counts. Althougha fair approach, the problem of translating fractions to integers remains unsolvedbecause of the relatively small length of the document compared to the collection.As an example, think of two terms with a priori probabilities of 10−3 and 10−5,and a document of length 500, both terms translate to a raw count of less than1. To overcome this problem, one could take a step further, and add the termfrequency in the collection to the term frequency in the document. This wouldovercome the problem of translating probabilities to frequencies, however, becausendl << nc, the query is, practically, always sampled from the collection insteadof the document. With the above in mind, we proceed on developing a retrievalmodel that interpolates the probability of sampling a query term from a document,and from the collection.
Since the term frequency in the documents are not smoothed, we first needto consider satisfying the two constraints on qi < dl,i, and nq < nl. In the logodds retrieval model we suggested adding the query to the document, however,this approach may lead to unexpected results for documents that share only oneterm with the query because P ′max = 1, i.e., documents with only one commonterm with the query will rank to the top. Here, we take a different approach and“inflate” the document model by multiplying the document term frequencies by thelength ratio of the query to the document:
d′′′l,i =
(nqnl
+ 1
)dl,i,
n′′′l =∑i
d′′′l,i,
where d′′′l,i is the smoothed term frequency in the document, and n′′′l is the smootheddocument length.
For linearly interpolating term probabilities in the hypergeometric distributionswe need to move from the multivariate central (4.10) and non-central distribu-tions (4.11) to their univariate versions, respectively:
Puch(qi;nq, d′′′l,i, nl) =
(nqqi
)(nl−nqd′′′l,i−qi
)(n′′′lnq
) , (4.10)
Puwh(qi;nq, d′′′l,i, nl) =
(d′′′l,iqi
)(n′′′l − d′′′l,inq − qi
)(4.11)
·∫ 1
0
(1− tωi/Ξ)qi(1− t1/Ξ)nq−qidt,
where uch stands for univariate central hypergeometric, wch stands for univariatewallenius hypergeometric, Ξ = ωi(d
′′′l,i − qi) + (n′′′l − d′′′l,i − nq + qi), and ωi is the

4. Hypergeometric Language Models 66
sampling bias for ith term in the vocabulary. Having expressed Puch, Puwh, we candefine a linear interpolation retrieval model as follows:
Score(Q,D) =
|q|∏i
λP·(qi;nq, d′′′l,i, n
′′′l ) + (1− λ)P·(qi;nq, ci, nc), (4.12)
where P· is one of (4.10), (4.11), and when the query term does not appear in thedocument (d′′′l,i = 0) then P·(qi;nq, d′′′l,i, n
′′′l ) = 0.
4.3.3 A Bayesian retrieval model
A third approach to overcome the limitations on qi, nq noted at the start of thissection, is to use Bayesian inference. Recall that when documents are modeled asa multinomial distribution of terms, and we apply Bayes’ rule, the conjugate priordistribution to the multinomial is the Dirichlet distribution (Zaragoza et al., 2003;Zhai and Lafferty, 2001b). Setting the parameters of the Dirichlet distributionaccordingly, leads to the well-known Dirichlet smoothing method. Here, wefollow the same line of reasoning for the multivariate central hypergeometric, andarrive at the Dirichlet compound multinomial distribution (DCM, also known asthe multivariate Polya distribution) for estimating the parameters of a documentmodel. To the best of our knowledge no closed form is known for the conjugateprior of the non-central hypergeometric distribution; hence, we do not offer aBayesian non-central hypergeometric model.
Now, let us consider that terms t = (t1, . . . , ti, . . . , tV ) arise from a multivariatecentral hypergeometric process where parameter nN , the vocabulary length, isknown (nN =
∑Nl=1
∑Vi=1 dl,i and nN > 0) and θl = (θl,1, . . . , θl,V ), the vector of
term frequencies in the vocabulary that make up the population, are unknown(0 ≤ θl,i ≤ nl and
∑i θi = nl).
Under this model, the probability of generating a particular query q with countsq is given by:
Pch(q|θl) =
∏Vi=1
(θl,iqi
)(nlnq
) , (4.13)
In the case where documents consist of all vocabulary terms, we can obtainthe point estimate θl,i = dl,i. However, such documents rarely exist. Ratherthan find a point estimate for the parameter vector θl, a distribution over θl isobtained by combining a prior distribution over the model parameters P (θl) withthe observation likelihood P (dl|θl) using Bayes’ rule:
P (θl|dl) =P (θl)P (dl|θl)
P (dl), (4.14)

67 4.3. Retrieval models
where the observation likelihood is given by:
Pch(dl|θl) =
∏Vi=1
(θl,idl,i
)(nNnl
) . (4.15)
The conjugate prior of a multivariate hypergeometric process is the DCM withhyperparameters H, an integer greater than zero, and α = (α1, . . . , αi, . . . , αV )
where αi > 0 and∑Vi=1 αi = 1:
P (θ) =nl!∏Vi=1 θi!
Γ(∑Vi=1 αi)∏V
i=1 Γ(αi)
∏Vi=1 Γ(αi + θi)
Γ(∑Vi=1(αi + θi))
. (4.16)
where θi > 0 and∑Vi θi = nl. The resulting posterior distribution is also DCM:
P (θ|dl) =(nV − nl)!∏Vi=1(θi − dl,i)!
(4.17)
·Γ(nl +
∑Vi=1 αi)∏V
i=1 Γ(dl,i + αi)
∏Vi=1 Γ(αi + θi)
Γ(∑Vi=1(αi + nV ))
,
with θi > 0 and∑Vi=1 θi = H.
The query likelihood then becomes:
P (q|dl) =
∫θ
P (q|θl)P (θl|dl)dθl (4.18)
A standard approximation to the Bayesian predictive distribution P (q|dl) is theuse of the maximum posterior (MP) distribution. The approximation consists ofreplacing the integral in (4.18) with its maximum value (Zaragoza et al., 2003;Zhai and Lafferty, 2001b):
Pch(q|θMPl ) =
∏Vi=1
(θMPl,iqi
)(nMPlnq
) . (4.19)
Although, there is no closed form solution for the maximum likelihood estimateθi of DCM (Xu and Akella, 2008), we can use the expected value of θi (Johnsonet al., 1997, p.80):
θMPl,i = (nN − nl)
αi + dl,i∑Vi=1(αi + dl,i)
= (nN − nl)αi + dl,i
nl +∑Vi=1(αi)
,
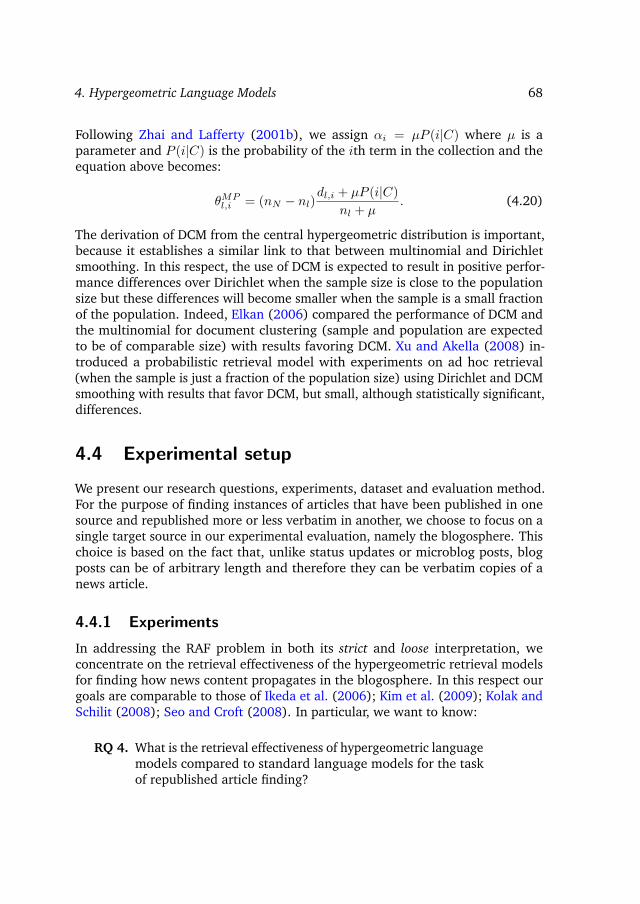
4. Hypergeometric Language Models 68
Following Zhai and Lafferty (2001b), we assign αi = µP (i|C) where µ is aparameter and P (i|C) is the probability of the ith term in the collection and theequation above becomes:
θMPl,i = (nN − nl)
dl,i + µP (i|C)
nl + µ. (4.20)
The derivation of DCM from the central hypergeometric distribution is important,because it establishes a similar link to that between multinomial and Dirichletsmoothing. In this respect, the use of DCM is expected to result in positive perfor-mance differences over Dirichlet when the sample size is close to the populationsize but these differences will become smaller when the sample is a small fractionof the population. Indeed, Elkan (2006) compared the performance of DCM andthe multinomial for document clustering (sample and population are expectedto be of comparable size) with results favoring DCM. Xu and Akella (2008) in-troduced a probabilistic retrieval model with experiments on ad hoc retrieval(when the sample is just a fraction of the population size) using Dirichlet and DCMsmoothing with results that favor DCM, but small, although statistically significant,differences.
4.4 Experimental setup
We present our research questions, experiments, dataset and evaluation method.For the purpose of finding instances of articles that have been published in onesource and republished more or less verbatim in another, we choose to focus on asingle target source in our experimental evaluation, namely the blogosphere. Thischoice is based on the fact that, unlike status updates or microblog posts, blogposts can be of arbitrary length and therefore they can be verbatim copies of anews article.
4.4.1 Experiments
In addressing the RAF problem in both its strict and loose interpretation, weconcentrate on the retrieval effectiveness of the hypergeometric retrieval modelsfor finding how news content propagates in the blogosphere. In this respect ourgoals are comparable to those of Ikeda et al. (2006); Kim et al. (2009); Kolak andSchilit (2008); Seo and Croft (2008). In particular, we want to know:
RQ 4. What is the retrieval effectiveness of hypergeometric languagemodels compared to standard language models for the taskof republished article finding?

69 4.4. Experimental setup
Table 4.1: Retrieval models we consider in Chapter 4 for the RAF task.
Model Gloss
State-of-the-art modelssimhash Hamming distance between two simhashescosine Cosine similarity using IDF term weightingkl Kullback-Leibler divergencelm Unigram language model with Dirichlet smoothingindri Language modeling with inference networks and Dirich-
let smoothingbm25f Okapi BM25Ftf·idf TFIDF retrieval model
Hypergeometric modelshgm-central Log odds retrieval model with multivariate central hy-
pergeometric distribution (4.9)hgm-central-jm Linear interpolation retrieval model with univariate
central hypergeometric distribution (4.12)hgm-central-bayes Multivariate central hypergeometric distribution with
Dirichlet compound Multinomial smoothing (4.19)hgm-noncentral Log odds retrieval model with multivariate non-central
hypergeometric distribution (4.9)hgm-noncentral-jm Linear interpolation retrieval model with univariate
non-central hypergeometric distribution (4.12)
RQ 5. What are optimal smoothing methods for hypergeometriclanguage models? We propose, and compare three smoothingtechniques using: log-odds, Jelinek-Mercer smoothing, andBayesian inference.
To answer these research questions, we compare our methods to seven state-of-the-art retrieval methods listed in Table 4.1. Among them, simhash is one ofthe best-performing near-duplicate detection methods (Henzinger, 2006; Mankuet al., 2007); kl has proven successful in plagiarism detection (Barron-Cedenoet al., 2009); cosine, probabilistic, and language modeling based methods haveperformed well in the related topic detection and tracking (Allan, 2002) task.
In our experiments we use the Indri framework for indexing. Each experimentalcondition returns maximum 1,000 results. For parametric retrieval models wefind parameter values that optimize their performance for our dataset. We setµ = 1120 for kl, lm, indri, hgm-central-bayes, rq = 1, rd = 1 for hgm-central,and hgm-noncentral, and k1 = 2.0, b = 0.75 for bm25f. For hgm-noncentral we

4. Hypergeometric Language Models 70
set ωi, to the term’s inverse document frequency (IDF). For hgm-central-jm andhgm-noncentral-jm we set λ = 0.1.
4.4.2 Dataset
The data set that we use as our target social media collection is the Blogs08collection provided by TREC; the collection consists of a crawl of feeds, permalinks,and homepages of 1.3M blogs during early 2008–early 2009. This crawl results ina total of 28.4M blogs posts (or permalinks). We only used feed data, the textualcontent of blog posts distributed by feeds and ignored the permalinks. Only usingfeed data is common practice and requires almost no preprocessing of the data.Extracting posts from the feed data gave us a coverage of 97.7% (27.8M postsextracted). As a second preprocessing step we perform language identification andremove all non-English blog posts from the corpus, leaving us with 16.9M blogsposts. Our index is constructed based on the full content of blog posts.
Our news article dataset is based on the headline collection from the top storiestask in TREC 2009. This is a collection of 102,812 news headlines from the NewYork Times that includes the article title, byline, publication date, and URL. For thepurposes of our experiments we extended the dataset by crawling the full body ofeach of the articles.
4.4.3 Ground truth and metrics
As there is no standard test collection for the republished article finding task, wecreated our own.5 The ideal ground truth for our task would consist of tuples (n, s)consisting of a news article and a social media utterance, where s is a republicationof n.
As a proxy, we follow Geva and Trotman (2010); Mihalcea and Csomai (2007);Milne and Witten (2008) and use blog posts that are explicitly linked to a givennews source. Our ground truth is assembled in two phases. First, for each newsarticle we find blog posts that include the article’s URL. Second, for each discoveredblog post we look for other blog posts that include its URL. The process continuesrecursively until no more blog posts are discovered. For our experiments we sampleheadlines with more than ten explicit links and where social media possibly playsa role. For each news article, we take only explicitly linked blog posts within ±1day from the article’s publication date to reduce the search space.
In the second phase, we removed the explicit links and for each (backlinked)blog post we manually examined whether it is a republication of the news article.In the strict interpretation of the RAF task, the blog post needs to be a copy all of
5The ground truth may be retrieved from http://ilps.science.uva.nl/resource/
hypergeometric-lm – accessed October 28, 2012
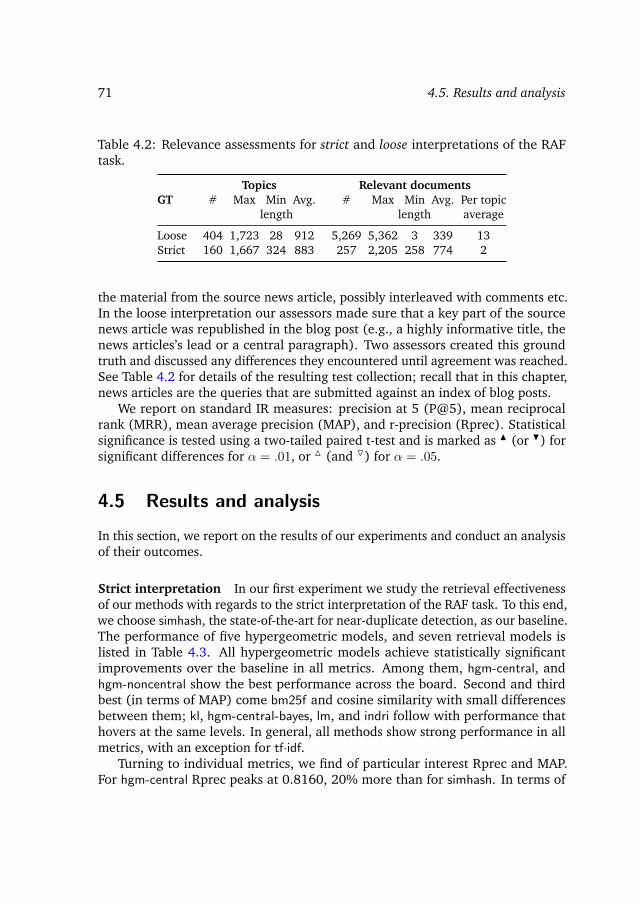
71 4.5. Results and analysis
Table 4.2: Relevance assessments for strict and loose interpretations of the RAFtask.
GTTopics Relevant documents
# Max Min Avg. # Max Min Avg. Per topiclength length average
Loose 404 1,723 28 912 5,269 5,362 3 339 13Strict 160 1,667 324 883 257 2,205 258 774 2
the material from the source news article, possibly interleaved with comments etc.In the loose interpretation our assessors made sure that a key part of the sourcenews article was republished in the blog post (e.g., a highly informative title, thenews articles’s lead or a central paragraph). Two assessors created this groundtruth and discussed any differences they encountered until agreement was reached.See Table 4.2 for details of the resulting test collection; recall that in this chapter,news articles are the queries that are submitted against an index of blog posts.
We report on standard IR measures: precision at 5 (P@5), mean reciprocalrank (MRR), mean average precision (MAP), and r-precision (Rprec). Statisticalsignificance is tested using a two-tailed paired t-test and is marked as N (or H) forsignificant differences for α = .01, or M (and O) for α = .05.
4.5 Results and analysis
In this section, we report on the results of our experiments and conduct an analysisof their outcomes.
Strict interpretation In our first experiment we study the retrieval effectivenessof our methods with regards to the strict interpretation of the RAF task. To this end,we choose simhash, the state-of-the-art for near-duplicate detection, as our baseline.The performance of five hypergeometric models, and seven retrieval models islisted in Table 4.3. All hypergeometric models achieve statistically significantimprovements over the baseline in all metrics. Among them, hgm-central, andhgm-noncentral show the best performance across the board. Second and thirdbest (in terms of MAP) come bm25f and cosine similarity with small differencesbetween them; kl, hgm-central-bayes, lm, and indri follow with performance thathovers at the same levels. In general, all methods show strong performance in allmetrics, with an exception for tf·idf.
Turning to individual metrics, we find of particular interest Rprec and MAP.For hgm-central Rprec peaks at 0.8160, 20% more than for simhash. In terms of
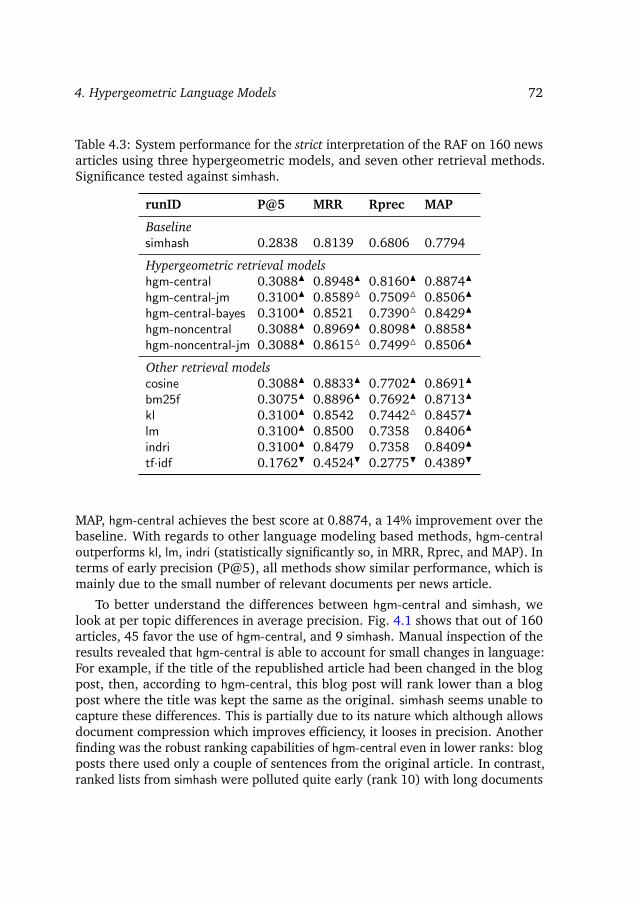
4. Hypergeometric Language Models 72
Table 4.3: System performance for the strict interpretation of the RAF on 160 newsarticles using three hypergeometric models, and seven other retrieval methods.Significance tested against simhash.
runID P@5 MRR Rprec MAP
Baselinesimhash 0.2838 0.8139 0.6806 0.7794
Hypergeometric retrieval modelshgm-central 0.3088N 0.8948N 0.8160N 0.8874N
hgm-central-jm 0.3100N 0.8589M 0.7509M 0.8506N
hgm-central-bayes 0.3100N 0.8521 0.7390M 0.8429N
hgm-noncentral 0.3088N 0.8969N 0.8098N 0.8858N
hgm-noncentral-jm 0.3088N 0.8615M 0.7499M 0.8506N
Other retrieval modelscosine 0.3088N 0.8833N 0.7702N 0.8691N
bm25f 0.3075N 0.8896N 0.7692N 0.8713N
kl 0.3100N 0.8542 0.7442M 0.8457N
lm 0.3100N 0.8500 0.7358 0.8406N
indri 0.3100N 0.8479 0.7358 0.8409N
tf·idf 0.1762H 0.4524H 0.2775H 0.4389H
MAP, hgm-central achieves the best score at 0.8874, a 14% improvement over thebaseline. With regards to other language modeling based methods, hgm-centraloutperforms kl, lm, indri (statistically significantly so, in MRR, Rprec, and MAP). Interms of early precision (P@5), all methods show similar performance, which ismainly due to the small number of relevant documents per news article.
To better understand the differences between hgm-central and simhash, welook at per topic differences in average precision. Fig. 4.1 shows that out of 160articles, 45 favor the use of hgm-central, and 9 simhash. Manual inspection of theresults revealed that hgm-central is able to account for small changes in language:For example, if the title of the republished article had been changed in the blogpost, then, according to hgm-central, this blog post will rank lower than a blogpost where the title was kept the same as the original. simhash seems unable tocapture these differences. This is partially due to its nature which although allowsdocument compression which improves efficiency, it looses in precision. Anotherfinding was the robust ranking capabilities of hgm-central even in lower ranks: blogposts there used only a couple of sentences from the original article. In contrast,ranked lists from simhash were polluted quite early (rank 10) with long documents
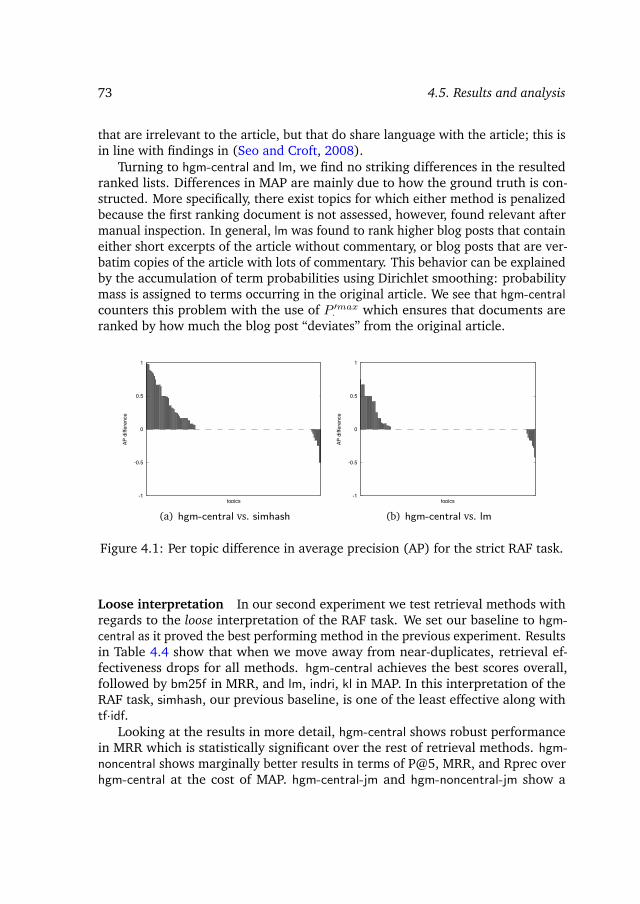
73 4.5. Results and analysis
that are irrelevant to the article, but that do share language with the article; this isin line with findings in (Seo and Croft, 2008).
Turning to hgm-central and lm, we find no striking differences in the resultedranked lists. Differences in MAP are mainly due to how the ground truth is con-structed. More specifically, there exist topics for which either method is penalizedbecause the first ranking document is not assessed, however, found relevant aftermanual inspection. In general, lm was found to rank higher blog posts that containeither short excerpts of the article without commentary, or blog posts that are ver-batim copies of the article with lots of commentary. This behavior can be explainedby the accumulation of term probabilities using Dirichlet smoothing: probabilitymass is assigned to terms occurring in the original article. We see that hgm-centralcounters this problem with the use of P ′max· which ensures that documents areranked by how much the blog post “deviates” from the original article.
-1
-0.5
0
0.5
1
AP d
iffer
ence
topics
(a) hgm-central vs. simhash
-1
-0.5
0
0.5
1
AP d
iffer
ence
topics
(b) hgm-central vs. lm
Figure 4.1: Per topic difference in average precision (AP) for the strict RAF task.
Loose interpretation In our second experiment we test retrieval methods withregards to the loose interpretation of the RAF task. We set our baseline to hgm-central as it proved the best performing method in the previous experiment. Resultsin Table 4.4 show that when we move away from near-duplicates, retrieval ef-fectiveness drops for all methods. hgm-central achieves the best scores overall,followed by bm25f in MRR, and lm, indri, kl in MAP. In this interpretation of theRAF task, simhash, our previous baseline, is one of the least effective along withtf·idf.
Looking at the results in more detail, hgm-central shows robust performancein MRR which is statistically significant over the rest of retrieval methods. hgm-noncentral shows marginally better results in terms of P@5, MRR, and Rprec overhgm-central at the cost of MAP. hgm-central-jm and hgm-noncentral-jm show a
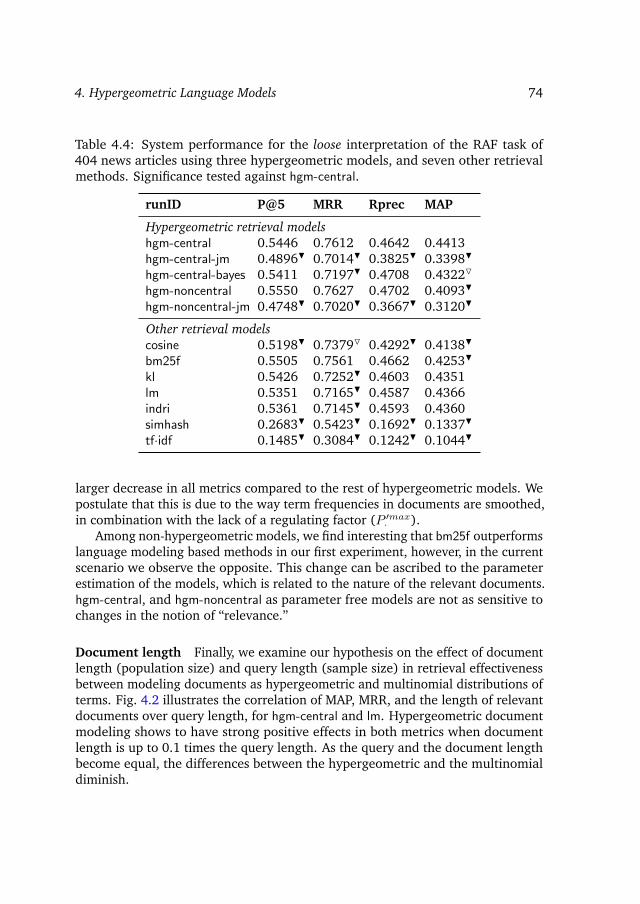
4. Hypergeometric Language Models 74
Table 4.4: System performance for the loose interpretation of the RAF task of404 news articles using three hypergeometric models, and seven other retrievalmethods. Significance tested against hgm-central.
runID P@5 MRR Rprec MAP
Hypergeometric retrieval modelshgm-central 0.5446 0.7612 0.4642 0.4413hgm-central-jm 0.4896H 0.7014H 0.3825H 0.3398H
hgm-central-bayes 0.5411 0.7197H 0.4708 0.4322O
hgm-noncentral 0.5550 0.7627 0.4702 0.4093H
hgm-noncentral-jm 0.4748H 0.7020H 0.3667H 0.3120H
Other retrieval modelscosine 0.5198H 0.7379O 0.4292H 0.4138H
bm25f 0.5505 0.7561 0.4662 0.4253H
kl 0.5426 0.7252H 0.4603 0.4351lm 0.5351 0.7165H 0.4587 0.4366indri 0.5361 0.7145H 0.4593 0.4360simhash 0.2683H 0.5423H 0.1692H 0.1337H
tf·idf 0.1485H 0.3084H 0.1242H 0.1044H
larger decrease in all metrics compared to the rest of hypergeometric models. Wepostulate that this is due to the way term frequencies in documents are smoothed,in combination with the lack of a regulating factor (P ′max· ).
Among non-hypergeometric models, we find interesting that bm25f outperformslanguage modeling based methods in our first experiment, however, in the currentscenario we observe the opposite. This change can be ascribed to the parameterestimation of the models, which is related to the nature of the relevant documents.hgm-central, and hgm-noncentral as parameter free models are not as sensitive tochanges in the notion of “relevance.”
Document length Finally, we examine our hypothesis on the effect of documentlength (population size) and query length (sample size) in retrieval effectivenessbetween modeling documents as hypergeometric and multinomial distributions ofterms. Fig. 4.2 illustrates the correlation of MAP, MRR, and the length of relevantdocuments over query length, for hgm-central and lm. Hypergeometric documentmodeling shows to have strong positive effects in both metrics when documentlength is up to 0.1 times the query length. As the query and the document lengthbecome equal, the differences between the hypergeometric and the multinomialdiminish.
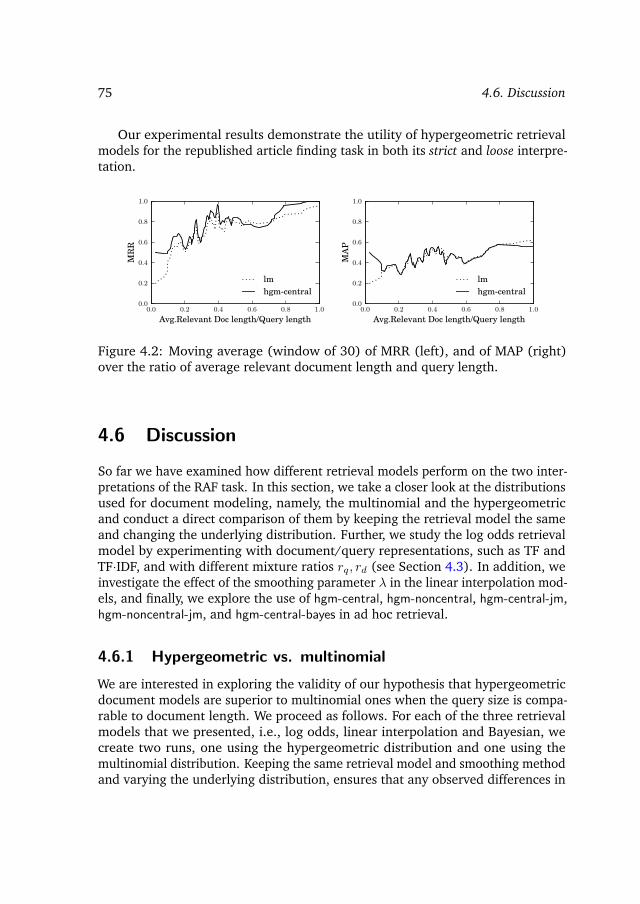
75 4.6. Discussion
Our experimental results demonstrate the utility of hypergeometric retrievalmodels for the republished article finding task in both its strict and loose interpre-tation.
0.0 0.2 0.4 0.6 0.8 1.0
Avg.Relevant Doc length/Query length
0.0
0.2
0.4
0.6
0.8
1.0
MR
R
lmhgm-central
0.0 0.2 0.4 0.6 0.8 1.0
Avg.Relevant Doc length/Query length
0.0
0.2
0.4
0.6
0.8
1.0
MA
P
lmhgm-central
Figure 4.2: Moving average (window of 30) of MRR (left), and of MAP (right)over the ratio of average relevant document length and query length.
4.6 Discussion
So far we have examined how different retrieval models perform on the two inter-pretations of the RAF task. In this section, we take a closer look at the distributionsused for document modeling, namely, the multinomial and the hypergeometricand conduct a direct comparison of them by keeping the retrieval model the sameand changing the underlying distribution. Further, we study the log odds retrievalmodel by experimenting with document/query representations, such as TF andTF·IDF, and with different mixture ratios rq, rd (see Section 4.3). In addition, weinvestigate the effect of the smoothing parameter λ in the linear interpolation mod-els, and finally, we explore the use of hgm-central, hgm-noncentral, hgm-central-jm,hgm-noncentral-jm, and hgm-central-bayes in ad hoc retrieval.
4.6.1 Hypergeometric vs. multinomial
We are interested in exploring the validity of our hypothesis that hypergeometricdocument models are superior to multinomial ones when the query size is compa-rable to document length. We proceed as follows. For each of the three retrievalmodels that we presented, i.e., log odds, linear interpolation and Bayesian, wecreate two runs, one using the hypergeometric distribution and one using themultinomial distribution. Keeping the same retrieval model and smoothing methodand varying the underlying distribution, ensures that any observed differences in

4. Hypergeometric Language Models 76
performance are solely due to the change in the underlying distribution. For ourexperiments we use the dataset from loose interpretation of the RAF task.
Log odds We use the log odds retrieval model with the parameters rq, rd set to1, and different underlying distributions: multinomial (multinomial), multivariatecentral hypergeometric (hgm-central), and multivariate non-central hypergeometric(hgm-noncentral). Results in the top of Table 4.5 validate our hypothesis. Log-oddsdocument models built on hypergeometric distributions outperform models builton the multinomial distribution. In particular, both hgm-central, and hgm-noncentraloutperform multinomial in all metrics with statistically significant differences.
Linear interpolation We use a linear interpolation retrieval model with multi-nomial, central, and non-central distributions, and set λ = 0.1. The results inTable 4.5 (middle) show that the multinomial distribution outperforms hypergeo-metric ones. This finding contradicts our earlier findings from using the log oddsretrieval model. We postulate that this discrepancy is caused from our approach tosmoothing term frequencies in documents, which leaves the term probability massunaltered. This can also partially explain the relatively lower scores obtained fromthe linear interpolation retrieval models compared to the log odds and Bayesianretrieval models.
Dirichlet vs DCM We compare the performance of Dirichlet smoothing on themultinomial distribution (unigram language model) and of DCM on the multivari-ate central hypergeometric. The smoothing parameter µ was found to peak at1120 for both models when optimized for MAP (we discuss the effect of µ on MAPin more detail below). Table 4.5 (bottom) lists the results. Performance hoversat the same levels for both models, with DCM showing better R-precision withstatistically significant difference. This can be attributed to the ability of DCM tocapture word burstiness better than the Dirichlet (Xu and Akella, 2008) whichleads to high early precision.
4.6.2 Mixture ratios, term weighting, and smoothingparameters
We look at the effect of mixture ratios and term weighting on the log odds retrievalmodel, and the effect of smoothing parameters on the linear interpolation, andBayesian retrieval models.
We begin with the mixture ratios rq, rd for hgm-central and hgm-noncentral; see(4.5). Table 4.6 shows that, on average, performance degrades as we deviate fromrq = 1, rd = 1. When rd = 2, we observe a slight increase for some metrics at
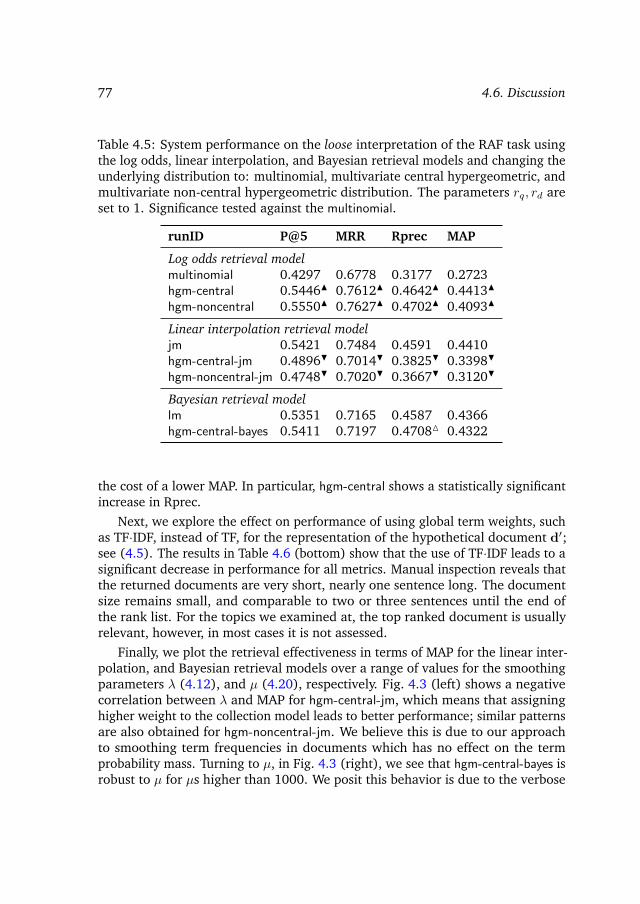
77 4.6. Discussion
Table 4.5: System performance on the loose interpretation of the RAF task usingthe log odds, linear interpolation, and Bayesian retrieval models and changing theunderlying distribution to: multinomial, multivariate central hypergeometric, andmultivariate non-central hypergeometric distribution. The parameters rq, rd areset to 1. Significance tested against the multinomial.
runID P@5 MRR Rprec MAP
Log odds retrieval modelmultinomial 0.4297 0.6778 0.3177 0.2723hgm-central 0.5446N 0.7612N 0.4642N 0.4413N
hgm-noncentral 0.5550N 0.7627N 0.4702N 0.4093N
Linear interpolation retrieval modeljm 0.5421 0.7484 0.4591 0.4410hgm-central-jm 0.4896H 0.7014H 0.3825H 0.3398H
hgm-noncentral-jm 0.4748H 0.7020H 0.3667H 0.3120H
Bayesian retrieval modellm 0.5351 0.7165 0.4587 0.4366hgm-central-bayes 0.5411 0.7197 0.4708M 0.4322
the cost of a lower MAP. In particular, hgm-central shows a statistically significantincrease in Rprec.
Next, we explore the effect on performance of using global term weights, suchas TF·IDF, instead of TF, for the representation of the hypothetical document d′;see (4.5). The results in Table 4.6 (bottom) show that the use of TF·IDF leads to asignificant decrease in performance for all metrics. Manual inspection reveals thatthe returned documents are very short, nearly one sentence long. The documentsize remains small, and comparable to two or three sentences until the end ofthe rank list. For the topics we examined at, the top ranked document is usuallyrelevant, however, in most cases it is not assessed.
Finally, we plot the retrieval effectiveness in terms of MAP for the linear inter-polation, and Bayesian retrieval models over a range of values for the smoothingparameters λ (4.12), and µ (4.20), respectively. Fig. 4.3 (left) shows a negativecorrelation between λ and MAP for hgm-central-jm, which means that assigninghigher weight to the collection model leads to better performance; similar patternsare also obtained for hgm-noncentral-jm. We believe this is due to our approachto smoothing term frequencies in documents which has no effect on the termprobability mass. Turning to µ, in Fig. 4.3 (right), we see that hgm-central-bayes isrobust to µ for µs higher than 1000. We posit this behavior is due to the verbose
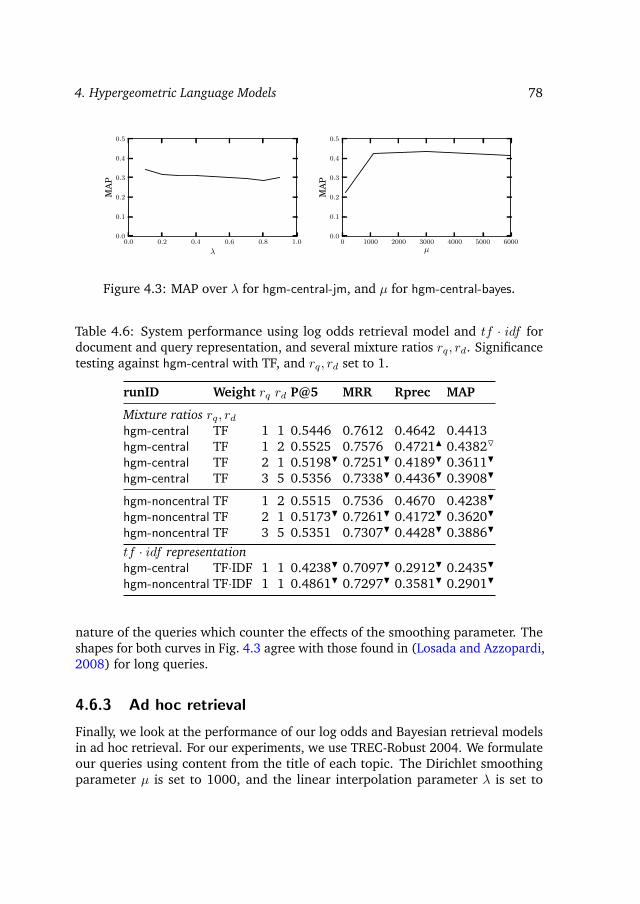
4. Hypergeometric Language Models 78
0.0 0.2 0.4 0.6 0.8 1.0
λ
0.0
0.1
0.2
0.3
0.4
0.5
MA
P
0 1000 2000 3000 4000 5000 6000µ
0.0
0.1
0.2
0.3
0.4
0.5
MA
P
Figure 4.3: MAP over λ for hgm-central-jm, and µ for hgm-central-bayes.
Table 4.6: System performance using log odds retrieval model and tf · idf fordocument and query representation, and several mixture ratios rq, rd. Significancetesting against hgm-central with TF, and rq, rd set to 1.
runID Weight rq rd P@5 MRR Rprec MAP
Mixture ratios rq, rdhgm-central TF 1 1 0.5446 0.7612 0.4642 0.4413hgm-central TF 1 2 0.5525 0.7576 0.4721N 0.4382O
hgm-central TF 2 1 0.5198H 0.7251H 0.4189H 0.3611H
hgm-central TF 3 5 0.5356 0.7338H 0.4436H 0.3908H
hgm-noncentral TF 1 2 0.5515 0.7536 0.4670 0.4238H
hgm-noncentral TF 2 1 0.5173H 0.7261H 0.4172H 0.3620H
hgm-noncentral TF 3 5 0.5351 0.7307H 0.4428H 0.3886H
tf · idf representationhgm-central TF·IDF 1 1 0.4238H 0.7097H 0.2912H 0.2435H
hgm-noncentral TF·IDF 1 1 0.4861H 0.7297H 0.3581H 0.2901H
nature of the queries which counter the effects of the smoothing parameter. Theshapes for both curves in Fig. 4.3 agree with those found in (Losada and Azzopardi,2008) for long queries.
4.6.3 Ad hoc retrieval
Finally, we look at the performance of our log odds and Bayesian retrieval modelsin ad hoc retrieval. For our experiments, we use TREC-Robust 2004. We formulateour queries using content from the title of each topic. The Dirichlet smoothingparameter µ is set to 1000, and the linear interpolation parameter λ is set to

79 4.7. Conclusions and outlook
Table 4.7: System performance on the TREC-ROBUST 2004 collection. Significancetested against indri.
runID P@5 MRR Rprec MAP
Titleindri 0.4570 0.6603 0.2638 0.2221hgm-central 0.3590H 0.5406H 0.2096H 0.1650H
hgm-central-jm 0.3920H 0.5735H 0.2515H 0.2007H
hgm-central-bayes 0.4578 0.6603 0.2638 0.2221hgm-noncentral 0.3597H 0.5310H 0.2033H 0.1571H
hgm-noncentral-jm 0.3839H 0.5649H 0.2458H 0.1962H
0.1. Table 4.7 shows results for indri (baseline), hgm-central-bayes, hgm-central-jm,hgm-noncentral-jm, hgm-central, and hgm-noncentral. We see that hgm-central-bayesshows the same performance as the baseline. The performance of hgm-central-jm and hgm-noncentral-jm hover in the middle of that of Bayesian and log oddsretrieval models. Runs based on the log odds retrieval model prove least effective.The reason lies in the value of P ′max· , which becomes 1 when the query andthe document share only one common term–which is common for short queries.Without the normalization factor, and enough information from the query, theperformance of the log odds model depends on d′ which is mainly estimatedfrom the document (given the negligible effect from the query due to its shortlength). To this end, the more elaborate smoothing methods, used in indri, andhgm-central-bayes prove most effective.
The three analyses that we performed in this section establish the following. Thehypergeometric distributions are a better choice over the multinomial for modelingdocuments, when the system has to respond to document long queries. The Dirich-let and DCM smoothing show similar performance, with the later producing betterearly ranking. Further, retrieval effectiveness benefits the most from documentrepresentations that use raw term frequencies (TF), and equal mixture ratios rq,rd. Finally, with regards to ad hoc retrieval, retrieval models based on Bayesianinference deliver the best performance.
4.7 Conclusions and outlook
We looked at the task of republished article finding (RAF), to discover springboardsof discussion in social media related to a news article. Our approach is to findverbatim or near-verbatim copies of the news article building on the language
4. Hypergeometric Language Models 80
modeling paradigm. Our task is related to near-duplicate detection with theadditional challenge that in our scenario, users can inject comments in betweenexcerpts from the original article. To this extent the documents to be retrieved candeviate considerably from the original article.
In the process of tackling the problem, we revisited the assumptions made inunigram language model, namely, using the multinomial distribution for modelingdocuments. Our experiments provide the following answers to the researchquestions raised in Section 4.1:
RQ 4. What is the retrieval effectiveness of hypergeometric languagemodels compared to standard language models for the taskof republished article finding?
We looked at two hypergeometric distributions for modelingqueries and documents, the central, and non-central hyper-geometric distribution. The main difference between thetwo is that the central hypergeometric distribution makes theassumption of term independence, while the non-central dis-tribution allows for term bias. Our experiments showed thatusing the central hypergeometric distribution leads to betterretrieval effectiveness. The lower scores from non-centralmay be due to how we modeled term bias, an issue we wantto further pursue in the future.
RQ 5. What are optimal retrieval methods for hypergeometric lan-guage models? We propose, and compare three retrievalmodels using: log-odds, linear interpolation, and Bayesianinference.
We presented three retrieval models based on hypergeometricdistributions, one task-driven (log odds), one using linearinterpolation, and one more elaborate using Bayesian infer-ence. Our experiments on the RAF task showed that log oddsretrieval models outperform standard language modeling re-trieval methods, the linear interpolation retrieval methods areleast effective, and the Bayesian retrieval method is on parwith them. In the later, we found that the Dirichlet compoundmultinomial distribution (DCM) arises naturally for estimat-ing the parameters of a document model. This is an important

81 4.7. Conclusions and outlook
finding because it links central hypergeometric to DCM asmultinomial is linked to Dirichlet. DCM has been derived inthe past from hierarchical Bayesian modeling techniques as abetter model to Dirichlet (Elkan, 2006; Madsen et al., 2005;Xu and Akella, 2008).
In future work, we envisage to study more in depth different smoothing meth-ods suitable for the hypergeometric distributions and compare them to the multi-nomial case. Such methods can be challenging to find as they need to meetthe requirements set by the hypergeometric distribution, namely, the smoothedestimates need to be larger than those sampled. With regards to the noncen-tral hypergeometric distribution, we aim at exploring more elaborate ways ofincorporating term bias, such as term co-occurence between the document andquery.
Finally, our republished article finding task was formulated in the setting ofonline reputation management (ORM). ORM is related to search engine optimiza-tion, but the two do not coincide and their goals differ widely. ORM deals with anumber of recall-oriented retrieval tasks: republished article finding is one, dealingwith “creative” name variants and implicit references to a given target in socialmedia is another important example.
This chapter completes the first part of the thesis on tracking online content.Next, we present a summary of this and the previous chapter, and we describehow the outcomes from our methods can be used for providing support for impactanalysis.


Conclusion to Part I
In the previous two chapters, we focused on the research theme of tracking content.In Chapter 3 we studied the problem of linking online news and social media. Weused several channels of information for modeling the article as query which waslater issued to an index of social media utterances. The results from individualquery models were merged together using late data fusion methods, the weightsin which were optimized in both query-independent, and query-dependent ways.Our experiments showed that late data fusion methods improved the discovery ofsocial media utterances over individual query models. Among the individual querymodels, the one using the entire contents of the article performed the best. Thisexperimental artifact raises questions on the assumptions behind retrieval methodsbased on standard language modeling because the average query length in thistask is considerably longer than that of web queries and approximates the length ofthe documents to be retrieved. In Chapter 4 we looked closer at this phenomenonunder the lens of the republished article finding task. We proposed three retrievalmethods based on two hypergeometric distributions where sampling of queryterms is done without replacement. Our experiments confirmed our hypothesisthat the assumptions behind the standard language modeling are violated for longqueries and have negative effects in retrieval effectiveness. We also confirmed thatusing hypergeometric distributions help retrieval effectiveness in retrieval taskswhere queries are of similar length to the documents to be retrieved.
These findings provide answers to tracking online content in an effective androbust manner. Our methods can be employed to associate a source item (e.g.,a news article) to items that discuss it (e.g., blog posts), and hold promise tosupport grouping of individual news stories into topics, providing support forimpact analysis. In this respect, these associations provide the basis for analyzingand, potentially, predicting user behavior in terms of what makes content attractiveto people. This is the kind of question on which we focus in the next part; welook at three user behavior prediction tasks: podcast preference, the volume ofcomments, and inferring user browsing behavior.
83


Part IIPredicting Behavior
The second part of this thesis focuses on the research theme of predicting userbehavior. We focus on a particular angle of user behavior, namely, what makesonline objects attractive to people to interact with. If we were to characterizethese objects at an abstract level, we would group them based on their contenttype and their hosting environment. Content on the web can be classified intwo major types: edited (e.g., news articles), and unedited (e.g., blog posts, orpodcasts). Similarly, the hosting environment can be grouped into closed or open.An object is considered to live in a closed environment if a user has to use anapplication or a particular website to interact with it (e.g., a users commentson a news article, or subscribing to a podcast in iTunes), otherwise the object’senvironment is considered open (e.g., a user searches and browses the web to fulfillan information need). With this classification in mind, we study three scenariosusing a bottom-up approach, from closed to open environments.
We start with two types of closed environments, namely, iTunes and websitesof news agents, and then we move to open environments such as the web. Looselyspeaking, iTunes can be considered “more closed” than the online news agentsbecause people need to have installed the iTunes application on their devices.In Chapter 5, we study the user preference on user generated spoken content,namely, podcasts, for predicting podcast preference in iTunes. In Chapter 6, wemove to “semi-open” environments, those of online news agents. We analyzethe commenting behavior of users on online news articles, and develop methodsfor predicting the volume of comments per article, before and after publication.Finally, in Chapter 7, we look at open environments, and in particular at patternsof browsing behavior from users who search the web for news articles about aparticular topic. We develop methods for recommending news articles to usersbased on their information needs, and what articles they have read before.
In sum, in this second part, we try to identify the characteristics of attraction ofunedited spoken content in the closed environment of iTunes, of edited content inthe closed environment of online news agents, and of edited content in the openenvironment of the web. To confirm our observations, we develop methods basedon these characteristics for predicting user behavior in several settings.
85


5Podcast Preference
In this chapter we look at predicting behavior in “closed” environments through thetask of predicting podcast preference in iTunes. Podcasts are audio series publishedonline. Finding worthwhile podcasts can be difficult for listeners since podcastsare published in large numbers and vary widely with respect to quality and repute.Independently of their informational content, certain podcasts provide satisfyinglistening material while other podcasts remain disfavored. In this chapter, wepresent PodCred, a framework for analyzing listener appeal, and we demonstrateits application to the task of automatically predicting the listening preferences ofusers. First, we describe the PodCred framework, which consists of an inventory offactors contributing to user perceptions of the credibility and quality of podcasts.The framework is designed to support automatic prediction of whether or not aparticular podcast will enjoy listener preference. It consists of four categories ofindicators related to the Podcast Content, the Podcaster, the Podcast Context and theTechnical Execution of the podcast. Three studies contributed to the development ofthe PodCred framework: a review of the literature on credibility for other media, asurvey of prescriptive guidelines for podcasting and a detailed data analysis. Next,we report on a validation exercise in which the PodCred framework is applied toa real-world podcast preference prediction task. Our validation focuses on selectframework indicators that show promise of being both discriminative and readilyaccessible. We translate these indicators into a set of easily extractable “surface”features and use them to implement a basic classification system. The experimentscarried out to evaluate the system use popularity levels in iTunes as ground truthand demonstrate that simple surface features derived from the PodCred frameworkare indeed useful for classifying podcasts.
87
5. Podcast Preference 88
5.1 Introduction
As new episodes of a podcast are created, they are added to the podcast feed andare distributed over the internet (Patterson, 2006; van Gils, 2008). Users eitherdownload episodes individually for listening or subscribe to the feed of a podcast,so that new episodes are automatically downloaded as they are published. Notevery podcast is an equally valuable source of information and entertainment.Finding worthwhile podcasts among the large volumes of podcasts available online,which vary widely in quality and repute, can be a daunting task for podcast listenersand subscribers.
Podcasts are compared to radio programs by some definitions (Heffernan, 2005;Matthews, 2006). However, podcasting on the internet and radio broadcasting arecharacterized by three main differences. First, a podcast targets a specific groupof listeners who share a focused interest. The tight thematic focus of podcastshas inspired the term narrowcasting (Louderback, 2008). Podcasters creatingpodcasts anticipate longer shelf lives since it is possible to make podcasts availableindefinitely for download or reuse (Louderback, 2008). Third, no specializedequipment is required to produce and publish podcasts (Geoghegan and Klass,2005). The podosphere, the totality of all podcasts on the internet, contains a highproportion of unscripted, unedited, user generated content alongside professionallyproduced content. These characteristics of the podosphere contribute to the needfor techniques that support users in finding podcasts worth their listening time.
The task of bringing users together with podcasts they want to listen to ismade challenging by the sheer number of podcasts available.1 Download statisticsreveal a steady upward trend in podcast use (Madden and Jones, 2008; van Gils,2008). The podosphere is growing and its growth is foreseen to continue intothe future (Arbitron/Edison, 2008; Matthews, 2006). Listeners require methodsof discovering podcast episodes and podcasts that they would like. They need tobe able to locate podcasts that treat subject material that they are interested in,an issue that has attracted recent research interest (Celma and Raimond, 2008;Ogata et al., 2007). Helping listeners to find podcasts by topic is only one part ofthe challenge, however. Not all podcasts treating the same topic will be equallyworthwhile. In this chapter we address the challenge of automatically identifyingwhich podcasts have the highest potential for listener appeal. A podcast accesssystem can then use this information to support the podcast search and discoveryprocess by integrating it into a ranking score or by using it to inform browsing orrecommendation.
In this chapter, we present an approach for characterizing and exploiting theinherent properties of podcasts that signal credibility and quality to listeners. We
1Apple iTunes, one of the most extensive Podcast directories, advertises an inventory of 100,000podcasts.

89 5.1. Introduction
formulate our analysis of these properties into a framework called PodCred, whichconsists of four categories of indicators that capture different facets contributing tolisteners’ acceptance and approbation. The categories contain indicators involvingthe Podcast Content, the Podcaster, the Podcast Context and the Technical Executionof the podcast. The framework is aimed at providing support for the design of asystem that automatically predicts listener preference for podcasts. The PodCredframework was formulated to be maximally comprehensive and independent ofconsiderations of technical constraints on feature extraction. In this way, we ensurethat future evolution in automatic analysis techniques can be incorporated intosystems that are based on the framework.
To validate the usefulness of the PodCred framework, we select PodCredindicators as the basis of an implementation of a basic podcast classification system.We are interested in determining whether or not indicators that can be encodedas easily extractable surface features are useful for identifying podcasts that arepreferred by listeners. This basic classification system provides a foundation fromwhich to, in the future, implement a more sophisticated system that attempts toexploit a larger range of features derived from PodCred indicators.
The PodCred framework is designed to cover a particular domain. At the mostgeneral level, that domain can be described as the podosphere, which comprises allpodcasts available on the Web. The podosphere, however, can be further dividedinto music-based podcasts and spoken word podcasts. Our work concentrates onpodcasts containing spoken content. The podosphere is not characterized by aformal genre structure, however. Rather, podcasts tend to fall into genre categories,as has been noted, for example, by Heffernan (2005). Two central genres ofspoken word podcasts are particularly salient: talk show podcasts, which canalso be redistributions of shows that have run on the radio, and how-to podcasts,which give commentary or advice on particular subjects. It is important to clearlydifferentiate podcasts from other forms of internet multimedia, such as singleaudio or video files published to the web. In particular, the following internetmultimedia sources are excluded from our domain of investigation: Viddler,2
livestreams, internet radio, such as Live365,3 audio books, spoken Wikipediaarticles,4 and sites that use speech synthesis to create feeds of audio material fromcontent originally created as text, such as Speakapedia5 and Dixero.6
We foresee that as podcasting continues to mature as a form of multimedia cre-ation and delivery, it will expand with respect to end device (for example, becomemore oriented to mobile phones) and/or shift medium (include increasing amounts
2http://www.viddler.com/ – accessed October 28, 20123http://www.live365.com/ – accessed October 28, 20124http://en.wikipedia.org/wiki/Wikipedia:Spoken_articles – accessed October 28, 20125http://shinydevelopment.com/speakapedia – accessed October 28, 20126http://www.dixero.com/ – accessed October 28, 2012
5. Podcast Preference 90
of video content). Bloggers delight in announcing the demise of podcasting,7,8
and often the rise of video is cited as the cause. Independently of the perceivedtrends in the audio-only podosphere, the phenomenon of a syndicated multimediaseries that can be generated without professional equipment and which is targetedtowards a specific audience is sure to endure. The framework we propose providesa fundament on which analysis of this phenomenon can be built.
We have designed the PodCred framework with the following search scenarioin mind: a user makes use of a podcast search engine to search for a podcaston a particular topic with the goal of subscribing to that podcast. The searchengine returns a list of podcasts in response to a user query or a request fora recommendation. The user reviews these podcasts by reading the feed-levelmetadata (i.e., podcast title and description) scanning the list of episodes andlistening to, or briefly auditioning, a couple of the episodes. We are interestedin understanding on the basis of a relatively quick review of a podcast, whatmotivates a user to choose to subscribe to one podcast over another.
In the next section, we overview related literature. Then, we discuss our moti-vation for analyzing podcast preference in terms of user perceptions of credibilityand quality and for treating podcasts as a separate case from other types of media.Next, we present the PodCred framework and follow with a validation of the Pod-Cred framework based on a basic classification system that uses indicators from thePodCred framework that can be encoded as features that are easy to extract fromsurface characteristics of podcasts. Finally, we report on investigations of podcastsin the real world using our online implementation of the basic classification system.The concluding section offers a summary of our contributions and an outlook onfuture work.
5.2 The PodCred framework
In this section we first provide a motivation for the PodCred framework, addressingthe question of why credibility and quality are the characteristics that we singleout to develop the framework and why podcast preference prediction requires anapproach distinct from preference prediction for other media domains. We thenpresent the framework in full. Finally, we discuss the three studies that contributedto the framework, a review of the literature on credibility for other media, a surveyof prescriptive guidelines for podcasting and a data analysis.
7http://althouse.blogspot.nl/2007/08/podcasting-is-dead.html – accessed October 28,2012
8http://www.informationweek.com/global-cio/interviews/is-podcasting-dead/
229213721 – accessed October 28, 2012

91 5.2. The PodCred framework
5.2.1 Motivation for the framework
The PodCred framework consists of a list of indicators that encode factors influ-encing listener perceptions of the credibility and quality of podcasts. We adopt aninformation science perspective and consider credibility to be a perceived charac-teristic of media and media sources that contributes to relevance judgments (Riehand Danielson, 2007). Perceptions of quality and innate attractiveness are closelyassociated with credibility, with some work identifying quality as the superordinateconcept (Hilligoss and Rieh, 2007), some viewing the two as associated withseparate categories (Rieh, 2002) and some regarding quality as subordinate tocredibility (Metzger, 2007; Metzger et al., 2003). We incorporate quality andattractiveness by using an extended notion of credibility that is adapted to thepurposes of the podosphere.
In the context of the podosphere, credibility alone is not sufficient to captureuser preferences. Expertise and trustworthiness are conventionally considered asthe two primary components contributing to user perceptions of credibility (Met-zger, 2007; Metzger et al., 2003; Rubin and Liddy, 2006; Tseng and Fogg, 1999).Podcast listeners, we assume, are sensitive to these factors. In other words, usersprefer podcasts published by podcasters with expertise, i.e., who are knowledge-able about the subject, and who are trustworthy, i.e., they are reliable sources ofinformation and they have no particular motivation to deceive listeners. How-ever, users seek out podcasts not for information alone, but also in order to beentertained. Work on assessing quality of perception for multimedia refers to thiseffect as “infotainment duality” (Ghinea and Chen, 2008). The importance of thisphenomenon in the podosphere is supported by work suggesting that the need thatprompts searchers to seek podcasts does indeed comprise both an informationaland an entertainment component (Besser, 2008). If podcasts are a pastime, userswill certainly judge podcasts according to perceived information reliability, butother factors will enter into their preference formulation as well.
In order to capture additional factors considered by users, we apply an extendedview of credibility in our analysis. We explicitly incorporate acceptability aspects ofpodcasts—with this we mean the desirability or listener-appeal of a podcast arisingfrom sources other than those that contribute to the believability of its propositionalor declarative content. The inter-connectedness of acceptability and credibility iswell embodied by the use of the term “credibility” in the expression street credibility,or street cred. In this context, “credibility” connotes acceptance and approbation.We make use of the morpheme “cred” in the framework name as a reminderthat we are using a view of credibility, where, in addition to trustworthiness andexpertise, attractiveness and acceptability also play a role. Our perspective oncredibility is consistent with literature that observes that the dimensions alongwhich credibility is understood or assessed differ depending on the source that is

5. Podcast Preference 92
being evaluated (Metzger et al., 2003; Rieh and Danielson, 2007).Using perceptions of user quality alone would not be sufficient to capture the
factors that cause listeners to prefer one podcast over another with comparableinformation content. A “PodQual” framework would be a priori unsuited to modelpreference in a domain where user generated content stands on equal footing withprofessionally generated content. “PodQual” would lack sufficient explanatorypower to cover the cases in which the low budget livingroom production is pre-ferred by listeners. In the remainder of this section, we discuss the literature onuser generated media that is related to the PodCred framework.
In contrast to conventional media such as newspapers and television, con-tent published on the internet is not subject to vetting by professional gatekeep-ers (Metzger, 2007; Metzger et al., 2003). The resulting freedom and variabilityof expression means that analysis of internet content can prove more challengingthan analysis of conventional media. Like podcasts, blogs are characterized by atemporal dimension, with new posts being added over time. Blogs are frequentlyuser generated and contain primary source descriptions of people’s lives and sur-roundings; bloggers build a tightly knit social network structure (Mishne, 2007).Bloggers are individualistic and develop their own voices (van House, 2002). Thepodosphere is also characterized by a high proportion of user generated content, asocial network structure and a dominance of the voice of the individual providingtestimony about personal experiences or views. The literature has applied a dedi-cated credibility analysis framework for blogs because information seekers do notapproach blogs in the same way as they approach other forms of web content (Ru-bin and Liddy, 2006; Weerkamp and de Rijke, 2012). In particular, credibilitybuilding in the blogosphere is a dynamic process characterized by exchange be-tween bloggers and readers; revelation of real world identities and personal detailsis an important part of process by which bloggers establish trust (Rubin and Liddy,2006). In the blogosphere, trust is built by revealing bias; it is not objectivity,but rather openness about individual subjectivity that makes the key contribution,cf. (Rubin and Liddy, 2006).
Research on credibility in the blogosphere is an important source of cluesfor understanding the perceptions of credibility and quality in the podosphere.However, it is not possible to directly adopt a blog credibility analysis framework,such as the one presented by Rubin and Liddy (2006), for use in podcast analysis.A self-evident difference between blogs and podcasts that motivates a dedicatedpodcast analysis framework is the fact that the core of a podcast is its audio. Forthis reason audio and speech characteristics must be taken into account whenanalyzing podcasts. A single podcast often contains rapid crossfire conversation:such exchanges are not characteristic of blogs. Other differences are more subtle.As we will see, users searching or browsing the podosphere simultaneously seekinformation and entertainment. Without doubt, users also expect to be entertained

93 5.2. The PodCred framework
by blogs. However, reading a blog is a dedicated intellectual activity that does notreadily admit multi-tasking. Users often search for podcasts, however, as listeningmaterial to accompany other activities, such as housework, commuting or exercise.Because of this behavior, an understanding of the acceptability/appeal dimensionof podcasts needs to encompass aspects designed to capture the extent to whichthe listener can follow the content while carrying out other activities. Additionally,blogs and podcasts are different with respect to the volume of content a user canconsume. The number of podcast episodes one can listen to in a single day issubstantially smaller than the number of blog posts one can read or skim. The factthat podcasts require a serious commitment of listener time leads to the result thatpodcasts compete directly with each other for the listener’s attention: subscribingto a new podcast quite possibly means dropping an old podcast (Geoghegan andKlass, 2005).
Although much of the podosphere is user generated, podcasting clearly remainsinfluenced by its broadcasting heritage. We were careful to consider credibility andquality indicators for radio during the formulation of the PodCred framework. Inparticular, we focused on indicators reflecting well crafted audio production. Sucha parallel has also been exploited in work on blog credibility, where credible blogshave been assumed to have the same indicators as credible newspapers (Weerkampand de Rijke, 2012).
In sum, although factors impacting perceptions of credibility and quality ofconventional media and user generated media are important for the analysis ofpodcasts, podcasts constitute a separate medium with its own particular dimen-sions. For this reason, we developed a dedicated framework for the analysis ofcredibility and quality of podcasts.
5.2.2 Presentation of the framework
The PodCred podcast analysis framework consists of a list of indicators takeninto account when assessing a podcast for credibility and appeal. The frameworkwas formulated by synthesizing the results of three studies: a review of thecredibility literature, a survey of the prescriptive guidelines written for podcastson how to create podcasts and a data analysis of podcasts, including both a setof listener preferred podcasts and a set of “non-preferred” podcasts that failed toattract listener favor. In this section, the PodCred framework is presented and thecontributions of each of the three studies to the formulation of the framework aredescribed and discussed.
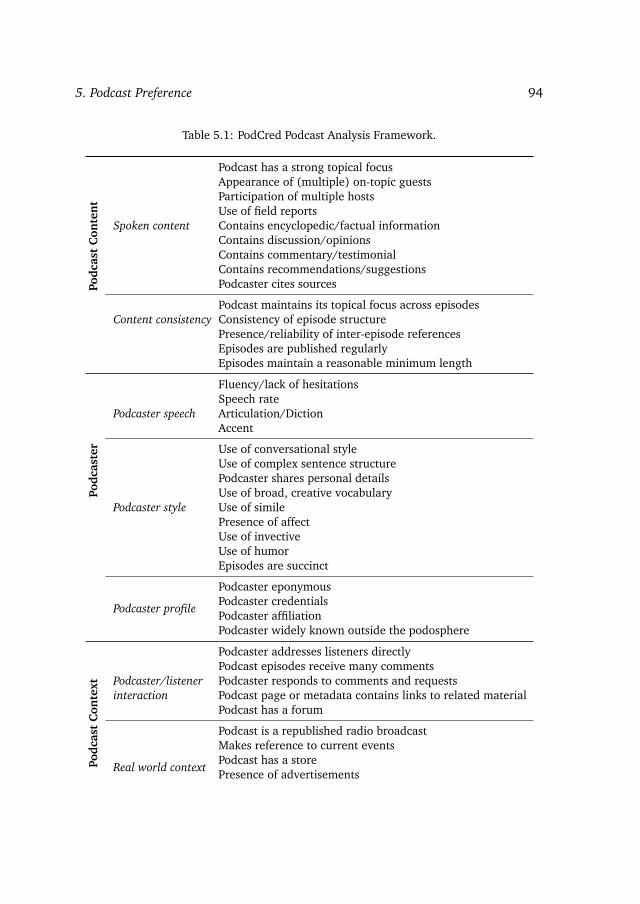
5. Podcast Preference 94
Table 5.1: PodCred Podcast Analysis Framework.
Podc
ast
Con
ten
t
Spoken content
Podcast has a strong topical focusAppearance of (multiple) on-topic guestsParticipation of multiple hostsUse of field reportsContains encyclopedic/factual informationContains discussion/opinionsContains commentary/testimonialContains recommendations/suggestionsPodcaster cites sources
Content consistencyPodcast maintains its topical focus across episodesConsistency of episode structurePresence/reliability of inter-episode referencesEpisodes are published regularlyEpisodes maintain a reasonable minimum length
Podc
aste
r
Podcaster speech
Fluency/lack of hesitationsSpeech rateArticulation/DictionAccent
Podcaster style
Use of conversational styleUse of complex sentence structurePodcaster shares personal detailsUse of broad, creative vocabularyUse of similePresence of affectUse of invectiveUse of humorEpisodes are succinct
Podcaster profile
Podcaster eponymousPodcaster credentialsPodcaster affiliationPodcaster widely known outside the podosphere
Podc
ast
Con
text
Podcaster addresses listeners directlyPodcast episodes receive many comments
Podcaster/listener Podcaster responds to comments and requestsinteraction Podcast page or metadata contains links to related material
Podcast has a forum
Real world context
Podcast is a republished radio broadcastMakes reference to current eventsPodcast has a storePresence of advertisements

95 5.2. The PodCred framework
Table 5.1: PodCred Podcast Analysis Framework. (continued from previouspage)
Podcast has a sponsorPodcast displays prizes or endorsements
Tech
nic
alEx
ecu
tion
Production
Signature intro/opening jingleBackground music (bed)Atmospheric sound/Sound effectsEditing effects (e.g., fades, transitions)Studio quality recording/no unintended background noise
Packaging
Feed-level metadata present/complete/accurate(e.g., title, description, copyright)
Episode-level metadata present/complete/accurate(e.g., title, date, authors)
ID3 tags usedAudio available in high quality/multiple qualitiesFeed has a logo; logo links to homepageEpisodes presented with images
DistributionSimple domain nameDistributed via distribution platformPodcast has portal or homepageReliable downloading
The PodCred framework, shown in Table 5.1, comprises four top-level cate-gories of indicators. The first category, Podcast Content, deals with the quality andconsistency of the intellectual content of the podcast. The purpose of this categoryis to capture the ability of the podcast to satisfy a particular, but yet unspecified,information need of the user. Podcast Content indicators reflect whether or nota podcast is focused on a central topic or theme. Topical focus is necessary ifa podcast is to provide a good fit with a specific interest or set of interests of alistener. Also included in the Podcast Content category are indicators reflectingtype, composition and source of content. These indicators are formulated so thatthey can capture effects specific to user generated content, namely that informationseekers place value on personal content (Besser, 2008). Opinions, testimonials andrecommendations can be considered personal since they arise from the experienceand convictions of an individual and not via the consensus of experts or by wayof social convention. The second category of indicator involves the Podcaster. Itis important that the creative agent of the podcast is explicitly encoded in theframework. Both expertise and trustworthiness, two main components of cred-ibility, imply that the information source is regarded as capable of intelligenceand volition, both characteristics of a human agent. Furthermore, specificallyin the case of user generated content, credibility is built by public disclosure of

5. Podcast Preference 96
personal identity and personal detail (Rubin and Liddy, 2006). Of particularimportance in the Podcaster category are elements relating to the speech of thepodcast. Information about the style and quality of the podcaster’s speech makesit possible to capture the potential appeal of the podcaster’s persona and also thebasic ease-of-listening of the podcast. The third category of indicator is Podcastcontext. This category involves indicators that capture the network of associatedinformation sources and social players that a podcast builds around it in order toestablish its reputation. User generated content has been described as involving aprocess of information exchange (Rubin and Liddy, 2006). A podcast that is tightlyintegrated with its information sources and with its listener group has not onlya clear source of information, but it also has demonstrable impact. Additionally,user generated content builds credibility by avoiding covert bias (Rubin and Liddy,2006). Sponsors/stores/advertisers are included in the framework because theyreveal information not only about potential bias, but also about the scope of thepodcast’s impact. The final category of indicators is Technical Execution. Theseindicators are specific to podcasts and reflect how much time and effort went in toproducing the podcast.
The PodCred framework belongs to a class of credibility assessment approachesthat has been called Checklist Approaches (Metzger, 2007). Instead of building acognitive model of the process by which credibility is assessed by humans, suchapproaches aim to inventory the factors that contribute to judgments of credibility.In a strict Checklist Approach, the presence of all checklist factors would indicatemaximum credibility. Here the PodCred framework takes a different tactic, leavingopen two questions to be resolved when PodCred is put to use in a preferenceprediction system. First, it is not specified whether particular indicators are positiveor negative indicators of podcast attractiveness. Rate of podcaster speech, forexample, could contribute to listener preference if it is fast (implies mastery of thematerial) or if it slow (facilitating ease of information uptake). Second, it is notspecified whether all indicators are necessary for a podcast to be attractive. Forexample, recommendations might make a podcast more attractive, but would notbe appropriate to include in all types of podcasts.
5.2.3 Derivation of the framework
Approaches to media credibility
The extensive body of literature on media credibility assessment provides the basicskeleton for the PodCred framework. Two important streams from early researchon credibility as detailed by Metzger et al. (2003) are Message Credibility andSource Credibility, and these are represented by the first two categories of theframework, Podcast Content and Podcaster. Investigation of message credibility has

97 5.2. The PodCred framework
traditionally concerned itself with the impact of characteristics such as messagestructure, message content and language intensity including use of opinionatedlanguage, cf. Metzger et al. (2003). Message source credibility research deals withassessments concerning the person or organization who generates the message.These aspects of credibility are applicable not only in the area of traditional media,but also for internet content. Source and Content are the first two facets ofjudgment of information quality on the web used in the framework of Rieh andBelkin (1998). Message credibility and source credibility overlap to a certaindegree; in the PodCred framework certain Podcast Content indicators could beargued to also be important Podcaster credibility indicators.
Hilligoss and Rieh (2007) present a credibility framework that can be appliedacross resources and across tasks. Based on a diary study using 24 participants theauthors collect 12 credibility assessment types, divided into three levels, construct,heuristics, and interaction. We make use of their findings on types of credibilityassessment at the heuristic and at the interaction level. These are the levels thatare relevant for the PodCred framework, which aims to capture information thatwill shed light on an assessment process which is superficial and of relatively shortduration, i.e., the subscribe/not subscribe decision. At the heuristics level, assess-ment types are media-related and source-related, corresponding to the classicalcomponents of credibility. Additionally, the heuristics level contains endorsement-based assessments. In the podcast world, a podcast enjoys endorsement whenlisteners accept and respond well to it. Endorsement based criteria can be foundin the Podcast Context category of the PodCred framework. Finally, the heuristicslevel contains aesthetics-based assessments. The corresponding characteristic ofpodcasts is how they sound. We add a subcategory on podcaster speech and asubcategory on podcast production to capture the impression made by the audiodimension of a podcast. These elements are designed to be the counterparts ofdesign elements in websites, argued by Metzger et al. (2003) to contribute towebsite dynamism and in this way to impact credibility.
During the development of the PodCred framework, special attention was paidto Rubin and Liddy (2006)’s and van House (2002)’s work on credibility in blogs.Blogs and podcasts share commonalities because they both are social media andcontain a high portion of user generated content. They also both have a temporaldimension, meaning that they are published in a series that unfolds over time. TheRubin and Liddy (2006) framework involves several indicators that are directlytranslatable from the blogosphere to the podosphere. In particular, blogger’sexpertise and offline identity disclosure, is integrated into the PodCred frameworkas a subcategory of the Podcaster indicator category called Podcaster Profile. Next,we consider indicators related to the temporal dimension of blogs, these are listedin the Rubin and Liddy (2006) framework as timeliness and organization. In thePodCred framework aspects involving the temporal dimension are incorporated
5. Podcast Preference 98
as indicators relating to whether podcasts track recent events and whether theymaintain a certain level of consistency and structure. Finally, a critical aspect usedin the Rubin and Liddy (2006) framework is appeals and triggers of a personalnature. This aspect includes the literary appeal and personal connection evokedby a blog. Parallel elements are incorporated into the PodCred framework as asubcategory of the Podcaster indicator category called Podcaster Style. Work byvan House (2002) stresses the importance of the connection of online and offlineblogger identities and enhancing the effect of personal voice. Parallel indicatorsare incorporated into the PodCred framework as “Podcaster eponymous” and“Podcaster shares personal details.”
Prescriptive rules for podcasting
The PodCred framework also reflects the results of a study we carried on pre-scriptive guidelines that are published to help podcasters create good podcasts.Experienced podcasters understand what makes podcasts popular and what kindof podcasts listeners generally like and we incorporate this information in to thePodCred framework. Our study surveyed information found at websites focusingon helping podcasters produce better shows. A good podcast is considered tobe one that promotes the popularity of the podcaster and creates a communityaround the show with the ultimate goal of reaching more listeners. The studyidentified three informative sources of information and focused on these sources.First, Podcast Academy,9 a podcast containing material ranging from keynotes ofpodcasting conferences to interviews with guests from the podcasting domain.Second, Podcast Underground,10 a podcast portal that makes information availableabout how to improve and enhance the content and the exposure of a podcast,including an article11 containing comments from individual podcasters who reporttheir personal experiences, successes and failures while experimenting with themedium. Third, How to Podcast,12 a website providing a step-by-step guide to pod-cast production. The guide includes a list of key elements that should be presentto make a podcast worth listening to, and also a list of guidelines for measuringsuccess in terms of number of subscribers. The study of prescriptive podcastingguidelines provided corroboration for the inclusion of the indicators drawn fromthe credibility literature discussed in the previous section. We now look at whatour prescriptive sources have to say about each of the indicator categories.
First, the prescriptive podcast guidelines support inclusion of Podcast Con-tent category indicators in the PodCred framework. The guidelines stress the
9http://www.podcastacademy.com – accessed October 28, 201210http://www.podcastingunderground.com – accessed October 28, 201211http://www.podcastingunderground.com/2007tips/ – accessed October 28, 201212http://www.how-to-podcast-tutorial.com – accessed October 28, 2012
99 5.2. The PodCred framework
importance of keeping the podcast focused on one topic. Evidently, podcasters’experience underlines the importance of the narrow focus on a target audience,mentioned in the introduction as one of the major differences between a podcastand a conventional radio program. Podcasts should create a meeting point forpeople interested in a certain topic or a specific sub-genre. A podcaster shouldintroduce listeners to the structure of the episode, making it clear to the listenerswhat they can expect to hear during the show. Well-structured episodes are alsoreported to help in guiding the podcaster in creating a natural flow and a steadypace. Podcasters who carry out background research or prepare transcripts canmore easily create the desired tightness of structure and focus within their podcastepisodes. A further suggestion is to maintain a parallel structure across episodesin a podcast. A repeated structure makes the podcast feel familiar to listeners andalso allows them to anticipate content. All three of the sources consulted in ourstudy underline the importance of regularity of episode releases. Again, givinglisteners the power to anticipate increases podcast loyalty. Finally, interviews withpopular and well-known people in the domain are highly recommended.
Second, prescriptive podcast guidelines mention many factors that support theindicators in the Podcaster category of our PodCred framework. If a show is tobecome popular, the podcaster should be knowledgeable and passionate about thepodcast topic. The prescriptive guidelines for podcasts explicitly and emphaticallyrecommend that podcasters share personal experiences and stories. Such sharingcreates a bond between listener and podcaster. Podcasters report that buildingtwo different emotions into podcast episodes makes them more appealing e.g.,love and humor, humor and sadness. In short, our sources provide direct supportfor the inclusion of the indicators involving personal details, affect and podcastercredentials in the PodCred framework.
Third, strong support for Podcast Context categories emerges from the prescrip-tive sources. The sources advise podcasters to stay current with the developmentsin the podosphere in terms of which topics are treated in other podcasts of the samedomain. Podcasters should also promote interaction with listeners by reactingto comments and suggestions from their audience. Podcast guidelines advise theactivation of multiple interaction channels: subscription to syndication feeds (e.g.,iTunes), forums, voicemails, emails, blog comments, store and donation options.Podcasters’ activity and response in fora discussions and comments is crucial, sinceit refuels the cycle of interactivity.
Fourth, our prescriptive podcast sources provided support for the indicators inthe Technical Execution category of our PodCred framework. The podcast guidelinesrecommend enhancing audio quality by editing the final audio, e.g., adding soundeffects, cross-fades between sections, removing sentence fillers (e.g., uhm, uh)and long periods of silence. A quiet recording environment and semi-professionalmicrophones are suggested to minimize the background noise.
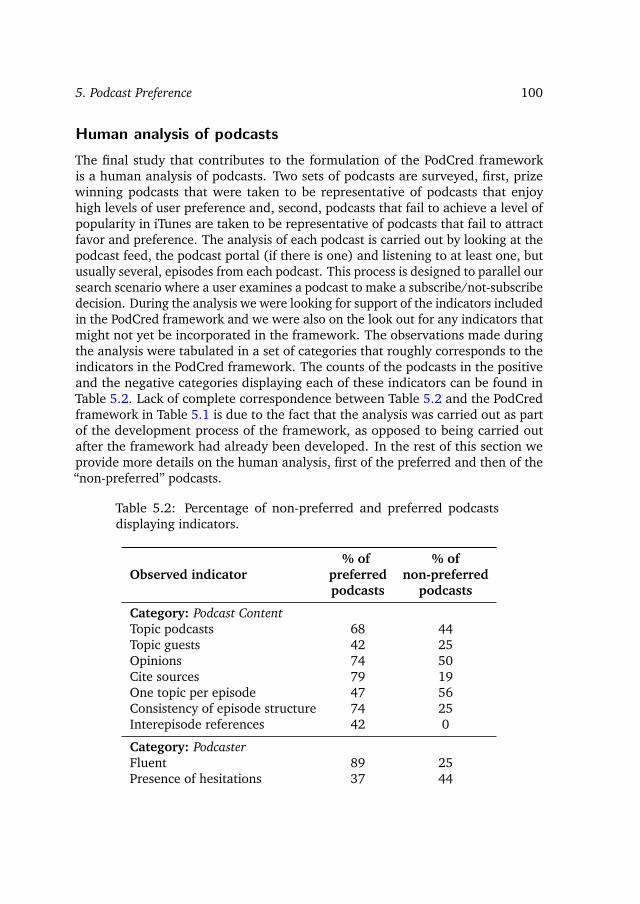
5. Podcast Preference 100
Human analysis of podcasts
The final study that contributes to the formulation of the PodCred frameworkis a human analysis of podcasts. Two sets of podcasts are surveyed, first, prizewinning podcasts that were taken to be representative of podcasts that enjoyhigh levels of user preference and, second, podcasts that fail to achieve a level ofpopularity in iTunes are taken to be representative of podcasts that fail to attractfavor and preference. The analysis of each podcast is carried out by looking at thepodcast feed, the podcast portal (if there is one) and listening to at least one, butusually several, episodes from each podcast. This process is designed to parallel oursearch scenario where a user examines a podcast to make a subscribe/not-subscribedecision. During the analysis we were looking for support of the indicators includedin the PodCred framework and we were also on the look out for any indicators thatmight not yet be incorporated in the framework. The observations made duringthe analysis were tabulated in a set of categories that roughly corresponds to theindicators in the PodCred framework. The counts of the podcasts in the positiveand the negative categories displaying each of these indicators can be found inTable 5.2. Lack of complete correspondence between Table 5.2 and the PodCredframework in Table 5.1 is due to the fact that the analysis was carried out as partof the development process of the framework, as opposed to being carried outafter the framework had already been developed. In the rest of this section weprovide more details on the human analysis, first of the preferred and then of the“non-preferred” podcasts.
Table 5.2: Percentage of non-preferred and preferred podcastsdisplaying indicators.
Observed indicator% of % of
preferred non-preferredpodcasts podcasts
Category: Podcast ContentTopic podcasts 68 44Topic guests 42 25Opinions 74 50Cite sources 79 19One topic per episode 47 56Consistency of episode structure 74 25Interepisode references 42 0
Category: PodcasterFluent 89 25Presence of hesitations 37 44
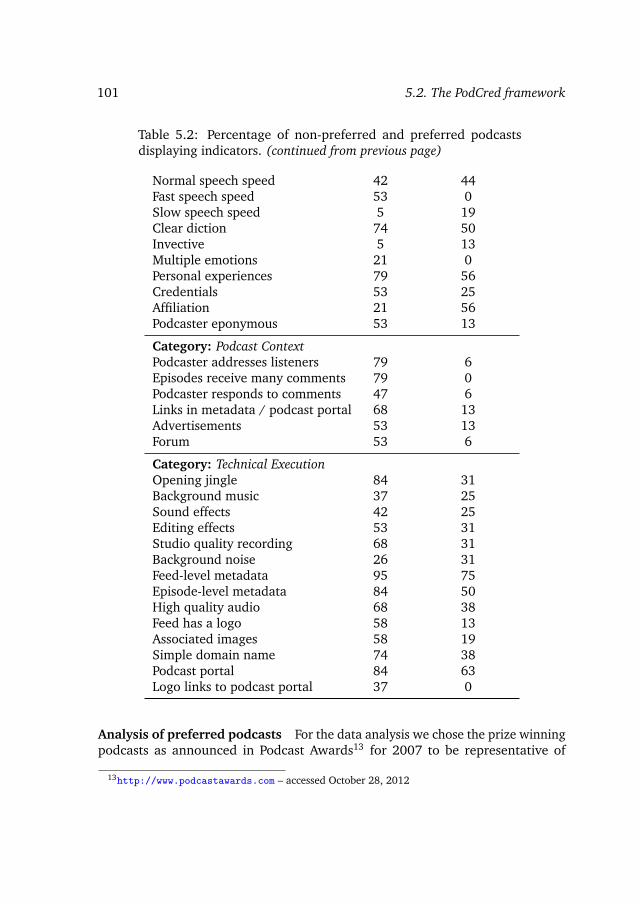
101 5.2. The PodCred framework
Table 5.2: Percentage of non-preferred and preferred podcastsdisplaying indicators. (continued from previous page)
Normal speech speed 42 44Fast speech speed 53 0Slow speech speed 5 19Clear diction 74 50Invective 5 13Multiple emotions 21 0Personal experiences 79 56Credentials 53 25Affiliation 21 56Podcaster eponymous 53 13
Category: Podcast ContextPodcaster addresses listeners 79 6Episodes receive many comments 79 0Podcaster responds to comments 47 6Links in metadata / podcast portal 68 13Advertisements 53 13Forum 53 6
Category: Technical ExecutionOpening jingle 84 31Background music 37 25Sound effects 42 25Editing effects 53 31Studio quality recording 68 31Background noise 26 31Feed-level metadata 95 75Episode-level metadata 84 50High quality audio 68 38Feed has a logo 58 13Associated images 58 19Simple domain name 74 38Podcast portal 84 63Logo links to podcast portal 37 0
Analysis of preferred podcasts For the data analysis we chose the prize winningpodcasts as announced in Podcast Awards13 for 2007 to be representative of
13http://www.podcastawards.com – accessed October 28, 2012

5. Podcast Preference 102
popular podcasts. People’s Choice Podcast Awards are an annual contest thatawards a prize to the podcast accruing the most votes. Voting and nominationis open to the public. Podcasts nominated for the awards must have publishedat least 8 episodes since the beginning of May of the award year. The contestoffers 22 prizes, one for each of 20 genre categories (Best Video Podcast, BestMobile Podcast, Business, Comedy, Culture/Arts, Education, Entertainment, Foodand Drink, Gaming, General, GLBT, Health/Fitness, Mature, Movies/Films, PodsafeMusic, Political, Religion Inspiration, Sports, Technology/Science and Travel) andtwo extra awards for People’s Choice and Best Produced. The categories used in thePodcast Awards correspond roughly to iTunes main categories. For our analysis,we investigated podcasts from all categories with the exception of Video Podcastsince the PodCred framework does not cover video content.
During the analysis several indicators emerged of sufficient importance to meritinclusion in the PodCred framework. First, we noticed that nearly all the podcastssurveyed use a standard opening jingle. Second, a large number have associatedwebsites (i.e., podcast portals). Third, many include images and links.
Additionally, we observed quite a few characteristic corroborating indicatorsfrom the literature and the prescriptive guidelines. The podcasters frequentlycite their sources, either by providing website URLs, quotes from people, orbook/article excerpts. Also, although most of the time podcasters used generalvocabularies, terminology from the podcasts domain of topical focus was alsoobserved. Most of the podcasts that were analyzed contained conversational stylespeech. Podcasts will commonly involve two speakers; one host and one guest.However, there were frequent cases where podcasts involved multiple guests ormultiple hosts. Podcasters speaking in monologue used complete sentences, butsentence fragments were common in conversations between podcasters or betweenpodcasters and guests. The regularity of episode release ranges from two episodesper day to monthly. Some podcasts failed to respect a regular release schedule,but the majority of podcasts is published on a daily or weekly basis. All but onepodcast comes with complete feed metadata. For about half of the cases, podcast-level metadata is limited to a single-sentence description. At the episode level,metadata is generally rich with only two podcasts failing to provide episode levelinformation. Finally, the analysis revealed that interactivity between the podcasterand the listeners is an important characteristic of good podcasting. Three-quartersof the podcasters address listeners directly. The same portion of podcasters receivea large volume of comments. Community building emerged as clearly importantin the analysis, with 10 podcasts providing a forum for their listeners. Forms ofpodcaster response to listeners were varied, with some podcasters responding tocomments directly and others giving feedback from inside a podcast episode orresponding on fora.

103 5.3. Validating the PodCred framework
Analysis of non-preferred podcasts We collected a group of podcasts lackinglistener appeal by using the column headed “Popular” in iTunes. For our dataanalysis, we selected a set of podcasts by choosing 16 podcasts that land at thebottom of the list when podcasts in iTunes are ranked by bar-count in the columnheaded “Popular.” We take these podcasts to be representative of the sorts ofpodcasts that fail to inspire listener appreciation. The analysis of this set of “non-preferred” podcasts provided additional support for our choice of indicators. Mostcharacteristics we observed were already included in the PodCred framework. Inparticular, we observed that podcasts that are not popular exhibit low audio quality,lack of evidence of interaction between podcaster and listeners, and lack of anadequate platform for such interaction (i.e., no commenting facilities or forum).The data analysis led to the discovery of one indicator not yet included in theframework, namely that podcast episode length tends to be short for non-preferredpodcasts. One of the cases in which podcast episodes tend to be short is when afeed is being used to deliver a set of audio files that were created not as a series,but rather for diverse purposes, e.g., a collection of otherwise unrelated recordingsby children in a school class.
The data analysis of “non-preferred” podcast was the final step in the formulationof the PodCred framework. The rest of this chapter is devoted to discussing thevalidation exercise that we carried out to confirm the utility of our framework forpodcast preference prediction.
5.3 Validating the PodCred framework
In order to validate the PodCred framework, we implement a basic classificationsystem that makes use of a select set of indicators from the framework, namelyindicators that are readily accessible and have promise to be discriminative. First,we discuss the process of selecting indicators from the PodCred framework andtransforming them into features to be used in the basic system. Then, we describethe experimental set up, including the data set used for the experiments, theexperimental conditions and the evaluation metric. Finally, we present and discussthe results of the validation experiments.
5.3.1 Feature engineering for predicting podcast preference
The first step in the design and implementation is to engineer the features thatwill be used to perform the classification. We are interested in predicting podcastpreference with the simplest possible system. For this reason, we chose to carryout our validation of the PodCred framework using a basic system with features

5. Podcast Preference 104
that can be extracted with a minimum of crawling or processing effort. The basicsystem excludes the content of the podcast audio from consideration and usesonly features that are accessible via a superficial crawl of the feed. We refer tothese features as “surface features.” Additionally, we are interested in investigatingwhether or not it is possible to extract useful features from podcasts without beingrequired to observe the feed over time. In other words, can useful features beextracted during a single crawl that takes a “snapshot” of the feed or must thecrawler return to the feed periodically and accumulate information about feeddevelopment from which features are extracted? We choose to look at features thatfall into two categories. We define snapshot features as features that are associatedwith the podcast feed and independent of the presence of podcast episodes andenclosures. This independence guarantees that the features can be collected with asingle crawl. We define cumulative features as features calculated from informationabout episodes and audio file enclosures that will possibly require multiple crawlsto accumulate. A summary of all features together with a short description and anindication of type is provided in Table 5.3. Below, we introduce them one by one.

105 5.3. Validating the PodCred frameworkTa
ble
5.3:
Map
ping
ofin
dica
tors
sele
cted
for
furt
her
expe
rim
enta
tion
onto
extr
acta
ble
feat
ures
.Fe
atur
esar
egr
oupe
din
tole
vels
,ac
cord
ing
tow
heth
erth
eyen
code
prop
erti
esof
the
podc
ast
asa
who
ledi
scar
ding
any
info
rmat
ion
deri
ved
from
its
epis
odes
(Sna
psho
t)or
ofit
spa
rts
(Cum
ulat
ive)
.
Feat
ure
Leve
lD
escr
ipti
onTy
pe
Indi
cato
r:Fe
edha
sa
logo
feed
has
logo
Snap
shot
Feed
has
anas
soci
ated
imag
elo
goN
omin
al
Indi
cato
r:Lo
golin
ksto
podc
ast
port
alfe
edlo
golin
kbac
kSn
apsh
otFe
edlo
golin
ksba
ckto
podc
ast
port
alN
omin
al
Indi
cato
r:Fe
ed-le
velm
etad
ata
feed
has
des
crip
tion
Snap
shot
Feed
has
ade
scri
ptio
nN
omin
alfe
edd
escr
len
gth
Snap
shot
Feed
desc
ript
ion
leng
thin
char
acte
rsIn
tege
rfe
edau
thor
sco
un
tSn
apsh
otN
umbe
rof
uniq
ueau
thor
sin
feed
Inte
ger
feed
has
copy
righ
tSn
apsh
otFe
edis
publ
ishe
dun
der
copy
righ
tN
omin
alfe
edca
tego
ries
cou
nt
Snap
shot
Num
ber
ofca
tego
ries
listi
ngth
efe
edIn
tege
rfe
edke
ywor
ds
cou
nt
Snap
shot
Num
ber
ofun
ique
keyw
ords
used
tode
-sc
ribe
the
feed
Inte
ger
Indi
cato
r:Ep
isod
e-le
velm
etad
ata
epis
od
eau
thor
sco
un
tC
umul
ativ
eN
umbe
rof
uniq
ueau
thor
sin
epis
ode
Inte
ger
epis
od
ed
escr
rati
oC
umul
ativ
ePr
opor
tion
offe
edep
isod
esw
ith
desc
rip-
tion
Rea
l
epis
od
eav
gd
escr
len
gth
Cum
ulat
ive
Avg
.len
gth
ofep
isod
ede
scri
ptio
nin
feed
Rea
lep
iso
de
titl
eh
aslin
k2p
age
Cum
ulat
ive
Num
ber
ofep
isod
esw
ith
titl
eslin
king
toan
epis
ode
page
Inte
ger
Indi
cato
r:Re
gula
rity
feed
per
iod
icit
yC
umul
ativ
eFe
edpe
riod
inda
ysR
eal
feed
per
iod
less
1wee
kC
umul
ativ
eFe
edha
sa
peri
odle
ssth
an1
wee
kN
omin
al

5. Podcast Preference 106Ta
ble
5.3:
Map
ping
ofin
dica
tors
for
furt
her
expe
rim
enta
tion
onto
extr
acta
ble
feat
ures
.Fe
atur
esar
egr
oupe
din
tole
vels
,acc
ordi
ngto
whe
ther
they
enco
depr
oper
ties
ofth
epo
dcas
tas
aw
hole
disc
ardi
ngan
yin
form
atio
nde
rive
dfr
omit
sep
isod
es(S
naps
hot)
orof
its
part
s(C
umul
ativ
e).
(con
tinu
edfr
ompr
evio
uspa
ge)
Feat
ure
Leve
lD
escr
ipti
onTy
pe
epis
od
eco
un
tC
umul
ativ
eN
umbe
rof
epis
odes
inth
efe
edIn
tege
ren
clos
ure
cou
nt
Cum
ulat
ive
Num
ber
ofen
clos
ures
inth
efe
edN
omin
alm
ore
2en
clos
ure
sC
umul
ativ
eFe
edco
ntai
ns>
2en
clos
ures
Nom
inal
encl
osu
rep
ast
2mon
thC
umul
ativ
eW
asan
epis
ode
rele
ased
inpa
st60
days
?In
tege
r
Indi
cato
r:Co
nsis
tenc
yfe
edco
her
ence
Cum
ulat
ive
Coh
eren
cesc
ore
Rea
l
Indi
cato
r:Po
dcas
tep
isod
ele
ngth
encl
osu
red
ura
tion
avg
Cum
ulat
ive
Avg.
epis
ode
dura
tion
inse
cond
s(r
epor
ted
infe
ed)
Rea
l
encl
osu
refi
lesi
zeav
gC
umul
ativ
eA
vg.e
nclo
sure
file
size
inby
tes
(rep
orte
din
feed
)R
eal

107 5.3. Validating the PodCred framework
Snapshot features
The snapshot features that we use are derived from the PodCred frameworkindicator category Technical Execution. In particular, we select the indicators thatdeal with feed-level metadata and the feed logo. The choice of feed-level metadatawas motivated by our design decision to use surface features. The use of thepresence of a logo and a logo link is also consistent with our design decision to usesurface features, but found additional motivation during the human analysis ofpodcasts. Table 5.2 shows that preferred and non-preferred podcasts show sharpdistinctions with respect to their use of logos and links that link the logo back toa homepage or a portal. We choose to encode six different facets of feed-levelmetadata, the presence of description, the length of that description, the numberof authors listed in the feed, whether or not the feed specifies a copyright, thenumber of categories listed and the number of keywords listed. These indicatorsreflect the amount of care that is invested into the production of a podcast andcan potentially capture effects above and beyond those related to indicators in theTechnical Execution category. For example, design of a logo and a linked homepageand inclusion of keywords and categories reflect effort invested in making thepodcast findable for listeners and could effectively encode indicators includedin the Podcast Context category of the PodCred framework. Recall that snapshotfeatures encode indicators that are derived from information associated with thefeed itself and not with the individual episodes or audio file enclosures. In principle,snapshot features could be extracted from a feed at the moment it debuted in thepodosphere, before it has published a significant number of episodes.
Cumulative features
The cumulative features that we use are derived from the PodCred frameworkindicator category Technical Execution, but also from Podcast Content. From theTechnical Execution category we select the indicator dealing with episode-levelmetadata. This indicator is encoded into features representing four facets, thenumber of authors reported for that episode, the proportion of episodes thatcontain an episode description, the average length of the description and thenumber of episodes containing a link to an episode page. Effectively, the episode-level metadata also encodes characteristics related to indicators in the PodcastContent category, since the number of authors potentially reflects the number ofpodcasters hosting the podcast and the description potentially reflects the lengthof the episode or its topical complexity.
From the Podcast Content category we select three indicators on which tobase feature derivation: “Podcast maintains its topical focus across episodes,”“Episodes are published regularly” and “Episodes maintain a reasonable minimal

5. Podcast Preference 108
length.” We encode the topical focus of a podcast by using its coherence score,cf. He et al. (2008), a measure that reflects the level of topical clustering of thepodcast episodes. The coherence score is calculated by determining the proportionof pairs of episodes in a podcast feed that can be considered to be related to eachother with a similarity that exceeds a certain threshold. In order to calculate thismeasure, we represent each episode with its title, description and summary, ifpresent. The coherence score is calculated automatically using lexical featuresderived from these metadata elements. By using the metadata we are able toensure that this feature remains extractable with only a surface observation ofthe podcast, i.e., there is no need for processing or analysis of the audio file.We encode the regularity with which a podcast is published with a Fast FourierTransform-based measure, which is described in further detail in (Tsagkias et al.,2009a). We also include features that are less precise in their ability to reflectregularity, but are simpler to compute. In particular, we include a feature thatrequires the release period to be less than one week, as well as features thatreflect recency and raw counts of releases. Finally, we include two features thatencode podcast episode length in different ways, one which looks at the durationof the audio file as reported in the feed and one which accesses length informationdirectly by measuring the file size of the enclosed audio episode.
In the next section we turn to a discussion of the implementation of the basicsystem that uses the extracted features derived from PodCred framework indicatorsin order to classify podcasts as to whether they are “Popular” or “Non-Popular.”
5.3.2 Experimental setup
The aim of the basic classification system that we implement is to validate thePodCred framework, i.e., to demonstrate whether or not the framework providesa sound basis on which to build a system that predicts listener preference forpodcasts. We choose to formulate the preference prediction problem as a binaryclassification problem. Given a podcast, our classifier will predict whether thispodcast is a “preferred” podcast or a “non-preferred” podcast. We concentrate oninvestigating features and combinations of features that can be used for preferenceprediction and not on developing or optimizing machine learning techniques. Inthis respect, our goals are comparable to those of Agichtein et al. (2008); Liu et al.(2008).
The podcast feeds used for the experiments were those feeds listed in each ofthe topical categories of iTunes at the time of our crawl (late August 2008). The16 topical categories in iTunes are TV and Film, Technology, Sports and Recreation,Society and Culture, Science and Medicine, Religion, News and Politics, Music, Kidsand Family, Health, Government and Organizations, Games and Hobby, Education,Comedy, Business, and Arts. For each category, we sorted the podcast feeds in

109 5.3. Validating the PodCred framework
iTunes using the column labeled “Popular.” We then gathered information from theten feeds at the top of the list and the ten feeds at the bottom list using a crawlerimplemented based on the SimplePie14 library. Feeds in non-Western languages,feeds containing video enclosures and feeds that were unreachable were discarded.Our iTunes podcast data set contains 250 podcasts feeds with a total of 9,128episodes with 9,185 audio enclosures. In total, the audio enclosures add up to∼2,760 hours of audio.
Our basic system consist of a classifier that is trained to separate the podcastfeeds that occurred in the top ten “Popular” positions from those which occurredin the bottom ten positions. The exact mechanism by which iTunes calculates“Popular” is not public knowledge,15 but we make the assumption that it is relatedto the number of downloads, and, as such, reflects user preference for certainpodcasts. Of the 250 podcasts yielded by our podcast crawl 148 are iTunes-Popularpodcasts and 102 iTunes-Non-Popular. We do not assume that the iTunes “Popular”podcasts are the ideal representation of preferred podcasts. One factor involved isthat the iTunes inventory represents only a subset of the podosphere. Althoughthis sample is extensive, presumably, it is not completely representative, but ratherbiased, most probably towards high quality podcasts. Another factor is possibleinteraction between podcast characteristics that are made salient by the iTunesinterface and user rating behavior. In particular, it is not possible to exclude theeffect that a well-designed logo tempts listeners to test and consequently to ratea podcast. The popularity ratings on iTunes are an example of a winner-take-alltype market. Salganik et al. (2006) demonstrate that success in such a marketis only partly determined by quality. Hence, by using iTunes as ground truth weare measuring the ability of our classifier to predict emergent popularity, whichis a function of the market as well as of the data. However, since we limit ourexperiments to podcasts at the extreme popular and the extreme non-popularend of the spectrum, it is relatively safe to assume that the level of popularityachieved in iTunes reflects a characteristic that goes beyond lucky ascendency in awinner-take-all type rating situation. All told, the size of our iTunes podcast dataset and the fact that it is associated with ground truth based on user behavior ina real-world application are advantages that outweigh its disadvantages for thepurposes of our validation exercise.
For our validation exercise, we choose to compare a Naive Bayes classifier,with a Support Vector Machine (SVM) classifier and two decision tree classifiers(J48, RandomForest)—a set representative of the state-of-the-art in classification.We make use of the implementations of these classifiers provided by the Wekatoolkit (Witten and Frank, 2005). We experiment with multiple classifiers in orderto confirm that our results are generally valid, i.e., not dependent on any particular
14http://simplepie.org – accessed October 28, 201215iTunes declined to comment on the algorithm.
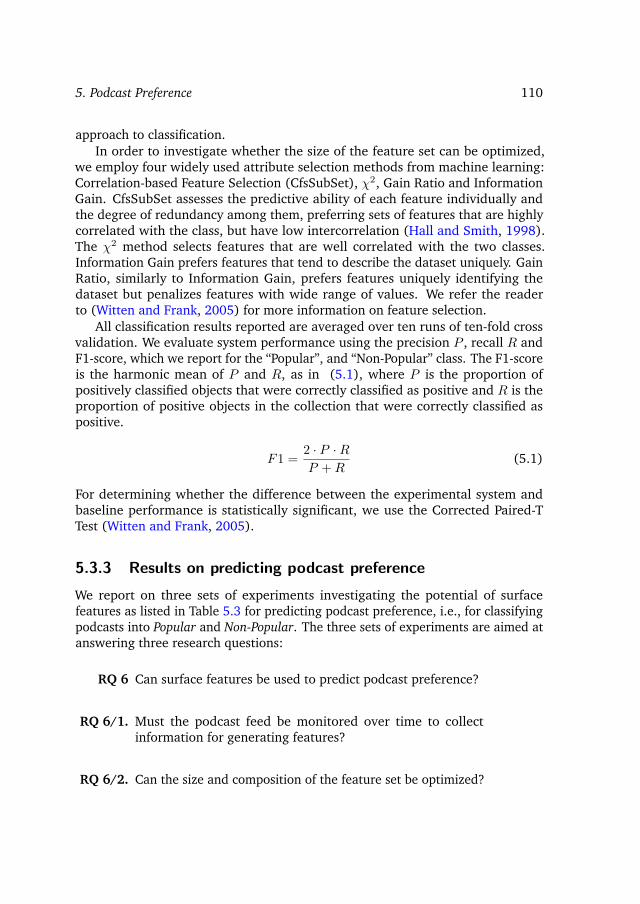
5. Podcast Preference 110
approach to classification.In order to investigate whether the size of the feature set can be optimized,
we employ four widely used attribute selection methods from machine learning:Correlation-based Feature Selection (CfsSubSet), χ2, Gain Ratio and InformationGain. CfsSubSet assesses the predictive ability of each feature individually andthe degree of redundancy among them, preferring sets of features that are highlycorrelated with the class, but have low intercorrelation (Hall and Smith, 1998).The χ2 method selects features that are well correlated with the two classes.Information Gain prefers features that tend to describe the dataset uniquely. GainRatio, similarly to Information Gain, prefers features uniquely identifying thedataset but penalizes features with wide range of values. We refer the readerto (Witten and Frank, 2005) for more information on feature selection.
All classification results reported are averaged over ten runs of ten-fold crossvalidation. We evaluate system performance using the precision P , recall R andF1-score, which we report for the “Popular”, and “Non-Popular” class. The F1-scoreis the harmonic mean of P and R, as in (5.1), where P is the proportion ofpositively classified objects that were correctly classified as positive and R is theproportion of positive objects in the collection that were correctly classified aspositive.
F1 =2 · P ·RP +R
(5.1)
For determining whether the difference between the experimental system andbaseline performance is statistically significant, we use the Corrected Paired-TTest (Witten and Frank, 2005).
5.3.3 Results on predicting podcast preference
We report on three sets of experiments investigating the potential of surfacefeatures as listed in Table 5.3 for predicting podcast preference, i.e., for classifyingpodcasts into Popular and Non-Popular. The three sets of experiments are aimed atanswering three research questions:
RQ 6 Can surface features be used to predict podcast preference?
RQ 6/1. Must the podcast feed be monitored over time to collectinformation for generating features?
RQ 6/2. Can the size and composition of the feature set be optimized?
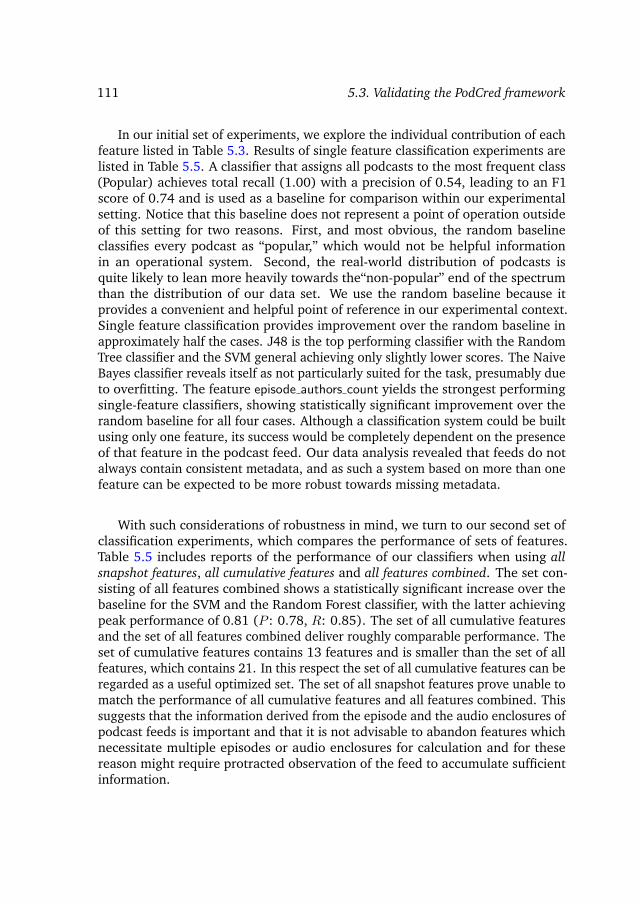
111 5.3. Validating the PodCred framework
In our initial set of experiments, we explore the individual contribution of eachfeature listed in Table 5.3. Results of single feature classification experiments arelisted in Table 5.5. A classifier that assigns all podcasts to the most frequent class(Popular) achieves total recall (1.00) with a precision of 0.54, leading to an F1score of 0.74 and is used as a baseline for comparison within our experimentalsetting. Notice that this baseline does not represent a point of operation outsideof this setting for two reasons. First, and most obvious, the random baselineclassifies every podcast as “popular,” which would not be helpful informationin an operational system. Second, the real-world distribution of podcasts isquite likely to lean more heavily towards the“non-popular” end of the spectrumthan the distribution of our data set. We use the random baseline because itprovides a convenient and helpful point of reference in our experimental context.Single feature classification provides improvement over the random baseline inapproximately half the cases. J48 is the top performing classifier with the RandomTree classifier and the SVM general achieving only slightly lower scores. The NaiveBayes classifier reveals itself as not particularly suited for the task, presumably dueto overfitting. The feature episode authors count yields the strongest performingsingle-feature classifiers, showing statistically significant improvement over therandom baseline for all four cases. Although a classification system could be builtusing only one feature, its success would be completely dependent on the presenceof that feature in the podcast feed. Our data analysis revealed that feeds do notalways contain consistent metadata, and as such a system based on more than onefeature can be expected to be more robust towards missing metadata.
With such considerations of robustness in mind, we turn to our second set ofclassification experiments, which compares the performance of sets of features.Table 5.5 includes reports of the performance of our classifiers when using allsnapshot features, all cumulative features and all features combined. The set con-sisting of all features combined shows a statistically significant increase over thebaseline for the SVM and the Random Forest classifier, with the latter achievingpeak performance of 0.81 (P : 0.78, R: 0.85). The set of all cumulative featuresand the set of all features combined deliver roughly comparable performance. Theset of cumulative features contains 13 features and is smaller than the set of allfeatures, which contains 21. In this respect the set of all cumulative features can beregarded as a useful optimized set. The set of all snapshot features prove unable tomatch the performance of all cumulative features and all features combined. Thissuggests that the information derived from the episode and the audio enclosures ofpodcast feeds is important and that it is not advisable to abandon features whichnecessitate multiple episodes or audio enclosures for calculation and for thesereason might require protracted observation of the feed to accumulate sufficientinformation.
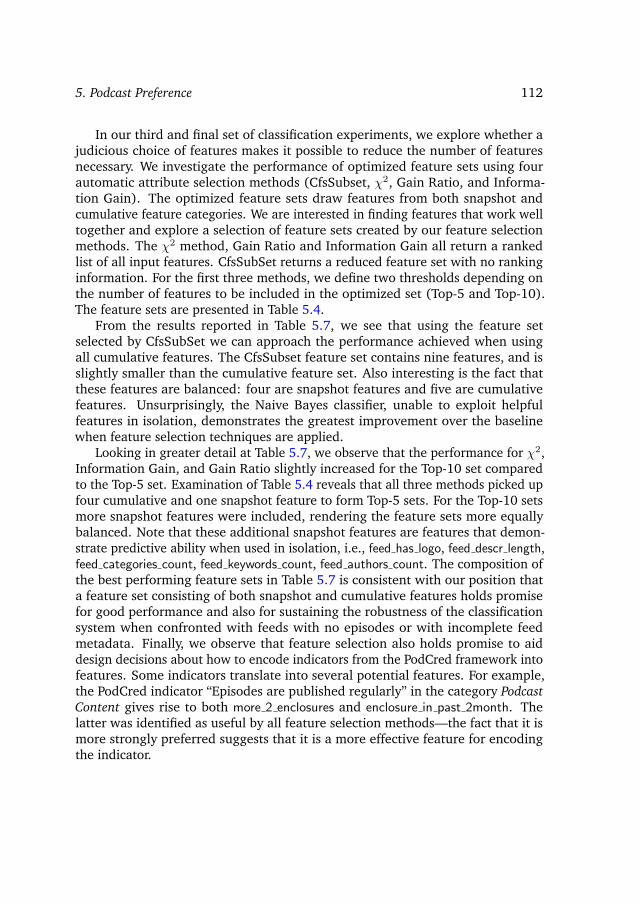
5. Podcast Preference 112
In our third and final set of classification experiments, we explore whether ajudicious choice of features makes it possible to reduce the number of featuresnecessary. We investigate the performance of optimized feature sets using fourautomatic attribute selection methods (CfsSubset, χ2, Gain Ratio, and Informa-tion Gain). The optimized feature sets draw features from both snapshot andcumulative feature categories. We are interested in finding features that work welltogether and explore a selection of feature sets created by our feature selectionmethods. The χ2 method, Gain Ratio and Information Gain all return a rankedlist of all input features. CfsSubSet returns a reduced feature set with no rankinginformation. For the first three methods, we define two thresholds depending onthe number of features to be included in the optimized set (Top-5 and Top-10).The feature sets are presented in Table 5.4.
From the results reported in Table 5.7, we see that using the feature setselected by CfsSubSet we can approach the performance achieved when usingall cumulative features. The CfsSubset feature set contains nine features, and isslightly smaller than the cumulative feature set. Also interesting is the fact thatthese features are balanced: four are snapshot features and five are cumulativefeatures. Unsurprisingly, the Naive Bayes classifier, unable to exploit helpfulfeatures in isolation, demonstrates the greatest improvement over the baselinewhen feature selection techniques are applied.
Looking in greater detail at Table 5.7, we observe that the performance for χ2,Information Gain, and Gain Ratio slightly increased for the Top-10 set comparedto the Top-5 set. Examination of Table 5.4 reveals that all three methods picked upfour cumulative and one snapshot feature to form Top-5 sets. For the Top-10 setsmore snapshot features were included, rendering the feature sets more equallybalanced. Note that these additional snapshot features are features that demon-strate predictive ability when used in isolation, i.e., feed has logo, feed descr length,feed categories count, feed keywords count, feed authors count. The composition ofthe best performing feature sets in Table 5.7 is consistent with our position thata feature set consisting of both snapshot and cumulative features holds promisefor good performance and also for sustaining the robustness of the classificationsystem when confronted with feeds with no episodes or with incomplete feedmetadata. Finally, we observe that feature selection also holds promise to aiddesign decisions about how to encode indicators from the PodCred framework intofeatures. Some indicators translate into several potential features. For example,the PodCred indicator “Episodes are published regularly” in the category PodcastContent gives rise to both more 2 enclosures and enclosure in past 2month. Thelatter was identified as useful by all feature selection methods—the fact that it ismore strongly preferred suggests that it is a more effective feature for encodingthe indicator.

113 5.3. Validating the PodCred framework
Table 5.4: Feature sets derived by applying CfsSubset, χ2, Gain Ratio, and In-formation Gain attribute selection methods. CfsSubset returns a list of selectedattributes (?). The other methods return all attributes in descending order by theirscore. The score is generated by the attribute selection method and is proportionalto the importance of the attribute. For χ2, Gain Ratio, and Information Gain, twosets were created: one with the Top-5 (◦), and an extended one including theTop-10 (•) attributes.
Feature TypeCfs- χ2 Gain Inf.
Subset Ratio Ratio
feed has logo Snapshot ? • ◦ •feed descr length Snapshot ? • • •feed authors count Snapshot • •feed categories count Snapshot ? ◦ • ◦feed keywords count Snapshot ? • • •episode authors count Cumulative ? ◦ ◦ •episode title has link2page Cumulative ? • ◦feed period less1week Cumulative •episode count Cumulative ? ◦ ◦ ◦enclosure count Cumulative ? ◦ ◦ ◦more 2 enclosures Cumulative •enclosure past 2month Cumulative ? ◦ ◦ ◦

5. Podcast Preference 114Ta
ble
5.5:
F1,p
reci
sion
and
reca
llof
the
posi
tive
clas
sfo
rN
aive
Baye
s,Su
ppor
tVe
ctor
Mac
hine
(SV
M),
and
tree
clas
sifie
rs(J
48,
and
Ran
dom
Fore
st)
usin
ga
sing
lefe
atur
e,sn
apsh
otan
dcu
mul
ativ
efe
atur
es,a
ndal
lfea
ture
s.B
oldf
ace
indi
cate
sim
prov
emen
tov
erba
selin
e.St
atis
tica
llysi
gnifi
cant
impr
ovem
ent
(↑)
orlo
ss(↓
)ov
erth
eba
selin
eis
also
repo
rted
.
Feat
ure
Nai
veB
ayes
SVM
J48
Ran
dom
Fore
stP
RF1
PR
F1P
RF1
PR
F1
Bas
elin
eP:
0.59
/R:1
.00/
F1:
0.74
Type
:Sn
apsh
otfe
edh
aslo
go
0.66↑
0.96↓
0.78↑
0.66↑
0.96↓
0.78↑
0.66↑
0.96↓
0.78↑
0.66↑
0.96↓
0.78↑
feed
log
olin
kbac
k0.
580.
910.
700.
590.
970.
730.
591.
000.
740.
590.
870.
69fe
edh
asd
escr
ipti
on
0.60
0.97↓
0.74
0.59
0.97↓
0.73
0.59
0.97↓
0.73
0.60
0.97↓
0.74
feed
des
crle
ng
th0.
700.
39↓
0.48↓
0.59
1.00
0.74
0.65↑
0.91↓
0.76
0.65↑
0.64↓
0.64↓
feed
cate
gor
ies
cou
nt
0.84↑
0.25↓
0.37↓
0.59
1.00
0.74
0.67↑
0.93↑
0.78↑
0.67↑
0.83↑
0.74
feed
keyw
ord
sco
un
t0.
86↑
0.20↓
0.31↓
0.59
1.00
0.74
0.72↑
0.80↓
0.75
0.70↑
0.64↓
0.67↓
feed
has
copy
rig
ht
0.64↑
0.84↓
0.73
0.64↑
0.84↓
0.73
0.64↑
0.84↓
0.73
0.64↑
0.84↓
0.73
feed
auth
ors
cou
nt
0.59
0.98
0.74
0.59
1.00
0.74
0.64↑
0.97↓
0.77↑
0.63↑
0.96
0.76
All
snap
shot
feat
ure
s0.
85↑
0.34↓
0.47↓
0.66↑
0.96↓
0.78↑
0.71↑
0.72↓
0.71
0.71↑
0.80↓
0.75
Type
:Cu
mul
ativ
efe
edp
erio
dic
ity
0.39↓
0.28↓
0.30↓
0.59
1.00
0.74
0.59
1.00
0.74
0.59
0.75↓
0.66↓
feed
per
iod
less
1w
eek
0.70↑
0.71↓
0.70
0.70↑
0.71↓
0.70
0.70↑
0.71↓
0.70
0.70↑
0.71↓
0.70
feed
coh
eren
ce0.
590.
89↓
0.71
0.59
1.00
0.74
0.59
1.00
0.74
0.58
0.82↓
0.68↓
epis
od
ed
escr
rati
o0.
600.
980.
740.
580.
960.
720.
590.
980.
740.
590.
96↓
0.74
epis
od
eav
gd
escr
len
gth
0.60
0.28↓
0.35↓
0.59
1.00
0.74
0.58
0.92
0.71
0.61
0.61↓
0.60↓
epis
od
eti
tle
has
link2
pag
e0.
780.
14↓
0.22↓
0.59
1.00
0.74
0.68↑
0.81↓
0.73
0.69↑
0.85↓
0.76
epis
od
eco
un
t0.
92↑
0.28↓
0.42↓
0.59
1.00
0.74
0.78↑
0.80↓
0.79
0.79↑
0.73↓
0.75
epis
od
eau
thor
sco
un
t0.
67↑
0.95↓
0.78↑
0.67↑
0.95↓
0.79↑
0.67↑
0.95↓
0.79↑
0.67↑
0.95↓
0.79↑
encl
osu
reco
un
t0.
91↑
0.27↓
0.41↓
0.59
1.00
0.74
0.79↑
0.79↓
0.78
0.78↑
0.74↓
0.76
mor
e2
encl
osu
res
0.64↑
0.94↓
0.76
0.64↑
0.94↓
0.76
0.64↑
0.94↓
0.76
0.64↑
0.94↓
0.76
encl
osu
rep
ast
2m
on
th0.
89↑
0.56↓
0.68
0.89↑
0.56↓
0.68
0.89↑
0.56↓
0.68
0.89↑
0.56↓
0.68
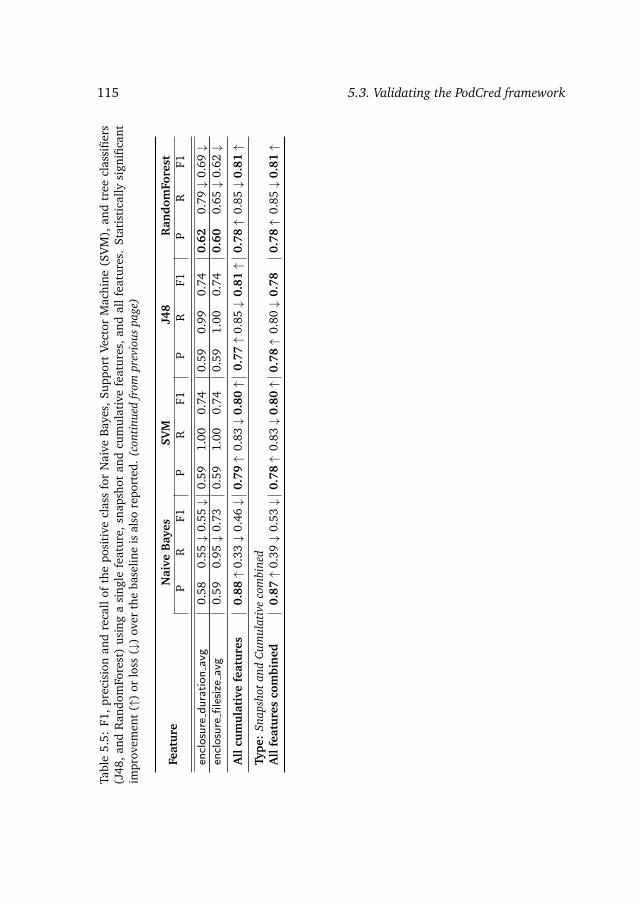
115 5.3. Validating the PodCred frameworkTa
ble
5.5:
F1,
prec
isio
nan
dre
call
ofth
epo
siti
vecl
ass
for
Nai
veB
ayes
,Su
ppor
tVe
ctor
Mac
hine
(SV
M),
and
tree
clas
sifie
rs(J
48,
and
Ran
dom
Fore
st)
usin
ga
sing
lefe
atur
e,sn
apsh
otan
dcu
mul
ativ
efe
atur
es,
and
all
feat
ures
.St
atis
tica
llysi
gnifi
cant
impr
ovem
ent
(↑)
orlo
ss(↓
)ov
erth
eba
selin
eis
also
repo
rted
.(c
onti
nued
from
prev
ious
page
)
Feat
ure
Nai
veB
ayes
SVM
J48
Ran
dom
Fore
stP
RF1
PR
F1P
RF1
PR
F1
encl
osu
red
ura
tio
nav
g0.
580.
55↓
0.55↓
0.59
1.00
0.74
0.59
0.99
0.74
0.62
0.79↓
0.69↓
encl
osu
refi
lesi
zeav
g0.
590.
95↓
0.73
0.59
1.00
0.74
0.59
1.00
0.74
0.60
0.65↓
0.62↓
All
cum
ula
tive
feat
ure
s0.
88↑
0.33↓
0.46↓
0.79↑
0.83↓
0.80↑
0.77↑
0.85↓
0.81↑
0.78↑
0.85↓
0.81↑
Type
:Sn
apsh
otan
dCu
mul
ativ
eco
mbi
ned
All
feat
ure
sco
mbi
ned
0.87↑
0.39↓
0.53↓
0.78↑
0.83↓
0.80↑
0.78↑
0.80↓
0.78
0.78↑
0.85↓
0.81↑

5. Podcast Preference 116Ta
ble
5.6:
F1,p
reci
sion
and
reca
llof
the
nega
tive
clas
sfo
rN
aive
Bay
es,S
uppo
rtVe
ctor
Mac
hine
(SV
M),
and
tree
clas
sifie
rs(J
48,
and
Ran
dom
Fore
st)
usin
ga
sing
lefe
atur
e,sn
apsh
otan
dcu
mul
ativ
efe
atur
es,
and
all
feat
ures
.B
asel
ine
for
nega
tive
clas
sre
port
sP:
0.00
,R:0
.00,
F1:0
.00.
Feat
ure
Nai
veB
ayes
SVM
J48
Ran
dom
Fore
stP
RF1
PR
F1P
RF1
PR
F1
Type
:Sn
apsh
otfe
edh
aslo
go0.
830.
280.
410.
830.
280.
410.
830.
280.
410.
830.
280.
41fe
edlo
golin
kbac
k0.
060.
080.
070.
020.
020.
020.
000.
000.
000.
120.
140.
13fe
edh
asd
escr
ipti
on0.
350.
050.
080.
100.
020.
030.
100.
020.
030.
390.
060.
10fe
edd
escr
len
gth
0.46
0.75
0.57
0.00
0.00
0.00
0.69
0.28
0.38
0.50
0.50
0.49
feed
cate
gori
esco
un
t0.
460.
920.
610.
000.
000.
000.
770.
330.
460.
640.
410.
49fe
edke
ywor
ds
cou
nt
0.45
0.96
0.61
0.00
0.00
0.00
0.67
0.53
0.58
0.55
0.60
0.56
feed
has
copy
righ
t0.
570.
300.
390.
570.
300.
390.
570.
300.
390.
570.
300.
39fe
edau
thor
sco
un
t0.
160.
020.
030.
000.
000.
000.
760.
190.
290.
710.
190.
29
All
snap
shot
feat
ure
s0.
490.
900.
630.
830.
280.
410.
580.
540.
550.
650.
510.
56
Type
:Cu
mul
ativ
efe
edp
erio
dic
ity
0.28
0.46
0.34
0.00
0.00
0.00
0.00
0.00
0.00
0.41
0.25
0.30
feed
per
iod
less
1wee
k0.
570.
560.
560.
570.
560.
560.
570.
560.
560.
570.
560.
56fe
edco
her
ence
0.39
0.10
0.16
0.00
0.00
0.00
0.00
0.00
0.00
0.35
0.14
0.20
epis
od
ed
escr
rati
o0.
350.
040.
070.
060.
040.
040.
030.
000.
010.
320.
040.
07ep
iso
de
avg
des
crle
ngt
h0.
400.
740.
510.
000.
000.
000.
120.
050.
070.
430.
430.
43ep
iso
de
titl
eh
aslin
k2p
age
0.43
0.97
0.60
0.00
0.00
0.00
0.63
0.42
0.49
0.68
0.44
0.52
epis
od
eco
un
t0.
480.
970.
640.
000.
000.
000.
710.
660.
670.
650.
700.
67ep
iso
de
auth
ors
cou
nt
0.83
0.32
0.45
0.85
0.32
0.45
0.85
0.32
0.45
0.85
0.32
0.45
encl
osu
reco
un
t0.
480.
970.
640.
000.
000.
000.
700.
680.
680.
660.
680.
66m
ore
2en
clos
ure
s0.
710.
240.
340.
710.
240.
340.
710.
240.
340.
710.
240.
34

117 5.3. Validating the PodCred frameworkTa
ble
5.6:
F1,p
reci
sion
and
reca
llof
the
nega
tive
clas
sfo
rN
aive
Bay
es,S
uppo
rtVe
ctor
Mac
hine
(SV
M),
and
tree
clas
sifie
rs(J
48,
and
Ran
dom
Fore
st)
usin
ga
sing
lefe
atur
e,sn
apsh
otan
dcu
mul
ativ
efe
atur
es,
and
all
feat
ures
.B
asel
ine
for
nega
tive
clas
sre
port
sP:
0.00
,R:0
.00,
F1:0
.00.
(con
tinu
edfr
ompr
evio
uspa
ge)
Feat
ure
Nai
veB
ayes
SVM
J48
Ran
dom
Fore
stP
RF1
PR
F1P
RF1
PR
F1
encl
osu
rep
ast
2mon
th0.
590.
890.
710.
590.
890.
710.
590.
890.
710.
590.
890.
71en
clos
ure
du
rati
onav
g0.
360.
430.
390.
000.
000.
000.
000.
000.
000.
490.
290.
35en
clos
ure
file
size
avg
0.23
0.04
0.06
0.00
0.00
0.00
0.00
0.00
0.00
0.43
0.37
0.39
All
cum
ula
tive
feat
ure
s0.
490.
930.
640.
740.
660.
690.
750.
630.
680.
760.
640.
69
Type
:Sn
apsh
otan
dCu
mul
ativ
eco
mbi
ned
All
feat
ure
sco
mbi
ned
0.51
0.91
0.65
0.73
0.64
0.67
0.70
0.66
0.67
0.76
0.64
0.69

5. Podcast Preference 118Ta
ble
5.7:
F1,p
reci
sion
and
reca
llof
the
posi
tive
clas
sfo
rN
aive
Bay
es,S
uppo
rtVe
ctor
Mac
hine
(SM
O),
and
tree
clas
sifie
rs(J
48,a
ndR
ando
mFo
rest
)af
ter
attr
ibut
ese
lect
ion
usin
gCf
sSub
set,χ
2,G
ain
Rati
o,an
dIn
form
atio
nG
ain
(IG
).Bo
ldfa
cein
dica
tes
impr
ovem
ent
inpe
rfor
man
cefo
rth
ere
spec
tive
clas
sifie
rco
mpa
red
toC
umul
ativ
efe
atur
es.
Stat
isti
cally
sign
ifica
ntim
prov
emen
t(↑
)or
loss
(↓)
over
the
base
line
are
also
show
n.
Feat
ure
Nai
veB
ayes
SVM
J48
Ran
dom
Fore
stP
RF1
PR
F1P
RF1
PR
F1
Bas
elin
eP:
0.59
/R:1
.00/
F1:
0.74
Snap
shot
feat
ures
0.85↑
0.34↓
0.47↓
0.66↑
0.96↓
0.78↑
0.71↑
0.72↓
0.71
0.71↑
0.80↓
0.75
Cum
ulat
ive
feat
ures
0.88↑
0.33↓
0.46↓
0.79↑
0.83↓
0.80↑
0.77↑
0.85↓
0.81↑
0.78↑
0.85↓
0.81↑
All
feat
ures
0.87↑
0.39↓
0.53↓
0.78↑
0.83↓
0.80↑
0.78↑
0.80↓
0.78
0.78↑
0.85↓
0.81↑
Cfs
Subs
et0.
89↑
0.36↓
0.50↓
0.75↑
0.83↓
0.77
0.80↑
0.78↓
0.78
0.78↑
0.84↓
0.80↑
χ2
–To
p5
0.89↑
0.34↓
0.48↓
0.84↑
0.65↓
0.71
0.79↑
0.77↓
0.77
0.74↑
0.81↓
0.77
χ2
–To
p10
0.89↑
0.36↓
0.51↓
0.75↑
0.84↓
0.78
0.80↑
0.78↓
0.78
0.77↑
0.84↓
0.80↑
Gai
nR
atio
–To
p5
0.92↑
0.36↓
0.50↓
0.72↑
0.90↓
0.78
0.80↑
0.78↓
0.79
0.78↑
0.78↓
0.77
Gai
nR
atio
–To
p10
0.89↑
0.38↓
0.53↓
0.75↑
0.82↓
0.77
0.79↑
0.78↓
0.78
0.77↑
0.83↓
0.80↑
IG–
Top
50.
91↑
0.31↓
0.45↓
0.89↑
0.59↓
0.70
0.79↑
0.82↓
0.80↑
0.75↑
0.79↓
0.76
IG–
Top
100.
89↑
0.36↓
0.51↓
0.75↑
0.83↓
0.77
0.79↑
0.76↓
0.77
0.77↑
0.84↓
0.80↑
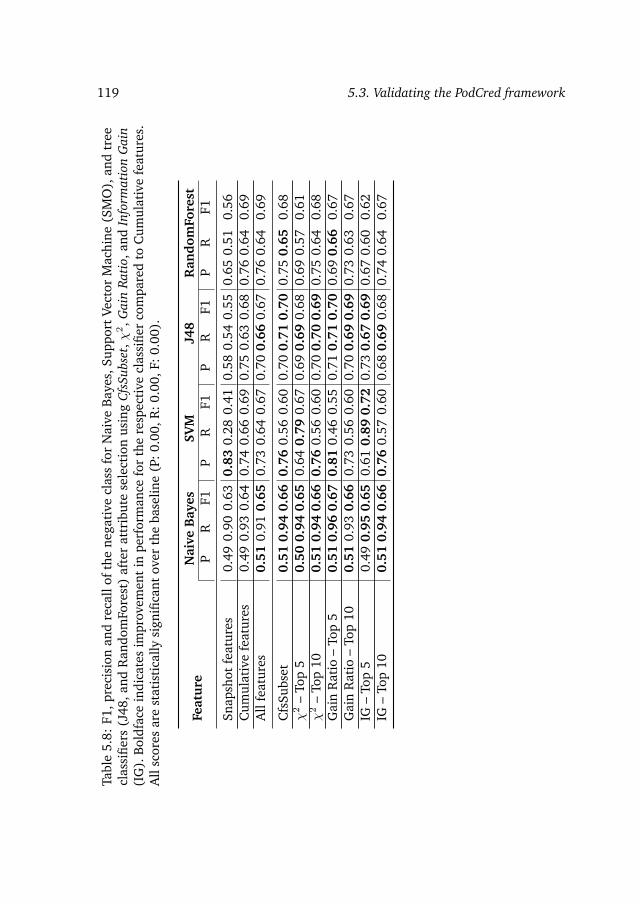
119 5.3. Validating the PodCred frameworkTa
ble
5.8:
F1,p
reci
sion
and
reca
llof
the
nega
tive
clas
sfo
rN
aive
Bay
es,S
uppo
rtVe
ctor
Mac
hine
(SM
O),
and
tree
clas
sifie
rs(J
48,a
ndR
ando
mFo
rest
)af
ter
attr
ibut
ese
lect
ion
usin
gCf
sSub
set,χ
2,G
ain
Rati
o,an
dIn
form
atio
nG
ain
(IG
).Bo
ldfa
cein
dica
tes
impr
ovem
ent
inpe
rfor
man
cefo
rth
ere
spec
tive
clas
sifie
rco
mpa
red
toC
umul
ativ
efe
atur
es.
All
scor
esar
est
atis
tica
llysi
gnifi
cant
over
the
base
line
(P:0
.00,
R:0
.00,
F:0.
00).
Feat
ure
Nai
veB
ayes
SVM
J48
Ran
dom
Fore
stP
RF1
PR
F1P
RF1
PR
F1
Snap
shot
feat
ures
0.49
0.90
0.63
0.83
0.28
0.41
0.58
0.54
0.55
0.65
0.51
0.56
Cum
ulat
ive
feat
ures
0.49
0.93
0.64
0.74
0.66
0.69
0.75
0.63
0.68
0.76
0.64
0.69
All
feat
ures
0.51
0.91
0.65
0.73
0.64
0.67
0.70
0.66
0.67
0.76
0.64
0.69
Cfs
Subs
et0.
510.
940.
660.
760.
560.
600.
700.
710.
700.
750.
650.
68χ
2–
Top
50.
500.
940.
650.
640.
790.
670.
690.
690.
680.
690.
570.
61χ
2–
Top
100.
510.
940.
660.
760.
560.
600.
700.
700.
690.
750.
640.
68G
ain
Rat
io–
Top
50.
510.
960.
670.
810.
460.
550.
710.
710.
700.
690.
660.
67G
ain
Rat
io–
Top
100.
510.
930.
660.
730.
560.
600.
700.
690.
690.
730.
630.
67IG
–To
p5
0.49
0.95
0.65
0.61
0.89
0.72
0.73
0.67
0.69
0.67
0.60
0.62
IG–
Top
100.
510.
940.
660.
760.
570.
600.
680.
690.
680.
740.
640.
67

5. Podcast Preference 120
5.4 Real-world application of the PodCred framework
We have seen that the PodCred framework provides a basis upon which to builda classification system capable of predicting podcast preference. In this section,we report on an exploratory investigation carried out in a real-world setting. Thegoal of this investigation is to allow us to form an impression of how a preferencepredictor based on the PodCred framework would behave outside of the laboratoryand to gain an initial idea of the robustness of the PodCred framework in handlingpodcasts belonging to different genre categories.
We implemented a demonstrator that generates a preference prediction for anyarbitrary podcast presented to it. The demonstrator, called podTeller,16 acceptsa URL of a podcast feed and returns a score that reflects the probability that thepodcast will become popular within iTunes. Underneath the hood of podTeller isone of the configurations that emerged as a top performer during our validationexperiment, namely a RandomForest classifier using the optimized CfsSubsetfeature set (cf. Section 5.3.3). The classifier is trained on the entire data set,namely all 250 podcasts that we collected from iTunes.
For our exploratory investigation, we needed a set of podcasts occurring “inthe wild,” i.e., outside of the iTunes settings, and another source to identify asmall set of podcasts that we could assume were popular among listeners. Wechose to turn again to the winners of the People’s Choice PodCast Awards, which,as previously mentioned, are selected annually by popular vote. For the humananalysis of podcasts discussed in Section 5.2.3 the winners from 2007 were used.Our exploratory investigation uses the winners from 2008. These two sets are notmutually exclusive, meaning that we cannot claim complete independence of thedesign of the PodCred framework and specific characteristics of these podcasts.However, the difference between the two sets was deemed large enough for thepurpose of exploration of the behavior of the preference predictor implemented inpodTeller.
Results of the investigation are reported in Table 5.9. The table includes thenames of the podcasts, the genre category17 in which they won, and the predictionof the podTeller system. A podcast is given a positive prediction if the positiveclass confidence score is larger than the negative class confidence score. The tablereports the predicted class for each podcast the confidence score of that class.Since a podcast must receive a large number of listener votes in order to receive anaward, we expect that our system should classify award winning podcasts into thepositive class. In Table 5.9, it can be seen that the system predictions are largelyconsistent with our expectations. In order to gain an impression of the possibleimpact of genre on prediction results, we gather podcasts into two groups based on
16http://zookma.science.uva.nl/podteller – accessed October 28, 201217Genre categories with video podcast winners are excluded.

121 5.4. Real-world application of the PodCred framework
their content and genre. One group, marked factual in Table 5.9 contains podcaststhat appear to be more information oriented and the other, marked entertainment,contains podcasts that appear to be amusement oriented. Note that the predictivebehavior of our classifier does not differ radically for the two categories. Thispredictive stability suggests that a classifier implemented using features derivedfrom indicators in the PodCred framework does not suffer from an unwanteddependence on the topic or genre category of the podcast.
Although predictions on factual and entertainment podcast are apparentlyquite comparable, the results in Table 5.9 could be interpreted as suggesting thatour classifier makes less reliable predictions for entertainment than for factualpodcasts. Both of the podcasts that are incorrectly classified, “The Signal” and“Distorted View,” are entertainment podcasts. Moreover, on average, the confidencescores for entertainment podcasts are lower than those of factual podcasts (0.7 vs.0.8). Since the set of podcasts involved in this experiment is limited, we wantto avoid drawing any hard and fast conclusions from this apparent imbalance.However, this asymmetry does indicate that the difference between entertainmentand factual podcasts may be an interesting area for future investigation. Closerexamination of the two misclassified entertainment podcasts reveals that both ofthese podcasts have feeds in which the metadata is quite spartan, for example, theirfeed descriptions are rather short and they are not published using a large numberof category labels. Lack of detailed metadata may, in these cases, be consistentwith the specific community building strategies of these podcasts. “The Signal” isrelated to “Firefly” a short-lived TV series with a cult status and “Distorted View”contains mature content. It is not unimaginable that these podcasts build theirfollowing by way of “word of mouth” and that this strategy is part of the definingimage they cultivate. Such a strategy would be less effective for podcasts in thefactual category who have informational content to offer and whose followingmight depend on their visibility to viewers via search engines that need detailedmetadata for effective indexing. Further investigation is necessary to determine ifsuch a strategy is characteristic of podcasts that fall into the entertainment ratherthan the factual category. If podcasts created for entertainment purposes areindeed frequently crafted without readily evident indicators of their characteristicsor content, it is clear that it will be necessary to include more features derivedfrom indicators from the Podcast Content category of the PodCred framework inorder for the classifier to correctly predict their popularity among listeners. In sum,a classifier built using indicators from the PodCred framework and training datadrawn from iTunes demonstrates prediction behavior consistent with expectationwhen moved beyond the iTunes setting.
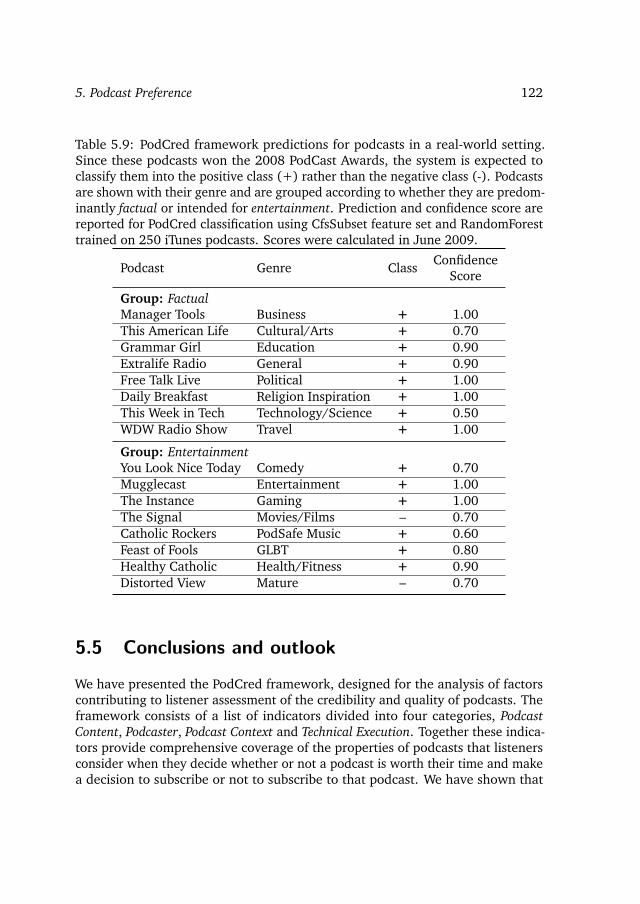
5. Podcast Preference 122
Table 5.9: PodCred framework predictions for podcasts in a real-world setting.Since these podcasts won the 2008 PodCast Awards, the system is expected toclassify them into the positive class (+) rather than the negative class (-). Podcastsare shown with their genre and are grouped according to whether they are predom-inantly factual or intended for entertainment. Prediction and confidence score arereported for PodCred classification using CfsSubset feature set and RandomForesttrained on 250 iTunes podcasts. Scores were calculated in June 2009.
Podcast Genre ClassConfidence
Score
Group: FactualManager Tools Business + 1.00This American Life Cultural/Arts + 0.70Grammar Girl Education + 0.90Extralife Radio General + 0.90Free Talk Live Political + 1.00Daily Breakfast Religion Inspiration + 1.00This Week in Tech Technology/Science + 0.50WDW Radio Show Travel + 1.00
Group: EntertainmentYou Look Nice Today Comedy + 0.70Mugglecast Entertainment + 1.00The Instance Gaming + 1.00The Signal Movies/Films – 0.70Catholic Rockers PodSafe Music + 0.60Feast of Fools GLBT + 0.80Healthy Catholic Health/Fitness + 0.90Distorted View Mature – 0.70
5.5 Conclusions and outlook
We have presented the PodCred framework, designed for the analysis of factorscontributing to listener assessment of the credibility and quality of podcasts. Theframework consists of a list of indicators divided into four categories, PodcastContent, Podcaster, Podcast Context and Technical Execution. Together these indica-tors provide comprehensive coverage of the properties of podcasts that listenersconsider when they decide whether or not a podcast is worth their time and makea decision to subscribe or not to subscribe to that podcast. We have shown that

123 5.5. Conclusions and outlook
the PodCred framework provides a viable basis for the prediction of podcast pref-erence by carrying out validation experiments using a basic classification systemand a data set collected from iTunes. The experimental system was implementedusing surface features that are easily extracted from podcasts. The results of theexperiments answer the research questions raised in Section 5.3.3:
RQ 6 Can surface features be used to predict podcast preference?
Surface features can be successfully exploited to predict pod-cast preference, making it possible to avoid deeper processing,e.g., computationally expensive analysis of the podcast audiofile.
RQ 6/1. Must the podcast feed be monitored over time to collectinformation for generating features?
Podcast preference can be predicted using “snapshot” infor-mation derived from a single crawl of the feed, however, “cu-mulative” information requiring repeated visits of the crawleralso makes an important contribution.
RQ 6/2. Can the size and composition of the feature set be optimized?Yes, the best feature sets consists of a combination of feed-level and episode and enclosure-level features.
An exploratory investigation of data beyond the iTunes data set suggested thatour basic classification system is capable of achieving robust performance outsideof the laboratory and that this performance does not show signs of unduly largedependencies of classification accuracy on podcast content or genre. In total, theresults of our experimentation and investigation speak strongly for the generalapplicability of the PodCred framework.
Future work will pursue the issue opened by our exploratory investigation ofreal-world application of the PodCred framework, namely the external dependen-cies that impact preference prediction (cf. Section 5.4). In particular, we observedbehavior suggesting that the basic stability of classification across genre-basedpodcast groups may be subject to genre-based fluctuation. Perhaps, the most usefulapproach is to isolate the model of user assessment of credibility and quality onlypartially from factors such as topic and genre. In the literature on credibility and

5. Podcast Preference 124
quality, there are multiple acknowledgments of topic and genre dependencies inusers’ credibility perceptions. Rieh and Belkin (1998) note that it is essential torecognize the relationship between how users assess content and the informationalproblem they are facing. For example, medical information will be assessed ina different way from information about the personal lives of movie stars. In theformer case, the information is used to make a potentially life-critical decisionand in the latter case the user does not take any particular action as a result ofthe information. Metzger et al. (2003) observed that factual information is morerigorously checked than entertainment information. Ghinea and Thomas (2005)report that for multimedia that is educational in purpose, perceived quality doesnot vary widely with transmission quality. Beyond educational material, othergenres do not share this stability. Future applications of the PodCred frameworkfor the purpose of preference prediction should attempt to address the differentways in which users assess topic and genre. An adapted PodCred-based classi-fier could potentially avoid topic-related issues that presented a challenged forour basic classification system. For example, we observed that iTunes-Popularpodcasts include examples of podcasts no longer currently publishing, but whosetopic is timeless so that they do not go out of date. We observed that our basicclassification system misclassified a podcast of the how-to genre on the subject ofknitting which was popular, but had no recent episodes. This example supports theperspective that recency of publication may be an important indicator of popularityfor some genres, but for other genres that it is inappropriate and suggests that anappropriate extension of the basic classification system might serve to cover it.
In the next chapter, we turn to a “semi-open” environment, and a different typeof content: comments on online news articles. The link between what we studiedso far, and what we will study next is what attracts user preference. We foundthat there exist highly popular and highly unpopular podcasts, and we identifiedcharacteristics that can predict their popularity. Similarly, there are news articlesthat attract a large number of comments, while others attract none. What is thecommenting behavior of users on online news? Does the commenting behaviorchange among news agents? And, can we predict the volume of comments ofa news article? This kind of questions motivate the work presented in the nextchapter.

6Commenting Behavior
on Online News
In this chapter we continue our study on predicting behavior. Previously, welooked at indicators that attract people’s preference in “closed” environments suchas iTunes. Here, we move on to “semi-open” environments such as online newsagents and study the commenting behavior of readers on online news articles. Thistype of environment is accessible via a web browser, however, it may require userregistration for accessing community and sharing facilities.
Online news agents provide commenting facilities for their readers to expresstheir opinions, feelings, or beliefs with regards to news stories. The number ofuser supplied comments on a news article may be indicative of its importance,interestingness, or impact. Reader demographics affect readers’ interests andcommenting behavior, shaping the volume and the distribution of comments overthe available news.
This chapter has three parts. In the first part, we explore the news commentsspace, identify patterns in commenting behavior in seven Dutch news agents,and news collaborative platform, and model this behavior using two statisticaldistributions. In the second part, we apply these findings on predicting thecomment volume a news article will generate before it is published. In the thirdpart, we look at predicting the comment volume of a news article after observingthe increase in volume shortly after the article is published. Our work on newscomment prediction is useful for identifying news stories with the potential to bediscussed, and can be used to support front page and advertisement optimizationfor news sites, or news filtering for end users.
125
6. Commenting Behavior on Online News 126
6.1 Introduction
We increasingly live our lives online, generating huge amounts of content stored innew data types. These new types, like blogs, discussion forums, mailing lists, com-menting facilities, and wikis can be mined for valuable knowledge. For instance,online chatter can be used to predict sales ranks of books (Gruhl et al., 2005),mood levels can be predicted based on language and circadian patterns (Mishneand de Rijke, 2006a), and information seeker satisfaction in community questionanswering can be modeled using content, structure, and community features (Liuet al., 2008).
Against this general background, online news is an especially interesting datatype for mining and analysis purposes. Much of what goes on in social media is aresponse to or comment on news events, reflected by the large amount of news-related queries users ask to blog search engines (Mishne and de Rijke, 2006b).Tracking news events and their impact as reflected in social media has become animportant activity of media analysts (Altheide, 1996) and there is a growing bodyof research on developing algorithms and tools to support this type of analysis (seeSection 2.5). In this chapter, we focus on online news articles plus the commentsthey generate, and attempt to uncover the factors underlying the commentingbehavior on these news articles. We explore the dynamics of user generatedcomments on news articles, and undertake the challenge to model and predictnews article comment volume prior to, and after publication time.
To make things more tangible, consider the following striking example ofunexpected commenting behavior in response to news stories: March 13, 2009, abusy day for one of the biggest news papers in the Netherlands, De Telegraaf. Inless than 24 hours, more than 1,500 people commented on De Telegraaf ’s articleregarding the latest governmental policy on child benefit abuse. One month later,the Dutch news reported a potential pandemic swine flu, first located in Mexico,but less than five hundred comments were posted to related articles across differentnews sites, even one week after the first announcement. Given that both newsevents are important to the Dutch society, their numbers of comments differ greatly.What makes that the first story receive over three times as many comments as thesecond? What are the factors contributing to the impact of a news story?
Let us take a step back and ask why we should be interested in commenting be-havior and the factors contributing to it in the first place? We envisage three typesof applications for predicting comment volume, each from a different perspective:First, in media and reputation analysis one should be able to quickly respond tostories that “take off”; predicting the comment volume might help in determiningthe desirability of the article (e.g., regarding the influence on one’s reputation) orthe timing of the publication (e.g., generate publicity and discussion in electiontime). Second, pricing of news articles by news agencies and ad placement strategies

127 6.1. Introduction
by news publishers could be dependent on the comment volume; articles that aremore likely to generate a large volume of comments could be priced higher by theagencies, and news publishers of online news could adjust their advertisementprices according to expected comment volume. Finally, news consumers could beserved only the news articles that are most likely to generate many comments.This gives news sources new ways of providing service to their customers andcould save consumers time in identifying “important” news articles.
To come to these applications and answer the questions raised by the example,we need more insight in comments and commenting behavior on online newsarticles. Our aim is to gain this insight, and use these insights to predict commentvolume of news articles prior to, or after, publication. To this end, we seek answersto the following questions:
RQ 7. Do patterns of news commenting behavior exist? And if theydo, how can they be used for predicting how much attentiona news article will attract?
RQ 7/1. Can we fit a distribution model on the volume of news com-ments?
RQ 8. Among textual, semantic, and real-world sets of features, andtheir combination, which leads to the best prediction accuracyfor prior to publication prediction of volume of comments?
RQ 9. Does the correlation between number of responses at earlytime and at later time found in social media such as Diggand Youtube hold for news comments? I.e., are patterns foronline responses potentially “universal”? And can we use thisto predict the number of comments an article will receive,having seen an initial number?
The work in this chapter makes several contributions. First, it explores the dy-namics of user generated comments in on-line Dutch media. Second, it providesa model for news comment distribution based on data analysis from eight newssources. Third, it introduces, and tackles the problem of predicting the commentvolume of a news article prior to and after publication.
The remainder of the chapter is organized as follows. We describe the dataset, and explore the news comments space in Section 6.2, we explore processesthat can model comment volume in Section 6.3, we develop, evaluate, and discuss
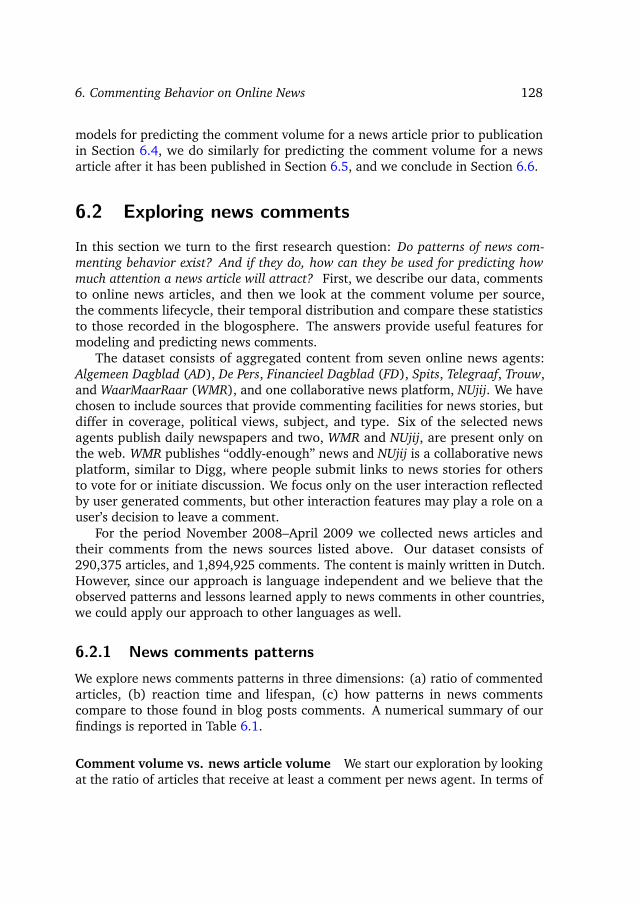
6. Commenting Behavior on Online News 128
models for predicting the comment volume for a news article prior to publicationin Section 6.4, we do similarly for predicting the comment volume for a newsarticle after it has been published in Section 6.5, and we conclude in Section 6.6.
6.2 Exploring news comments
In this section we turn to the first research question: Do patterns of news com-menting behavior exist? And if they do, how can they be used for predicting howmuch attention a news article will attract? First, we describe our data, commentsto online news articles, and then we look at the comment volume per source,the comments lifecycle, their temporal distribution and compare these statisticsto those recorded in the blogosphere. The answers provide useful features formodeling and predicting news comments.
The dataset consists of aggregated content from seven online news agents:Algemeen Dagblad (AD), De Pers, Financieel Dagblad (FD), Spits, Telegraaf, Trouw,and WaarMaarRaar (WMR), and one collaborative news platform, NUjij. We havechosen to include sources that provide commenting facilities for news stories, butdiffer in coverage, political views, subject, and type. Six of the selected newsagents publish daily newspapers and two, WMR and NUjij, are present only onthe web. WMR publishes “oddly-enough” news and NUjij is a collaborative newsplatform, similar to Digg, where people submit links to news stories for othersto vote for or initiate discussion. We focus only on the user interaction reflectedby user generated comments, but other interaction features may play a role on auser’s decision to leave a comment.
For the period November 2008–April 2009 we collected news articles andtheir comments from the news sources listed above. Our dataset consists of290,375 articles, and 1,894,925 comments. The content is mainly written in Dutch.However, since our approach is language independent and we believe that theobserved patterns and lessons learned apply to news comments in other countries,we could apply our approach to other languages as well.
6.2.1 News comments patterns
We explore news comments patterns in three dimensions: (a) ratio of commentedarticles, (b) reaction time and lifespan, (c) how patterns in news commentscompare to those found in blog posts comments. A numerical summary of ourfindings is reported in Table 6.1.
Comment volume vs. news article volume We start our exploration by lookingat the ratio of articles that receive at least a comment per news agent. In terms of
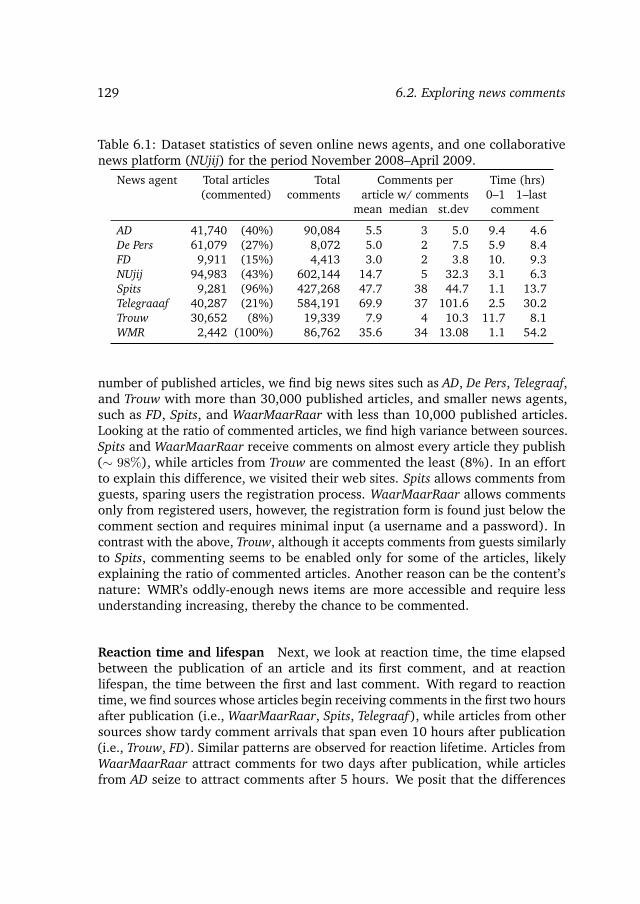
129 6.2. Exploring news comments
Table 6.1: Dataset statistics of seven online news agents, and one collaborativenews platform (NUjij) for the period November 2008–April 2009.
News agent Total articles Total Comments per Time (hrs)(commented) comments article w/ comments 0–1 1–last
mean median st.dev comment
AD 41,740 (40%) 90,084 5.5 3 5.0 9.4 4.6De Pers 61,079 (27%) 8,072 5.0 2 7.5 5.9 8.4FD 9,911 (15%) 4,413 3.0 2 3.8 10. 9.3NUjij 94,983 (43%) 602,144 14.7 5 32.3 3.1 6.3Spits 9,281 (96%) 427,268 47.7 38 44.7 1.1 13.7Telegraaaf 40,287 (21%) 584,191 69.9 37 101.6 2.5 30.2Trouw 30,652 (8%) 19,339 7.9 4 10.3 11.7 8.1WMR 2,442 (100%) 86,762 35.6 34 13.08 1.1 54.2
number of published articles, we find big news sites such as AD, De Pers, Telegraaf,and Trouw with more than 30,000 published articles, and smaller news agents,such as FD, Spits, and WaarMaarRaar with less than 10,000 published articles.Looking at the ratio of commented articles, we find high variance between sources.Spits and WaarMaarRaar receive comments on almost every article they publish(∼ 98%), while articles from Trouw are commented the least (8%). In an effortto explain this difference, we visited their web sites. Spits allows comments fromguests, sparing users the registration process. WaarMaarRaar allows commentsonly from registered users, however, the registration form is found just below thecomment section and requires minimal input (a username and a password). Incontrast with the above, Trouw, although it accepts comments from guests similarlyto Spits, commenting seems to be enabled only for some of the articles, likelyexplaining the ratio of commented articles. Another reason can be the content’snature: WMR’s oddly-enough news items are more accessible and require lessunderstanding increasing, thereby the chance to be commented.
Reaction time and lifespan Next, we look at reaction time, the time elapsedbetween the publication of an article and its first comment, and at reactionlifespan, the time between the first and last comment. With regard to reactiontime, we find sources whose articles begin receiving comments in the first two hoursafter publication (i.e., WaarMaarRaar, Spits, Telegraaf), while articles from othersources show tardy comment arrivals that span even 10 hours after publication(i.e., Trouw, FD). Similar patterns are observed for reaction lifetime. Articles fromWaarMaarRaar attract comments for two days after publication, while articlesfrom AD seize to attract comments after 5 hours. We posit that the differences

6. Commenting Behavior on Online News 130
in reaction time and lifespan are due to the different demographics of the targetaudience of each news agent; one could postulate that tech savvies or youngstersare rather quick to react, whilst older people, less acquainted with the internet,access the online version of the news papers less frequently.
News comments and blog post comments The commenting feature in onlinenews is inspired by the possibility for blog readers to leave behind their comments,thus it is interesting to compare the commenting behavior in these two domains.We compare the statistics we found above to commenting statistics in blogs asreported in (Mishne and Glance, 2006a). In general, the commenting behavioron news articles is found to be parallel to that in blog posts. The total numberof comments is an order of magnitude larger than the total number of articles,which is positively correlated with the case of influential blogs. About 15% of theblog posts in the dataset in (Mishne and Glance, 2006a) receives comments, anumber that increases for the news domain: the average percentage of commentedarticles across all sources in our dataset is 23%. Half of the news sources receivethe same number of comments as blogs (mean 6.3), whereas the other half enjoysan order of magnitude more comments than blogs. Spits, WMR, and Telegraaf.Looking at reaction time, the time required for readers to leave a comment, it is onaverage slower for news (∼ 6 hrs) than for blogs (∼ 2 hrs), although this differssignificantly per news source.
Our findings so far suggest that the ratio of commented articles, the totalnumber of comments, and the reaction time and lifespan seem to be inherentcharacteristics of each source. Next, we look at temporal variations in commentingbehavior, and whether news agents share similar temporal patterns.
6.2.2 Temporal variation
We perform an exploration of temporal cycles governing the news comment space.We look at four levels of temporal granularity: monthly, weekly, daily, and hourly.In our dataset, the volume of comments ranges two orders of magnitude, makingthe comparison of raw comment counts difficult. We therefore report comments inz-scores; z-scores represent how many σ’s (standard deviations) the score differsfrom the mean, and allows for comparison across sources.
Looking at comment volume per month in Fig. 6.1, we observe months withhigh and low comment volume, either reflecting the importance of published news,or seasonal user behavior. For example, March shows the highest comment volumeacross the board, and November shows the least for most sources.
Next, we look at the distribution of comments per week of the month inFigure 6.2. AD, WaarMaarRaar and Trouw show a close to uniform distributionover all weeks. Spits and Telegraar show a normal distribution with mean at week

131 6.2. Exploring news comments
Figure 6.1: Comments per month and per source. Vertical line marks a yearseparator.
2 to 3. Comment volume on FD peaks on weeks 1 and 3, and in NUjij starts slowat the beginning of the month slowly peaking towards week 4. All sources showa substantial decrease in comment volume on week 5 because it never containsas many days as the other weeks. We illustrate the comment volume per day of
Figure 6.2: Distribution of comment z-scores per week of the month and persource.
the week in Fig. 6.3: weekdays receive more comments compared to weekends,with Wednesday being, on average, the most active day and Sunday the leastactive day across the board. These results are in agreement with the activityobserved in social networks such as Delicious, Digg, and Reddit.1 Comparing thenumber of comments to the number of articles published per day, most sources
1http://tjake.posterous.com/thursday-at-noon-is-the-best-time-post-and-be –accessed October 28, 2012
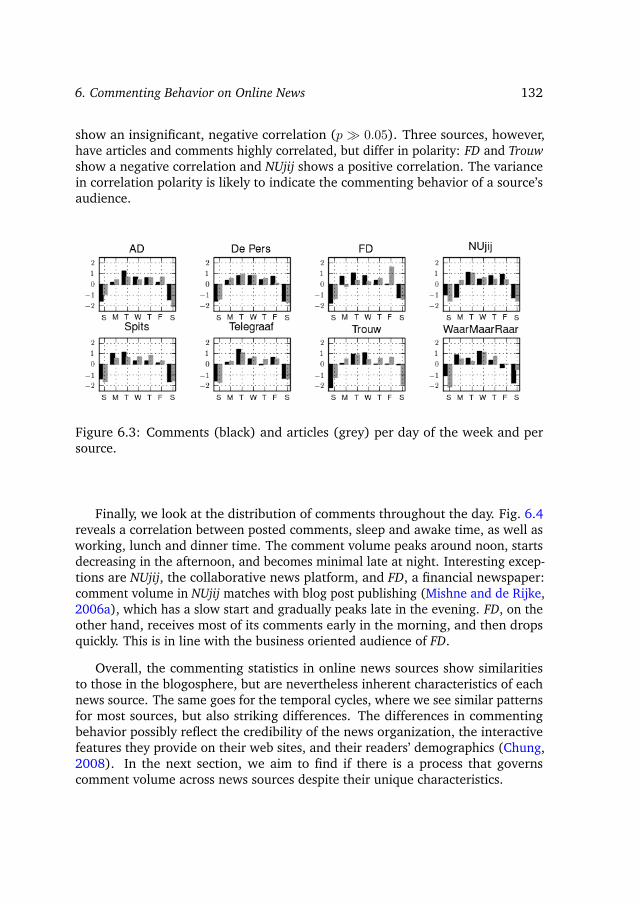
6. Commenting Behavior on Online News 132
show an insignificant, negative correlation (p � 0.05). Three sources, however,have articles and comments highly correlated, but differ in polarity: FD and Trouwshow a negative correlation and NUjij shows a positive correlation. The variancein correlation polarity is likely to indicate the commenting behavior of a source’saudience.
Figure 6.3: Comments (black) and articles (grey) per day of the week and persource.
Finally, we look at the distribution of comments throughout the day. Fig. 6.4reveals a correlation between posted comments, sleep and awake time, as well asworking, lunch and dinner time. The comment volume peaks around noon, startsdecreasing in the afternoon, and becomes minimal late at night. Interesting excep-tions are NUjij, the collaborative news platform, and FD, a financial newspaper:comment volume in NUjij matches with blog post publishing (Mishne and de Rijke,2006a), which has a slow start and gradually peaks late in the evening. FD, on theother hand, receives most of its comments early in the morning, and then dropsquickly. This is in line with the business oriented audience of FD.
Overall, the commenting statistics in online news sources show similaritiesto those in the blogosphere, but are nevertheless inherent characteristics of eachnews source. The same goes for the temporal cycles, where we see similar patternsfor most sources, but also striking differences. The differences in commentingbehavior possibly reflect the credibility of the news organization, the interactivefeatures they provide on their web sites, and their readers’ demographics (Chung,2008). In the next section, we aim to find if there is a process that governscomment volume across news sources despite their unique characteristics.
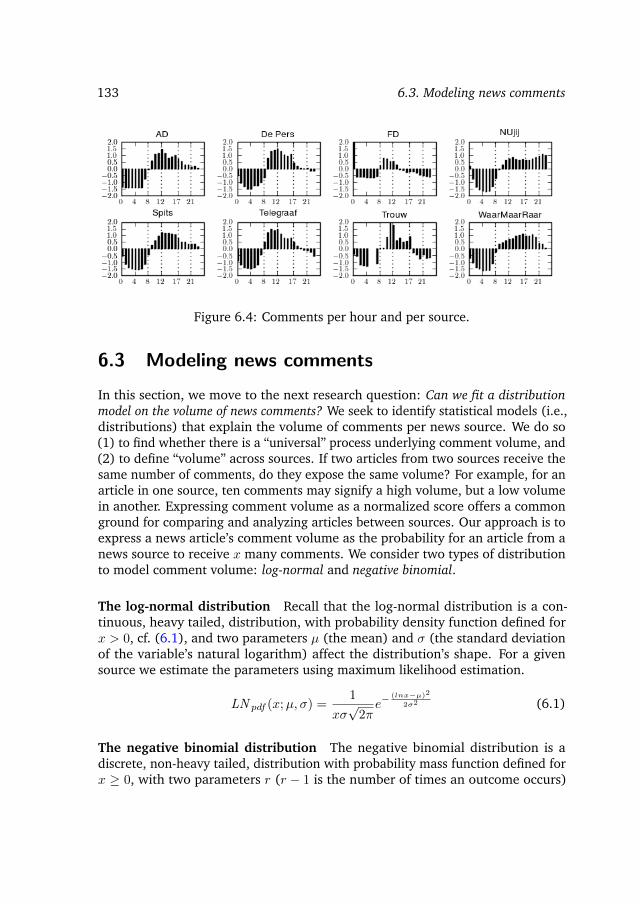
133 6.3. Modeling news comments
Figure 6.4: Comments per hour and per source.
6.3 Modeling news comments
In this section, we move to the next research question: Can we fit a distributionmodel on the volume of news comments? We seek to identify statistical models (i.e.,distributions) that explain the volume of comments per news source. We do so(1) to find whether there is a “universal” process underlying comment volume, and(2) to define “volume” across sources. If two articles from two sources receive thesame number of comments, do they expose the same volume? For example, for anarticle in one source, ten comments may signify a high volume, but a low volumein another. Expressing comment volume as a normalized score offers a commonground for comparing and analyzing articles between sources. Our approach is toexpress a news article’s comment volume as the probability for an article from anews source to receive x many comments. We consider two types of distributionto model comment volume: log-normal and negative binomial.
The log-normal distribution Recall that the log-normal distribution is a con-tinuous, heavy tailed, distribution, with probability density function defined forx > 0, cf. (6.1), and two parameters µ (the mean) and σ (the standard deviationof the variable’s natural logarithm) affect the distribution’s shape. For a givensource we estimate the parameters using maximum likelihood estimation.
LN pdf (x;µ, σ) =1
xσ√
2πe−
(lnx−µ)2
2σ2 (6.1)
The negative binomial distribution The negative binomial distribution is adiscrete, non-heavy tailed, distribution with probability mass function defined forx ≥ 0, with two parameters r (r − 1 is the number of times an outcome occurs)
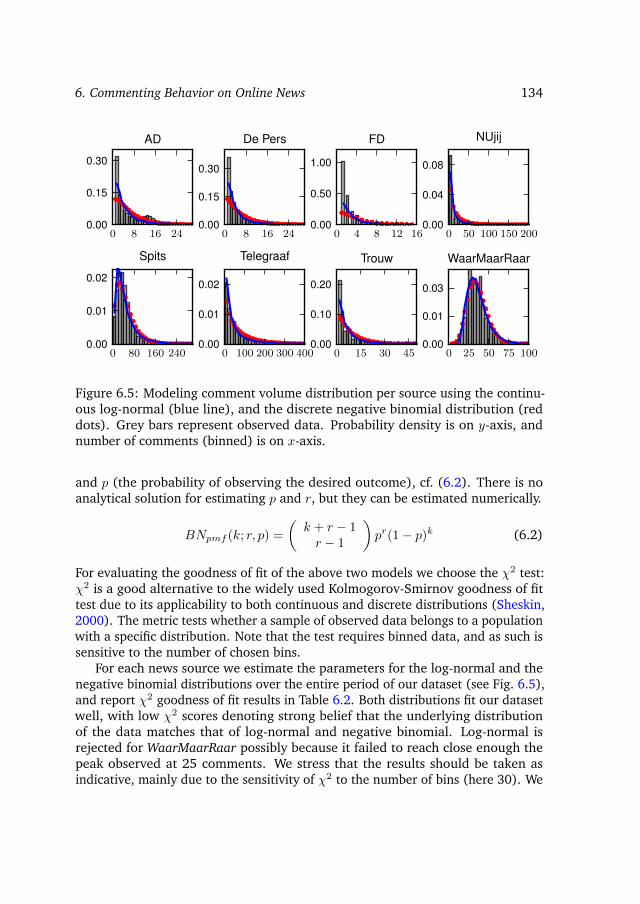
6. Commenting Behavior on Online News 134
0 50 100 150 2000.00
0.04
0.08
NUjij
0 8 16 240.00
0.15
0.30
De Pers
0 15 30 450.00
0.10
0.20
Trouw
0 80 160 2400.00
0.01
0.02
Spits
0 4 8 12 160.00
0.50
1.00
FD
0 100 200 300 4000.00
0.01
0.02
Telegraaf
0 8 16 240.00
0.15
0.30
AD
0 25 50 75 1000.00
0.01
0.03
WaarMaarRaar
Figure 6.5: Modeling comment volume distribution per source using the continu-ous log-normal (blue line), and the discrete negative binomial distribution (reddots). Grey bars represent observed data. Probability density is on y-axis, andnumber of comments (binned) is on x-axis.
and p (the probability of observing the desired outcome), cf. (6.2). There is noanalytical solution for estimating p and r, but they can be estimated numerically.
BNpmf (k; r, p) =
(k + r − 1r − 1
)pr(1− p)k (6.2)
For evaluating the goodness of fit of the above two models we choose the χ2 test:χ2 is a good alternative to the widely used Kolmogorov-Smirnov goodness of fittest due to its applicability to both continuous and discrete distributions (Sheskin,2000). The metric tests whether a sample of observed data belongs to a populationwith a specific distribution. Note that the test requires binned data, and as such issensitive to the number of chosen bins.
For each news source we estimate the parameters for the log-normal and thenegative binomial distributions over the entire period of our dataset (see Fig. 6.5),and report χ2 goodness of fit results in Table 6.2. Both distributions fit our datasetwell, with low χ2 scores denoting strong belief that the underlying distributionof the data matches that of log-normal and negative binomial. Log-normal isrejected for WaarMaarRaar possibly because it failed to reach close enough thepeak observed at 25 comments. We stress that the results should be taken asindicative, mainly due to the sensitivity of χ2 to the number of bins (here 30). We

135 6.3. Modeling news comments
Table 6.2: χ2 goodness of fit for log-normal and negative binomial distributionsat 0.10 significance level. Boldface indicates rejection of the null hypothesis:observed and expected data belong to the same distribution.
News siteLog-normal Negative binomial
χ2 score p-value χ2 score p-valueAD 0.08 1.00 0.08 1.00De Pers 0.59 1.00 0.64 1.00FD 0.18 1.00 0.26 1.00NUjij 0.06 1.00 0.06 1.00Spits 0.67 1.00 1.42 1.00Telegraaf 0.04 1.00 0.04 1.00Trouw 0.56 1.00 0.98 1.00WaarMaarRaar 236.89 0.00 0.15 1.00
Table 6.3: Number of comments per source corresponding at 0.5 of the inversecumulative distribution function (ICDF) for log-normal (LM) and negative binomial(NB).
DistributionComments for ICDF @ 0.5
AD De Pers FD NUjij Spits Telegraaf Trouw WMR
LN 3 3 2 6 36 32 4 34
NB 3 3 1 8 39 43 5 33
experimented with different bin sizes, and observed that for different number ofbins either the log-normal, or the negative-binomial failed to describe all sources.Although searching for the optimal number of bins for both distributions to fit allsources could be interesting, we did not exhaust the entire potential. An exampleof the test’s sensitivity is shown in Table 6.3 where log-normal displays very similarresults to negative-binomial even for the source that failed the χ2 test.
The final decision on which distribution to favor, depends on the data to bemodeled and task at hand. From a theoretical point of view, Wang et al. (2012)studied a small range of social media web sites, and found that the use of heavyor non-heavy tailed distributions depends on the rules of how new stories appearin each web site. From a practical point of view, for the same task, log-normalparameters are less expensive to estimate and the results match closely those ofthe negative binomial. The results of our data exploration and modeling effortsare put to the test in the next two sections, in which we try to predict the commentvolume for a news article before and after publication.

6. Commenting Behavior on Online News 136
6.4 Predicting comment volume prior to publication
We now turn to the third research question we consider in this chapter: Amongtextual, semantic, and real-world sets of features, and their combination, whichleads to the best prediction accuracy for prior to publication prediction of volume ofcomments? More specifically, given a news article that is about to be published, wewant to predict whether it will generate no comments, a low volume of comments,or a high volume of comments. The threshold between low and high volume isgiven in number of comments, and is drawn for each source from the inversecumulative distribution function of the log-normal distribution in Table 6.3.
We address the task of predicting the volume of comments on news articlesprior to publication time, as two consecutive classification tasks. First, we segregatearticles with regards to their potential of receiving any comments. Our approach isa binary classification task with classes: with comments, without comments. Second,we aim to predict news article comment volume for the articles in the positive classof the first task. Our approach is a second binary classification with the classes:low volume, and high volume. For this work we are not interested in optimizingthe classification performance, but rather to investigate if using different typesof features can distinguish articles with the potential to receive comments, andultimately to quantify and predict this potential in terms of comment volume.
6.4.1 Feature engineering
We consider five groups of features: surface, cumulative, textual, semantic, andreal-world. Below, we motivate the use of each group in turn, and list a summaryof all features in Table 6.4.
Surface features News stories are consumed not only directly from the newssites, but also from RSS feeds. As a result, the quality of the feed metadata playsan important role on a user’s decision to click on a news item to read it in full, or toleave a comment; see also Chapter 5. For example, if a news source supplies onlythe title of an article, but not a short summary, the users may prefer to click on asimilar article from a different source that gives more information. Additionally,syndication feeds because of their XML nature, constitute a good source for easilyextractable features from the feed metadata, e.g., date and time of publication,number of authors, number of categories that the article is published on.
Aggregation features News agents collaborate with international or nationalnews providers to expand their news coverage. Depending on how a news agentassesses the importance of a news story, a story may be published from different
137 6.4. Predicting comment volume prior to publication
sources, or on multiple feeds of the same source. On one hand, the number oftimes that a story is seen is a good signal for being interesting to multiple groupsof readers. On the other hand, its exposure to multiple feeds and sources increasesthe likelihood to be commented. To identify such stories, we apply near-duplicatedetection (Broder et al., 1997) in two levels: internal and external. Internalnear-duplicates are similar articles published from the same source, cross-postedon their different feeds, or re-posted after an update. External near-duplicates aresimilar articles published from different sources. Finally, our aggregation featureset is complemented with the number of articles published at the same as a givenarticle. Our hypothesis is that while in the media domain, news is publishedquickly, articles compete for users’ attention. If the news supply is high, articlesthat could be potentially commented, may be left without comments because ofthe users’ attention shift.
Textual features For the textual features, we consider word unigrams which wecurate using several preprocessing steps. We keep only unigrams starting with aletter and are more than one character long. The vocabulary is further reducedby using a Dutch and English stopword list along with an non-exhaustive HTMLtags list. For the remaining terms, and for each news agent in our dataset, we takethe top-100 most discriminative terms, for the entire period, and for the periodone month prior to our testing set. For the first classification step, discriminativeterms are calculated using the log-likelihood score for words between the articleswithout comments and the articles with comments; this is a similar approach topredicting the mood of the blogosphere where it yielded promising results (Mishneand de Rijke, 2006a). Similarly for the second classification step, the log-likelihoodis calculated on the two periods, between articles with “low” and “high” commentvolume. Table 6.5 lists the most discriminative terms per source. The mostinteresting observation is that the discriminative terms give an indication of thedifferences between the news sources. We observe general news terms for thegeneral news sources like AD, De Pers, and Trouw. Telegraaf and Spits are alsogeneral sources, but lean more towards tabloids. News source FD is clearly afinancial news source, and finally online news sources like NUjij and WaarMaarRaarare very different from news sources that are also published off line.
Semantic features News is about events, mainly referring to people, organi-zations, or locations. We exploit this characteristic and apply named entityrecognition to extract four types of named entities: person, location, organiza-tion, and miscellaneous. Wherever possible the named entities are normalizedagainst Wikipedia articles. We encode the hypothesis that if an article refers tomany entities it has a higher probability of being discussed, as the total numberof unique normalized entities per entity type. Locality is another characteristic
6. Commenting Behavior on Online News 138
of news (Pouliquen et al., 2004) which we exploit. We label location entitiesas local, and non-local, depending on whether they feature in a list of 3,500Dutch toponyms mined from Wikipedia. Furthermore, some entities being morecontroversial than others, are springboards for discussions. We capture all-timediscriminative entities, and entities that triggered comments in the month priorto our test set using log-likelihood similarly to discriminative terms. We mergethe top-50 most discriminative entities for each entity type to complete our se-mantic feature set. Table 6.6 lists the most discriminative instance of each entitytype per source. For persons and organizations we classify the instances in fourcategories and an “other” category. As we can tell from the table, politiciansare popular entities for discussions: Geert Wilders (right-wing PVV leader) andJan-Peter Balkenende (Prime Minister at the time) are among the ones that attractmany comments. Other persons triggering comments are celebrities and businesspeople. As to organizations, we notice that sports organizations, most notablysoccer clubs, attract discussion: Ajax, PSV, and Feyenoord are the three biggestsoccer clubs in the Netherlands. Again, politics is a popular topic here: Hamas,PvdA, and PVV are political organizations. Finally, when looking at the locations,we see that areas with tensions (Iraq and Gaza Strip) are main discriminators.
Real-world features The last set of features explores the potential correlationbetween real-world environmental conditions and commenting behavior. Ourhypothesis is that weather conditions may affect the time people spend on-line;when the weather is good people may choose to spend more time outside, and viceversa. We downloaded hourly historical weather data for the period covering ourdataset. For the publication time of an article, we report the median temperaturein the Netherlands at that time. Median temperature is computed over 119 Dutchweather stations, and reported in Celsius. Although weather conditions are notdescribed entirely in temperature, we believe that is one of the representativeindicators, and allows for easy extraction into a feature.
6.4.2 Results and discussion
We report on classification experiments per news source on the following exper-imental conditions: a baseline, one group of features at a time, and combiningall feature groups. The baseline consists of six temporal features (month, week ofthe month, day of the week, day of the month, hour, and first half hour). For eachsource in our dataset, we create training and test sets. The training sets containarticles published from Nov 2008 until Feb 2009, and the test sets consist of thearticles published in Mar 2009. We use RandomForest, a decision tree meta classi-fier(Breiman, 2001). For evaluation of the classification performance we report the
139 6.4. Predicting comment volume prior to publication
F1-score, and the percentage of correctly classified instances for each experimentalcondition. Significance of results is measured with the Kappa-statistic.
Stage 1: Any comments? Looking at Table 6.7, most sources show a high F1score for the negative class, while only two sources show a high F1 score forthe positive class. These results reflect the commented/non-commented ratioof articles in each source that leads to highly skewed training sets. WMR andSpits, most of their articles having at least one comment, show a high ratio ofpositive examples, pushing the F1 score close to 1. As a result, for this classificationexperiment, the different groups of features are not expected to differ greatly forthese two sources.
The baseline displays solid performance across the board. However, the Kappa-statistic hovers near zero, suggesting that if we classified the articles randomly,there is chance of observing similar results. Among the groups of features, textualand semantic features perform the best for most sources. This confirms that certainwords and named entities trigger comments. Cumulative, surface, and real-worldfeatures perform similar to the baseline. Interestingly, the real-world features forAD achieve an F1 score of 0.749 for the negative class with Kappa at 0.48, and thesurface features’ performance for Trouw has an F1 score of 0.952 for the negativeclass with Kappa at 0.36. The combination of all groups of features does not leadto substantial improvements, but hovers at similar levels as when using textualfeatures only.
Stage 2: High vs. low volume For the second classification experiment, articlesthat have previously been classified as yes comments are now classified based onwhether they will receive a high or low volume of comments. Misclassified negativeexamples (articles without comments) from the first stage are labeled low volume.Five sources lack results for the real-world feature set due to the classifier markingall articles as negative in the first step.
In this setting, the F1 score is more equally distributed between the negativeand the positive class. Textual and semantic features prove again to be goodperformers with non-zero Kappa, although varying almost 24% between sources(NUjij vs. FD). The variation suggests that the number of textual and semanticfeatures should be optimized per source. The performance of cumulative featuresvaries substantially between sources. E.g., for Trouw and NUjij it is among the bestperforming groups, but for FD it has a negative Kappa index. Looking at all groupscombined, Kappa values increase, an indication for more robust classification.In general, the classification performance for all groups combined is better thanthe baseline, although the difference depends on the source. Comparing theperformance of all features and individual feature sets, we observe that in somecases performance degrades in favor of a higher Kappa-value: For Telegraaf for

6. Commenting Behavior on Online News 140
example, textual features alone classify 55% of the instances correct (Kappa: 0.06),while all features reach 51% correctly classified instances (Kappa: 0.14).
To better understand our results, we look at misclassified instances, and identifyfive main types of error. We report on each type with an example that showswhy the article could generate many comments (+), but did not live up to thisexpectation (-), or the other way around:
1. The event discussed in the news article is prone to comments, but thisparticular event is happening too far away (geographically); e.g., bonusesfor top management (+) in Sweden (-).
2. The event may be a comment “magnet,” but is too local in this case; e.g.,underground storage of CO2 (+) in a small village (-).
3. The news article itself is not attracting comments, but one posted commentsparks discussion; e.g., strikes in local stores (-) with a very sarcastic firstcomment (+). This finding is consistent with findings in (Kaltenbrunneret al., 2007a) where they identify a peak after the initial publication timedue to a controversial comment.
4. Shocking, touching, or in other ways surprising articles often generate morecomments than can be expected from the article’s content; e.g., a grand-mother survives a car crash (-), the crash was caused by her avoiding hergrandchildren and falling 60 meters down a cliff (+).
5. From the content of the article, a “controversial” topic might be expected, butthe actual event is rather uncontroversial; e.g., a soccer match (+) involvinga national team (-).
Our failure analysis indicates that the features we used are not the only factorsinvolved in the prediction process. Future work should therefore focus on extract-ing more feature sets (e.g., context and entity-relations), use different encodingsfor current features, optimize the number of textual and semantic features persource, and explore optimized feature sets. In the next section, we approachcomment volume prediction from a different angle, that of predicting the volumeof comments in the long term after observing the increase in comment volumeshortly after publication.
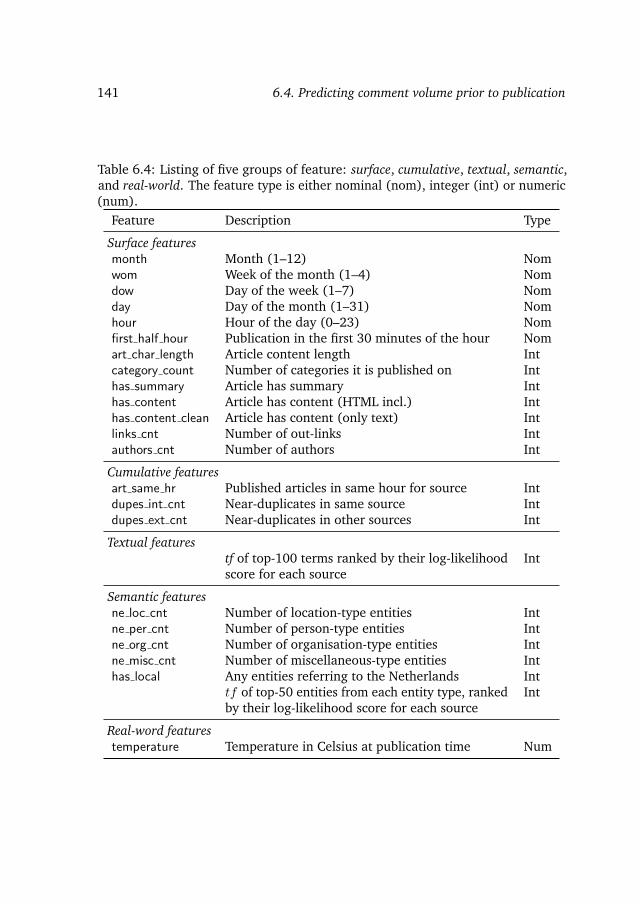
141 6.4. Predicting comment volume prior to publication
Table 6.4: Listing of five groups of feature: surface, cumulative, textual, semantic,and real-world. The feature type is either nominal (nom), integer (int) or numeric(num).
Feature Description Type
Surface featuresmonth Month (1–12) Nomwom Week of the month (1–4) Nomdow Day of the week (1–7) Nomday Day of the month (1–31) Nomhour Hour of the day (0–23) Nomfirst half hour Publication in the first 30 minutes of the hour Nomart char length Article content length Intcategory count Number of categories it is published on Inthas summary Article has summary Inthas content Article has content (HTML incl.) Inthas content clean Article has content (only text) Intlinks cnt Number of out-links Intauthors cnt Number of authors Int
Cumulative featuresart same hr Published articles in same hour for source Intdupes int cnt Near-duplicates in same source Intdupes ext cnt Near-duplicates in other sources Int
Textual featurestf of top-100 terms ranked by their log-likelihoodscore for each source
Int
Semantic featuresne loc cnt Number of location-type entities Intne per cnt Number of person-type entities Intne org cnt Number of organisation-type entities Intne misc cnt Number of miscellaneous-type entities Inthas local Any entities referring to the Netherlands Int
tf of top-50 entities from each entity type, rankedby their log-likelihood score for each source
Int
Real-word featurestemperature Temperature in Celsius at publication time Num

6. Commenting Behavior on Online News 142
Table 6.5: Most discriminative terms per source.
Source Terms
AD Israeli, community, Palestinian, homes, minuteresidents, houses
De Pers Israeli, smoking ban, believes, Cabinet, ministerPrime Minister, inquiry
FD quarter, court, stock target, Euro zone, bankspension funds, insurers
NUjij lead free, professor, translated, stock exchangefire, soccer, part
Spits photo, Israeli, night cap, bikini, Palestinianmatch, sex
Telegraaf Israeli, seats, minister, Maroccan, sexworld championship, meter
Trouw Israeli, mosque, Pope, court, Indiandollar, spinal anaesthesia
WaarMaarRaar police, casino, body, sell, robbery, sex, children

143 6.4. Predicting comment volume prior to publication
Table 6.6: Most discriminative persons, organizations, and locations per source:1politics, 2business, 3sports, 4celebrities, 5other.
PersonsAD Geert Wilders1, Klaas-Jan Huntelaar3,
Jan-Peter Balkenende1
De Pers Geert Wilders1, Jan-Peter Balkenende1,Ella Vogelaar1
FD Arie Slob1, Geoffrey Leloux2, Hillary Clinton1
NUjij Geert Wilders1, Jan-Peter Balkenende1,Natasja Froger4
Spits Geert Wilders1, Paris Hilton4, Ari3
Telegraaf Geert Wilders1, Jan-Peter Balkenende1, Gordon4
Trouw Jan-Peter Balkenende1, Geert Wilders1,Ole Ramlau-Hansen2
WaarMaarRaar Thomas Goodrich5, Bernard Madoff2,Steven Negron5
OrganizationsAD Feyenoord3, PSV3, Ajax3
De Pers PvdA1, PSV3, Hamas1
FD Crucell2, NIBC2, PFZW2
NUjij PVV1, Hamas1, PvdA1
Spits Hamas1, Atletico Madrid3, PVV1
Telegraaf PVV1, Hamas1, PvdA1
Trouw Ajax3, Hamas1, PSV3
WaarMaarRaar CIA5, eBay2, Motorola2
LocationsAD Gaza Strip, Rotterdam, NetherlandsDe Pers Gaza Strip, Iraq, NetherlandsFD Borssele, Iraq, GermanyNUjij Gaza Strip, Russia, IsraelSpits Gaza Strip, Barcelona, ArubaTelegraaf Gaza Strip, Aruba, NetherlandsTrouw Gaza Strip, Greenland, Schiphol AirportWaarMaarRaar India, Switzerland, United Kingdom
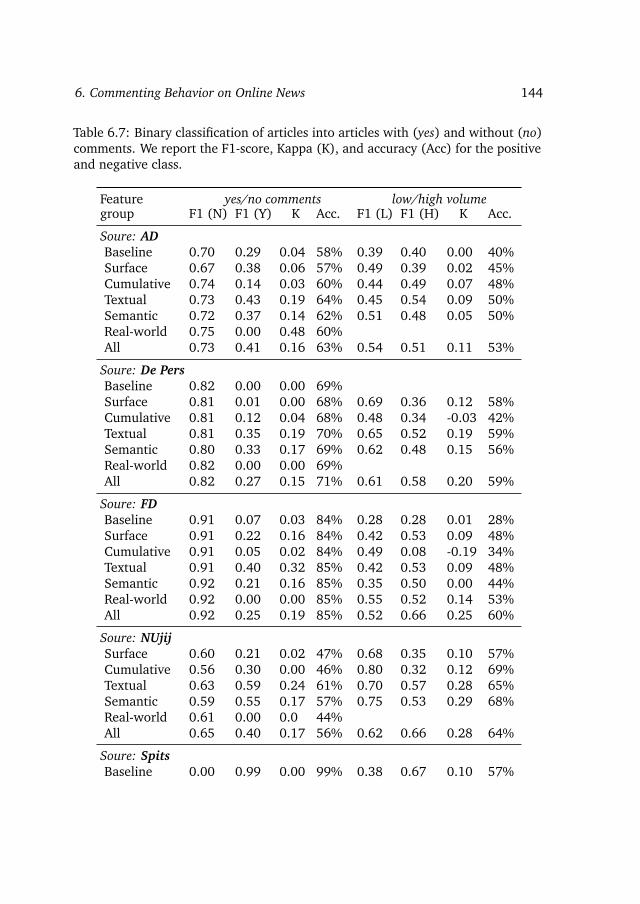
6. Commenting Behavior on Online News 144
Table 6.7: Binary classification of articles into articles with (yes) and without (no)comments. We report the F1-score, Kappa (K), and accuracy (Acc) for the positiveand negative class.
Feature yes/no comments low/high volumegroup F1 (N) F1 (Y) K Acc. F1 (L) F1 (H) K Acc.
Soure: ADBaseline 0.70 0.29 0.04 58% 0.39 0.40 0.00 40%Surface 0.67 0.38 0.06 57% 0.49 0.39 0.02 45%Cumulative 0.74 0.14 0.03 60% 0.44 0.49 0.07 48%Textual 0.73 0.43 0.19 64% 0.45 0.54 0.09 50%Semantic 0.72 0.37 0.14 62% 0.51 0.48 0.05 50%Real-world 0.75 0.00 0.48 60%All 0.73 0.41 0.16 63% 0.54 0.51 0.11 53%
Soure: De PersBaseline 0.82 0.00 0.00 69%Surface 0.81 0.01 0.00 68% 0.69 0.36 0.12 58%Cumulative 0.81 0.12 0.04 68% 0.48 0.34 -0.03 42%Textual 0.81 0.35 0.19 70% 0.65 0.52 0.19 59%Semantic 0.80 0.33 0.17 69% 0.62 0.48 0.15 56%Real-world 0.82 0.00 0.00 69%All 0.82 0.27 0.15 71% 0.61 0.58 0.20 59%
Soure: FDBaseline 0.91 0.07 0.03 84% 0.28 0.28 0.01 28%Surface 0.91 0.22 0.16 84% 0.42 0.53 0.09 48%Cumulative 0.91 0.05 0.02 84% 0.49 0.08 -0.19 34%Textual 0.91 0.40 0.32 85% 0.42 0.53 0.09 48%Semantic 0.92 0.21 0.16 85% 0.35 0.50 0.00 44%Real-world 0.92 0.00 0.00 85% 0.55 0.52 0.14 53%All 0.92 0.25 0.19 85% 0.52 0.66 0.25 60%
Soure: NUjijSurface 0.60 0.21 0.02 47% 0.68 0.35 0.10 57%Cumulative 0.56 0.30 0.00 46% 0.80 0.32 0.12 69%Textual 0.63 0.59 0.24 61% 0.70 0.57 0.28 65%Semantic 0.59 0.55 0.17 57% 0.75 0.53 0.29 68%Real-world 0.61 0.00 0.0 44%All 0.65 0.40 0.17 56% 0.62 0.66 0.28 64%
Soure: SpitsBaseline 0.00 0.99 0.00 99% 0.38 0.67 0.10 57%
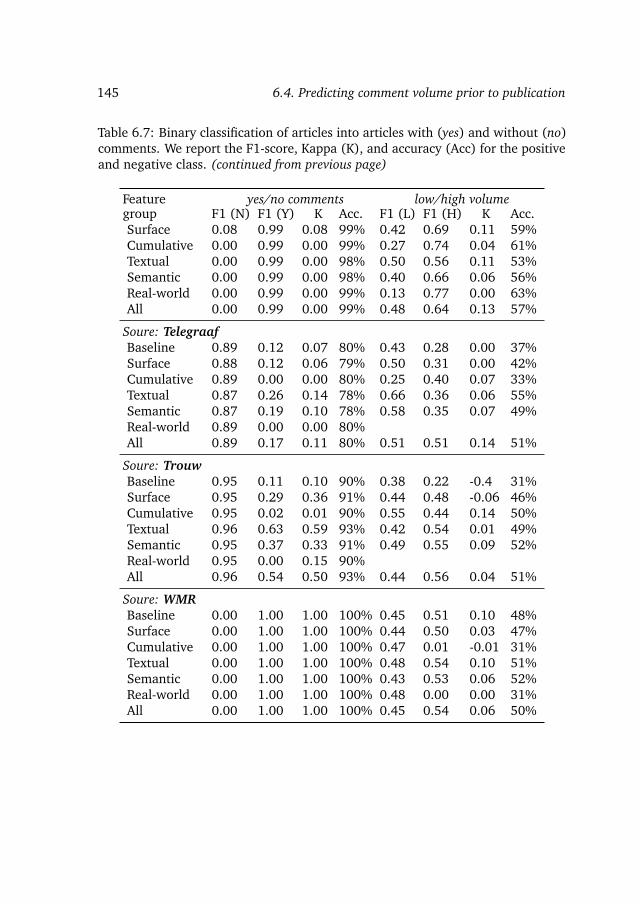
145 6.4. Predicting comment volume prior to publication
Table 6.7: Binary classification of articles into articles with (yes) and without (no)comments. We report the F1-score, Kappa (K), and accuracy (Acc) for the positiveand negative class. (continued from previous page)
Feature yes/no comments low/high volumegroup F1 (N) F1 (Y) K Acc. F1 (L) F1 (H) K Acc.Surface 0.08 0.99 0.08 99% 0.42 0.69 0.11 59%Cumulative 0.00 0.99 0.00 99% 0.27 0.74 0.04 61%Textual 0.00 0.99 0.00 98% 0.50 0.56 0.11 53%Semantic 0.00 0.99 0.00 98% 0.40 0.66 0.06 56%Real-world 0.00 0.99 0.00 99% 0.13 0.77 0.00 63%All 0.00 0.99 0.00 99% 0.48 0.64 0.13 57%
Soure: TelegraafBaseline 0.89 0.12 0.07 80% 0.43 0.28 0.00 37%Surface 0.88 0.12 0.06 79% 0.50 0.31 0.00 42%Cumulative 0.89 0.00 0.00 80% 0.25 0.40 0.07 33%Textual 0.87 0.26 0.14 78% 0.66 0.36 0.06 55%Semantic 0.87 0.19 0.10 78% 0.58 0.35 0.07 49%Real-world 0.89 0.00 0.00 80%All 0.89 0.17 0.11 80% 0.51 0.51 0.14 51%
Soure: TrouwBaseline 0.95 0.11 0.10 90% 0.38 0.22 -0.4 31%Surface 0.95 0.29 0.36 91% 0.44 0.48 -0.06 46%Cumulative 0.95 0.02 0.01 90% 0.55 0.44 0.14 50%Textual 0.96 0.63 0.59 93% 0.42 0.54 0.01 49%Semantic 0.95 0.37 0.33 91% 0.49 0.55 0.09 52%Real-world 0.95 0.00 0.15 90%All 0.96 0.54 0.50 93% 0.44 0.56 0.04 51%
Soure: WMRBaseline 0.00 1.00 1.00 100% 0.45 0.51 0.10 48%Surface 0.00 1.00 1.00 100% 0.44 0.50 0.03 47%Cumulative 0.00 1.00 1.00 100% 0.47 0.01 -0.01 31%Textual 0.00 1.00 1.00 100% 0.48 0.54 0.10 51%Semantic 0.00 1.00 1.00 100% 0.43 0.53 0.06 52%Real-world 0.00 1.00 1.00 100% 0.48 0.00 0.00 31%All 0.00 1.00 1.00 100% 0.45 0.54 0.06 50%
6. Commenting Behavior on Online News 146
6.5 Predicting comment volume after publication
We have found that predicting the volume of comments before an article has beenpublished is challenging. Does the correlation between number of responses atearly time and at later time found in social media such as Digg and Youtube holdfor news comments? I.e., are patterns for online responses potentially “universal”?And can we use this to predict the number of comments an article will receive,having seen an initial number? Here, we look at predicting comment volume afteran article is published, which brings us to the next research question: What isthe prediction accuracy for predicting volume of comments after publication? Howobservation time correlates with prediction accuracy?
Before we begin to study the relation between early and late comment volume,we need to take a closer look at the temporal variations of comment volume asthese variations can affect the correlation outcomes. In Section 6.2.2 we reportedon the circadian pattern underlying news comment generation, which is found tobe similar to blog posts (Mishne and Glance, 2006a), Diggs and Youtube videoviews (Szabo and Huberman, 2010). The existence of a circadian pattern impliesthat a story’s comment volume depends on the publication time, and thereforenot all stories share the same prospect of being commented; stories publishedduring daytime—when people comment the most—have a higher prior probabilityof receiving a comment.
With this in mind, publication time adds another dimension of complexityin finding temporal correlations. To simplify our task, we introduce a temporaltransformation from real-time to source-time, following (Szabo and Huberman,2010), a function of the comment volume entering a news site within a certaintime unit. I.e., source-time is defined as the time required for xi comments to entera news agent system i, where xi stands for the average number of comments perhour cast to a particular source, and is the division of a source’s total numberof comments by the total number of hours that we have data for. Consequently,source-time has the property of expanding or condensing the real-time scale inorder to keep the ratio of incoming comments per hour fixed. Once the number ofcomments per time unit has been fixed, all stories share the same probability tobe commented independently of their publication time. In the rest of this section,story comments are measured in their news agent specific source-time, e.g., forTrouw we measure in trouw-time, for WMR in wmr-time, etc.
Once the temporal transformation is in place, we need a definition for earlyand late time, between which we are interested in discovering a correlation. Weintroduce reference time tr as “late” time, and we set it at 30 source-days after thestory has been published. For “early” time, we define indicator time tr to rangefrom 0 to tr in hourly intervals. Some news agents disable comments after acertain period. As a result, there are articles that constantly reach their maximum

147 6.5. Predicting comment volume after publication
comments before tr, however we have not marked them separately.
6.5.1 Correlation of comment volume at early and late time
Now that comment volume is projected to a time invariant scale, we measurethe correlation strength between reference and indicator times using Pearson’scorrelation coefficient ρ. We compute ρ in hourly intervals from publication timeto reference time for all sources over the entire period of the dataset, using articleswith more than one comment.
Fig. 6.6 shows that the number of comments per source increases exponentially,yet with different rates, reflecting the commenting rules of each site: the time astory remains visible on the front page, for how long comments are enabled, etc. Inthe same figure we show a positive correlation that grows stronger as ti approachestr due to stories that saturate to their maximum number of comments. The curveslope indicates how fast stories reach their maximum number of comments, e.g.,Spits displays a very steep comment volume curve meaning that most stories stopreceiving comments short after publication. Looking at when sources reach strongcorrelation (ρ > 0.9) we find that the corresponding indicator times reflect theaverage commenting lifespan of each source (see Table 6.1).
The findings for NUjij, the collaborative news platform, are of particular interestbecause although we expected NUjij to follow a fast correlation pattern similar toDigg (0.98 after the 5th digg-hour), our findings suggest that a strong correlationis achieved much later (ρ at 0.90 after 11 source-hours). Although, nujij-timeand digg-time are not directly comparable due to the transformed scale, we cancompare the average user submissions entering each system per hour: 5, 478 diggsvs. 140 comments. The difference in the order of magnitude can be explainedby the different popularity levels enjoyed by the two sites. One could argue thatdigg-ing and commenting are simply different tasks: on the one hand, commenting,similarly to writing, asks for some reflection on how to verbalize one’s thoughtsregardless of the size or the quality of the comment. On the other hand, digg-ingrequires the click of a button, rendering the task easier, and hence more attractiveto participate.
6.5.2 Prediction model
We have confirmed that the early and late number of comments are correlatedfor all of our news sources. Our next step is to use this finding for developing aprediction model. For our prediction experiments, we are interested in minimizingnoise to improve performance, and hence could exploit the emerging clustersby eliminating stories with too few comments at early indicator times. Sincethese stories exhibit a rather random pattern with regards to their final number of
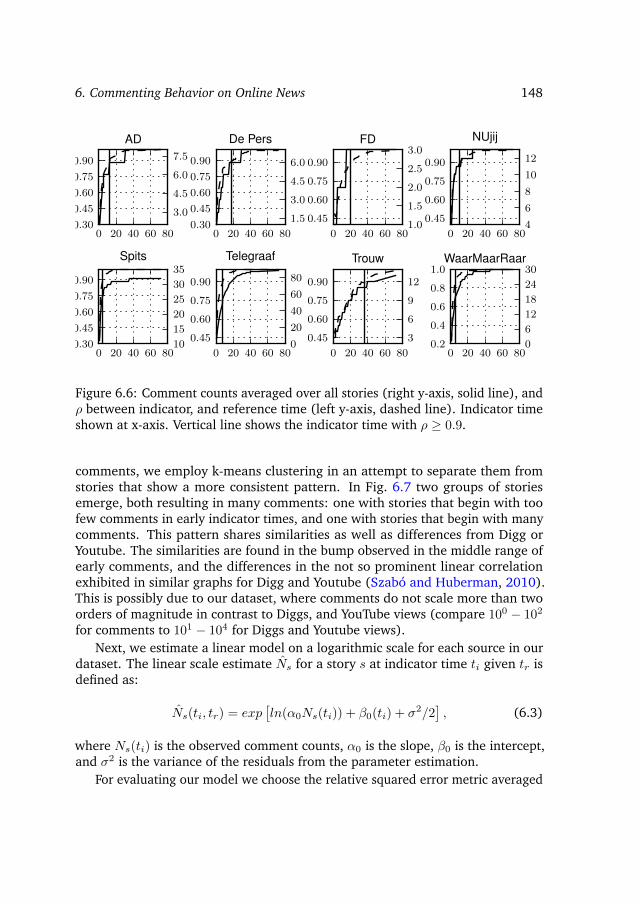
6. Commenting Behavior on Online News 148
0 20 40 60 80
0.45
0.60
0.75
0.90
NUjij
4
6
8
10
12
0 20 40 60 800.30
0.45
0.60
0.75
0.90
De Pers
1.5
3.0
4.5
6.0
0 20 40 60 80
0.45
0.60
0.75
0.90
Trouw
3
6
9
12
0 20 40 60 800.30
0.45
0.60
0.75
0.90
Spits
10
15
20
25
30
35
0 20 40 60 80
0.45
0.60
0.75
0.90
FD
1.0
1.5
2.0
2.5
3.0
0 20 40 60 80
0.45
0.60
0.75
0.90
Telegraaf
0
20
40
60
80
0 20 40 60 800.30
0.45
0.60
0.75
0.90
AD
3.0
4.5
6.0
7.5
0 20 40 60 800.2
0.4
0.6
0.8
1.0WaarMaarRaar
0
6
12
18
24
30
Figure 6.6: Comment counts averaged over all stories (right y-axis, solid line), andρ between indicator, and reference time (left y-axis, dashed line). Indicator timeshown at x-axis. Vertical line shows the indicator time with ρ ≥ 0.9.
comments, we employ k-means clustering in an attempt to separate them fromstories that show a more consistent pattern. In Fig. 6.7 two groups of storiesemerge, both resulting in many comments: one with stories that begin with toofew comments in early indicator times, and one with stories that begin with manycomments. This pattern shares similarities as well as differences from Digg orYoutube. The similarities are found in the bump observed in the middle range ofearly comments, and the differences in the not so prominent linear correlationexhibited in similar graphs for Digg and Youtube (Szabo and Huberman, 2010).This is possibly due to our dataset, where comments do not scale more than twoorders of magnitude in contrast to Diggs, and YouTube views (compare 100 − 102
for comments to 101 − 104 for Diggs and Youtube views).Next, we estimate a linear model on a logarithmic scale for each source in our
dataset. The linear scale estimate Ns for a story s at indicator time ti given tr isdefined as:
Ns(ti, tr) = exp[ln(α0Ns(ti)) + β0(ti) + σ2/2
], (6.3)
where Ns(ti) is the observed comment counts, α0 is the slope, β0 is the intercept,and σ2 is the variance of the residuals from the parameter estimation.
For evaluating our model we choose the relative squared error metric averaged
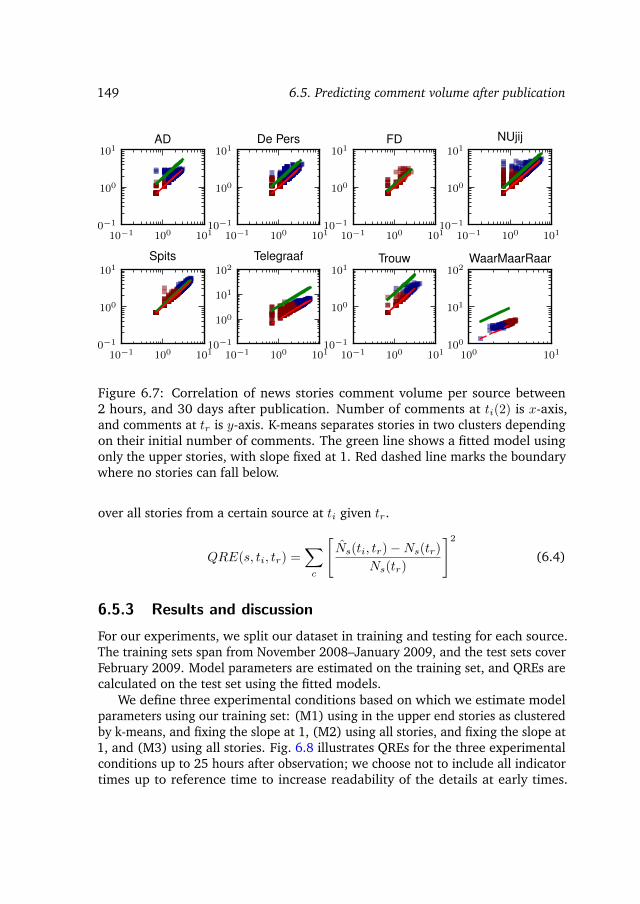
149 6.5. Predicting comment volume after publication
10−1 100 10110−1
100
101NUjij
10−1 100 10110−1
100
101De Pers
10−1 100 10110−1
100
101Trouw
10−1 100 10110−1
100
101Spits
10−1 100 10110−1
100
101FD
10−1 100 10110−1
100
101
102Telegraaf
10−1 100 10110−1
100
101AD
100 101100
101
102WaarMaarRaar
Figure 6.7: Correlation of news stories comment volume per source between2 hours, and 30 days after publication. Number of comments at ti(2) is x-axis,and comments at tr is y-axis. K-means separates stories in two clusters dependingon their initial number of comments. The green line shows a fitted model usingonly the upper stories, with slope fixed at 1. Red dashed line marks the boundarywhere no stories can fall below.
over all stories from a certain source at ti given tr.
QRE(s, ti, tr) =∑c
[Ns(ti, tr)−Ns(tr)
Ns(tr)
]2
(6.4)
6.5.3 Results and discussion
For our experiments, we split our dataset in training and testing for each source.The training sets span from November 2008–January 2009, and the test sets coverFebruary 2009. Model parameters are estimated on the training set, and QREs arecalculated on the test set using the fitted models.
We define three experimental conditions based on which we estimate modelparameters using our training set: (M1) using in the upper end stories as clusteredby k-means, and fixing the slope at 1, (M2) using all stories, and fixing the slope at1, and (M3) using all stories. Fig. 6.8 illustrates QREs for the three experimentalconditions up to 25 hours after observation; we choose not to include all indicatortimes up to reference time to increase readability of the details at early times.
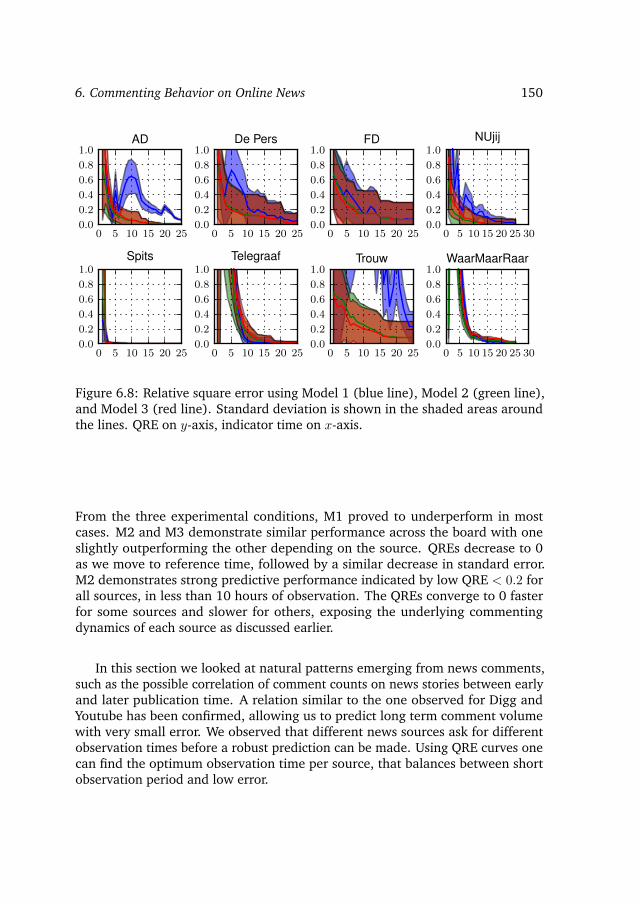
6. Commenting Behavior on Online News 150
0 5 10 15 20 25 300.0
0.2
0.4
0.6
0.8
1.0NUjij
0 5 10 15 20 250.0
0.2
0.4
0.6
0.8
1.0De Pers
0 5 10 15 20 250.0
0.2
0.4
0.6
0.8
1.0Trouw
0 5 10 15 20 250.0
0.2
0.4
0.6
0.8
1.0Spits
0 5 10 15 20 250.0
0.2
0.4
0.6
0.8
1.0FD
0 5 10 15 20 250.0
0.2
0.4
0.6
0.8
1.0Telegraaf
0 5 10 15 20 250.0
0.2
0.4
0.6
0.8
1.0AD
0 5 10 15 20 25 300.0
0.2
0.4
0.6
0.8
1.0WaarMaarRaar
Figure 6.8: Relative square error using Model 1 (blue line), Model 2 (green line),and Model 3 (red line). Standard deviation is shown in the shaded areas aroundthe lines. QRE on y-axis, indicator time on x-axis.
From the three experimental conditions, M1 proved to underperform in mostcases. M2 and M3 demonstrate similar performance across the board with oneslightly outperforming the other depending on the source. QREs decrease to 0as we move to reference time, followed by a similar decrease in standard error.M2 demonstrates strong predictive performance indicated by low QRE < 0.2 forall sources, in less than 10 hours of observation. The QREs converge to 0 fasterfor some sources and slower for others, exposing the underlying commentingdynamics of each source as discussed earlier.
In this section we looked at natural patterns emerging from news comments,such as the possible correlation of comment counts on news stories between earlyand later publication time. A relation similar to the one observed for Digg andYoutube has been confirmed, allowing us to predict long term comment volumewith very small error. We observed that different news sources ask for differentobservation times before a robust prediction can be made. Using QRE curves onecan find the optimum observation time per source, that balances between shortobservation period and low error.

151 6.6. Conclusions
6.6 Conclusions
In this chapter, we looked at “semi-open” environments which are accessible via aweb browser, however, access to community facilities, e.g., commenting, requireuser registration. We focused on online news agents and the commenting behavioron news articles as an instance of this type of environment. We studied the newscomments space from seven Dutch online news agents, and one collaborative newsplatform and applied our findings on predicting the comment volume of a newsarticle prior to and after publication. Below, we summarize our answers to theresearch questions raised at the beginning of this chapter:
RQ 7. What are the dynamics of user generated comments on newsarticles? Do they follow a temporal cycle?
Commenting behavior in the news comments space followssimilar trends as the behavior in the blogosphere. Our newssources show quite similar temporal cycles and commentingbehavior, but that mainly the differences herein reflect dif-ferences in readers’ demographics and could prove useful infuture research.
RQ 8. Can we fit a distribution model on the volume of news com-ments?
We compared the log-normal and negative binomial distribu-tions for modeling comment volume. These estimated modelscan be used to normalize raw comment counts and enablecomparison, and processing of articles from different newssites. According to a χ2 goodness of fit test, the underlying dis-tribution of news comments matches with either log-normalor negative binomial. The latter is a discrete distributionand suits the task better, yet in our setup log-normal showedsimilar results and parameter estimation for log-normal iscomputationally less expensive.
RQ 9. Can we predict, prior to publication, whether a news storywill receive any comments at all, and if it does, whether thevolume of comments will be low, or high?

6. Commenting Behavior on Online News 152
We have developed a set of surface, cumulative, textual, se-mantic, and real-world features and report on their individualand combined performance on two binary classification tasks:Classify articles according to whether they will (i) generatecomments, and (ii) receive few or many comments. Textualand semantic features prove to be strong performers, and thecombination of all features leads to more robust classification.
RQ 10. Does the correlation between number of responses at earlytime and at later time found in social media such as Diggand Youtube hold for news comments? I.e., are patterns foronline responses potentially “universal”? And can we use thisto predict the number of comments an article will receive,having seen an initial number?
We confirmed the relation between early time and later timein comment volume as it was previously found in diggs andYoutube views. We exploited the potential of this relationusing linear models. Our results showed that prediction ofthe long term comment volume is possible with small errorafter 10 source-hours observation.
In future work, we aim at expanding our news comment prediction work fromindividual news articles to news events, groups of news articles that discuss aparticular real-world event. News events are expected to be more content richand have a longer lifespan than individual news articles. These two characteristicscan prove useful for our prior to and after publication prediction models. Asimilar approach, but in a different setting, has been taken by Mishne and de Rijke(2006a) after they found that predicting the mood of a particular blog post isdifficult (Mishne, 2005), but predicting the mood of the blogosphere, i.e., theaggregation of all blog posts, has proven easier.
In the next chapter, we move to even more “open” environments such as theweb. Here, people are looking for information on a particular news event andinteract with a search engine to find related news articles. Does their searchquest stop short on the first article they read? Or do they follow up with moresearches? This type of question we will try to answer in the next chapter, anddevelop methods for suggesting articles to users with respect to what they haveread so far.
7Context Discovery
in Online News
In Chapter 5 we looked at user behavior in “closed” environments such as iTunes,and in Chapter 6 we followed with modeling user activity patterns in “semi-open” environments such as websites of news agents. In this chapter we expandour study to open environments by looking at user browsing behavior on theweb. Modeling user browsing behavior is an active research area with tangiblereal-world applications, e.g., organizations can adapt their online presence totheir visitors’ browsing behavior with positive effects in user engagement, andrevenue. We concentrate on online news agents, and present a semi-supervisedmethod for predicting news articles that a user will visit after reading an initialarticle. Our method tackles the problem using language intent models—languagemodels that capture readers’ intent—trained on historical data which can copewith unseen articles. We evaluate our method on a large set of articles and inseveral experimental settings. Our results demonstrate the utility of languageintent models for predicting user browsing behavior.
7.1 Introduction
Social media has changed the way news is produced and consumed, with wellestablished news publishers having lost large share of their readers. The continuousdecline in readership is reflected in revenue, urging news publishers to seek newways for monetizing their news articles. One of the many ways to do so is toincrease the amount of time users spend on a news site. Central in achievingan increased user dwelling time within a site’s property is the concept of userengagement (Attfield et al., 2011), or quality of the user experience with anemphasis on the positive aspects of the interaction. Research in this area suggests
153

7. Context Discovery in Online News 154
that enhancing a web page with contextual information has a positive impact onuser engagement (Gamon et al., 2008; Mihalcea and Csomai, 2007). This is a typeof context discovery problem, and a typical approach to it is to enhance a sourcedocument with background information in the form of hyperlinks to or contentfrom a knowledge base (e.g., news, Wikipedia). The majority of these approaches,however, disregards the role of the user in discovering the right context for a webpage which is important in a setting where user goals might change after theuser visits the web page and new content is added continuously. The importanceof browsing behavior as an information gathering activity has been discussedby White et al. (2009).
As a working example, think of a news article announcing a forthcomingfootball game, and one reporting on the results of the game. In the first articlea user might be interested in finding additional information about the teams’setup, whereas in the second they may be more interested in watching the gamehighlights. Other examples are news articles reporting great natural disasters,e.g., Haiti’s earthquake, or the tsunami in Japan, where users might want to seeinformation about emergency services, the Red Cross, or weather reports. Ourfocus is to recommend webpages as part of the context discovery task. In contrastto previous approaches (White et al., 2009) that employ contextual sources formodeling users’ interests, we use only the users’ queries and the contents of thearticles browsed by the users.
The main focus in this chapter is context discovery: for a given news article, andoptionally a user, the system needs to discover webpages that the user is likely tovisit after reading the article. The task is challenging due to data sparsity issuesthat arise from the inherent volatility of the news domain, and the broad range ofpossible user intents, which lead to a heavy tailed distribution of user destinationsafter they visit a news article. To quantify this claim, we conducted an exploratoryexperiment. From a set of user sessions extracted from query logs we identifiedweb pages that are news articles, and classified them into categories, e.g., Science,Business, Entertainment. For each article we recorded the internet domains ofthe web pages that users visited after reading the news article, and assignedthese domains to the article’s news category. We also record the popularity of adomain per category by counting the number of visits to the domain from articlesin that category. Fig. 7.1 illustrates our findings on users’ navigational patternsafter reading web pages in Yahoo! News. Red circles represent news categories,and white to blue shaded circles represent domains (white denotes least popular,and dark blue highly popular). News categories are laid out in space based onhow they are connected to the domains. This results in an inner circle of newscategories which forms a perimeter within which lie domains shared by these newscategories, and outside of it are domains mostly unique to each category. Theouter red dot perimeter includes categories that do not share common domains,

155 7.1. Introduction
Figure 7.1: News categories show distinct patterns of where users navigate nextafter reading a news article. Red circles denote news categories, blue shadedcircles denote internet domains; darker shades represent targets from many newscategories. The two dark blue domains in the middle correspond to Wikipedia,and Yahoo! News.
i.e., Wikipedia, Yahoo! News, search engines, but share one or two rather “unique”domains attached to another category. Our findings suggest that there is a distinctset of domains where people navigate to depending on the category of the newsarticle they read, forming a heavy tailed distribution of user navigational patterns.

7. Context Discovery in Online News 156
A natural way of predicting where a user will navigate next after readinga news article is to use methods from the recommender systems literature tosuggest articles based on what articles users visited in the past. There are severalchallenges, however, given our setting. Most importantly, we are not interestedin recommending articles similar to the one that the user has read, but we wantto recommend articles that provide more context to it, and adapt to the changesthat occur in the user’s cognitive model once the user reads the article. This isan important difference because the recommended articles have the additionalconstraints of topical relatedness, timeliness, and adaptation to the article at hand.For example, when a user reads an article about the tsunami in Japan, we want topresent them with articles about this particular event that add to the informationbeing read, and not articles on tsunamis in other regions in the past. Anotherchallenge arises from the fast paced dynamics of news, which lead to data sparsityand the cold start problem, both of which are known to affect the performance ofrecommender systems (Adomavicius and Tuzhilin, 2005). In Chapter 3 we foundthat news articles attract most attention on the day they are published (we will lookat this phenomenon again later, in Section 7.5), a characteristic that shortens theirexposure time to the public, and reduces the number of views that they receivewith direct effects on the size of available data for training recommender systems.These challenges restrain us from training robust recommendation models forarticles that appear in user sessions, and make online recommendation virtuallyimpossible for articles with no record in user sessions (we have to wait for at leastone user trace).
Our approach to overcome these limitations is to cast the context discoverytask as an information retrieval problem, and develop methods for modeling userbrowsing intent in a query that is issued to an index of candidate news articles.Our methods infer the user navigation patterns by mapping the current article thata user reads to a query into article intent space. Article intent space represents thecontent of articles likely to be clicked after the current one. This approach tacklesboth challenges raised above as follows. First, modeling article intent as proxy foruser browsing intent helps to smooth out data sparsity issues. Second, modelingarticle intent allows for making predictions for unseen articles via the article intentspace.
In this chapter, we seek answers to the following research questions:
RQ 10. What is the effectiveness of language intent models on pre-dicting news articles that a user is likely to read next?
We break down this research question into three sub-questions based on threequery models that we will describe later; using the article the user read first, usingthe article intent model of this article, and using a linear combination of both:
157 7.2. Problem definition
RQ 10/1. What is the retrieval effectiveness of our three query model-ing approaches? And, what is the effect of temporal bias onthe retrieval model?
RQ 10/2. What is the effect on retrieval effectiveness of four weightingschemes for estimating the weights of each model in the linearcombination of article and article intent models?
RQ 10/3. Can retrieval effectiveness be improved if we change the unitof retrieval from articles to article intent models?
The main contribution of this chapter is a model trained on historical data formaking real-time predictions about the browsing patterns of users. The modelrequires little information to be available at prediction time. We envisage our workto have concrete applications in enhancing user experience and engagement viadynamic link suggestion, result recommendation, and personalized web contentoptimization. Such applications can prove valuable to news agents, publishers,and consumers. News providers can leverage this information to generate focusedrecommendations via links to their consumers. In turn, consumers can save timecompleting their goal as relevant hyperlinks, or snippets from likely to visit webpages, and ads can be displayed on the same web page as the article.
The rest of the chapter is organized as follows. We begin formally by definingthe problem in Section 7.2, we outline our approach to it in Section 7.3, present ourmodeling and retrieval methods in Section 7.4 and 7.5, describe our experimentalsetup in Section 7.6, report on our results in Section 7.7, discuss our findings inSection 7.8, and conclude in Section 7.9.
7.2 Problem definition
We cast the problem of context discovery as follows. Given a collection of documentsA, a set of query sessions T , a user query q, and a document d ∈ A that the userread, return a ranked list of documents that a user is likely to read after readingd. Query sessions are records of queries and actions that users perform on websearch engines, and they represent latent information about the users’ interests,preferences, and behaviors (Boldi et al., 2008). The set of query sessions is definedas
T := {(q, d, . . . , o)} ,
where o is either a document or another query.

7. Context Discovery in Online News 158
We reduce the complexity of the problem in two ways. First, we only focuson the news domain. In this respect, documents in A are news articles, and themajority of user queries we deal with is of informational type (Broder, 2002).Second, we focus on methods that use only textual information derived from thecontent of the article. Our motivation for this decision is two-fold. First, we haveseen in Chapters 3 and 4 that the contents of the article lead to good retrievalperformance compared to other modeling approaches, and second, we want ourmethods to be comparable to others where no additional signals are available. Tothis end, we omit information from query logs, or the web graph as signals forranking, e.g., time spent on each document, hyperlinks between the documents.
To make things more tangible, consider a query session from a user u that isfiltered to consist only of queries, and news articles. Let two users u1, and u2 issuethe same informational query q to a search engine, and then click on a retrievednews article, possibly read it, then return to the search results, and click on anotherarticle. In the process, they may choose to refine their query according to thecurrent state of their cognitive model which is now possibly altered after visitingthe clicked news articles. This iterative process is illustrated in the following twotraces, one for each user:
u1 := q1 → d1 → d2 → q2 → d3 → · · · → du1
u2 := q1 → d3 → q2 → d1 → d2 → · · · → du2
We see user u1 issuing a query, then visiting article d1, then going back to theresults page and selecting another article d2. After visiting d2, u1 decided to refinetheir query, issued q2, and continued visiting other articles. A similar processoccurs for user u2, however, the order in which u2 visits the articles is different,and also, the position within the trace of the second query is different. To sum up,the context discovery task is defined as: predict d2, . . . , du (as a set) given q andd1 for a user u.
7.3 Approach
Our approach is to estimate a query model q that reflects the user’s browsing intent,namely, what article the user is likely to read after clicking d1. The rationale is thatwhen q is submitted to an index of articles, a retrieval system will return articlesthat are likely to be read by user uk. To this end, our efforts are concentrated ondefining the query model q.
How do we go about defining q? We build on the idea that deriving modelsfrom the content of articles that follow d1 in user traces can represent user’sbrowsing intent. Such models are likely to capture the relation between content,and patterns of user behavior (which reflect changes in the user’s cognitive model)

159 7.3. Approach
...q1 qn
User trailsPool of news articles
Language Intent Models q
q1
qn
sourcenewsarticle
targetindex
...
multipleresultlists
mergedresultlist
multiplequeries
query modeling retrieving social media fusion
...
Target index
q1
qn
sourcenewsarticle
targetindex
...
multipleresultlists
mergedresultlist
multiplequeries
query modeling retrieving social media fusion
...
q1
qn
sourcenewsarticle
targetindex
...
multipleresultlists
mergedresultlist
multiplequeries
query modeling retrieving social media fusion
...
q1
qn
sourcenewsarticle
targetindex
...
multipleresultlists
mergedresultlist
multiplequeries
query modeling retrieving social media fusion
...
q1
qn
sourcenewsarticle
targetindex
...
multipleresultlists
mergedresultlist
multiplequeries
query modeling retrieving social media fusion
...
Recommendedarticles
q1
Language Intent Models
Figure 7.2: Our approach for recommending articles based on user browsingintent.
via information from the query sessions. In other words, the query sessions definean intent space by linking articles together. We call this type of model article intentmodels (AIMs) because they aggregate the intent of all users that have visited d1.Fig. 7.2 sketches the components of our system.
Articles for which the system will make predictions do not necessarily exist inthe pool of news articles, or have been recorded in user sessions. Without contentfor the article, or articles that users have visited next, it is impossible to derivearticle intent models for these articles. We account for this issue by building onthe assumption that similar articles lead to similar user traces. This way, articlesthat do not occur in user sessions are assigned the intent model of the most similararticle that has one. This idea also helps assigning intent models to previouslyunseen articles, and allows coping with an expanding pool of articles.
With the article intent models in place, we estimate the query q using informa-tion from either the content of the article, its corresponding intent model, or amixture of both. For the latter case, we derive several weighting methods whichare presented in Section 7.4.4.
A retrieval system based on a widely used, state-of-the-art information retrievalmethod receives the query q and returns a ranked list of news articles from anindex. We consider two types of units of retrieval. In the first, articles are the unitof retrieval, and in the second, the unit retrieval is set to article intent models. Thelatter consists of an additional step where the retrieved article intent models aremapped back to news articles.
Given that our system returns articles that the user is likely to visit next, relevantarticles for our task are deemed those that follow d1 in user sessions. In order toensure that the user has read the article in question, we discard articles in whichusers spent less than 30 seconds (Kelly and Belkin, 2004). The system is evaluatedon whether it manages to retrieve these relevant articles in early positions.

7. Context Discovery in Online News 160
Table 7.1: Description of the main symbols we use.
Symbol Gloss
A Pool of news articles in the databaseT Pool of user tracesτk k-th user trace in Tυk User identifier of trace kq Queryd Article in Aw Token in a language modelcθ Article LM trained on contentpθ Article LM trained on personsoθ Article LM trained on organizationslθ Article LM trained on locationstθ Article LM trained on time expressionsθ Article language model vectorθI Article intent model vector (AIM)P (w|θ) Probability of sampling w from article LMP (w) A priori probability of sampling wn(w, d) Frequency of w in articlesKL(·) Symmetric KL divergenceξ Weight parameter for LM linear combination
7.4 Modeling
We present the methods for addressing the steps involved in our approach:(a) model the news article, (b) model article intent, and (c) define a query qfrom the first two steps.
We start with a pool of news articles A := {d1, . . . , dN}, where N is the sizeof the pool, and a set T := {τ1, . . . , τK} of user traces τk := (uk, q, d1, . . . , dlk),similar those described in Section 7.2, with 1 ≤ k ≤ K and K is the total numberof user traces in our database. uk is an anonymized user identifier, and lk is thelength of the k-th user trace in clicks. Table 7.1 contains a list of symbols usedthroughout this chapter.
7.4.1 Article models
An article d is represented as a vector of language models θ drawn from φ differentdistributions, each one defined over its own event space. For achieving a rich

161 7.4. Modeling
representation of the textual content of the article, we focus on three families ofsources for learning language models: (i) the unigrams of the news article, (ii) thenamed entities therein, and (iii) the time expressions mentioned in the article. Wemotivate the use of each source in turn.
Article content The body of the news article itself is an important source ofinformation for training language models that represent it; this is what our experi-mental results suggest in Chapter 3 and 4, and also previous work in probabilisticmodeling for retrieval (Ponte and Croft, 1998; Zhai and Lafferty, 2004). We followthe findings from Chapter 3, and use the contents of article body, and title fortraining a unigram language model.
Named entities A great majority of news articles refers to people, organizations,and locations. To this extent, we extract named entities from news articles, andtrain a language model per named entity type, i.e., persons, organizations, andlocations. The rationale behind is that if an article focuses on a particular namedentity, the named entity will occur many times in the article, resulting in a languagemodel that emits this named entity with high probability.
Temporal expressions Real world events are central to news reporting, andnews articles connect the development of events through time expressions, e.g.,“last week,” “in one month.” Using time expressions can help identify articles thatdiscuss the same time period of an event (Kanhabua et al., 2011). We group timeexpressions into three classes, i.e., past, present, and future relative to the article’spublication date. A language model trained on time expressions consists of thesethree classes, and the probability of emitting a class is proportional to the numberof time expressions that belong to this class.
For every article d in A we train a language model for each of the threesources we described above: the article content, the named entities, and thetemporal expressions. We assume that each article is drawn from three multinomialdistributions, each one defined over its own event space E of token occurrences w.We smooth the number of times a token w is present in the article using Dirichletsmoothing, thus defining the probability of a token w to be generated from thelanguage model θ as:
P (w|θ) =n(w, d) + µP (w)
|d|+ µ,
where n(w, d) is the frequency of token w in d, |d| is the article length in to-kens, P (w) is the a priori probability of w, and µ the Dirichlet smoothing hyper-parameter (Zhai and Lafferty, 2004).
7. Context Discovery in Online News 162
7.4.2 Article intent models
Next, we move from the article space to the intent space using the user traces inT . An article intent model (AIM) θI for an article d aggregates the intent of allusers who read d by using the articles that the users read after d as proxy. Moreformally, θI is defined as the combination of the language models of the articlesusers browsed afterwards,
θI =
K∑k=1
lk∑i=j
λ(i)θi,
where j is the position of d in trace τk, and λ(i) is a weighting function dependenton the position of an article within τk. λ(i) is likely to be a exponential decayfunction, however, due to the sparseness of the dataset we set it to be uniformover all article models.
Noise in query logs (Silverstein et al., 1999), along with data sparsity, i.e., thesmall number of articles users visit after reading a news article (see Section 7.6 fora description of our dataset) can lead to poor estimation of article intent models.To account for this effect, we describe a method for assigning more than one AIMto an article. We work as follows. First, we compute the pairwise similarity of allarticles in the pool for which we can compute article intent models, i.e., the articleappears in user traces and users have visited other articles afterwards. Then, weassign each article d a vector V of tuples that consist of an article intent modelalong with the similarity scores between the article intent model’s associated articleand d:
V :=⟨
(1,θI), . . . , (sν ,θIν)⟩,
where (1,θI) denotes the article intent model associated with d, and (sν ,θIν)
corresponds to article dν which is sν similar to d by the Kullback-Leibler divergencebetween θ and θnu (see Section 7.5), and has an intent model θIν .
Intent models for unseen articles The method we developed so far requiresthat an article d is known (i.e., is an element of A) and have been visited at leastonce (i.e., is an element of T ). In many situations, however, these constraints arenot met (think of a new incoming article without logged visits) and the projectionof an article to intent space becomes impossible. Our next step is to refine ourmethod to work under these relaxed conditions.
The key idea is that users reading similar articles are likely to have similarintent, and therefore produce similar traces. Practically, it means that an unseen, orunvisited article that is similar to some degree to an article that has an associated

163 7.4. Modeling
article intent model, can also be associated with that article intent model. Wecontinue with a formal approach for projecting unseen, or unvisited articles tointent space.
Let d be an article with no AIM associated with it. We want to find articlessimilar to αn for which there exist AIMs, for estimate an article intent model for αn.We begin with the first step. If the intent models are generated from an unknowndata distribution P (ΘI), our goal is to find a model θI that maximizes:
P (θIn) =
∫P (θIn|Θ
I)P (θI)dΘI .
We approximate the integral using the finite set of intent models generated fromthe articles in A:
|A|∑j=1
P (θIj )P (θI |θIj ).
There are several possibilities for selecting θIj . One is to assume that documentswith similar language models have similar intent models, and therefore P (θIn|θ
Ij ) ∝
sim(θn|θj). The selected article index is, then, the one that maximizes
j = argmaxj∈{0,...,|A|}
(sim(θ|θj)). (7.1)
The similarity function we use for sim() is the standard symmetric KL-divergence(defined in Section 7.5). In practice, we create an index of all article models in A,and rank them given θ as query.
Now that we know the most similar article αj to α, a straightforward wayto project the later to intent space is to use αj ’s associated article intent model:
θI
= θIj . However, this direct association discards any semantic differences thatexist between the two articles, and implies that, in the intent space, both articlesare identical. We try to prevent this by smoothing θIj with information from θ. Wedo so using a linear combination of the two models:
θI = ξθI
+ (1− ξ)θ,
where ξ is a parameter defining the weight of each language model.
7.4.3 Query models
In the previous sections we have presented our approach to training article models,and article intent models. Next, we move on to show how to use these models for

7. Context Discovery in Online News 164
estimating a query q that captures user intent for a user who has issued a query qand read the article d. A straightforward way to go about q is to think of both q,and d as representative for the user’s intent. In this respect, q is written as:
qART := ρqθq + (1− ρq)∑
i∈{c,p,o,l,t}
κi · iθ, (7.2)
where ART denotes that the estimation of the query is based on the article model ofd and the language model of the issued query q, ρq stands for the weight assignedto the query language model θq, and κi denotes the weights for the different articlelanguage models iθn, i.e., content, named entities, and temporal expressions.
A closer look at (7.2) reveals that this type of query model has limited scope formodeling user intent due to the little amount of information available for training.We foresee the quality of the recommendations to be bound by the semanticsimilarity between the input and the available articles, possibly constraining theuser to a low diversity set of recommendations; the so-called “filter bubble” (Flederand Hosanagar, 2007; Herlocker et al., 2004; Pariser, 2011; Zhang et al., 2012).Although this mechanism can serve certain user groups well, it ignores users whoare interested in reading other aspects of the initial article, or in finding additional,not directly related, information to it. How can we get the best of both worlds inone query model?
We hypothesize that article intent models can help reduce the effects of the“filter bubble” and provide more diverse recommendations because they built onwhat other users have read in the past. In this respect, we estimate the query qAIM
from the article intent models associated with d:
qAIM :=
|V |∑ν
βν ·∑
i∈{c,p,o,l,t}
κi · iθI , (7.3)
where AIM denotes the estimation of the query based on article intent models,V is a vector with article intent models for d, and βν is a weight for each articleintent model in V .
So, are we done? In a scenario where AIMs are trained on unlimited data,they are expected to be promising surrogates for user intent. However, in practiceAIMs are trained on the limited data available in query logs, where noise and datasparsity are typical. These two issues can introduce topical drift in the trainingprocess with negative effects on the recommendation power of the AIMs, andtherefore on the recommendation quality if AIMs were to replace article models inq. We account for this potential issue by estimating q as a mixture model of theuser’s query, the first article they read, and the article intent models of the first

165 7.4. Modeling
article. We define the mixture model qART+AIM as:
qART+AIM := βinc qART + qAIM
= βinc qART +
|Vn|∑ν=1
βν ·∑
i∈{c,p,o,l,t}
κi · iθIn, (7.4)
where βinc is the weight regulating the importance of the user’s query and the firstread article.
7.4.4 Weighting schemes
The query models presented in (7.2)–(7.4) have a number of parameters thatneed to be estimated, and a typical approach to it is to use methods for super-vised learning. In particular, without imposing any restriction on the number ofparameters, the model could assign one weight per article in every user trace,which asks for significant amounts of training data. This requirement renderssupervised learning unsuitable for an online setting, where the pool of articlesexpands continuously, or where (labeled) training data is scarce. The approacheswe describe next aim at overcoming this problem by producing the query mixturemodel qART+AIM without the need for training. They build on knowledge derivedfrom the distribution of similarities between the θIn vectors. The hypothesis is thatthe semantic similarity between an incoming article and its intent models is a goodsurrogate for regulating weights in query mixture models. In the next paragraphs,we describe five strategies that create query mixture models for an article model,using one or several article intent models. We separate the two cases of one andmany article intent models because of the implications in weighting.
Merge We begin with a simple approach, namely, assign no weights to thearticle or to its article intent models, but merge their contents before traininglanguage models for content, named entities, and temporal expression. This canbe generalized for any number of article intent models we want to consider.
Pairwise This technique considers mixture models for an article and its mostsimilar article intent model. We assign the incoming article model weight βinc =1− sν , and the article intent model the weight βν = sν , where 0 ≤ sν ≤ 1 is thesemantic similarity between them. We also try the reverse, namely, the incomingarticle weight is set to βinc = sν , and the article intent model weight is set toβν = 1− sν . We refer to this second approach as Pairwise-R.

7. Context Discovery in Online News 166
Average When it comes to adding more than one AIM to the mixture model, weneed to decide on a weight for d, while βν = sν . One way is to assume that thelanguage model of the incoming article is an article intent model trained only onitself, resulting in a weight of 1. Then, we enforce the constraint that all weightssum up to 1:
βinc + β1 + · · ·+ βν = 1,
where βinc = 1, which transforms the weights to:
β′ν =sν
1 + s1 + · · ·+ sν.
Median The previous approach makes the assumption that an article model issemantically identical to an article intent model. We relax this assumption byweighting the incoming article proportionally to the set of its article intent models.The weights of similar article intent models show a broad range of values, thereforetheir median value can be a good indicator for weighting the incoming article. Inother words, if the median value is high, then we give preference to the articleintent models as they are likely to bear more information, and vice-versa, if themedian value is low, then we give preference to the incoming article as it is likelyto be more informative for retrieval. Formally:
βinc = 1−m({β1 + · · ·+ βν}),
where m() is the median value.
7.5 Retrieval
All the formulations—of defining a query model, i.e., qART , qAIM , qART+AIM—that we presented so far build comparable model representations. In order toretrieve articles, represented by either their language or intent models, as aresponse to a query q we use the symmetric Kullback-Leibler divergence. This is,given two vectors of models θt and θn we compute a score as
score(θt||θn) := sKL(θt|θn) (7.5)
=∑
vc∈{c,p,o,l,t}
[∑w
P (w|vcθt) logP (w|vcθt)P (w|vcθn)
+∑w
P (w|vcθn) logP (w|vcθn)
P (w|vcθt)
],
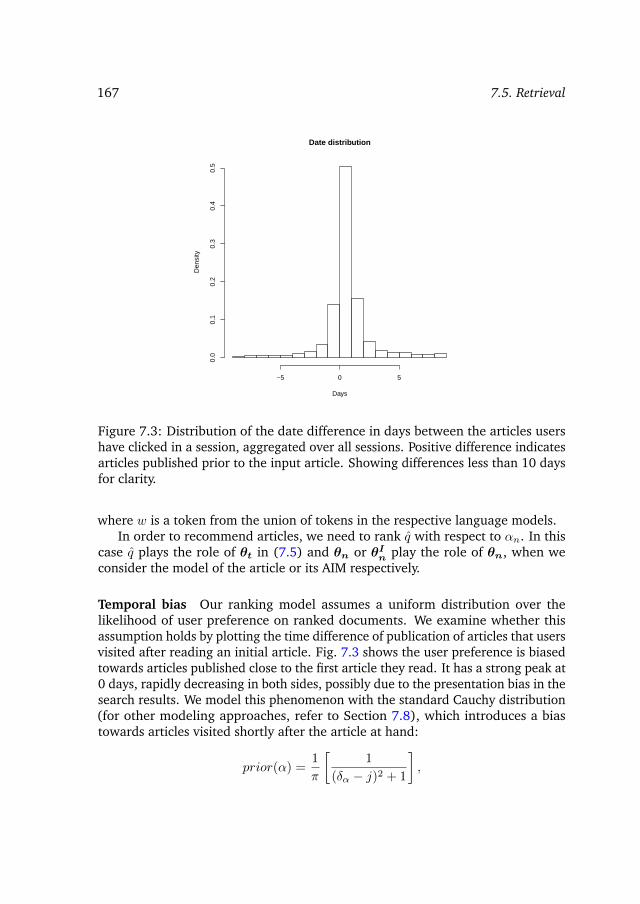
167 7.5. Retrieval
Date distribution
Days
Den
sity
−5 0 5
0.0
0.1
0.2
0.3
0.4
0.5
Figure 7.3: Distribution of the date difference in days between the articles usershave clicked in a session, aggregated over all sessions. Positive difference indicatesarticles published prior to the input article. Showing differences less than 10 daysfor clarity.
where w is a token from the union of tokens in the respective language models.In order to recommend articles, we need to rank q with respect to αn. In this
case q plays the role of θt in (7.5) and θn or θIn play the role of θn, when weconsider the model of the article or its AIM respectively.
Temporal bias Our ranking model assumes a uniform distribution over thelikelihood of user preference on ranked documents. We examine whether thisassumption holds by plotting the time difference of publication of articles that usersvisited after reading an initial article. Fig. 7.3 shows the user preference is biasedtowards articles published close to the first article they read. It has a strong peak at0 days, rapidly decreasing in both sides, possibly due to the presentation bias in thesearch results. We model this phenomenon with the standard Cauchy distribution(for other modeling approaches, refer to Section 7.8), which introduces a biastowards articles visited shortly after the article at hand:
prior(α) =1
π
[1
(δα − j)2 + 1
],

7. Context Discovery in Online News 168
where α is an article, δα is the publication time difference between α and αn, andj = 0 because of Fig. 7.3.
7.6 Experimental setup
In this section we describe our research questions, experiments, dataset andevaluation methodology. Our main research question we aim to answer is whetherour query models can help in the task of context discovery. We study this questionin the following three dimensions:
RQ 10/1. What is the effect on retrieval effectiveness of query models trained onthe source article, the source article’s intent models, and their combination?What is the effect of temporal bias on the retrieval model?
RQ 10/2. What is the effect in performance of our four weighting schemes, i.e.,Merge, Pairwise, Average, Median?
RQ 10/3. Can retrieval effectiveness be improved if we change the unit of retrievalfrom articles to article intent models?
To answer these research questions, we proceed as follows. First, we compare thethree query models we presented in Section 7.4.3 which use either the query andthe incoming article, or the article’s intent model, or their combination. We studythe effect of temporal bias in retrieval performance using retrieval models withand without temporal priors. Next, we focus on weighting schemes for generatingthe query mixture models, and compare each of them. Finally, we change ourindex from articles to article intent models, and use our query models to retrievearticle intent models which are then mapped to articles in a post-retrieval stage.
In Table 7.2 we list the alternatives we consider, along with their correspondingfeatures. Runs that use only the article for modeling the query are denotedwith ART, those using only article intent models are marked as AIM, and theircombination as ART + AIM. Query models on temporally biased retrieval modelshave a superscript T, and different weighting methods are denoted in the subscript.For example, ART + AIMT
M is a query model that uses both the incoming articleand the article intent models using the Median weighting method, on a temporallybiased retrieval model.
7.6.1 Dataset
Our dataset consists of 14,180 news articles from Yahoo! News published inFebruary 2011, and a parallel corpus of query logs from Yahoo! Search. We applyseveral preprocessing steps. We extract named entities using the SuperSense

169 7.6. Experimental setup
Table 7.2: Retrieval models we consider.Input model
Model Temp.Prior Article # AIM Enhanced Weighting Eq.
Models retrieve articlesART — X — No — (7.2)ARTT X X — No — (7.2)AIM — — 1 No — (7.3)AIMT X — 1 No — (7.3)ART+AIM — X 1 No Merge (7.4)ART+AIMT X X 1 No Merge (7.4)ART+AIMT
P X X 1 No Pairwise (7.4)ART+AIMT
PR X X 1 No Pairwise-R (7.4)ART+AIMT
A X X N No Average (7.4)ART+AIMT
M X X N No Median (7.4)
Models retrieve AIMsAIM−AIM — — 1 No —AIM−AIMe — — 1 Yes —
tagger,1 and time expressions using the TARSQI Toolkit.2 The query stream issegmented into several sets of related information-seeking queries, i.e., logicalsessions using the technique in (Boldi et al., 2008). The logical sessions are prunedto contain only queries and articles that exist in our article dataset.
Our experiments include a training, and a testing phase. We use 75% of thelogical sessions for training article intent models for 3,060 articles, and use theremaining 25% as ground truth for 434 query test articles.
7.6.2 Evaluation
We assemble our ground truth as follows. From the logical sessions in the testset we consider the first user query and article in the session as our input, andconsider every following article as relevant to this input. This process results in aground truth of 511 relevant documents for 434 queries (max/min/avg: 3/1/1.18relevant articles per query).
In our experiments we work as follows. Given a user’s query and an article, wegenerate a query q with our methods which we then use to retrieve articles fromeither an index of articles, or article intent models. We treat the user query andthe input article equally, i.e., we set ρq = 0.5 in (7.2). For query mixture models,
1http://sourceforge.net/projects/supersensetag – accessed October 28, 20122http://www.timeml.org/site/tarsqi/ – accessed October 28, 2012

7. Context Discovery in Online News 170
we consider one article intent model, the most similar to the input article.For our experiments we use the Indri framework (Metzler and Croft, 2004). We
set the weights in an independent held-out data-set as follows: for named entitiesto 0.1, for temporal expressions to 0.1, and for the article content to 0.6. Thesmoothing parameter for Dirichlet smoothing is set to µ = 2, 500, except otherwisestated. For articles without article intent models, we set ξ = 0.5. We report onstandard IR measures: precision at 5 (P@5), mean reciprocal rank (MRR), meanaverage precision (MAP), and r-precision (Rprec). Statistical significance is testedusing a two-tailed paired t-test and is marked as N (or H) for significant differencesfor α = .01, or M (and O) for α = .05.
7.7 Results and analysis
In this section we report on the results of our three experiments: (a) query modelsand temporal bias in retrieval, (b) weighting schemes for generating query mixturemodels, and (c) retrieval on article intent model index.
RQ 10/1. In our first experiment, we test our three query modeling methods wedescribed in Section 7.4.3: (a) the incoming article (ART), (b) the article intentmodels (AIM), and (c) their combination (ART + AIM). These models are testedon two retrieval models, one with, and one without temporal bias. Our baseline isset to the method that uses only the incoming article (AIM, and ARTT).
Table 7.3 lists the performance of these systems with (top-half) and with-out (bottom-half) temporal bias in the retrieval process. In the retrieval settingwithout temporal bias, the baseline proves strong, and outperforms both AIM,and ART + AIM. In the retrieval setting with temporal bias the picture changes.ARTT outperforms AIM in MAP, MRR, and P@5. ART + AIMT, the combinationof incoming article, and the most similar article intent model, yields the best run,and outperforms the baseline in all metrics, statistically significantly so.
We explain the lower performance of AIM, and AIMT (using only articleintent models) by the fact that both models are dependent on the similarityof the incoming article to the article intent model. This dependency results inmany instances to model the incoming user query–article pair with article intentmodels that are topically far away from the input pair. This sensitivity is smoothedout successfully in ART + AIMT where content from the input pair reduces thepotential topical drift from the article intent model.
RQ 10/2. In our second experiment we compare the effect of the weightingmethods in Section 7.4.4. We set the baseline to the best run so far, ART + AIMT,which uses uniform weights. The retrieval method is temporally biased.
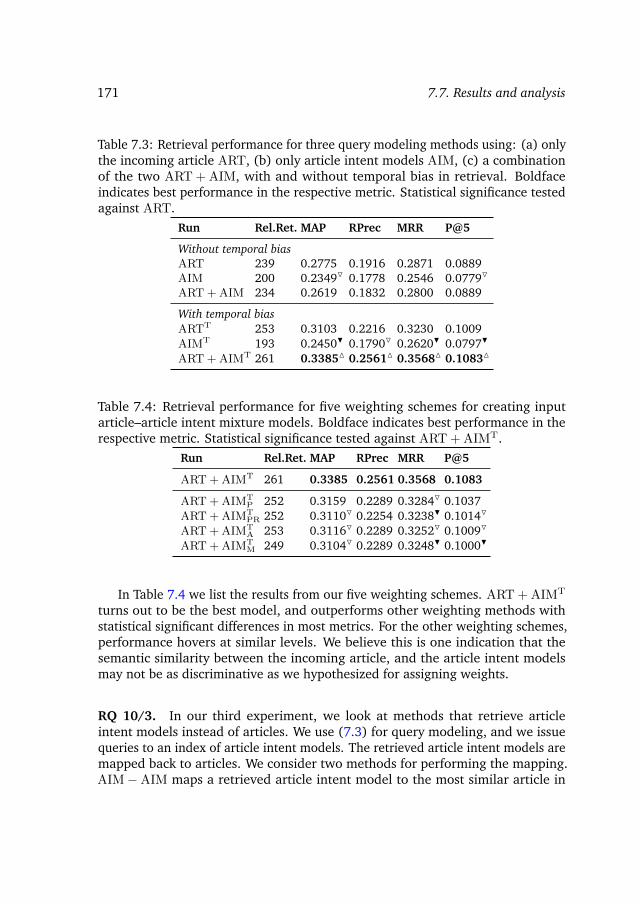
171 7.7. Results and analysis
Table 7.3: Retrieval performance for three query modeling methods using: (a) onlythe incoming article ART, (b) only article intent models AIM, (c) a combinationof the two ART + AIM, with and without temporal bias in retrieval. Boldfaceindicates best performance in the respective metric. Statistical significance testedagainst ART.
Run Rel.Ret. MAP RPrec MRR P@5
Without temporal biasART 239 0.2775 0.1916 0.2871 0.0889AIM 200 0.2349O 0.1778 0.2546 0.0779O
ART+AIM 234 0.2619 0.1832 0.2800 0.0889
With temporal biasARTT 253 0.3103 0.2216 0.3230 0.1009AIMT 193 0.2450H 0.1790O 0.2620H 0.0797H
ART+AIMT 261 0.3385M 0.2561M 0.3568M 0.1083M
Table 7.4: Retrieval performance for five weighting schemes for creating inputarticle–article intent mixture models. Boldface indicates best performance in therespective metric. Statistical significance tested against ART + AIMT.
Run Rel.Ret. MAP RPrec MRR P@5
ART+AIMT 261 0.3385 0.2561 0.3568 0.1083
ART+AIMTP 252 0.3159 0.2289 0.3284O 0.1037
ART+AIMTPR 252 0.3110O 0.2254 0.3238H 0.1014O
ART+AIMTA 253 0.3116O 0.2289 0.3252O 0.1009O
ART+AIMTM 249 0.3104O 0.2289 0.3248H 0.1000H
In Table 7.4 we list the results from our five weighting schemes. ART + AIMT
turns out to be the best model, and outperforms other weighting methods withstatistical significant differences in most metrics. For the other weighting schemes,performance hovers at similar levels. We believe this is one indication that thesemantic similarity between the incoming article, and the article intent modelsmay not be as discriminative as we hypothesized for assigning weights.
RQ 10/3. In our third experiment, we look at methods that retrieve articleintent models instead of articles. We use (7.3) for query modeling, and we issuequeries to an index of article intent models. The retrieved article intent models aremapped back to articles. We consider two methods for performing the mapping.AIM−AIM maps a retrieved article intent model to the most similar article in

7. Context Discovery in Online News 172
Table 7.5: Retrieval performance for two systems retrieving article intent models,and then mapping them to articles.
Run MAP RPrec MRR P@5
AIM−AIM 0.1664 0.1025 0.1821 0.0659AIM−AIMe 0.1431 0.0895 0.1608 0.0512
the dataset, and AIM−AIMe maps a retrieved article intent model to the I mostsimilar articles.
Table 7.5 lists the performance of the two methods. AIM−AIM achieveshigher scores than AIM−AIMe, however, the differences are not statistically sig-nificant. We explain this from the additional number of articles per returned articleintent model that AIM−AIMe returns which can hurt performance especially inprecision oriented metrics.
Although the results obtained here are not directly comparable to those re-ported for retrieving articles because we are using a different index (an index ofarticle intent models instead of article models), we observe a decrease in perfor-mance compared to those from methods that directly retrieve articles. We identifytwo reasons for the decrease in performance. First, moving from an input articleto an article intent model is an error prone process because it is based on querylogs that can be noisy and introduce topical drift. This issue was also evident inour first experiment where we used only article intent models for query modeling.Then, when we move back from the retrieved intent models to articles, additionalnoise accumulates multiplying the negative effects in retrieval effectiveness.
In sum, our experiments demonstrate the validity of our hypotheses (that combin-ing the information from article and article intent models can improve retrievaleffectiveness), and the utility of our query models to capture user intent for pre-dicting articles that a user will visit next. The most successful strategy is to useinformation from both the input query and article, and article intent models forquery modeling. For mixing the two sources, uniform weighting proves the mosteffective. Performance is further improved with the use of temporally biasedretrieval models.
7.8 Discussion
To better understand the performance of our methods, we perform an analysis inthe following directions: (a) temporal modeling, (b) the number of article intentmodels we consider, and (c) parameter optimization.
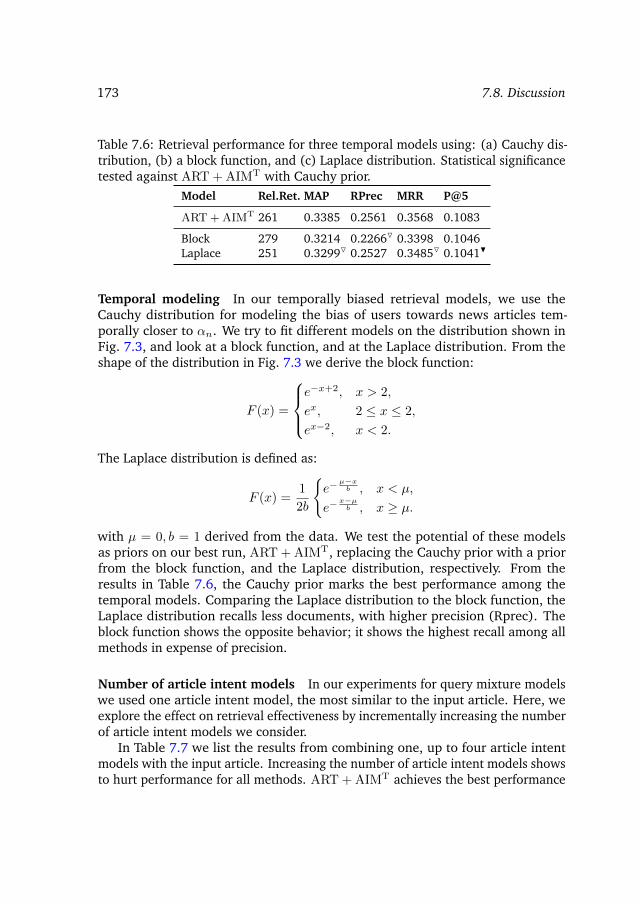
173 7.8. Discussion
Table 7.6: Retrieval performance for three temporal models using: (a) Cauchy dis-tribution, (b) a block function, and (c) Laplace distribution. Statistical significancetested against ART + AIMT with Cauchy prior.
Model Rel.Ret. MAP RPrec MRR P@5
ART+AIMT 261 0.3385 0.2561 0.3568 0.1083
Block 279 0.3214 0.2266O 0.3398 0.1046Laplace 251 0.3299O 0.2527 0.3485O 0.1041H
Temporal modeling In our temporally biased retrieval models, we use theCauchy distribution for modeling the bias of users towards news articles tem-porally closer to αn. We try to fit different models on the distribution shown inFig. 7.3, and look at a block function, and at the Laplace distribution. From theshape of the distribution in Fig. 7.3 we derive the block function:
F (x) =
e−x+2, x > 2,
ex, 2 ≤ x ≤ 2,
ex−2, x < 2.
The Laplace distribution is defined as:
F (x) =1
2b
{e−
µ−xb , x < µ,
e−x−µb , x ≥ µ.
with µ = 0, b = 1 derived from the data. We test the potential of these modelsas priors on our best run, ART + AIMT, replacing the Cauchy prior with a priorfrom the block function, and the Laplace distribution, respectively. From theresults in Table 7.6, the Cauchy prior marks the best performance among thetemporal models. Comparing the Laplace distribution to the block function, theLaplace distribution recalls less documents, with higher precision (Rprec). Theblock function shows the opposite behavior; it shows the highest recall among allmethods in expense of precision.
Number of article intent models In our experiments for query mixture modelswe used one article intent model, the most similar to the input article. Here, weexplore the effect on retrieval effectiveness by incrementally increasing the numberof article intent models we consider.
In Table 7.7 we list the results from combining one, up to four article intentmodels with the input article. Increasing the number of article intent models showsto hurt performance for all methods. ART + AIMT achieves the best performance

7. Context Discovery in Online News 174
Table 7.7: MAP scores for three weighting schemes for combining one to fourarticle intent models with the incoming article.
# Article intent modelsModel 1 2 3 4
ART+AIMT 0.3385 0.2276 0.1878 0.1764ART+AIMT
A 0.3116 0.3106 0.3141 0.3037ART+AIMT
M 0.3104 0.3107 0.3085 0.2990
across the board for N = 1. Each method peaks at different number of articleintent models; ART + AIMT
A peaks at N = 3, and ART + AIMTM at N = 2. The
differences in performance at various N , however, for the latter two models aresmall.
The performance of ART + AIMT decreases quickly as N increases. A possibleexplanation is that this is due to the uniform weights assigned to the input articleand to the article intent models. Uniform weights allow article intent models thatare topically far away from the input article to be weighted equally, multiplying theeffects of topical drift. The weighting schemes of ART + AIMT
A and ART + AIMTM
manage to account for this effect and show relatively stable performance for all N .
Parameter optimization Finally, we explore the effect of the language modelsmoothing parameter on retrieval effectiveness. In our particular setting, the querymodels are much longer compared to traditional web search queries because theycontain the entire contents of news articles, and for query mixture models, theycontain the contents from several news articles. We perform a parameter sweepon the Dirichlet smoothing parameter µ for two runs: ART, and ART + AIMT.Fig. 7.4 illustrates the retrieval performance in MAP over µ. The performanceremains stable across a large range of values. We believe this is due to the largesize of the query, which lessens the effects of smoothing.
7.9 Conclusions and outlook
Following up the studies in the previous two chapters, in this chapter we lookedat user behavior in “open” environments, where users are browsing the web foronline news to fulfill an information need. We looked at this type of behaviorthrough the lens of the context discovery task: given a query from a user, and thefirst article they visit, the system recommends articles that the user may want tovisit next. The task takes place in near real-time, and systems need to suggest
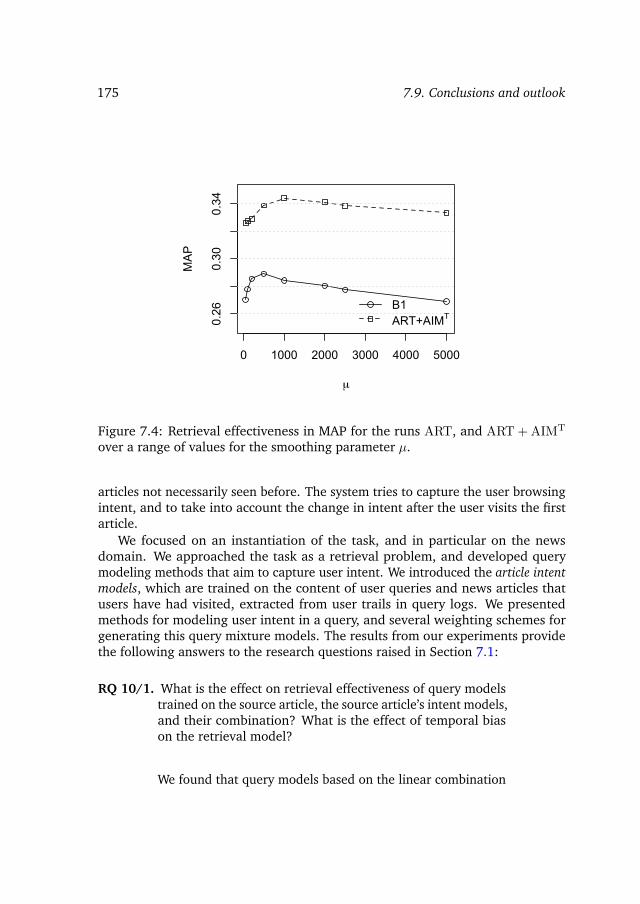
175 7.9. Conclusions and outlook
0 1000 2000 3000 4000 5000
0.26
0.30
0.34
µ
MAP
B1ART+AIMT
Figure 7.4: Retrieval effectiveness in MAP for the runs ART, and ART + AIMT
over a range of values for the smoothing parameter µ.
articles not necessarily seen before. The system tries to capture the user browsingintent, and to take into account the change in intent after the user visits the firstarticle.
We focused on an instantiation of the task, and in particular on the newsdomain. We approached the task as a retrieval problem, and developed querymodeling methods that aim to capture user intent. We introduced the article intentmodels, which are trained on the content of user queries and news articles thatusers have had visited, extracted from user trails in query logs. We presentedmethods for modeling user intent in a query, and several weighting schemes forgenerating this query mixture models. The results from our experiments providethe following answers to the research questions raised in Section 7.1:
RQ 10/1. What is the effect on retrieval effectiveness of query modelstrained on the source article, the source article’s intent models,and their combination? What is the effect of temporal biason the retrieval model?
We found that query models based on the linear combination
7. Context Discovery in Online News 176
of models trained on the source article, and the source article’sintent models using temporal bias lead to the best retrievalperformance.
RQ 10/2. What is the retrieval effect on performance of our weightingschemes?
Uniform weights over the individual query models outperformother weighting schemes. In terms of the number of articleintent models to include in the query model, we found thatusing one article intent model leads to the best performance.
RQ 10/3. Can retrieval effectiveness be improved if we change the unitof retrieval from articles to article intent models?
Our experiments showed that using article intent modelsas unit of retrieval is unable to outperform retrieval usingarticles as unit of retrieval. We believe this discrepancy is dueto the additional noise that is being introduced when movingfrom the intent space to the article space.
In future work, we envisage to enhance our query modeling methods withmore elaborate term selection and weighting schemes. Also, given that our querymodels are of similar length to the documents to be retrieved, it is particularlyinteresting to us to study the effect on retrieval performance after changing theKullback-leibler retrieval model to one of the hypergeometric retrieval modelswe presented in Chapter 4. Further, we plan on extending our query models forincremental updating so we are able to make suggestions given parts of a user trail.Finally, we would like to validate the models presented here with a user-basedstudy, to determine whether the effect of the suggestions produce any behavioraldifference in human readers. We believe this line of work is useful to online newsagents for increasing the user engagement of their web presence.
With this chapter we complete the second part of the thesis which focusedon predicting behavior. What follows is a summary of this, and the previous twochapters before we move to the conclusions and future research directions.
Conclusion to Part II
In the second part of this thesis, we looked at the research theme of predictingbehavior in three types of environment: “closed,” “semi-open,” and “open” throughthe lens of an equal number of prediction tasks. In Chapter 5 we analyzed whatmakes people prefer a podcast over another in iTunes. This analysis allowedus to extract features from the podcast feeds for predicting podcast preference.We found that the presence of a logo in a podcast feed, and regular releasesof episodes are the most important features for a podcast to become popularin iTunes. Next, in Chapter 6, we focused on “semi-open” environments, andanalyzed the commenting behavior on news articles. We analyzed comments fromseven Dutch news agents, and one collaborative news platform. We discoveredcircadian patterns in the volume of comments, similar to those found in otheronline activities, and developed methods for predicting the volume of commentsbefore and after a news article is published. We found that prediction prior topublication is harder than prediction after publication, and that the predictionaccuracy depends on the news source. Finally, in Chapter 7, in the setting of “open”environments, we looked at the browsing behavior of users who search the webfor online news with an informational need. We found that users are most likelyto read news ±3 days from the publication date of the article they choose to readfirst. We developed methods for recommending articles to these users based onwhat they and others have previously read. Our results showed that the mosteffective way to model browsing behavior is to combine the article that a userreads first with the article’s intent model, and bias retrieval towards documentsthat were published close to the user’s first read article. In the next chapter, wepresent our conclusions and future directions of the work that we presented inboth Parts I and II.
177


8Conclusions
This thesis revolved around two research themes: tracking content and predictingbehavior in social media. Tracking content is key for automating online reputationmanagement, and providing opinion mining, and sentiment analysis with moredata. Predicting behavior can help website owners to optimize the layout of theirfrontpages, ad placement and pricing, and increase user engagement.
For tracking content, we focused on tracking online news in social media, anddeveloped effective and robust methods for discovering social media utterancesthat implicitly discuss a news article. For predicting behavior, we analyzed userbehavior, and developed methods for prediction for three tasks: podcast preference,comment volume, and news articles recommendation. Below, we revisit, andprovide answers to the research questions we raised in Section 1.1.
8.1 Main findings
In Chapter 3 we casted tracking content as a linking generation task where weaimed to discover implicitly linked social media utterances for a source newsarticle. We asked the following questions:
RQ 2. What is the effect on retrieval effectiveness from using het-erogeneous channels of information for modeling a sourcearticle?
We found that query models trained on the contents and thetitle of a news article achieve the best retrieval performance inprecision oriented metrics. Query models trained on explicitlylinked social media utterances underperform in precision, buthelp increase recall.
179
8. Conclusions 180
RQ 3. Can we achieve better effectiveness when using late datafusion methods for merging the returned ranked lists frommodels trained on different channels?
We experimented unweighted, and weighted late data fusionmethods. We estimated weights in a query-dependent, andquery-independent fashion. We found that the WcombMNZfusion method using query-independent weight optimizationoutperforms individual query models in precision orientedmetrics, and significantly increases recall by 24%. We foundinteresting that in terms of recall, round-robin fusion boostsrecall by 25%.
Summing up, as to RQ 1 as a whole—What is the retrieval effectiveness of modelingsource articles using different strategies for retrieving implicitly linked socialmedia utterances?—, we found that full articles combined with term selection andnormalized result fusion achieved very high levels of effectiveness.
In the process of answering RQ 1, we discovered that query model length issimilar to the length of documents to be retrieved. This characteristic lead us torevisit the assumptions made in retrieval methods based on standard languagemodeling. We studied this phenomenon under the lens of republished articlefinding (Chapter 4), where given the contents of a news article a system returnsrepublished versions of the article found in blog posts. We proposed modelingqueries (news articles) and documents (blog posts) using two hypergeometricdistributions, and introduced three retrieval methods. To this extent, we asked:
RQ 4. What is the retrieval effectiveness of hypergeometric languagemodels compared to standard language models for the taskof republished article finding?
We looked at two hypergeometric distributions for modelingqueries and documents: the central, and non-central hyperge-ometric distribution. The main difference between the two isthat central hypergeometric distribution makes the assump-tion of term independence, while the non-central allows forterm bias. Our experiments showed that using the centralhypergeometric distribution leads to better retrieval effective-ness. The lower scores from non-central may be due to howwe modeled term bias, an issue we want to further pursue inthe future; see below.

181 8.1. Main findings
RQ 5. What are optimal smoothing methods for hypergeometriclanguage models? We propose, and compare three smoothingtechniques using: log-odds, Jelinek-Mercer smoothing, andBayesian inference.
We presented three smoothing methods for retrieval modelsbased on hypergeometric distributions, one task-driven (logodds), one using Jelinek-Mercer, and one more elaborate us-ing Bayesian inference. Our experiments showed that logodds smoothing outperforms standard language modelingretrieval methods, and the Bayesian retrieval method is onpar with them. In the later, we found that the Dirichlet com-pound multinomial distribution (DCM) arises naturally forestimating the parameters of a document model. This is animportant finding because it links central hypergeometric toDCM as multinomial is linked to Dirichlet. DCM has beenderived in the past from hierarchical Bayesian modeling tech-niques as a better model to Dirichlet (Elkan, 2006; Madsenet al., 2005; Xu and Akella, 2008).
Answering the first five research questions concludes Part I. So far, we havedeveloped effective and robust methods for tracking online news in social media.In the domain of blog posts, bloggers post verbatim or near-verbatim copies of anews article, we introduced retrieval methods based on hypergeometric languagemodels which improve retrieval when the query and documents to be retrieved areof similar length. Our tracking content methods can be used for automating onlinereputation management, and providing opinion mining, and sentiment analysismethods with more data.
Next, we proceed with providing answers to research questions with regardsto predicting behavior. In Part II, we studied user behavior in three types ofenvironments, “closed,” “semi-open,” and “open” via the lens of an equal numberof prediction tasks. In “closed” environments where users have to install proprietarysoftware to access and interact with content, we studied podcast preference iniTunes. In “semi-open” environments where users need to visit a website andpossibly register before they can interact with content, we studied the commentingbehavior on websites of online news agents. In “open” environments where usersbrowse the web for finding information, we studied user browsing behavior ononline news. Below, we revisit the findings of each of these three studies.
We begin with research questions related to podcast preference.

8. Conclusions 182
RQ 6 Can surface features be used to predict podcast preference?
Surface features can be successfully exploited to predict pod-cast preference, making it possible to avoid deeper processing,e.g., computationally expensive analysis of the podcast audiofile. Podcast preference can be predicted using “snapshot”information derived from a single crawl of the feed, how-ever, “cumulative” information requiring repeated visits of thecrawler also makes an important contribution. The best fea-ture sets consists of a combination of feed-level and episodeand enclosure-level features.
We follow up with a study on online news agents and the commenting behavioron news articles as an instance of “semi-open” environments. We studied the newscomments space from seven Dutch online news agents, and one collaborative newsplatform and applied our findings on predicting the comment volume of a newsarticle prior to and after publication. Below, we summarize our answers to theresearch questions:
RQ 7. Do patterns of news commenting behavior exist? And if theydo, how can they be used for predicting how much attentiona news article will attract?
Commenting behavior in the news comments space followssimilar trends as the behavior in the blogosphere. Our newssources show quite similar temporal cycles and commentingbehavior, but that mainly the differences herein reflect differ-ences in readers’ demographics and could prove useful in fu-ture research. For modeling comment volume, we comparedthe log-normal and negative binomial distributions. Theseestimated models can be used to normalize raw commentcounts and enable comparison, and processing of articlesfrom different news sites. According to χ2 goodness of fittest, the underlying distribution of news comments matcheswith either log-normal or negative binomial. The latter is adiscrete distribution and suits the task better, yet in our setuplog-normal showed similar results and parameter estimationfor log-normal is computationally less expensive.
183 8.1. Main findings
RQ 8. Among textual, semantic, and real-world sets of features, andtheir combination, which leads to the best prediction accuracyfor prior to publication prediction of volume of comments?
We have developed a set of surface, cumulative, textual, se-mantic, and real-world features and report on their individualand combined performance on two binary classification tasks:Classify articles according to whether they will (i) generatecomments, and (ii) receive few or many comments. Textualand semantic features prove to be strong performers, and thecombination of all features leads to more robust classification.
RQ 9. What is the prediction accuracy for predicting volume ofcomments after publication? How observation time correlateswith prediction accuracy?
We confirmed the relation between early time and later timein comment volume as it was previously found in diggs andYoutube views. We exploited the potential of this relationusing linear models. Our results showed that prediction ofthe long term comment volume is possible with small errorafter 10 source-hours observation.
Finally, we look at user behavior in “open” environments. An example of thistype of user behavior is when users search the web for online news to fulfill aninformation need. We examine this scenario via a context discovery task wheresystems take into account the user’s query and the first article that the user readfor recommending articles that a user may want to visit next. The main researchquestion we aimed to answer is the following.
RQ 10. What is the effectiveness of language intent models on pre-dicting news articles that a user is likely to read next?
We defined three query models based on (i) the user queryand the first article, (ii) the article intent model of the firstquery, and (iii) a linear combination of the previous twomodels. Article intent models aggregate the intent of all usersthat visited an article and as such aim to capture the user
8. Conclusions 184
browsing behavior with regards to this article.
We confirmed our hypothesis that using the combination ofthe query-article model and the article intent model improveretrieval effectiveness. We found that users are most likely tovisit articles that are one day before or after the first articlethey read—possibly due to presentation bias in the searchresults. This led us to enhance our retrieval with tempo-ral priors which boosted retrieval performance even further.We experimented with four methods for estimating the linearcombination weights and found that uniform weights for boththe query-article model and the article model outperform allother weight estimation methods. Finally, we experimentedwith different units of retrieval, i.e., articles and article intentmodels, and found that using articles as unit of retrieval out-performs systems that retrieve article intent models. However,article intent models are beneficial in the query side.
Our study of user behavior in “open” environments concludes the research ques-tions we raised in Part II. We have summarized our findings for both trackingcontent, and predicting behavior, which open opportunities for future research.We present our future research endeavors in the next section.
8.2 Future directions
In this section, we discuss two future research directions that stem from the workthat has been presented so far: topic detection and tracking, and informationretrieval in social media.
Topic detection and tracking Most of our work in Chapters 3, 4, and 6 havefocused on individual news articles either for tracking or prediction. A naturalextension to this line of work is think about applying these methods to newsevents—groups of news articles that refer to the same real-world event. Trackingnews events has been extensively researched in Topic Detection and Tracking(TDT) (Allan, 2002), however, social media bring in new research opportuni-ties (Chua et al., 2011; Sakaki et al., 2010). From the many research outcomes ofTDT, two are most relevant to us: (a) it is difficult to define the start and the end ofa news event because events evolve over time, and (b) the news articles within anevent can use different language leading to poor performance of similarity methods

185 8.2. Future directions
based on language redundancy. The first problem is an annotation problem, whilethe second is a representation problem.
For the annotation problem, social media can provide an automatic way forgenerating the required ground truth. For example, on Twitter, people annotatetheir tweets with hashtags which are a kind of topical annotation. If a hashtagis considered as an event, then aggregating the hyperlinks in tweets annotatedwith a particular hashtag can result in the ground truth for the event representedby the hashtag. Although data sparsity can be a potential issue, this method cangenerate training data for learning a cut-off threshold which is crucial in bothtopic tracking and first story detection; for example, Berendsen et al. (2012) useda similar approach for training a learning to rank system. For the representationproblem, our methods in Chapter 3 can be used for enhancing the news articlerepresentation with comments, and other explicitly linked social media utterancesfor smoothing low language redundancy issues. Also, since topic tracking is basedon the content similarity between two news articles which are likely to be of similarlength, the hypergeometric retrieval models presented in Chapter 4 can provebeneficial in this type of task.
We follow up on news events from the perspective of prediction. In Chapter 6we focused on predicting the volume of comments on individual news articles.Similar as above, an next step is to extend our methods for predicting the volumeof comments, or other types of social media utterance for news events whichconsist of news articles from multiple news agents. This type of prediction alongwith predicting sentiment or opinion from explicitly linked social media utterancescan provide a handle for gauging the future impact of news events. A tool built onthis technology will enable media analysts to track the evolution of impact—or itsindividual dimensions, e.g., sentiment—around a news event and explain changesin impact over time by identifying individual news articles.
Information retrieval A recurring outcome from our work in Chapters 6 and7 is that time is an important parameter in social media retrieval tasks. Notonly because content evolves rapidly, but also because user behavior changestoo. The temporal dependence of these two dimensions, i.e., content and userbehavior, raise new challenges for information retrieval tasks in social media. Withmost content in social media focusing on “what is happening now,” the classicdefinition of relevance is not longer applicable because a document is deemedrelevant regardless of when it was published. An example is a user searching for[earthquake] and is presented with a ranked list of utterances some of which referto an earthquake that happened a few hours ago, and some to one that happeneda year ago. Are the utterances referring to the past earthquake still relevant? Itdepends on whether the user is issuing a standing query or a retrospective query.In the former case, utterances about the past earthquake should be deemed non-

8. Conclusions 186
relevant, while in the latter case, all utterances are relevant. System evaluationin this type of dynamic setting is an open problem mainly because it involvesassessing the returned documents at multiple times.
Another challenge for information retrieval in social media is content repre-sentation. Query expansion has been found beneficial for IR in microblog searchby several independent researchers (Efron et al., 2012; Lin et al., 2012; Massoudiet al., 2011). However, current methods are based on the popularity of termswhich ignore nascent topics. This behavior can be harmful to real-time searchbecause when a new event breaks out there is little consensus on how to referto it. Query expansion methods can be helpful here and facilitate establishing aconsensus earlier.
We described directions for future work along two dimensions: topic detectionand tracking, and information retrieval in social media. The methods and theoutcomes of the work presented in this thesis are applicable in other social mediatasks where it is critical to model time and social buzz.

Bibliography
O. Abdel-Hamid, B. Behzadi, S. Christoph, and M. R. Henzinger. Detecting the origin of text segmentsefficiently. In Proceedings of the 18th World Wide Web Conference, pages 61–70, New York, NY, USA,2009. ACM. (Cited on page 20.)
F. Abel, Q. Gao, G.-J. Houben, and K. Tao. Semantic Enrichment of Twitter Posts for User ProfileConstruction on the Social Web. In Proceedings of the 8th Extended Semantic Web Conference (ESWC2011), pages 375–389, Berlin / Heidelberg, 2011. Springer. (Cited on page 14.)
B. Adams, D. Phung, and S. Venkatesh. Social Reader: Towards Browsing the Social Web. MultimediaTools and Applications, pages 1–40, 2012. (Cited on page 11.)
E. Adar, L. Zhang, L. Adamic, and R. Lukose. Implicit Structure and Dynamics of Blogspace. In WWW2004 Third Annual Workshop on the Weblogging Ecosystem: Aggregation, Analysis and Dynamics(WWE 2004), New York, NY, USA, 2004. ACM. (Cited on page 20.)
G. Adomavicius and A. Tuzhilin. Toward the Next Generation of Recommender Systems: A Survey ofthe State-of-the-Art and Possible Extensions. IEEE Transactions on Knowledge and Data Engineering,17(6):734–749, June 2005. (Cited on page 156.)
E. Agichtein, E. Brill, and S. Dumais. Improving Web Search Ranking by Incorporating User BehaviorInformation. In Proceedings of the 29th International ACM SIGIR Conference on Research and Develop-ment in Information Retrieval (SIGIR 2006), pages 19–26, New York, NY, USA, 2006. ACM. (Citedon page 24.)
E. Agichtein, C. Castillo, D. Donato, A. Gionis, and G. Mishne. Finding High-Quality Content in SocialMedia, With An Application to Community-based Question Answering. In Proceedings of the 1st ACMInternational Conference on Web Search and Data Mining (WSDM 2008), pages 183–194, New York,NY, USA, 2008. ACM. (Cited on pages 23 and 108.)
Y.-Y. Ahn, S. Han, H. Kwak, S. Moon, and H. Jeong. Analysis of Topological Characteristics of HugeOnline Social Networking Services. In Proceedings of the 16th international conference on World WideWeb (WWW 2007), pages 835–844, New York, NY, USA, 2007. ACM. (Cited on page 10.)
A. Alhadi, T. Gottron, J. Kunegis, and N. Naveed. LiveTweet: Microblog Retrieval Based on Interest-ingness and an Adaptation of the Vector Space Model. In The Twentieth Text REtrieval ConferenceProceedings (TREC 2011), Gaithersburg, USA, 2011. NIST. (Cited on page 19.)
J. Allan. Automatic Hypertext Construction. PhD thesis, Cornell University, 1995. (Cited on page 19.)J. Allan, editor. Topic Detection and Tracking: Event-based Information Organization. Kluwer Academic
Publishers, 2002. (Cited on pages 19, 30, 41, 69, and 184.)O. Alonso, M. Gertz, and R. Baeza-Yates. On the Value of Temporal Information in Information Retrieval.
SIGIR Forum, 41(2):35–41, Dec. 2007. (Cited on page 13.)O. Alonso, M. Gertz, and R. Baeza-Yates. Enhancing Document Snippets Using Temporal Information.
In String Processing and Information Retrieval (SPIRE 2011), pages 26–31, Berlin / Heidelberg, 2011.Springer. (Cited on page 13.)
D. L. Altheide. Qualitative Media Analysis (Qualitative Research Methods). Sage Publications, 1996.(Cited on page 126.)
G. Amati. Frequentist and Bayesian Approach to Information Retrieval. In Advances in InformationRetrieval - 28th European Conference on IR Research (ECIR 2006), pages 13–24, Berlin / Heidelberg,2006a. Springer. (Cited on pages 17 and 59.)
G. Amati. Information Theoretic Approach to Information Extraction. In Flexible Query AnsweringSystems (FQAS 2006), pages 519–529. Springer, Berlin / Heidelberg, 2006b. (Cited on page 18.)
A. Arampatzis, T. v. d. Weide, C. Koster, and P. v. Bommel. Text Filtering Using Linguistically–motivatedIndexing Terms. Technical report, Nijmegen, The Netherlands, 1999. (Cited on page 13.)
187
Bibliography 188
Arbitron/Edison. The podcast consumer revealed 2008: The Arbitron/Edison internet and multimediastudy, 2008. URL http://www.edisonresearch.com/2008_Edison_Arbitron_Podcast_Report.
pdf. (Cited on page 88.)J. Arguello, J. L. Elsas, J. Callan, and J. G. Carbonell. Document Representation and Query Expansion
Models for Blog Recommendation. In Proceedings of the 2nd International Workshop on Weblogs andSocial Media (ICWSM 2008). AAAI Press, 2008. (Cited on page 14.)
Y. Artzi, P. Pantel, and M. Gamon. Predicting Responses to Microblog Posts. In Proceedings of the2012 Conference of the North American Chapter of the Association for Computational Linguistics:Human Language Technologies (NAACL HLT 2012), pages 602–606, Montreal, Canada, June 2012.Association for Computational Linguistics. (Cited on page 11.)
A. Ashkan, C. L. Clarke, E. Agichtein, and Q. Guo. Classifying and Characterizing Query Intent. InAdvances in Information Retrieval - 31nd European Conference on IR Research (ECIR 2009), pages578–586, Berlin / Heidelberg, 2009. Springer. (Cited on page 25.)
S. Asur and B. A. Huberman. Predicting the Future with Social Media. In Proceedings of the 2010IEEE/WIC/ACM International Conference on Web Intelligence and Intelligent Agent Technology (WI-IAT’10), pages 492–499, Washington, DC, USA, 2010. IEEE Computer Society. (Cited on page 11.)
J. Attenberg, S. Pandey, and T. Suel. Modeling and Predicting User Behavior in Sponsored Search.In Proceedings of the 15th ACM SIGKDD International Conference on Knowledge Discovery and DataMining, pages 1067–1076, New York, NY, USA, 2009. ACM. (Cited on page 3.)
S. Attfield, G. Kazai, M. Lalmas, and B. Piwowarski. Towards a Science of User Engagement. In WSDM2011 Workshop on User Modeling for Web Applications, New York, NY, USA, February 2011. (Citedon page 153.)
L. Backstrom, D. Huttenlocher, J. Kleinberg, and X. Lan. Group Formation in Large Social Networks:Membership, Growth, and Evolution. In Proceedings of the 12th ACM SIGKDD International Conferenceon Knowledge Discovery and Data Mining, pages 44–54, New York, NY, USA, 2006. ACM. (Cited onpage 10.)
L. Backstrom, P. Boldi, M. Rosa, J. Ugander, and S. Vigna. Four Degrees of Separation. CoRR,abs/1111.4570, 2011. (Cited on page 10.)
K. Balog, G. Mishne, and M. de Rijke. Why Are They Excited?: Identifying and Explaining Spikesin Blog Mood Levels. In Proceedings of the 11th Conference of the European Chapter of the Associ-ation for Computational Linguistics, pages 207–210, Stroudsburg, PA, USA, 2006. Association ofComputational Linguistics. (Cited on page 12.)
K. Balog, M. Bron, J. He, K. Hofmann, E. Meij, M. de Rijke, E. Tsagkias, and W. Weerkamp. TheUniversity of Amsterdam at TREC 2009: Blog, Web, Entity, and Relevance feedback. In TheSeventeenth Text REtrieval Conference Proceedings (TREC 2008), Gaithersburg, USA, 2009a. NIST.(Cited on page 8.)
K. Balog, J. He, K. Hofmann, V. Jijkoun, C. Monz, E. Tsagkias, W. Weerkamp, and M. de Rijke. TheUniversity of Amsterdam at WePS2. In WWW 2009 Second Web People Search Evaluation Workshop(WEPS 2009), New York, NY, USA, 2009b. ACM. (Cited on page 8.)
R. Bandari, S. Asur, and B. A. Huberman. The Pulse of News in Social Media: Forecasting Popularity.CoRR, abs/1202.0332, 2012. (Cited on page 24.)
A. Barron-Cedeno, P. Rosso, and J.-M. Benedı. Reducing the Plagiarism Detection Search Space onthe Basis of the Kullback-Leibler Distance. In Proceedings of the 10th International Conference onComputational Linguistics and Intelligent Text Processing (CICLing ’09), pages 523–534, Berlin /Heidelberg, 2009. Springer. (Cited on page 69.)
H. Becker. Identification and Characterization of Events in Social Media. PhD thesis, Columbia University,2011. (Cited on page 12.)
H. Becker, M. Naaman, and L. Gravano. Learning Similarity Metrics for Event Identification in SocialMedia. In Proceedings of the 3rd ACM International Conference on Web Search and Data Mining(WSDM 2010), pages 291–300, New York, NY, USA, 2010. ACM. (Cited on page 30.)
S. Beitzel, E. Jensen, A. Chowdhury, D. Grossman, O. Frieder, and N. Goharian. Fusion of EffectiveRetrieval Strategies in the Same Information Retrieval System. Journal of the American Society for
189 Bibliography
Information Science and Technology (JASIST), 55:859–868, 2004. (Cited on page 16.)N. Belkin, P. Kantor, E. Fox, and J. Shaw. Combining the Evidence of Multiple Query Representations
for Information Retrieval. Information Processing and Management (IPM), 31:431–448, 1995. (Citedon pages 15 and 50.)
A. Bell. The Language of News Media. Language in Society. Blackwell, Oxford, September 1991. (Citedon page 30.)
M. Bendersky and W. B. Croft. Finding Text Reuse on the Web. In Proceedings of the 2nd ACMInternational Conference on Web Search and Data Mining (WSDM 2009), pages 262–271, New York,NY, USA, 2009. ACM. (Cited on page 21.)
K. Berberich, S. Bedathur, O. Alonso, and G. Weikum. A Language Modeling Approach for TemporalInformation Needs. In Advances in Information Retrieval - 32nd European Conference on IR Research(ECIR 2010), pages 13–25, Berlin / Heidelberg, 2010. Springer. (Cited on page 13.)
R. Berendsen, E. Tsagkias, M. de Rijke, and E. Meij. Generating Pseudo Test Collections for Learningto Rank Scientific Articles. In Information Access Evaluation. Multilinguality, Multimodality, andVisual Analytics (CLEF 2012), pages 42–53. Springer, Berlin / Heidelberg, 2012. (Cited on pages 8and 185.)
J. Besser. Incorporating User Search Goal Analysis in Podcast Retrieval Optimization. Master’s thesis,Saarland University, 2008. (Cited on pages 91 and 95.)
M. Bilenko and R. W. White. Mining the Search Trails of Surfing Crowds: Identifying Relevant WebsitesFrom User Activity. In Proceedings of the 17th international conference on World Wide Web (WWW2008), pages 51–60, New York, NY, USA, 2008. ACM. (Cited on page 24.)
P. Boldi, F. Bonchi, C. Castillo, D. Donato, A. Gionis, and S. Vigna. The Query-flow Graph: Model andApplications. In Proceedings of the 17th ACM International Conference on Information and KnowledgeManagement (CIKM 2008), pages 609–618, New York, NY, USA, 2008. ACM. (Cited on pages 157and 169.)
J. Bollen, H. Mao, and X. Zeng. Twitter Mood Predicts the Stock Market. Journal of ComputationalScience, 2(1):1–8, 2011. (Cited on page 12.)
A. A. Bolourian, Y. Moshfeghi, and C. J. V. Rijsbergen. Quantification of Topic Propagation UsingPercolation Theory: A Study of the ICWSM Network. In Proceedings of the 3rd International Workshopon Weblogs and Social Media (ICWSM 2009). AAAI Press, 2009. (Cited on page 11.)
E. Bothos, D. Apostolou, and G. Mentzas. Using Social Media to Predict Future Events with Agent-BasedMarkets. IEEE Intelligent Systems, 25(6):50–58, Nov. 2010. (Cited on page 23.)
T. Brants. Natural Language Processing in Information Retrieval. In Computational Linguistics in theNetherlands (CLIN 2003). University of Antwerp, 2003. (Cited on page 13.)
F. Bravo-Marquez, G. L’Huillier, S. Rıos, and J. Velasquez. Hypergeometric Language Model and Zipf-Like Scoring Function for Web Document Similarity Retrieval. In String Processing and InformationRetrieval (SPIRE 2010), pages 303–308, Berlin / Heidelberg, 2010. Springer. (Cited on page 17.)
F. Bravo-Marquez, G. L’Huillier, S. A. Rıos, and J. D. Velasquez. A text similarity meta-search enginebased on document fingerprints and search results records. In Proceedings of the 2011 IEEE/WIC/ACMInternational Conference on Web Intelligence and Intelligent Agent Technology (WI-IAT ’11), pages146–153, Washington, DC, USA, 2011. IEEE Computer Society. (Cited on page 17.)
L. Breiman. Random forests. Machine Learning, 45(1):5–32, Oct. 2001. (Cited on page 138.)A. Broder. On the Resemblance and Containment of Documents. In Proceedings of the Compression and
Complexity of Sequences (SEQUENCES 1997), Washington, DC, USA, 1997. IEEE Computer Society.(Cited on page 21.)
A. Broder. A Taxonomy of Web Search. SIGIR Forum, 36:3–10, September 2002. (Cited on pages 24and 158.)
A. Z. Broder, S. C. Glassman, M. S. Manasse, and G. Zweig. Syntactic Clustering of the Web. ComputerNetwork and ISDN Systems, 29(8-13):1157–1166, 1997. (Cited on page 137.)
M. Bron, J. He, K. Hofmann, E. Meij, M. de Rijke, E. Tsagkias, and W. Weerkamp. The University ofAmsterdam at TREC 2010: Session, Entity, and Relevance feedback. In The Nineteenth Text REtrievalConference Proceedings (TREC 2010), Gaithersburg, USA, 2011a. NIST. (Cited on page 8.)

Bibliography 190
M. Bron, B. Huurnink, and M. de Rijke. Linking Archives Using Document Enrichment and TermSelection. In Research and Advanced Technology for Digital Libraries (ECDL 2011), pages 360–371,Berlin / Heidelberg, 2011b. Springer. (Cited on page 19.)
M. Bron, E. Meij, M. Peetz, M. Tsagkias, and M. de Rijke. Team COMMIT at TREC 2011. In TheTwentieth Text REtrieval Conference Proceedings (TREC 2011), Gaithersburg, USA, 2011c. NIST. (Citedon page 19.)
L. Calderon-Benavides, C. Gonzalez-Caro, and R. Baeza-Yates. Towards a Deeper Understanding of theUser’s Query Intent. Search, pages 1–4, 2010. (Cited on page 24.)
P. Cao, J. Gao, Y. Yu, S. Liu, Y. Liu, and X. Cheng. ICTNET at Microblog Track TREC 2011. In TheNineteeth Text REtrieval Conference Proceedings (TREC 2010), Gaithersburg, USA, 2011. NIST. (Citedon page 19.)
D. Carmel, H. Roitman, and E. Yom-Tov. On the Relationship Between Novelty and Popularity ofUser-generated Content. In Proceedings of the 19th ACM International Conference on Information andKnowledge Management (CIKM 2010), pages 1509–1512, New York, NY, USA, 2010. ACM. (Cited onpage 23.)
C. Carrick and C. R. Watters. Automatic Association of News Items. Information Processing andManagement, 33(5):615–632, 1997. (Cited on page 20.)
S. Carter, M. Tsagkias, and W. Weerkamp. Twitter hashtags: Joint Translation and Clustering. InProceedings of the 3rd International Conference on Web Science (WebSci 2011), pages 1–3, New York,NY, USA, June 2011. ACM. (Cited on page 8.)
S. Carter, W. Weerkamp, and E. Tsagkias. Microblog Language Identification: Overcoming the Limi-tations of Short, Unedited and Idiomatic Text. Language Resources and Evaluation Journal, 2012.(Cited on page 8.)
I. Celma and Y. Raimond. ZemPod: A Semantic Web Approach to Podcasting. Journal of Web Semantics,6(2):162–169, 2008. (Cited on page 88.)
M. Cha, H. Haddadi, F. Benevenuto, and K. P. Gummadi. Measuring User Influence in Twitter: TheMillion Follower Fallacy. In Proceedings of the 4nd International Workshop on Weblogs and SocialMedia (ICWSM 2010). AAAI Press, May 2010. (Cited on page 11.)
H.-C. Chang, J.-H. Wang, and C.-Y. Chiu. Finding Event-Relevant Content from the Web Using a Near-Duplicate Detection Approach. In IEEE / WIC / ACM International Conference on Web Intelligence (WI2007), pages 291–294, Los Alamitos, CA, USA, 2007. IEEE Computer Society. (Cited on page 20.)
O. Chapelle, S. Ji, C. Liao, E. Velipasaoglu, L. Lai, and S.-L. Wu. Intent-based Diversification of WebSearch Results: Metrics and Algorithms. Information Retrieval, 14(6):572–592, 2011. (Cited onpage 25.)
A. Chen. Cross-language retrieval experiments at clef 2002. In Information Access Evaluation. Multilin-guality, Multimodality, and Visual Analytics (CLEF), pages 28–48, Berlin / Heidelberg, 2002. Springer.(Cited on page 13.)
H. Chen. Collaborative Systems: Solving the Vocabulary Problem. Computer, 27(5):58–66, 1994.(Cited on page 30.)
K. Chen, T. Chen, G. Zheng, O. Jin, E. Yao, and Y. Yu. Collaborative Personalized Tweet Recommendation.In Proceedings of the 35th International ACM SIGIR Conference on Research and Development inInformation Retrieval (SIGIR 2012), pages 661–670, New York, NY, USA, 2012. ACM. (Cited onpage 12.)
S. F. Chen and J. Goodman. An Empirical Study of Smoothing Techniques for Language Modeling.In Proceedings of the 34th annual meeting on Association for Computational Linguistics (ACL 1996),pages 310–318, Stroudsburg, PA, USA, 1996. Association for Computational Linguistics. (Cited onpages 15, 18, and 64.)
M. D. Choudhury, H. Sundaram, A. John, and D. D. Seligmann. What Makes Conversations Interesting?Themes, Participants and Consequences of Conversations in Online Social Media. In Proceedings ofthe 18th international conference on World Wide Web (WWW 2009), pages 331–331, New York, NY,USA, 2009. ACM. (Cited on page 22.)
A. Y. Chua, K. Razikin, and D. H. Goh. Social tags as news event detectors. Journal of Information
191 Bibliography
Science, 37(1):3–18, 2011. (Cited on page 184.)D. S. Chung. Interactive Features of Online Newspapers: Identifying Patterns and Predicting Use of
Engaged Readers. Journal of Computer-Mediated Communication, 13(3):658–679, 2008. (Cited onpage 132.)
D. Cohn and T. Hofmann. The Missing Link – A Probabilistic Model of Document Content andHypertext Connectivity. In Advances in Neural Information Processing Systems (NIPS 2000). MITPress, Cambridge, MA, 2000. (Cited on page 19.)
W. B. Croft and D. J. Harper. Using Probabilistic Models of Document Retrieval Without RelevanceInformation. Journal of Documentation, 35(4):285–295, 1979. (Cited on page 14.)
L. Dabbish, C. Stuart, J. Tsay, and J. Herbsleb. Social coding in GitHub: transparency and collaborationin an open software repository. In Computer Supported Cooperative Work (CSCW 2012), pages1277–1286, New York, NY, USA, 2012. ACM. (Cited on page 9.)
M. De Choudhury, H. Sundaram, A. John, and D. D. Seligmann. Can Blog Communication DynamicsBe Correlated With Stock Market Activity? In Proceedings of the 9th ACM conference on Hypertextand hypermedia (HT 2008), pages 55–60, New York, NY, USA, 2008. ACM. (Cited on page 23.)
C. Dellarocas. The Digitization of Word of Mouth: Promise and Challenges of Online FeedbackMechanisms. Management Science, 49(10):1407–1424, 2003. (Cited on page 56.)
L. Dey and S. K. M. Haque. Studying the effects of noisy text on text mining applications. In Proceedingsof The Third Workshop on Analytics for Noisy Unstructured Text Data (AND 2009), pages 107–114,New York, NY, USA, 2009. ACM. (Cited on page 39.)
F. Diaz and D. Metzler. Improving the Estimation of Relevance Models Using Large External Corpora.In Proceedings of the 29th International ACM SIGIR Conference on Research and Development inInformation Retrieval (SIGIR 2006), pages 154–161, New York, NY, USA, 2006. ACM. (Cited onpage 14.)
D. Domingo, T. Quandt, A. Heinonen, S. Paulussen, J. B. Singer, and M. Vujnovic. ParticipatoryJournalism Practices in the Media and Beyond–An International Comparative Study of Initiatives inOnline Newspapers. Journalism Practice, 2(3):326–342, 2008. (Cited on page 1.)
J. Du, W. Zhang, P. Cai, L. Ma, W. Qian, and A. Zhou. Towards High-Quality Semantic Entity Detectionover Online Forums. In Proceedings of the Third International Conference on Social Informatics (SocInfo2011), pages 287–291. Springer, Berlin / Heidelberg, 2011. (Cited on page 20.)
F. Duarte, B. Mattos, B. A., A. V., and A. J. Traffic Characteristics and Communication Patterns inBlogosphere. In Proceedings of the First International Workshop on Weblogs and Social Media (ICWSM2007). AAAI Press, 2007. (Cited on page 22.)
M. Efron. Information Search and Retrieval in Microblogs. Journal of the American Society forInformation Science and Technolgy, 62:996–1008, June 2011. (Cited on page 19.)
M. Efron and G. Golovchinsky. Estimation methods for ranking recent information. In Proceedings ofthe 34th International ACM SIGIR Conference on Research and Development in Information Retrieval(SIGIR 2011), pages 495–504, New York, NY, USA, 2011. ACM. (Cited on page 19.)
M. Efron, P. Organisciak, and K. Fenlon. Improving Retrieval of Short Texts through Document Expan-sion. In Proceedings of the 35th International ACM SIGIR Conference on Research and Developmentin Information Retrieval (SIGIR 2012), pages 911–920, New York, NY, USA, 2012. ACM. (Cited onpages 19 and 186.)
L. Egghe and R. Rousseau. Duality in Information Retrieval and the Hypergeometric Distribution.Journal of Documentation, 53(5):488–496, December 1997. (Cited on page 17.)
L. Egghe and R. Rousseau. A Theoretical Study of Recall and Precision using a Topological Approach toInformation Retrieval. Information Processing and Management, 34:191–218, January 1998. (Citedon page 17.)
C. Elkan. Clustering Documents with an Exponential-family Approximation of the Dirichlet CompoundMultinomial Distribution. In Proceedings of the 23rd International Conference on Machine Learning(ICML 2006), pages 289–296, New York, NY, USA, 2006. ACM. (Cited on pages 68, 81, and 181.)
J. Elsas, J. Arguello, J. Callan, and J. Carbonell. Retrieval and Feedback Models for Blog Distillation. InThe Sixteenth Text REtrieval Conference Proceedings (TREC 2007), Gaithersburg, USA, 2008. NIST.
Bibliography 192
(Cited on page 18.)D. M. Fleder and K. Hosanagar. Recommender Systems and their Impact on Sales Diversity. In
Proceedings of the 8th ACM conference on Electronic commerce (EC 2007), pages 192–199, New York,NY, USA, 2007. ACM. (Cited on page 164.)
A. Fog. Calculation Methods for Wallenius’ Noncentral Hypergeometric Distribution. Communicationsin Statistics - Simulation and Computation, 37(2):258–273, 2008. (Cited on page 60.)
M. Franz, T. Ward, J. S. McCarley, and W.-J. Zhu. Unsupervised and Supervised Clustering for TopicTracking. In Proceedings of the 24th International ACM SIGIR Conference on Research and Developmentin Information Retrieval (SIGIR 2001), pages 310–317, New York, NY, USA, 2001. ACM. (Cited onpage 19.)
M. Fuller, E. Tsagkias, E. Newman, J. Besser, M. Larson, G. Jones, and M. de Rijke. Using Term Cloudsto Represent Segment-Level Semantic Content of Podcasts. In 2nd SIGIR Workshop on SearchingSpontaneous Conversational Speech (SSCS 2008), 2008. (Cited on page 8.)
G. W. Furnas, T. K. Landauer, L. M. Gomez, and S. T. Dumais. The vocabulary problem in human-systemcommunication. Communications of the ACM, 30(11):964–971, 1987. (Cited on page 30.)
M. Gamon, S. Basu, D. Belenko, D. Fisher, M. Hurst, and A. C. Konig. BLEWS: Using Blogs to ProvideContext for News Articles. In Proceedings of the 2nd International Workshop on Weblogs and SocialMedia (ICWSM 2008), 2008. (Cited on pages 20 and 154.)
J. Gao, H. Qi, X. Xia, and J. yun Nie. Linear discriminant model for information retrieval. In Proceedingsof the 28th International ACM SIGIR Conference on Research and Development in Information Retrieval(SIGIR 2005), pages 290–297, New York, NY, USA, 2005. ACM. (Cited on page 44.)
H. Garcia-Molina, L. Gravano, and N. Shivakumar. dSCAM: Finding Document Copies Across MultipleDatabases. 9th International Conference on Parallel and Distributed Information Systems (PDCS 1996),1996. (Cited on page 20.)
J. Gaugaz, P. Siehndel, G. Demartini, T. Iofciu, M. Georgescu, and N. Henze. Predicting the FutureImpact of News Events. In Advances in Information Retrieval - 34th European Conference on IRResearch (ECIR 2012), volume 7224, pages 50–62. Springer, Berlin / Heidelberg, 2012. (Cited onpage 24.)
M. Geoghegan and D. Klass. Podcast solutions: The Complete Guide to Podcasting. friendsofED, 2005.(Cited on pages 88 and 93.)
S. Geva and A. Trotman. INEX 2010 Link-The-Wiki Track, 2010. http://www.inex.otago.ac.nz/.(Cited on pages 43 and 70.)
G. Ghinea and S. Y. Chen. Measuring Quality of Perception in Distributed Multimedia: Verbalizers vs.Imagers. Computers in Human Behavior, 24(4):1317 – 1329, 2008. (Cited on page 91.)
G. Ghinea and J. Thomas. Quality of Perception: User Quality of Service in Multimedia Presentations.IEEE Transactions on Multimedia, 7(4):786–789, Aug. 2005. (Cited on pages 24 and 124.)
C. Gonzalez-Caro and R. Baeza-Yates. A Multi-faceted Approach to Query Intent Classification. InString Processing and Information Retrieval (SPIRE 2011), pages 368–379, Berlin / Heidelberg, 2011.Springer. (Cited on page 24.)
S. J. Green. Lexical Semantics and Automatic Hypertext Construction. ACM Computing Surveys, 31(4),Dec. 1999. (Cited on page 19.)
D. Gruhl, R. Guha, D. Liben-Nowell, and A. Tomkins. Information Diffusion through Blogspace. InProceedings of the 13th international conference on World Wide Web (WWW 2004), pages 491–501,New York, NY, USA, 2004. ACM. (Cited on page 20.)
D. Gruhl, R. Guha, R. Kumar, J. Novak, and A. Tomkins. The Predictive Power of Online Chatter. InProceedings of the 11th ACM SIGKDD International Conference on Knowledge Discovery and DataMining, pages 78–87, New York, NY, USA, 2005. ACM. (Cited on pages 11, 23, and 126.)
J. Guo, X. Cheng, G. Xu, and X. Zhu. Intent-aware Query Similarity. In Proceedings of the 20th ACMInternational Conference on Information and Knowledge Management (CIKM 2011), pages 259–268,New York, NY, USA, 2011. ACM. (Cited on page 25.)
M. Hall and L. Smith. Practical Feature Subset Selection for Machine Learning. In Computer Science’98. Proceedings of the 21st Australasian Computer Science Conference (ACSC’98), pages 181–191,

193 Bibliography
Brisbane, Australia, 1998. Australian Computer Society. (Cited on page 110.)B. He and I. Ounis. Combining Fields for Query Expansion and Adaptive Query Expansion. Information
Processing & Management, 43(5):1294 – 1307, 2007. (Cited on page 17.)D. He and D. Wu. Toward a Robust Data Fusion for Document Retrieval. In The 2008 IEEE Interna-
tional Conference on Natural Language Processing and Knowledge Engineering (IEEE NLP-KE 2008),Washington, DC, USA, 2008. IEEE Computer Society. (Cited on pages 40 and 44.)
J. He, M. Larson, and M. de Rijke. Using Coherence-based Measures to Predict Query Difficulty. InAdvances in Information Retrieval - 30th European Conference on IR Research (ECIR 2008), pages689–694, Berlin / Heidelberg, April 2008. Springer, Springer. (Cited on page 108.)
J. He, K. Balog, K. Hofmann, E. Meij, M. de Rijke, E. Tsagkias, and W. Weerkamp. Heuristic Rankingand Diversification of Web Documents. In Proceedings of the Eighteenth Text REtrieval Conference(TREC 2009), Gaithersburg, USA, 2010. NIST. (Cited on page 8.)
J. He, M. de Rijke, M. Sevenster, R. van Ommering, and Y. Qian. Generating Links to BackgroundKnowledge: A Case Study using Narrative Radiology Reports. In Proceedings of the 20th ACMInternational Conference on Information and Knowledge Management (CIKM 2011), pages 1867–1876,New York, NY, USA, 2011. ACM. (Cited on page 19.)
M. A. Hearst. Untangling Text Data Mining. In Proceedings of the 37th annual meeting of the Associationfor Computational Linguistics on Computational Linguistics (ACL 2009), pages 3–10, Stroudsburg, PA,USA, 1999. Association for Computational Linguistics. (Cited on page 9.)
V. Heffernan. The Podcast as a New Podium. The New York Times, July 2005. (Cited on pages 88and 89.)
M. Henzinger. Finding Near-Duplicate Web Pages: A Large-Scale Evaluation of Algorithms. In Proceed-ings of the 29th International ACM SIGIR Conference on Research and Development in InformationRetrieval, pages 284–291, New York, NY, USA, 2006. ACM. (Cited on page 69.)
M. Henzinger, B.-W. Chang, B. Milch, and S. Brin. Query-Free News Search. World Wide Web, 8(2):101–126, June 2005. (Cited on page 20.)
J. L. Herlocker, J. A. Konstan, L. G. Terveen, and J. T. Riedl. Evaluating Collaborative FilteringRecommender Systems. ACM Transactions on Information Systems, 22(1):5–53, Jan. 2004. (Citedon page 164.)
D. Hiemstra. A Linguistically Motivated Probabilistic Model of Information Retrieval. In Proceedings ofthe 2nd European Conference on Research and Advanced Technology for Digital Libraries (ECDL 1998),pages 569–584, Berlin / Heidelberg, 1998. Springer. (Cited on page 17.)
D. Hiemstra and W. Kraaij. Twenty-One at TREC-7: Ad-hoc and Cross-Language Track. In The Seven-teenth Text REtrieval Conference Proceedings (TREC 1999), volume 500 of NIST Special Publications,pages 227–238, Gaithersburg, USA, 1999. NIST. (Cited on page 59.)
B. Hilligoss and S. Y. Rieh. Developing a Unifying Framework of Credibility Assessment: Construct,Heuristics, and Interaction in Context. Information Processing and Management, 44(4):1467–1484,2007. (Cited on pages 91 and 97.)
K. Hofmann, M. Tsagkias, E. Meij, and M. de Rijke. The Impact of Document Structure on KeyphraseExtraction. In Proceedings of the 18th ACM conference on Information and knowledge management(CIKM 2009), pages 1725–1728, New York, NY, USA, 2009. ACM. ISBN 978-1-60558-512-3. (Citedon page 8.)
V. Hollink, J. Kamps, C. Monz, and M. de Rijke. Monolingual Document Retrieval for EuropeanLanguages. Information Retrieval, 7:33–52, 2004. (Cited on page 13.)
M. Hu, S. Liu, F. Wei, Y. Wu, J. Stasko, and K.-L. Ma. Breaking News on Twitter. In ACM SIGCHIConference on Human Factors in Computing Systems (CHI 2012), pages 2751–2754, New York, NY,USA, 2012. ACM. (Cited on page 12.)
B. A. Huberman, D. M. Romero, and F. Wu. Social Networks that Matter: Twitter under the Microscope.First Monday, 14(1), 2009. Online. (Cited on page 10.)
D. Ikeda, T. Fujiki, and M. Okumura. Automatically Linking News Articles to Blog Entries. In AAAISpring Symposium: Computational Approaches to Analyzing Weblogs (AAAI-CAAW 2006), 2006. (Citedon pages 20, 30, 57, and 68.)

Bibliography 194
B. J. Jansen, D. L. Booth, and A. Spink. Determining the Informational, Navigational, and TransactionalIntent of Web Queries. Information Processing and Management, 44(3):1251–1266, 2008. (Cited onpage 24.)
B. J. Jansen, M. Zhang, K. Sobel, and A. Chowdury. Twitter Power: Tweets as Electronic Word ofMouth. Journal of the American Society for Information Science, 60(11):2169–2188, 2009. (Cited onpages 10 and 56.)
A. Java, X. Song, T. Finin, and B. Tseng. Why We Twitter: Understanding Microblogging Usage andCommunities. In Proceedings of the 9th WebKDD and 1st SNA-KDD 2007 Workshop on Web Miningand Social Network Analysis, pages 56–65, New York, NY, USA, 2007. ACM. (Cited on page 10.)
F. Jelinek. Statistical Methods for Speech Recognition. MIT Press, 1997. (Cited on page 16.)V. Jijkoun, M. A. Khalid, M. Marx, and M. de Rijke. Named Entity Normalization in User Generated
Content. In Proceedings of the Second Workshop on Analytics for Noisy Unstructured Text Data (AND2008), pages 23–30, New York, NY, USA, 2008. ACM. (Cited on page 13.)
T. Joachims. Optimizing Search Engines using Clickthrough Data. In Proceedings of the Eighth ACMSIGKDD International Conference on Knowledge Discovery and Data Mining (KDD 2002), pages133–142, New York, NY, USA, 2002. ACM. (Cited on page 24.)
N. L. Johnson, S. Kotz, and N. Balakrishnan. Discrete Multivariate Distributions. John Wiley & Sons,New York, NY, USA, 1997. (Cited on page 67.)
A. Jungherr, P. Jurgens, and H. Schoen. Why the Pirate Party Won the German Election of 2009 or TheTrouble With Predictions: A Response to Tumasjan, A., Sprenger, T. O., Sander, P. G., and Welpe,I. M. “Predicting Elections With Twitter: What 140 Characters Reveal About Political Sentiment”.Social Science Computer Review, 30(2):229–234, 2012. (Cited on page 11.)
A. Kaltenbrunner, V. Gomez, and V. Lopez. Description and Prediction of Slashdot Activity. InProceedings of the 2007 Latin American Web Conference (LA-WEB 2007), pages 57–66, Washington,DC, USA, 2007a. IEEE Computer Society. (Cited on pages 22 and 140.)
A. Kaltenbrunner, V. Gomez, A. Moghnieh, R. Meza, J. Blat, and V. Lopez. Homogeneous temporalactivity patterns in a large online communication space. CoRR, abs/0708.1579, 2007b. (Cited onpage 22.)
N. Kanhabua. Time-aware Approaches to Information Retrieval. PhD thesis, Norwegian University ofScience and Technology, February 2012. (Cited on page 13.)
N. Kanhabua, R. Blanco, and M. Matthews. Ranking Related News Predictions. In Proceedings ofthe 34th International ACM SIGIR Conference on Research and Development in Information Retrieval(SIGIR 2011), pages 755–764, New York, NY, USA, 2011. ACM. (Cited on page 161.)
M. Keikha, M. J. Carman, and F. Crestani. Blog Distillation using Random Walks. In Proceedings ofthe 32nd International ACM SIGIR Conference on Research and Development in Information Retrieval(SIGIR 2009), pages 638–639, New York, NY, USA, 2009. ACM. (Cited on page 18.)
M. Keikha, S. Gerani, and F. Crestani. TEMPER: A Temporal Relevance Feedback Method. In Advancesin Information Retrieval - 33rd European Conference on IR Research (ECIR 2011), pages 436–447,Berlin / Heidelberg, 2011. Springer. (Cited on page 18.)
D. Kelly and N. J. Belkin. Display Time as Implicit Feedback: Understanding Task Effects. In Proceedingsof the 27th International ACM SIGIR Conference on Research and Development in Information Retrieval(SIGIR 2004), pages 377–384, New York, NY, USA, 2004. ACM. (Cited on page 159.)
M. A. Khalid, V. Jijkoun, and M. De Rijke. The Impact of Named Entity Normalization on InformationRetrieval for Question Answering. In Advances in Information Retrieval - 30th European Conference onIR Research (ECIR 2008), pages 705–710, Berlin / Heidelberg, 2008. Springer. (Cited on page 14.)
M. Kharratzadeh and M. Coates. Weblog Analysis for Predicting Correlations in Stock Price Evolutions.In Proceedings of the 6th International Workshop on Weblogs and Social Media (ICWSM 2012). AAAIPress, 2012. (Cited on page 23.)
E. Kiciman. OMG, I Have to Tweet that! A Study of Factors that Influence Tweet Rates. In Proceedingsof the 6th International Workshop on Weblogs and Social Media (ICWSM 2012), pages 170–177. AAAIPress, 2012. (Cited on pages 2 and 11.)
H. W. Kim, K. J. Han, M. Ko, and M. Y. Yi. MovMe: Personalized Movie Information Retrieval. In

195 Bibliography
Proceedings of the International Conference on Advances in Computing, Control & TelecommunicationTechnologies (ACEEE ACT 2011), 2011. (Cited on page 11.)
J. Kim, K. Candan, and J. Tatemura. Organization and Tagging of Blog and News Entries Based onContent Reuse. Journal of Signal Processing Systems, 58:407–421, 2010. (Cited on page 21.)
J. W. Kim, K. S. Candan, and J. Tatemura. Efficient Overlap and Content Reuse Detection in Blogs andOnline News Articles. In Proceedings of the 18th international conference on World Wide Web (WWW2009), pages 81–90, New York, NY, USA, 2009. ACM. (Cited on pages 21 and 68.)
M. Kim, L. Xie, and P. Christen. Event Diffusion Patterns in Social Media. In Proceedings of the 6thInternational Workshop on Weblogs and Social Media (ICWSM 2012), pages 178–185. AAAI Press,2012. (Cited on pages 2 and 11.)
S.-M. Kim, P. Pantel, T. Chklovski, and M. Pennacchiotti. Automatically Assessing Review Helpfulness.In Proceedings of the Conference on Empirical Methods in Natural Language Processing (EMNLP 2006),pages 423–430, Stroudsburg, PA, USA, 2006. Association of Computational Linguistics. (Cited onpage 23.)
J. M. Kleinberg. Authoritative Sources in a Hyperlinked Environment. Journal of ACM, 46(5):604–632,1999. (Cited on page 39.)
M. Ko, H. Kim, M. Yi, J. Song, and Y. Liu. MovieCommenter: Aspect-based Collaborative Filteringby Utilizing User Comments. In The 7th International Conference on Collaborative Computing(CollaborateCom 2011), pages 362–371, Oct. 2011. (Cited on page 11.)
O. Kolak and B. N. Schilit. Generating Links by Mining Quotations. In Proceedings of the 19th ACMConference on Hypertext and Hypermedia (HT 2008), pages 117–126, New York, NY, USA, 2008.ACM. (Cited on pages 20 and 68.)
A. C. Konig, M. Gamon, and Q. Wu. Click-Through Prediction for News Queries. In Proceedings ofthe 32nd International ACM SIGIR Conference on Research and Development in Information Retrieval(SIGIR 2009), New York, NY, USA, 2009. ACM. (Cited on page 23.)
M. Koolen and J. Kamps. The Importance of Anchor Text for Ad hoc Search Revisited. In Proceedings ofthe 33rd International ACM SIGIR Conference on Research and Development in Information Retrieval(SIGIR 2010), pages 122–129, New York, NY, USA, 2010. ACM. (Cited on page 14.)
W. Kraaij and R. Pohlmann. Viewing Stemming as Recall Enhancement. In Proceedings of the 19thInternational ACM SIGIR Conference on Research and Development in Information Retrieval (SIGIR1996), pages 40–48, New York, NY, USA, 1996. ACM. (Cited on page 13.)
R. Kumar, J. Novak, P. Raghavan, and A. Tomkins. Structure and Evolution of Blogspace. Communica-tions of the ACM, 47(12):35–39, 2004. (Cited on page 20.)
G. Kumaran and J. Allan. Text Classification and Named Entities for New Event Detection. In Proceedingsof the 27th International ACM SIGIR Conference on Research and Development in Information Retrieval(SIGIR 2004), pages 297–304, New York, NY, USA, 2004. ACM. (Cited on page 19.)
H. Kwak, C. Lee, H. Park, and S. Moon. What is Twitter, a Social Network or a News Media? InProceedings of the 19th international conference on World Wide Web (WWW 2010), pages 591–600,New York, NY, USA, 2010. ACM. (Cited on pages 1, 12, and 29.)
D. Laniado and P. Mika. Making Sense of Twitter. In The 9th International Semantic Web Conference(ISWC 2010), pages 470–485, Berlin - Heidelberg, 2010. Spring. (Cited on page 14.)
M. Larson, M. Tsagkias, J. He, and M. Rijke. Investigating the Global Semantic Impact of SpeechRecognition Error on Spoken Content Collections. In Advances in Information Retrieval - 31st EuropeanConference on IR Research (ECIR 2009), pages 755–760, Berlin / Heidelberg, 2009. Springer. (Citedon page 8.)
LDC. The New York Times Annotated Corpus, 2008. (Cited on page 30.)M. Lease. Beyond Keywords: Finding Information More Accurately and Easily using Natural Language.
PhD thesis, Brown University, 2010. (Cited on page 13.)J. G. Lee and K. Salamatian. Understanding the Characteristics of Online Commenting. In The 4th
International Conference on emerging Networking Experiments and Technologies (CoNEXT 2008), pages1–2, New York, NY, USA, 2008. ACM. (Cited on page 22.)
U. Lee, Z. Liu, and J. Cho. Automatic Identification of User Goals in Web Search. In Proceedings of the

Bibliography 196
14th international conference on World Wide Web (WWW 2005), pages 391–400, New York, NY, USA,2005. ACM. (Cited on page 24.)
W.-L. Lee, A. Lommatzsch, and C. Scheel. Feed Distillation using AdaBoost and Topic Maps. In TheSixteenth Text REtrieval Conference Proceedings (TREC 2007), Gaithersburg, USA, 2008. NIST. (Citedon page 18.)
K. Lerman and T. Hogg. Using a model of Social dynamics to Predict Popularity of News. In Proceedingsof the 19th international conference on World Wide Web (WWW 2010), pages 621–630, New York, NY,USA, 2010. ACM. (Cited on page 23.)
K. Lerman, A. Gilder, M. Dredze, and F. Pereira. Reading the Markets: Forecasting Public Opinionof Political Candidates by News Analysis. In The 22nd International Conference on ComputationalLinguistics (COLING 2008), pages 473–480. International Committee on Computational Linguistics,2008. (Cited on page 23.)
J. Leskovec, M. McGlohon, C. Faloutsos, N. Glance, and M. Hurst. Cascading Behavior in Large BlogGraphs. In SIAM International Conference on Data Mining (SDM 2007), Philadelphia, PA,USA, 2007.SIAM. (Cited on page 20.)
J. Leskovec, L. Backstrom, and J. Kleinberg. Meme-Tracking and the Dynamics of the News Cycle.In Proceedings of the 15th ACM SIGKDD International Conference on Knowledge Discovery and DataMining, pages 497–506, New York, NY, USA, 2009. ACM. (Cited on pages 1, 2, 16, 30, 35, and 37.)
L. Li, W. Chu, J. Langford, and R. E. Schapire. A Contextual-bandit Approach to Personalized NewsArticle Recommendation. In Proceedings of the 19th international conference on World Wide Web(WWW 2010), pages 661–670, New York, NY, USA, 2010. ACM. (Cited on page 25.)
Y. Lifshits. Ediscope: Social Analytics for Online News. Technical report, Yahoo! Labs, 2010. (Cited onpage 21.)
J. Lin, C. Macdonald, I. Ounis, and I. Soboroff. Overview of the TREC 2011 Microblog track. In TheTwentieth Text REtrieval Conference Proceedings (TREC 2011), Gaithersburg, USA, 2012. NIST. (Citedon pages 19 and 186.)
Y. Liu, J. Bian, and E. Agichtein. Predicting Information Seeker Satisfaction in Community QuestionAnswering. In Proceedings of the 31st International ACM SIGIR Conference on Research and Develop-ment in Information Retrieval (SIGIR 2008), pages 483–490, New York, NY, USA, 2008. ACM. (Citedon pages 23, 108, and 126.)
A. Livne, M. P. Simmons, E. Adar, and L. A. Adamic. The Party Is Over Here: Structure and Content inthe 2010 Election. In Proceedings of the 5th International Workshop on Weblogs and Social Media(ICWSM 2011). AAAI Press, 2011. (Cited on page 11.)
D. E. Losada and L. Azzopardi. An Analysis on Document Length Retrieval Trends in Language ModelingSmoothing. Information Retrieval, 11(2):109–138, 2008. (Cited on pages 15, 18, and 78.)
J. Louderback. Master Radio Techniques and Avoid Radio Traps, PNME 2007: Master Radio Techniques,2008. URL http://podcastacademy.com/2008/06/18/pnme-2007-master-radio-techniques/.(Cited on page 88.)
Q. Lu and L. Getoor. Link-based Text Classification. In IJCAI 2003 Workshop on Text Mining and LinkAnalysis, 2003. (Cited on page 19.)
D. M. Luu, E.-P. Lim, T.-A. Hoang, and F. C. T. Chua. Modeling Diffusion in Social Networks UsingNetwork Properties. In Proceedings of the 6th International Workshop on Weblogs and Social Media(ICWSM 2012). AAAI Press, 2012. (Cited on pages 2 and 11.)
Q. Ma, A. Nadamoto, and K. Tanaka. Complementary Information Retrieval for Cross-media NewsContent. Information Systems, 31(7):659–678, 2006. (Cited on page 20.)
C. Macdonald and I. Ounis. Using Relevance Feedback in Expert Search. In Advances in InformationRetrieval - 30st European Conference on IR Research (ECIR 2007), pages 431–443. Springer, Berlin /Heidelberg, 2007. (Cited on page 18.)
C. Macdonald, I. Ounis, and I. Soboroff. Overview of the TREC 2008 Blog Track. In The Seventeenth TextREtrieval Conference Proceedings (TREC 2008), Gaithersburg, USA, 2009. NIST. (Cited on page 18.)
C. Macdonald, I. Ounis, and I. Soboroff. Overview of the TREC 2009 Blog Track. In The Eighteenth TextREtrieval Conference Proceedings (TREC 2009), Gaithersburg, USA, 2010. NIST. (Cited on page 45.)

197 Bibliography
M. Madden and S. Jones. Podcast Downloading 2008. Technical report, Pew Internet and AmericanLife Project, 2008. (Cited on page 88.)
R. E. Madsen, D. Kauchak, and C. Elkan. Modeling Word Burstiness Using the Dirichlet Distribution. InProceedings of the 22nd International Conference on Machine Learning (ICML 2005), pages 545–552,New York, NY, USA, 2005. ACM. (Cited on pages 81 and 181.)
G. S. Manku, A. Jain, and A. Das Sarma. Detecting Near-Duplicates for Web Crawling. In Proceedings ofthe 16th International Conference on World Wide Web (WWW 2007), pages 141–150, New York, NY,USA, 2007. ACM. (Cited on pages 20 and 69.)
C. D. Manning, P. Raghavan, and H. Schutze. Introduction to Information Retrieval. CambridgeUniversity Press, 2008. (Cited on page 9.)
C. Mascaro, A. Novak, and S. Goggins. Shepherding and Censorship: Discourse Management in the TeaParty Patriots Facebook Group. In 45th Hawaii International Conference on System Sciences (HICSS2012), pages 2563–2572. IEEE, 2012. (Cited on page 11.)
K. Massoudi, M. Tsagkias, M. de Rijke, and W. Weerkamp. Incorporating Query Expansion and QualityIndicators in Searching Microblog Posts. In Advances in Information Retrieval - 33rd EuropeanConference on IR Research (ECIR 2011), pages 362–367, Berlin / Heidelberg, 2011. Springer. (Citedon pages 8, 19, and 186.)
M. Mathioudakis, N. Koudas, and P. Marbach. Early Online Identification of Attention Gathering Itemsin Social Media. In Proceedings of the 3rd ACM International Conference on Web Search and DataMining (WSDM 2010), pages 301–310, New York, NY, USA, 2010. ACM. (Cited on page 30.)
K. Matthews. Research into Podcasting Technology including Current and Possible Future Uses.Electronics and Computer Science, University of Southampton, 2006. (Cited on page 88.)
M. McCabe, A. Chowdhury, D. Grossman, and O. Frieder. System Fusion for Improving Performance inInformation Retrieval Systems. In IEEE International Conference on Information Technology: Codingand Computing (ITCC 2001), 2001. (Cited on page 16.)
J. McLean. State of the Blogosphere, 2009. http://technorati.com/blogging/article/state-of-the-blogosphere-2009-introduction. (Cited on page 12.)
E. Meij. Combining Concepts and Language Models for Information Access. PhD thesis, University ofAmsterdam, 2010. (Cited on page 13.)
E. Meij, W. Weerkamp, and M. de Rijke. Adding Semantics to Microblog Posts. In Proceedings of the 5thACM International Conference on Web Search and Data Mining (WSDM 2012), pages 563–572, NewYork, NY, USA, 2012. ACM. (Cited on pages 14 and 20.)
M. Melucci. An Evaluation of Automatically Constructed Hypertexts for Information Retrieval. Informa-tion Retrieval, 1(1-2):91–114, 1999. (Cited on page 19.)
P. T. Metaxas, E. Mustafaraj, and D. Gayo-Avello. How (Not) to Predict Elections. In IEEE Third Interna-tional Conference on Privacy, Security, Risk and Trust (PASSAT 2011) and IEEE Third InternationalConference on Social Computing (SocialCom 2011), pages 165–171. IEEE, 2011. (Cited on page 11.)
M. J. Metzger. Making Sense of Credibility on the Web: Models for Evaluating Online Information andRecommendations for Future Research. Journal of the American Society for Information Science andTechnology, 58(13):2078–2091, 2007. (Cited on pages 91, 92, and 96.)
M. J. Metzger, A. J. Flanagin, K. Eyal, D. R. Lemus, and R. McCann. Credibility for the 21st century: Inte-grating perspectives on source, message, and media credibility in the contemporary media environment,pages 293–335. Mahwah, NJ: Lawrence Erlbaum, 2003. (Cited on pages 91, 92, 96, 97, and 124.)
D. Metzler and C. Cai. USC/ISI at TREC 2011: Microblog Track. In The Twentieth Text REtrievalConference Proceedings (TREC 2011), Gaithersburg, USA, 2012. NIST. (Cited on page 19.)
D. Metzler and W. B. Croft. Combining the Language Model and Inference Network Approaches toRetrieval. Information Processing and Management, 40:735–750, 2004. (Cited on pages 44 and 170.)
D. Metzler and W. B. Croft. A Markov Random Field Model for Term Dependencies. In Proceedings ofthe 28th International ACM SIGIR Conference on Research and Development in Information Retrieval(SIGIR 2005), pages 472–479, New York, NY, USA, 2005. ACM. (Cited on page 13.)
D. Metzler, Y. Bernstein, W. B. Croft, A. Moffat, and J. Zobel. Similarity Measures for TrackingInformation Flow. In Proceedings of the 14th ACM International Conference on Information and
Bibliography 198
Knowledge Management (CIKM 2005), pages 517–524, New York, NY, USA, 2005. ACM. (Cited onpages 34 and 36.)
D. Metzler, J. Novak, H. Cui, and S. Reddy. Building Enriched Document Representations usingAggregated Anchor Text. In Proceedings of the 32nd International ACM SIGIR Conference on Researchand Development in Information Retrieval (SIGIR 2009), pages 219–226, New York, NY, USA, 2009.ACM. (Cited on page 14.)
R. Mihalcea and A. Csomai. Wikify!: Linking Documents to Encyclopedic Knowledge. In Proceedings ofthe 16th ACM International Conference on Information and Knowledge Management (CIKM 2007),pages 233–242, New York, NY, USA, 2007. ACM. (Cited on pages 43, 70, and 154.)
R. Mihalcea and P. Tarau. TextRank: Bringing Order into Texts. In Proceedings of the Conference onEmpirical Methods in Natural Language Processing (EMNLP 2004), 2004. (Cited on page 39.)
D. R. H. Miller, T. Leek, and R. M. Schwartz. A Hidden Markov Model Information Retrieval System.In Proceedings of the 22nd International ACM SIGIR Conference on Research and Development inInformation Retrieval (SIGIR 1999), pages 214–221, New York, NY, USA, 1999. ACM. (Cited onpages 17 and 59.)
D. Milne and I. H. Witten. Learning to Link with Wikipedia. In Proceedings of the 17th ACM InternationalConference on Information and Knowledge Management (CIKM 2008), pages 509–518, New York, NY,USA, 2008. ACM. (Cited on pages 43 and 70.)
G. Mishne. Experiments with Mood Classification in Blog Posts. In SIGIR 2005 1st Workshop on StylisticAnalysis of Text for Information Access (Style2005), 2005. (Cited on page 152.)
G. Mishne. Applied Text Analytics for Blogs. PhD thesis, University of Amsterdam, 2007. (Cited onpage 92.)
G. Mishne and M. de Rijke. Capturing Global Mood Levels using Blog Posts. In AAAI Symposium onComputational Approaches to Analysing Weblogs (AAAI-CAAW 2006), pages 145–152. AAAI Press,2006a. (Cited on pages 12, 22, 23, 126, 132, 137, and 152.)
G. Mishne and M. de Rijke. A Study of Blog Search. In Advances in Information Retrieval - 28th EuropeanConference on IR Research (ECIR 2006), pages 289–301, Berlin / Heidelberg, 2006b. Springer. (Citedon pages 12 and 126.)
G. Mishne and N. Glance. Leave a Reply: An Analysis of Weblog Comments. In Third Annual Workshopon the Weblogging Ecosystem, 2006a. (Cited on pages 22, 130, and 146.)
G. Mishne and N. Glance. Predicting Movie Sales from Blogger Sentiment. In AAAI 2006 SpringSymposium on Computational Approaches to Analysing Weblogs, 2006b. (Cited on page 11.)
T. Miyanishi, N. Okamura, X. Liu, and K. Seki. TREC 2011 Microblog Track Experiments at KobeUniversity. In The Twentieth Text REtrieval Conference Proceedings (TREC 2011), Gaithersburg, USA,2012. NIST. (Cited on page 19.)
M. Montague and J. A. Aslam. Relevance Score Normalization for Metasearch. In Proceedings of the10th ACM International Conference on Information and Knowledge Management (CIKM 2001), pages427–433, New York, NY, USA, 2001. ACM. (Cited on page 41.)
D. S. Moore. The Basic Practice of Statistics with Cdrom. W. H. Freeman & Co., New York, NY, USA, 2ndedition, 1999. (Cited on page 57.)
K. Muthmann, W. M. Barczynski, F. Brauer, and A. Loser. Near-Duplicate Detection for Web-Forums. InProceedings of the 2009 International Database Engineering & Applications Symposium (IDEAS 2009),pages 142–151, New York, NY, USA, 2009. ACM. (Cited on page 20.)
B. A. Nardi, D. J. Schiano, M. Gumbrecht, and L. Swartz. Why We Blog. Communications of the ACM,47(12):41–46, 2004. (Cited on page 10.)
N. Naveed, T. Gottron, J. Kunegis, and A. C. Alhadi. Searching Microblogs: Coping with Sparsity andDocument Quality. In Proceedings of the 20th ACM International Conference on Information andKnowledge Management (CIKM 2011), pages 183–188, New York, NY, USA, 2011. ACM. (Cited onpage 19.)
Z. Obukhovskaya, K. Pervyshev, A. Styskin, and P. Serdyukov. Yandex at TREC 2011 Microblog Track.In The Twentieth Text REtrieval Conference Proceedings (TREC 2011), Gaithersburg, USA, 2012. NIST.(Cited on page 19.)

199 Bibliography
J. Ogata, M. Goto, and K. Eto. Automatic Transcription for a Web 2.0 Service to Search Podcasts.In Proceedings of the 8th Annual Conference of the International Speech Communication Association(Interspeech 2007), 2007. (Cited on page 88.)
A. Oghina, M. Breuss, E. Tsagkias, and M. de Rijke. Predicting IMDB Movie Ratings Using Social Media.In Advances in Information Retrieval - 34th European Conference on IR Research (ECIR 2012), Berlin /Heidelberg, 2012. Springer. (Cited on pages 8 and 11.)
P. Ogilvie. Modeling blog post comment counts, July 2008. (Cited on page 22.)I. Ounis, M. de Rijke, C. Macdonald, G. Mishne, and I. Soboroff. Overview of the TREC-2006 Blog
Track. In The Fifteenth Text REtrieval Conference Proceedings (TREC 2006), Gaithersburg, USA, 2007.NIST. (Cited on page 16.)
E. Pariser. The Filter Bubble: What the Internet Is Hiding from You. Penguin Press, 2011. (Cited onpage 164.)
S. Park, M. Ko, J. Kim, Y. Liu, and J. Song. The Politics of Comments: Predicting Political Orientation ofNews Stories with Commenters’ Sentiment Patterns. In Proceedings of the ACM 2011 Conference onComputer Supported Cooperative Work (CSCW 2011), pages 113–122, New York, NY, USA, 2011.ACM. (Cited on page 11.)
L. J. Patterson. The Technology Underlying Podcasts. Computer, 39(10):103–105, 2006. (Cited onpage 88.)
Pew Research Project for Excellence in Journalism. What Facebook and Twitter Mean forNews, 2012. URL http://stateofthemedia.org/2012/what-facebook-and-twitter-mean-
for-news/. (Cited on page 1.)O. Phelan, K. McCarthy, and B. Smyth. Using Twitter to Recommend Real-Time Topical News. In
Proceedings of the Third ACM Conference on Recommender Systems (RecSys 2009), pages 385–388,New York, NY, USA, 2009. ACM. (Cited on page 12.)
J. M. Ponte and W. B. Croft. A Language Modeling Approach to Information Retrieval. In SIGIR ’98,pages 275–281, New York, NY, USA, 1998. ACM. (Cited on pages 17, 57, and 161.)
M. Potthast, B. Stein, F. Loose, and S. Becker. Information Retrieval in the Commentsphere. ACMTransactions on Intelligent Systems and Technology, 3(4), 2012. (Cited on page 19.)
B. Pouliquen, R. Steinberger, C. Ignat, E. Kasper, and I. Temnikova. Multilingual and cross-lingualnews topic tracking. In Proceedings of the 20th International Conference on Computational Linguistics(CoLing 2004), 2004. (Cited on page 138.)
D. Radev, J. Otterbacher, A. Winkel, and S. Blair-Goldensohn. NewsInEssence: summarizing onlinenews topics. Communications of the ACM, 48(10):95–98, 2005. (Cited on page 19.)
S. Y. Rieh. Judgment of Information Quality and Cognitive Authority in the Web. Journal of theAmerican Society for Information Science and Technology, 53(2):145–161, 2002. (Cited on page 91.)
S. Y. Rieh and N. J. Belkin. Understanding Judgment of Information Quality and Cognitive Authority inthe WWW. In Proceedings of the ASIS Annual Meeting, pages 279–289, 1998. (Cited on pages 97and 124.)
S. Y. Rieh and D. R. Danielson. Credibility: A Multidisciplinary Framework. Annual Review of InformationScience and Technology, 41(1):307–364, 2007. (Cited on pages 91 and 92.)
S. E. Robertson. The Probability Ranking Principle in IR, volume 33, pages 294–304. 1977. (Cited onpages 17 and 58.)
D. M. Romero, W. Galuba, S. Asur, and B. A. Huberman. Influence and Passivity in Social Media. InProceedings of the 20th International Conference Companion on World Wide Web (WWW 2011), pages113–114, New York, NY, USA, 2011a. ACM. (Cited on page 11.)
D. M. Romero, B. Meeder, and J. Kleinberg. Differences in the Mechanics of Information Diffusionacross Topics: Idioms, Political Hashtags, and Complex Contagion on Twitter. In Proceedings of the20th International Conference Companion on World Wide Web (WWW 2011), pages 695–704, NewYork, NY, USA, 2011b. ACM. (Cited on page 11.)
R. Rosenfeld. Two Decades of Statistical Language Modeling: Where do we go from here. Proceedingsof the IEEE, 88(8):1270–1278, 2000. (Cited on page 16.)
M. Rowe, M. Fernandez, H. Alani, I. Ronen, C. Hayes, and M. Karnstedt. Behaviour Analysis Across

Bibliography 200
Different Types of Enterprise Online Communities. In Proceedings of the 3rd Annual ACM Web ScienceConference (WebSci 2012), New York, NY, USA, 2012. ACM. (Cited on page 11.)
V. L. Rubin and E. D. Liddy. Assessing Credibility of Weblogs. In AAAI Spring Symposium: ComputationalApproaches to Analyzing Weblogs (AAAI-CAAW 2006). AAAI Press, 2006. (Cited on pages 91, 92, 96,97, and 98.)
I. Ruthven and M. Lalmas. A Survey on the Use of Relevance Feedback for Information Access Systems.The Knowledge Engineering Review, 18(2):95–145, 2003. (Cited on page 14.)
E. Sadikov, A. Parameswaran, and P. Venetis. Blogs as Predictors of Movie Success. In Proceedings of the3rd International Workshop on Weblogs and Social Media (ICWSM 2009). AAAI Press, 2009. (Citedon page 11.)
A. Sadilek, H. Kautz, and V. Silenzio. Modeling Spread of Disease from Social Interactions. InProceedings of the 6th International Workshop on Weblogs and Social Media (ICWSM 2012). AAAIPress, 2012. (Cited on page 12.)
T. Sakaki, M. Okazaki, and Y. Matsuo. Earthquake Shakes Twitter Users: Real-Time Event Detection bySocial Sensors. In Proceedings of the 19th International Conference on World Wide Web (WWW 2010),pages 851–860, New York, NY, USA, 2010. ACM. (Cited on pages 12 and 184.)
M. J. Salganik, P. S. Dodds, and D. J. Watts. Experimental Study of Inequality and Unpredictability inan Artificial Cultural Market. Science, 311(5762):854–856, 2006. (Cited on page 109.)
G. Salton. The SMART Retrieval System - Experiments in Automatic Document Processing. Prentice Hall,Englewood, Cliffs, New Jersey, 1971. (Cited on page 14.)
G. Salton and C. Buckley. Readings in Information Retrieval. chapter Improving Retrieval Performanceby Relevance Feedback, pages 355–364. Morgan Kaufmann Publishers Inc., San Francisco, CA, USA,1997. (Cited on page 14.)
G. Salton, A. Wong, and C. S. Yang. A Vector Space Model for Automatic Indexing. Communications ofthe ACM, 18(11):613–620, 1975a. (Cited on pages 12 and 14.)
G. Salton, C. S. Yang, and C. T. Yu. A Theory of Term Importance in Automatic Text Analysis. Journalof the American Society for Information Science, 26(1):33–44, 1975b. (Cited on page 13.)
R. L. Santos, C. Macdonald, and I. Ounis. Intent-Aware Search Result Diversification. In Proceedings ofthe 34th International ACM SIGIR Conference on Research and Development in Information Retrieval(SIGIR 2011), pages 595–604, New York, NY, USA, 2011. ACM. (Cited on page 25.)
H. Sayyadi, M. Hurst, and A. Maykov. Event Detection and Tracking in Social Streams. In Proceedingsof the 3rd International Workshop on Weblogs and Social Media (ICWSM 2009). AAAI Press, 2009.(Cited on page 12.)
A. Schuth, M. Marx, and M. de Rijke. Extracting the Discussion Structure in Comments on News-Articles. In Proceedings of the 9th Annual ACM International Workshop on Web Information and DataManagement (WIDM 2007), pages 97–104, New York, NY, USA, 2007. ACM. (Cited on page 22.)
K. Seki, Y. Kino, S. Sato, and K. Uehara. TREC 2007 Blog Track Experiments at Kobe University. In TheSixteenth Text REtrieval Conference Proceedings (TREC 2007), Gaithersburg, USA, 2008. NIST. (Citedon page 18.)
J. Seo and W. B. Croft. Local Text Reuse Detection. In Proceedings of the 31st International ACM SIGIRConference on Research and Development in Information Retrieval (SIGIR 2008), pages 571–578, NewYork, NY, USA, 2008. ACM. (Cited on pages 21, 68, and 73.)
J. A. Shaw and E. A. Fox. Combination of Multiple Searches. In The First Text REtrieval ConferenceProceedings (TREC 1992), pages 243–252, Gaithersburg, USA, 1993. NIST. (Cited on pages 16, 34,and 40.)
W. M. Shaw, R. Burgin, and P. Howell. Performance Standards and Evaluations in IR Test Collections:Vector-space and Other Retrieval Models. Information Processing and Management, 33(1):15–36,1997. (Cited on page 17.)
D. J. Sheskin. Handbook of Parametric and Nonparametric Statistical Procedures. Chapman & Hall/CRC,2000. (Cited on page 134.)
E. Shmueli, A. Kagian, Y. Koren, and R. Lempel. Care to Comment?: Recommendations for Commentingon News Stories. In Proceedings of the 21st international conference on World Wide Web (WWW 2012),

201 Bibliography
pages 429–438, New York, NY, USA, 2012. ACM. (Cited on page 12.)C. Silverstein, H. Marais, M. Henzinger, and M. Moricz. Analysis of a Very Large Web Search Engine
Query Log. SIGIR Forum, 33:6–12, 1999. (Cited on page 162.)A. Singla, R. White, and J. Huang. Studying Trailfinding Algorithms for Enhanced Web Search.
In Proceedings of the 33rd International ACM SIGIR Conference on Research and Development inInformation Retrieval (SIGIR 2010), pages 443–450, New York, NY, USA, 2010. ACM. (Cited onpage 24.)
A. F. Smeaton. Using NLP or NLP Resources for Information Retrieval Tasks. In Natural LanguageInformation Retrieval, pages 99–111. Kluwer Academic Publishers, 1997. (Cited on page 13.)
M. D. Smucker and J. Allan. An Investigation of Dirichlet Prior Smoothing’s Performance Advantage.Technical report, University of Massachusetts, 2006. (Cited on page 18.)
C. G. M. Snoek, M. Worring, and A. W. M. Smeulders. Early Versus Late Fusion in Semantic VideoAnalysis. In Proceedings of the 13th Annual ACM International Conference on Multimedia (MULTIMEDIA2005), pages 399–402, New York, NY, USA, 2005. ACM. (Cited on pages 15 and 34.)
P. Sobkowicz and A. Sobkowicz. Properties of Social Network in an Internet Political Discussion Forum.Advances in Complex Systems, 15(6):1–22, 2012. (Cited on page 11.)
K. Sparck Jones. A Statistical Interpretation of Term Specificity and its Application in Retrieval. Journalof Documentation, 28:11–21, 1972. (Cited on page 14.)
K. Sparck Jones, S. Walker, and S. Robertson. A Probabilistic Model of Information Retrieval: Develop-ment and Comparative Experiments. Information Processing and Management, 36(6):779–808, 2000.(Cited on page 17.)
T. Spiliotopoulos. Votes and Comments in Recommender Systems: The Case of Digg. Technical report,Madeira Interactive Technologies Institute, University of Madeira, 2010. (Cited on page 22.)
G. Szabo and B. A. Huberman. Predicting the Popularity of Online Content. Communications of theACM, 53(8):80–88, 2010. (Cited on pages 22, 23, 146, and 148.)
Y. Takama, A. Matsumura, and T. Kajinami. Visualization of News Distribution in Blog Space. InProceedings of the 2006 IEEE/WIC/ACM International Conference on Web Intelligence and IntelligentAgent Technology (WI-IATW 2006), pages 413–416, Washington, DC, USA, 2006. IEEE ComputerSociety. (Cited on page 20.)
A. Tatar, J. Leguay, P. Antoniadis, A. Limbourg, M. D. de Amorim, and S. Fdida. Predicting the Popularityof Online Articles Based on User Comments. In Proceedings of the International Conference on WebIntelligence, Mining and Semantics (WIMS 2011), pages 67:1–67:8, New York, NY, USA, 2011. ACM.(Cited on page 22.)
J. Teevan, D. Ramage, and M. R. Morris. #TwitterSearch: A Comparison of Microblog Search andWeb Search. In Proceedings of the 4th ACM International Conference on Web Search and Data Mining(WSDM 2011), pages 35–44, New York, NY, USA, 2011. ACM. (Cited on page 19.)
M. Thelwall. Bloggers During the London Attacks: Top Information Sources and Topics. In WWW 20063rd Annual Workshop on Weblogging Ecosystem: Aggregation, Analysis and Dynamics (WWE 2006),2006. (Cited on page 12.)
M. Tsagkias and K. Balog. The University of Amsterdam at WePS3. In CLEF 2010 3rd Web People SearchLab, September 2010. (Cited on page 8.)
M. Tsagkias and R. Blanco. Language Intent Models for Inferring User Browsing Behavior. In Proceedingsof the 35th International ACM SIGIR Conference on Research and Development in Information Retrieval(SIGIR 2012), pages 335–344, New York, NY, USA, 2012. ACM. (Cited on page 8.)
M. Tsagkias, M. Larson, and M. de Rijke. Term Clouds as Surrogates for User Generated Speech.In Proceedings of the 31st International ACM SIGIR Conference on Research and Development inInformation Retrieval (SIGIR 2008), pages 773–774, New York, NY, USA, 2008a. ACM. (Cited onpage 8.)
M. Tsagkias, M. Larson, W. Weerkamp, and M. de Rijke. PodCred: a Framework for Analyzing PodcastPreference. In CIKM 2008 2nd ACM Workshop on Information Credibility on the Web (WICOW 2008),pages 67–74, New York, NY, USA, 2008b. ACM. (Cited on page 8.)
M. Tsagkias, M. Larson, and M. Rijke. Exploiting Surface Features for the Prediction of Podcast

Bibliography 202
Preference. In Advances in Information Retrieval - 31st European Conference on IR Research (ECIR2009), pages 473–484, Berlin / Heidelberg, 2009a. Springer. (Cited on pages 8 and 108.)
M. Tsagkias, W. Weerkamp, and M. de Rijke. Predicting the Volume of Comments on Online NewsStories. In Proceedings of the 18th ACM International Conference on Information and KnowledgeManagement (CIKM 2009), pages 1765–1768, New York, NY, USA, 2009b. ACM. (Cited on page 8.)
M. Tsagkias, M. Larson, and M. de Rijke. Predicting Podcast Preference: An Analysis Framework and itsApplication. Journal of the American Society for Information Science and Technology, 61(2):374–391,2010a. (Cited on page 8.)
M. Tsagkias, W. Weerkamp, and M. de Rijke. News Comments: Exploring, Modeling, and OnlinePrediction. In Advances in Information Retrieval - 32nd European Conference on IR Research (ECIR2010), pages 191–203, Berlin / Heidelberg, 2010b. Springer. (Cited on page 8.)
M. Tsagkias, M. de Rijke, and W. Weerkamp. Hypergeometric Language Models for Republished ArticleFinding. In Proceedings of the 34th International ACM SIGIR Conference on Research and Developmentin Information Retrieval (SIGIR 2011), pages 485–494, New York, NY, USA, 2011a. ACM. (Cited onpage 8.)
M. Tsagkias, M. de Rijke, and W. Weerkamp. Linking Online News and Social Media. In Proceedings ofthe 4th ACM International Conference on Web Search and Data Mining (WSDM 2011), pages 565–574,New York, NY, USA, 2011b. ACM. (Cited on pages 8 and 57.)
S. Tseng and B. J. Fogg. Credibility and Computing Technology. Communications of the ACM, 42(5):39–44, 1999. (Cited on page 91.)
A. Tumasjan, T. Sprenger, P. Sandner, and I. Welpe. Predicting Elections with Twitter: What 140Characters Reveal about Political Sentiment. In Proceedings of the 4th International Workshop onWeblogs and Social Media (ICWSM 2010), pages 178–185. AAAI Press, 2010. (Cited on page 11.)
J. Ugander, B. Karrer, L. Backstrom, and C. Marlow. The Anatomy of the Facebook Social Graph. CoRR,abs/1111.4503, 2011. (Cited on page 10.)
F. van Gils. PodVinder: Spoken Document Retrieval for Dutch Pod- and Vodcasts. Master’s thesis,University of Twente, 2008. (Cited on page 88.)
N. van House. Weblogs: Credibility and Collaboration in an Online World. Technical report, Berkeley,CA, USA, 2002. (Cited on pages 92, 97, and 98.)
M. Volk, B. Ripplinger, S. Vintar, P. Buitelaar, D. Raileanu, and B. Sacaleanu. Semantic Annotationfor Concept-Based Cross-Language Medical Information Retrieval. International Journal of MedicalInformatics, 67(1–3):97–112, 2002. (Cited on page 13.)
E. M. Voorhees. Using WordNet to Disambiguate Word Senses for Text Retrieval. In Proceedings ofthe 16th International ACM SIGIR Conference on Research and Development in Information Retrieval(SIGIR 1993), pages 171–180, New York, NY, USA, 1993. ACM. (Cited on page 13.)
E. M. Voorhees and L. P. Buckland, editors. Proceedings of the Thirteenth Text REtrieval Conference (TREC2004), Gaithersburg, USA, 2004. NIST. (Cited on page 57.)
P. Vossen, editor. EuroWordNet: A Multilingual Database with Lexical Semantic Networks. KluwerAcademic Publishers, Norwell, MA, USA, 1998. (Cited on page 13.)
K. T. Wallenius. Biased Sampling; The Noncentral Hypergeometric Probability Distribution. Technicalreport, Stanford University, 1963. (Cited on page 60.)
C. Wang, M. Ye, and B. A. Huberman. From User Comments to On-line Conversations. CoRR,abs/1204.0128, 2012. (Cited on pages 23 and 135.)
R. D. Waters, A. Amarkhil, L. Bruun, and K. S. Mathisen. Messaging, music, and mailbags: Howtechnical design and entertainment boost the performance of environmental organizations’ podcasts.Public Relations Review, 38(1):64–68, 2012. (Cited on page 24.)
W. Weerkamp. Finding People and their Utterances in Social Media. PhD thesis, University of Amsterdam,2011. (Cited on page 18.)
W. Weerkamp and M. de Rijke. Credibility-inspired Ranking for Blog Post Retrieval. InformationRetrieval, 15(3–4):243–277, 2012. (Cited on pages 18, 35, 92, and 93.)
W. Weerkamp, K. Balog, and M. de Rijke. A Generative Blog Post Retrieval Model that Uses QueryExpansion based on External Collections. In ACL-ICNLP 2009, August 2009. (Cited on pages 14, 15,

203 Bibliography
33, and 38.)W. Weerkamp, E. Tsagkias, and M. de Rijke. From Blogs to News: Identifying Hot Topics in the
Blogosphere. In The Eighteenth Text REtrieval Conference Proceedings (TREC 2009), Gaithersburg,USA, 2010. NIST. (Cited on page 8.)
W. Weerkamp, S. Carter, and M. Tsagkias. How People use Twitter in Different Languages. In Proceedingsof the ACM WebSci’11, pages 1–2, 2011. (Cited on pages 8 and 10.)
M. Weimer, I. Gurevych, and M. Muhlhuser. Automatically Assessing the Post Quality in OnlineDiscussions on Software. In Proceedings of the 45th Annual Meeting of the ACL on Interactive Posterand Demonstration Sessions (ACL 2007), pages 125–128, Stroudsburg, PA, USA, 2007. Associationfor Computational Linguistics. (Cited on page 23.)
S. Weiss, N. Indurkhya, T. Zhang, and F. Damerau. Text Mining: Predictive Methods for AnalyzingUnstructured Information. SpringerVerlag, 2004. (Cited on page 9.)
T. Westerveld, A. de Vries, and G. Ramırez. Surface Features in Video Retrieval. In Proceedings of theThird International Conference on Adaptive Multimedia Retrieval: User, Context, and Feedback (AMR2005), pages 180–190. Springer, Berlin / Heidelberg, 2006. (Cited on page 24.)
R. W. White, P. Bailey, and L. Chen. Predicting User Interests from Contextual Information. In Proceed-ings of the 32nd International ACM SIGIR Conference on Research and Development in InformationRetrieval (SIGIR 2009), pages 363–370, New York, NY, USA, 2009. ACM. (Cited on page 154.)
W. J. Wilbur. Retrieval Testing with Hypergeometric Document Models. Journal of the American Societyfor Information Science, 44:340–351, 1993. (Cited on page 17.)
I. H. Witten and E. Frank. Data Mining: Practical Machine Learning Tools and Techniques. MorganKaufmann Publishers Inc., San Francisco, CA, USA, 2005. (Cited on pages 9, 109, and 110.)
J. Xia. Let us take a yale open course: A chinese view of open educational resources provided byinstitutions in the west. Journal of Computer Assisted Learning, 2012. (Cited on page 22.)
Z. Xu and R. Akella. A New Probabilistic Retrieval Model based on the Dirichlet Compound Multino-mial Distribution. In Proceedings of the 31st International ACM SIGIR Conference on Research andDevelopment in Information Retrieval (SIGIR 2008), pages 427–434, New York, NY, USA, 2008. ACM.(Cited on pages 67, 68, 76, 81, and 181.)
X. Yang, Z. Zhang, and K. Wang. Human Behavior Dynamics in Online Social Media: A Time SequentialPerspective. In SIGKDD 2012 Sixth SNA-KDD Workshop, New York, NY, USA, 2012. ACM. (Cited onpage 22.)
Y. Yang, N. Bansal, W. Dakka, P. Ipeirotis, N. Koudas, and D. Papadias. Query by Document. InProceedings of the 2nd ACM International Conference on Web Search and Data Mining (WSDM 2009),pages 34–43, New York, NY, USA, 2009. ACM. (Cited on pages 14 and 20.)
P. Yin, P. Luo, M. Wang, and W.-C. Lee. A Straw Shows which Way the Wind Blows: Ranking PotentiallyPopular Items from Early Votes. In Proceedings of the 5th ACM International Conference on WebSearch and Data Mining (WSDM 2012), pages 623–632, New York, NY, USA, 2012. ACM. (Cited onpage 21.)
H. Zaragoza, D. Hiemstra, and M. Tipping. Bayesian Extension to the Language Model for Ad HocInformation Retrieval. In Proceedings of the 26th International ACM SIGIR Conference on Researchand Development in Information Retrieval (SIGIR 2003), pages 4–9, New York, NY, USA, 2003. ACM.(Cited on pages 66 and 67.)
C. Zhai and J. Lafferty. The Dual Role of Smoothing in the Language Modeling Approach. In Proceedingsof the Workshop on Language Models for Information Retrieval (LMIR 2001), pages 31–36, 2001a.(Cited on page 18.)
C. Zhai and J. Lafferty. A Study of Smoothing Methods for Language Models Applied to Ad HocInformation Retrieval. In Proceedings of the 24th International ACM SIGIR Conference on Researchand Development in Information Retrieval (SIGIR 2001), pages 334–342, New York, NY, USA, 2001b.ACM. (Cited on pages 15, 59, 66, 67, and 68.)
C. Zhai and J. Lafferty. A Study of Smoothing Methods for Language Models applied to InformationRetrieval. ACM Transactions on Information Systems, 22:179–214, 2004. (Cited on pages 15, 64,and 161.)

Bibliography 204
Q. Zhang, Y. Zhang, H. Yu, and X. Huang. Efficient Partial-Duplicate Detection based on SequenceMatching. In Proceedings of the 33rd International ACM SIGIR Conference on Research and Developmentin Information Retrieval (SIGIR 2010), pages 675–682, New York, NY, USA, 2010. ACM. (Cited onpage 20.)
Y. Zhang, J. Callan, and T. Minka. Novelty and Redundancy Detection in Adaptive Filtering. In Pro-ceedings of the 25th International ACM SIGIR Conference on Research and Development in InformationRetrieval (SIGIR 2002), pages 81–88, New York, NY, USA, 2002. ACM. (Cited on page 19.)
Y. C. Zhang, D. O. Seaghdha, D. Quercia, and T. Jambor. Auralist: Introducing Serendipity into MusicRecommendation. In Proceedings of the 5th ACM International Conference on Web Search and DataMining (WSDM 2012), pages 13–22, New York, NY, USA, 2012. ACM. (Cited on page 164.)

Samenvatting
De opkomst van sociale media heeft geleid tot een symbiotische relatie tussensociale media en online nieuws. Deze relatie kan gebruikt worden om nieuwsar-tikelen te volgen en gedrag te voorspellen, wat vervolgens toegepast kan worden inbijvoorbeeld online reputatiemanagement, het vaststellen van advertentieprijzenen media-analyse. In dit proefschrift concentreren we ons op het volgen vannieuws in sociale media en het voorspellen van gebruikersgedrag.
In het eerste deel ontwikkelen we methodes voor het volgen van nieuwsar-tikelen die voortbouwen op principes uit de zoektechnologie. We beginnen methet vinden van sociale mediaberichten die een nieuwsartikel bespreken zondereen directe hyperlink naar het desbetreffende artikel te bevatten. Onze meth-odes modelleren nieuwsartikelen door gebruik te maken van verschillende infor-matiekanalen, zowel endogeen als exogeen ten opzichte van het artikel. Dezemodellen worden vervolgens gebruikt om een database met sociale mediaberichtente doorzoeken. Tijdens dit onderzoek bleek dat de zoekopdrachten een vergeli-jkbare grootte hebben als de documenten die doorzocht worden, wat in strijdis met een standaard aanname voor taalmodellen. We corrigeren deze tegen-strijdigheid door twee hypergeometrische taalmodellen te presenteren, waarmeezowel zoekopdrachten als gezochte documenten gemodelleerd kunnen worden.
In het tweede deel concentreren we ons op het voorspellen van gedrag. Eerstkijken we naar het voorspellen van voorkeuren in door gebruikers gecreerdegesproken berichten. Vervolgens voorspellen we de populariteit van nieuwsar-tikelen van verschillende nieuwsbronnen, uitgedrukt in het aantal ontvangencommentaren. We ontwikkelen modellen voor het voorspellen van de populariteitvan een artikel zowel voor als na publicatie. Tot slot onderzoeken we een anderaspect van nieuwsimpact: hoe benvloedt het lezen van een nieuwsartikel hettoekomstige surfgedrag van een gebruiker? Voor elke afzonderlijke situatie vindenwe patronen die het onderliggende gedrag karakteriseren en waar we vervolgenskenmerken uit extraheren om online gedrag te modelleren en te voorspellen.
205


SIKS Dissertation Series
1998
1 Johan van den Akker (CWI) DEGAS - An Ac-tive, Temporal Database of Autonomous Objects
2 Floris Wiesman (UM) Information Retrieval byGraphically Browsing Meta-Information
3 Ans Steuten (TUD) A Contribution to theLinguistic Analysis of Business Conversationswithin the Language/Action Perspective
4 Dennis Breuker (UM) Memory versus Searchin Games
5 Eduard W. Oskamp (RUL) Computeronderste-uning bij Straftoemeting
1999
1 Mark Sloof (VU) Physiology of Quality ChangeModelling; Automated Modelling of QualityChange of Agricultural Products
2 Rob Potharst (EUR) Classification using Deci-sion Trees and Neural Nets
3 Don Beal (UM) The Nature of Minimax Search4 Jacques Penders (UM) The Practical Art of
Moving Physical Objects5 Aldo de Moor (KUB) Empowering Communi-
ties: A Method for the Legitimate User-DrivenSpecification of Network Information Systems
6 Niek J.E. Wijngaards (VU) Re-Design of Com-positional Systems
7 David Spelt (UT) Verification Support for Ob-ject Database Design
8 Jacques H.J. Lenting (UM) Informed Gam-bling: Conception and Analysis of a Multi-AgentMechanism for Discrete Reallocation
2000
1 Frank Niessink (VU) Perspectives on ImprovingSoftware Maintenance
2 Koen Holtman (TU/e) Prototyping of CMSStorage Management
3 Carolien M.T. Metselaar (UvA) Sociaal-organisatorische Gevolgen van Kennistechnolo-gie; een Procesbenadering en Actorperspectief
4 Geert de Haan (VU) ETAG, A Formal Model ofCompetence Knowledge for User Interface De-sign
5 Ruud van der Pol (UM) Knowledge-BasedQuery Formulation in Information Retrieval
6 Rogier van Eijk (UU) Programming Languagesfor Agent Communication
7 Niels Peek (UU) Decision-Theoretic Planning ofClinical Patient Management
8 Veerle Coupe (EUR) Sensitivity Analysis ofDecision-Theoretic Networks
9 Florian Waas (CWI) Principles of ProbabilisticQuery Optimization
10 Niels Nes (CWI) Image Database ManagementSystem Design Considerations, Algorithms andArchitecture
11 Jonas Karlsson (CWI) Scalable DistributedData Structures for Database Management
2001
1 Silja Renooij (UU) Qualitative Approaches toQuantifying Probabilistic Networks
2 Koen Hindriks (UU) Agent Programming Lan-guages: Programming with Mental Models
3 Maarten van Someren (UvA) Learning as Prob-lem Solving
4 Evgueni Smirnov (UM) Conjunctive and Dis-junctive Version Spaces with Instance-BasedBoundary Sets
5 Jacco van Ossenbruggen (VU) ProcessingStructured Hypermedia: A Matter of Style
6 Martijn van Welie (VU) Task-Based User Inter-face Design
7 Bastiaan Schonhage (VU) Diva: ArchitecturalPerspectives on Information Visualization
8 Pascal van Eck (VU) A Compositional SemanticStructure for Multi-Agent Systems Dynamics
9 Pieter Jan ’t Hoen (RUL) Towards DistributedDevelopment of Large Object-Oriented Models,Views of Packages as Classes
10 Maarten Sierhuis (UvA) Modeling and Simu-lating Work Practice BRAHMS: a MultiagentModeling and Simulation Language for WorkPractice Analysis and Design
11 Tom M. van Engers (VU) Knowledge Manage-ment: The Role of Mental Models in BusinessSystems Design
207
SIKS Dissertation Series
2002
1 Nico Lassing (VU) Architecture-Level Modifia-bility Analysis
2 Roelof van Zwol (UT) Modelling and SearchingWeb-based Document Collections
3 Henk Ernst Blok (UT) Database OptimizationAspects for Information Retrieval
4 Juan Roberto Castelo Valdueza (UU) The Dis-crete Acyclic Digraph Markov Model in DataMining
5 Radu Serban (VU) The Private CyberspaceModeling Electronic Environments Inhabited byPrivacy-Concerned Agents
6 Laurens Mommers (UL) Applied Legal Episte-mology; Building a Knowledge-based Ontologyof the Legal Domain
7 Peter Boncz (CWI) Monet: A Next-GenerationDBMS Kernel For Query-Intensive Applications
8 Jaap Gordijn (VU) Value Based RequirementsEngineering: Exploring Innovative E-CommerceIdeas
9 Willem-Jan van den Heuvel (KUB) IntegratingModern Business Applications with ObjectifiedLegacy Systems
10 Brian Sheppard (UM) Towards Perfect Play ofScrabble
11 Wouter C.A. Wijngaards (VU) Agent BasedModelling of Dynamics: Biological and Organi-sational Applications
12 Albrecht Schmidt (UvA) Processing XML inDatabase Systems
13 Hongjing Wu (TU/e) A Reference Architecturefor Adaptive Hypermedia Applications
14 Wieke de Vries (UU) Agent Interaction: Ab-stract Approaches to Modelling, Programmingand Verifying Multi-Agent Systems
15 Rik Eshuis (UT) Semantics and Verification ofUML Activity Diagrams for Workflow Modelling
16 Pieter van Langen (VU) The Anatomy of De-sign: Foundations, Models and Applications
17 Stefan Manegold (UvA) Understanding, Mod-eling, and Improving Main-Memory DatabasePerformance
2003
1 Heiner Stuckenschmidt (VU) Ontology-BasedInformation Sharing in Weakly Structured En-vironments
2 Jan Broersen (VU) Modal Action Logics forReasoning About Reactive Systems
3 Martijn Schuemie (TUD) Human-ComputerInteraction and Presence in Virtual Reality Ex-posure Therapy
4 Milan Petkovic (UT) Content-Based Video Re-trieval Supported by Database Technology
5 Jos Lehmann (UvA) Causation in Artificial In-telligence and Law – A Modelling Approach
6 Boris van Schooten (UT) Development andSpecification of Virtual Environments
7 Machiel Jansen (UvA) Formal Explorations ofKnowledge Intensive Tasks
8 Yong-Ping Ran (UM) Repair-Based Scheduling9 Rens Kortmann (UM) The Resolution of Visu-
ally Guided Behaviour10 Andreas Lincke (UT) Electronic Business Ne-
gotiation: Some Experimental Studies on theInteraction between Medium, Innovation Con-text and Cult
11 Simon Keizer (UT) Reasoning under Uncer-tainty in Natural Language Dialogue usingBayesian Networks
12 Roeland Ordelman (UT) Dutch Speech Recog-nition in Multimedia Information Retrieval
13 Jeroen Donkers (UM) Nosce Hostem – Search-ing with Opponent Models
14 Stijn Hoppenbrouwers (KUN) Freezing Lan-guage: Conceptualisation Processes across ICT-Supported Organisations
15 Mathijs de Weerdt (TUD) Plan Merging inMulti-Agent Systems
16 Menzo Windhouwer (CWI) Feature GrammarSystems - Incremental Maintenance of Indexesto Digital Media Warehouse
17 David Jansen (UT) Extensions of Statechartswith Probability, Time, and Stochastic Timing
18 Levente Kocsis (UM) Learning Search Decisions
2004
1 Virginia Dignum (UU) A Model for Organiza-tional Interaction: Based on Agents, Foundedin Logic
2 Lai Xu (UvT) Monitoring Multi-party Contractsfor E-business
3 Perry Groot (VU) A Theoretical and EmpiricalAnalysis of Approximation in Symbolic ProblemSolving
4 Chris van Aart (UvA) Organizational Principlesfor Multi-Agent Architectures
5 Viara Popova (EUR) Knowledge Discovery andMonotonicity
6 Bart-Jan Hommes (TUD) The Evaluation ofBusiness Process Modeling Techniques

SIKS Dissertation Series
7 Elise Boltjes (UM) VoorbeeldIG Onderwijs;Voorbeeldgestuurd Onderwijs, een Opstap naarAbstract Denken, vooral voor Meisjes
8 Joop Verbeek (UM) Politie en de Nieuwe In-ternationale Informatiemarkt, GrensregionalePolitiele Gegevensuitwisseling en Digitale Exper-tise
9 Martin Caminada (VU) For the Sake of theArgument; Explorations into Argument-basedReasoning
10 Suzanne Kabel (UvA) Knowledge-rich Indexingof Learning-objects
11 Michel Klein (VU) Change Management forDistributed Ontologies
12 The Duy Bui (UT) Creating Emotions and Fa-cial Expressions for Embodied Agents
13 Wojciech Jamroga (UT) Using Multiple Modelsof Reality: On Agents who Know how to Play
14 Paul Harrenstein (UU) Logic in Conflict. Logi-cal Explorations in Strategic Equilibrium
15 Arno Knobbe (UU) Multi-Relational Data Min-ing
16 Federico Divina (VU) Hybrid Genetic Rela-tional Search for Inductive Learning
17 Mark Winands (UM) Informed Search in Com-plex Games
18 Vania Bessa Machado (UvA) Supporting theConstruction of Qualitative Knowledge Models
19 Thijs Westerveld (UT) Using generative proba-bilistic models for multimedia retrieval
20 Madelon Evers (Nyenrode) Learning from De-sign: facilitating multidisciplinary design teams
2005
1 Floor Verdenius (UvA) Methodological Aspectsof Designing Induction-Based Applications
2 Erik van der Werf (UM) AI techniques for thegame of Go
3 Franc Grootjen (RUN) A Pragmatic Approachto the Conceptualisation of Language
4 Nirvana Meratnia (UT) Towards Database Sup-port for Moving Object data
5 Gabriel Infante-Lopez (UvA) Two-Level Proba-bilistic Grammars for Natural Language Pars-ing
6 Pieter Spronck (UM) Adaptive Game AI7 Flavius Frasincar (TU/e) Hypermedia Presenta-
tion Generation for Semantic Web InformationSystems
8 Richard Vdovjak (TU/e) A Model-driven Ap-proach for Building Distributed Ontology-basedWeb Applications
9 Jeen Broekstra (VU) Storage, Querying andInferencing for Semantic Web Languages
10 Anders Bouwer (UvA) Explaining Behaviour:Using Qualitative Simulation in InteractiveLearning Environments
11 Elth Ogston (VU) Agent Based Matchmakingand Clustering - A Decentralized Approach toSearch
12 Csaba Boer (EUR) Distributed Simulation inIndustry
13 Fred Hamburg (UL) Een Computermodel voorhet Ondersteunen van Euthanasiebeslissingen
14 Borys Omelayenko (VU) Web-Service config-uration on the Semantic Web; Exploring howsemantics meets pragmatics
15 Tibor Bosse (VU) Analysis of the Dynamics ofCognitive Processes
16 Joris Graaumans (UU) Usability of XML QueryLanguages
17 Boris Shishkov (TUD) Software SpecificationBased on Re-usable Business Components
18 Danielle Sent (UU) Test-selection strategies forprobabilistic networks
19 Michel van Dartel (UM) Situated Representa-tion
20 Cristina Coteanu (UL) Cyber Consumer Law,State of the Art and Perspectives
21 Wijnand Derks (UT) Improving Concurrencyand Recovery in Database Systems by ExploitingApplication Semantics
2006
1 Samuil Angelov (TU/e) Foundations of B2BElectronic Contracting
2 Cristina Chisalita (VU) Contextual issues in thedesign and use of information technology inorganizations
3 Noor Christoph (UvA) The role of metacogni-tive skills in learning to solve problems
4 Marta Sabou (VU) Building Web Service On-tologies
5 Cees Pierik (UU) Validation Techniques forObject-Oriented Proof Outlines
6 Ziv Baida (VU) Software-aided ServiceBundling - Intelligent Methods & Tools forGraphical Service Modeling
7 Marko Smiljanic (UT) XML schema matching –balancing efficiency and effectiveness by meansof clustering
8 Eelco Herder (UT) Forward, Back and HomeAgain - Analyzing User Behavior on the Web
9 Mohamed Wahdan (UM) Automatic Formula-tion of the Auditor’s Opinion

SIKS Dissertation Series
10 Ronny Siebes (VU) Semantic Routing in Peer-to-Peer Systems
11 Joeri van Ruth (UT) Flattening Queries overNested Data Types
12 Bert Bongers (VU) Interactivation - Towardsan e-cology of people, our technological envi-ronment, and the arts
13 Henk-Jan Lebbink (UU) Dialogue and DecisionGames for Information Exchanging Agents
14 Johan Hoorn (VU) Software Requirements: Up-date, Upgrade, Redesign - towards a Theory ofRequirements Change
15 Rainer Malik (UU) CONAN: Text Mining in theBiomedical Domain
16 Carsten Riggelsen (UU) Approximation Meth-ods for Efficient Learning of Bayesian Networks
17 Stacey Nagata (UU) User Assistance for Multi-tasking with Interruptions on a Mobile Device
18 Valentin Zhizhkun (UvA) Graph transforma-tion for Natural Language Processing
19 Birna van Riemsdijk (UU) Cognitive Agent Pro-gramming: A Semantic Approach
20 Marina Velikova (UvT) Monotone models forprediction in data mining
21 Bas van Gils (RUN) Aptness on the Web22 Paul de Vrieze (RUN) Fundaments of Adaptive
Personalisation23 Ion Juvina (UU) Development of Cognitive
Model for Navigating on the Web24 Laura Hollink (VU) Semantic Annotation for
Retrieval of Visual Resources25 Madalina Drugan (UU) Conditional log-
likelihood MDL and Evolutionary MCMC26 Vojkan Mihajlovic (UT) Score Region Algebra:
A Flexible Framework for Structured Informa-tion Retrieval
27 Stefano Bocconi (CWI) Vox Populi: generatingvideo documentaries from semantically anno-tated media repositories
28 Borkur Sigurbjornsson (UvA) Focused Informa-tion Access using XML Element Retrieval
2007
1 Kees Leune (UvT) Access Control and Service-Oriented Architectures
2 Wouter Teepe (RUG) Reconciling InformationExchange and Confidentiality: A Formal Ap-proach
3 Peter Mika (VU) Social Networks and the Se-mantic Web
4 Jurriaan van Diggelen (UU) Achieving Seman-tic Interoperability in Multi-agent Systems: adialogue-based approach
5 Bart Schermer (UL) Software Agents, Surveil-lance, and the Right to Privacy: a LegislativeFramework for Agent-enabled Surveillance
6 Gilad Mishne (UvA) Applied Text Analytics forBlogs
7 Natasa Jovanovic’ (UT) To Whom It May Con-cern - Addressee Identification in Face-to-FaceMeetings
8 Mark Hoogendoorn (VU) Modeling of Changein Multi-Agent Organizations
9 David Mobach (VU) Agent-Based Mediated Ser-vice Negotiation
10 Huib Aldewereld (UU) Autonomy vs. Confor-mity: an Institutional Perspective on Norms andProtocols
11 Natalia Stash (TU/e) Incorporating Cogni-tive/Learning Styles in a General-Purpose Adap-tive Hypermedia System
12 Marcel van Gerven (RUN) Bayesian Networksfor Clinical Decision Support: A Rational Ap-proach to Dynamic Decision-Making under Un-certainty
13 Rutger Rienks (UT) Meetings in Smart Environ-ments; Implications of Progressing Technology
14 Niek Bergboer (UM) Context-Based ImageAnalysis
15 Joyca Lacroix (UM) NIM: a Situated Computa-tional Memory Model
16 Davide Grossi (UU) Designing Invisible Hand-cuffs. Formal investigations in Institutions andOrganizations for Multi-agent Systems
17 Theodore Charitos (UU) Reasoning with Dy-namic Networks in Practice
18 Bart Orriens (UvT) On the development andmanagement of adaptive business collabora-tions
19 David Levy (UM) Intimate relationships withartificial partners
20 Slinger Jansen (UU) Customer ConfigurationUpdating in a Software Supply Network
21 Karianne Vermaas (UU) Fast diffusion andbroadening use: A research on residential adop-tion and usage of broadband internet in theNetherlands between 2001 and 2005
22 Zlatko Zlatev (UT) Goal-oriented design ofvalue and process models from patterns
23 Peter Barna (TU/e) Specification of ApplicationLogic in Web Information Systems

SIKS Dissertation Series
24 Georgina Ramırez Camps (CWI) StructuralFeatures in XML Retrieval
25 Joost Schalken (VU) Empirical Investigationsin Software Process Improvement
2008
1 Katalin Boer-Sorban (EUR) Agent-Based Sim-ulation of Financial Markets: A modular,continuous-time approach
2 Alexei Sharpanskykh (VU) On Computer-AidedMethods for Modeling and Analysis of Organi-zations
3 Vera Hollink (UvA) Optimizing hierarchicalmenus: a usage-based approach
4 Ander de Keijzer (UT) Management of Uncer-tain Data - towards unattended integration
5 Bela Mutschler (UT) Modeling and simulatingcausal dependencies on process-aware informa-tion systems from a cost perspective
6 Arjen Hommersom (RUN) On the Applicationof Formal Methods to Clinical Guidelines, anArtificial Intelligence Perspective
7 Peter van Rosmalen (OU) Supporting the tutorin the design and support of adaptive e-learning
8 Janneke Bolt (UU) Bayesian Networks: Aspectsof Approximate Inference
9 Christof van Nimwegen (UU) The paradoxof the guided user: assistance can be counter-effective
10 Wauter Bosma (UT) Discourse oriented Sum-marization
11 Vera Kartseva (VU) Designing Controls for Net-work Organizations: a Value-Based Approach
12 Jozsef Farkas (RUN) A Semiotically orientedCognitive Model of Knowledge Representation
13 Caterina Carraciolo (UvA) Topic Driven Accessto Scientific Handbooks
14 Arthur van Bunningen (UT) Context-AwareQuerying; Better Answers with Less Effort
15 Martijn van Otterlo (UT) The Logic of AdaptiveBehavior: Knowledge Representation and Algo-rithms for the Markov Decision Process Frame-work in First-Order Domains
16 Henriette van Vugt (VU) Embodied Agentsfrom a User’s Perspective
17 Martin Op’t Land (TUD) Applying Architectureand Ontology to the Splitting and Allying ofEnterprises
18 Guido de Croon (UM) Adaptive Active Vision19 Henning Rode (UT) From document to entity
retrieval: improving precision and performanceof focused text search
20 Rex Arendsen (UvA) Geen bericht, goed bericht.Een onderzoek naar de effecten van de introduc-tie van elektronisch berichtenverkeer met eenoverheid op de administratieve lasten van bedri-jven
21 Krisztian Balog (UvA) People search in the en-terprise
22 Henk Koning (UU) Communication of IT-architecture
23 Stefan Visscher (UU) Bayesian network mod-els for the management of ventilator-associatedpneumonia
24 Zharko Aleksovski (VU) Using backgroundknowledge in ontology matching
25 Geert Jonker (UU) Efficient and Equitable ex-change in air traffic management plan repairusing spender-signed currency
26 Marijn Huijbregts (UT) Segmentation, diariza-tion and speech transcription: surprise dataunraveled
27 Hubert Vogten (OU) Design and implementa-tion strategies for IMS learning design
28 Ildiko Flesh (RUN) On the use of independencerelations in Bayesian networks
29 Dennis Reidsma (UT) Annotations and subjec-tive machines- Of annotators, embodied agents,users, and other humans
30 Wouter van Atteveldt (VU) Semantic networkanalysis: techniques for extracting, representingand querying media content
31 Loes Braun (UM) Pro-active medical informa-tion retrieval
32 Trung B. Hui (UT) Toward affective dialoguemanagement using partially observable markovdecision processes
33 Frank Terpstra (UvA) Scientific workflow de-sign; theoretical and practical issues
34 Jeroen de Knijf (UU) Studies in Frequent TreeMining
35 Benjamin Torben-Nielsen (UvT) Dendritic mor-phology: function shapes structure
2009
1 Rasa Jurgelenaite (RUN) Symmetric CausalIndependence Models
2 Willem Robert van Hage (VU) EvaluatingOntology-Alignment Techniques
3 Hans Stol (UvT) A Framework for Evidence-based Policy Making Using IT
4 Josephine Nabukenya (RUN) Improving theQuality of Organisational Policy Making usingCollaboration Engineering

SIKS Dissertation Series
5 Sietse Overbeek (RUN) Bridging Supply andDemand for Knowledge Intensive Tasks - Basedon Knowledge, Cognition, and Quality
6 Muhammad Subianto (UU) UnderstandingClassification
7 Ronald Poppe (UT) Discriminative Vision-Based Recovery and Recognition of Human Mo-tion
8 Volker Nannen (VU) Evolutionary Agent-BasedPolicy Analysis in Dynamic Environments
9 Benjamin Kanagwa (RUN) Design, Discoveryand Construction of Service-oriented Systems
10 Jan Wielemaker (UvA) Logic programming forknowledge-intensive interactive applications
11 Alexander Boer (UvA) Legal Theory, Sourcesof Law & the Semantic Web
12 Peter Massuthe (TU/e, Humboldt-Universtatzu Berlin) Operating Guidelines for Services
13 Steven de Jong (UM) Fairness in Multi-AgentSystems
14 Maksym Korotkiy (VU) From ontology-enabledservices to service-enabled ontologies (makingontologies work in e-science with ONTO-SOA)
15 Rinke Hoekstra (UvA) Ontology Representa-tion - Design Patterns and Ontologies that MakeSense
16 Fritz Reul (UvT) New Architectures in Com-puter Chess
17 Laurens van der Maaten (UvT) Feature Extrac-tion from Visual Data
18 Fabian Groffen (CWI) Armada, An EvolvingDatabase System
19 Valentin Robu (CWI) Modeling Preferences,Strategic Reasoning and Collaboration in Agent-Mediated Electronic Markets
20 Bob van der Vecht (UU) Adjustable Autonomy:Controling Influences on Decision Making
21 Stijn Vanderlooy (UM) Ranking and ReliableClassification
22 Pavel Serdyukov (UT) Search For Expertise:Going beyond direct evidence
23 Peter Hofgesang (VU) Modelling Web Usage ina Changing Environment
24 Annerieke Heuvelink (VU) Cognitive Modelsfor Training Simulations
25 Alex van Ballegooij (CWI) “RAM: ArrayDatabase Management through Relational Map-ping”
26 Fernando Koch (UU) An Agent-Based Model forthe Development of Intelligent Mobile Services
27 Christian Glahn (OU) Contextual Support ofsocial Engagement and Reflection on the Web
28 Sander Evers (UT) Sensor Data Managementwith Probabilistic Models
29 Stanislav Pokraev (UT) Model-Driven SemanticIntegration of Service-Oriented Applications
30 Marcin Zukowski (CWI) Balancing vectorizedquery execution with bandwidth-optimized stor-age
31 Sofiya Katrenko (UvA) A Closer Look at Learn-ing Relations from Text
32 Rik Farenhorst and Remco de Boer (VU) Archi-tectural Knowledge Management: SupportingArchitects and Auditors
33 Khiet Truong (UT) How Does Real Affect AffectAffect Recognition In Speech?
34 Inge van de Weerd (UU) Advancing in Soft-ware Product Management: An IncrementalMethod Engineering Approach
35 Wouter Koelewijn (UL) Privacy en Poli-tiegegevens; Over geautomatiseerde normatieveinformatie-uitwisseling
36 Marco Kalz (OUN) Placement Support forLearners in Learning Networks
37 Hendrik Drachsler (OUN) Navigation Supportfor Learners in Informal Learning Networks
38 Riina Vuorikari (OU) Tags and self-organisation: a metadata ecology for learningresources in a multilingual context
39 Christian Stahl (TUE, Humboldt-Universitatzu Berlin) Service Substitution – A BehavioralApproach Based on Petri Nets
40 Stephan Raaijmakers (UvT) Multinomial Lan-guage Learning: Investigations into the Geome-try of Language
41 Igor Berezhnyy (UvT) Digital Analysis of Paint-ings
42 Toine Bogers (UvT) Recommender Systems forSocial Bookmarking
43 Virginia Nunes Leal Franqueira (UT) FindingMulti-step Attacks in Computer Networks usingHeuristic Search and Mobile Ambients
44 Roberto Santana Tapia (UT) AssessingBusiness-IT Alignment in Networked Organi-zations
45 Jilles Vreeken (UU) Making Pattern MiningUseful
46 Loredana Afanasiev (UvA) Querying XML:Benchmarks and Recursion
2010
1 Matthijs van Leeuwen (UU) Patterns that Mat-ter
2 Ingo Wassink (UT) Work flows in Life Science

SIKS Dissertation Series
3 Joost Geurts (CWI) A Document EngineeringModel and Processing Framework for Multime-dia documents
4 Olga Kulyk (UT) Do You Know What I Know?Situational Awareness of Co-located Teams inMultidisplay Environments
5 Claudia Hauff (UT) Predicting the Effectivenessof Queries and Retrieval Systems
6 Sander Bakkes (UvT) Rapid Adaptation ofVideo Game AI
7 Wim Fikkert (UT) Gesture interaction at a Dis-tance
8 Krzysztof Siewicz (UL) Towards an ImprovedRegulatory Framework of Free Software. Pro-tecting user freedoms in a world of softwarecommunities and eGovernments
9 Hugo Kielman (UL) A Politiele gegevensverw-erking en Privacy, Naar een effectieve waarborg-ing
10 Rebecca Ong (UL) Mobile Communication andProtection of Children
11 Adriaan Ter Mors (TUD) The world accordingto MARP: Multi-Agent Route Planning
12 Susan van den Braak (UU) Sensemaking soft-ware for crime analysis
13 Gianluigi Folino (RUN) High Performance DataMining using Bio-inspired techniques
14 Sander van Splunter (VU) Automated Web Ser-vice Reconfiguration
15 Lianne Bodenstaff (UT) Managing DependencyRelations in Inter-Organizational Models
16 Sicco Verwer (TUD) Efficient Identification ofTimed Automata, theory and practice
17 Spyros Kotoulas (VU) Scalable Discovery ofNetworked Resources: Algorithms, Infrastruc-ture, Applications
18 Charlotte Gerritsen (VU) Caught in the Act:Investigating Crime by Agent-Based Simulation
19 Henriette Cramer (UvA) People’s Responses toAutonomous and Adaptive Systems
20 Ivo Swartjes (UT) Whose Story Is It Anyway?How Improv Informs Agency and Authorship ofEmergent Narrative
21 Harold van Heerde (UT) Privacy-aware datamanagement by means of data degradation
22 Michiel Hildebrand (CWI) End-user Supportfor Access to Heterogeneous Linked Data
23 Bas Steunebrink (UU) The Logical Structure ofEmotions
24 Dmytro Tykhonov (TUD) Designing Genericand Efficient Negotiation Strategies
25 Zulfiqar Ali Memon (VU) Modelling Human-Awareness for Ambient Agents: A Human Min-dreading Perspective
26 Ying Zhang (CWI) XRPC: Efficient DistributedQuery Processing on Heterogeneous XQuery En-gines
27 Marten Voulon (UL) Automatisch contracteren28 Arne Koopman (UU) Characteristic Relational
Patterns29 Stratos Idreos (CWI) Database Cracking: To-
wards Auto-tuning Database Kernels30 Marieke van Erp (UvT) Accessing Natural His-
tory - Discoveries in data cleaning, structuring,and retrieval
31 Victor de Boer (UvA) Ontology Enrichmentfrom Heterogeneous Sources on the Web
32 Marcel Hiel (UvT) An Adaptive Service Ori-ented Architecture: Automatically solving Inter-operability Problems
33 Robin Aly (UT) Modeling Representation Uncer-tainty in Concept-Based Multimedia Retrieval
34 Teduh Dirgahayu (UT) Interaction Design inService Compositions
35 Dolf Trieschnigg (UT) Proof of Concept:Concept-based Biomedical Information Re-trieval
36 Jose Janssen (OU) Paving the Way for LifelongLearning; Facilitating competence developmentthrough a learning path specification
37 Niels Lohmann (TUE) Correctness of servicesand their composition
38 Dirk Fahland (TUE) From Scenarios to compo-nents
39 Ghazanfar Farooq Siddiqui (VU) Integrativemodeling of emotions in virtual agents
40 Mark van Assem (VU) Converting and Integrat-ing Vocabularies for the Semantic Web
41 Guillaume Chaslot (UM) Monte-Carlo TreeSearch
42 Sybren de Kinderen (VU) Needs-driven servicebundling in a multi-supplier setting - the com-putational e3-service approach
43 Peter van Kranenburg (UU) A ComputationalApproach to Content-Based Retrieval of FolkSong Melodies
44 Pieter Bellekens (TUE) An Approach towardsContext-sensitive and User-adapted Access toHeterogeneous Data Sources, Illustrated in theTelevision Domain
45 Vasilios Andrikopoulos (UvT) A theory andmodel for the evolution of software services
SIKS Dissertation Series
46 Vincent Pijpers (VU) e3alignment: ExploringInter-Organizational Business-ICT Alignment
47 Chen Li (UT) Mining Process Model Variants:Challenges, Techniques, Examples
48 Milan Lovric (EUR) Behavioral Finance andAgent-Based Artificial Markets
49 Jahn-Takeshi Saito (UM) Solving difficult gamepositions
50 Bouke Huurnink (UvA) Search in AudiovisualBroadcast Archives
51 Alia Khairia Amin (CWI) Understanding andsupporting information seeking tasks in multi-ple sources
52 Peter-Paul van Maanen (VU) Adaptive Supportfor Human-Computer Teams: Exploring the Useof Cognitive Models of Trust and Attention
53 Edgar J. Meij (UvA) Combining Concepts andLanguage Models for Information Access
2011
1 Botond Cseke (RUN) Variational Algorithmsfor Bayesian Inference in Latent Gaussian Mod-els
2 Nick Tinnemeier (UU) Work flows in Life Sci-ence
3 Jan Martijn van der Werf (TUE) CompositionalDesign and Verification of Component-Based In-formation Systems
4 Hado van Hasselt (UU) Insights in Reinforce-ment Learning; Formal analysis and empiricalevaluation of temporal-difference learning algo-rithms
5 Base van der Raadt (VU) Enterprise Architec-ture Coming of Age - Increasing the Performanceof an Emerging Discipline
6 Yiwen Wang (TUE) Semantically-EnhancedRecommendations in Cultural Heritage
7 Yujia Cao (UT) Multimodal Information Pre-sentation for High Load Human Computer In-teraction
8 Nieske Vergunst (UU) BDI-based Generation ofRobust Task-Oriented Dialogues
9 Tim de Jong (OU) Contextualised Mobile Me-dia for Learning
10 Bart Bogaert (UvT) Cloud Content Contention11 Dhaval Vyas (UT) Designing for Awareness: An
Experience-focused HCI Perspective12 Carmen Bratosin (TUE) Grid Architecture for
Distributed Process Mining13 Xiaoyu Mao (UvT) Airport under Control. Mul-
tiagent Scheduling for Airport Ground Handling
14 Milan Lovric (EUR) Behavioral Finance andAgent-Based Artificial Markets
15 Marijn Koolen (UvA) The Meaning of Struc-ture: the Value of Link Evidence for InformationRetrieval
16 Maarten Schadd (UM) Selective Search inGames of Different Complexity
17 Jiyin He (UvA) Exploring Topic Structure: Co-herence, Diversity and Relatedness
18 Mark Ponsen (UM) Strategic Decision-Makingin complex games
19 Ellen Rusman (OU) The Mind ’ s Eye on Per-sonal Profiles
20 Qing Gu (VU) Guiding service-oriented soft-ware engineering - A view-based approach
21 Linda Terlouw (TUD) Modularization andSpecification of Service-Oriented System
22 Junte Zhang (UvA) System Evaluation ofArchival Description and Access
23 Wouter Weerkamp (UvA) Finding People andtheir Utterances in Social Media
24 Herwin van Welbergen (UT) Behavior Gener-ation for Interpersonal Coordination with Vir-tual Humans On Specifying, Scheduling andRealizing Multimodal Virtual Human Behavior
25 Syed Waqar ul Qounain Jaffry (VU) Analysisand Validation of Models for Trust Dynamics
26 Matthijs Aart Pontier (VU) Virtual Agents forHuman Communication - Emotion Regulationand Involvement-Distance Trade-Offs in Embod-ied Conversational Agents and Robots
27 Aniel Bhulai (VU) Dynamic website optimiza-tion through autonomous management of de-sign patterns
28 Rianne Kaptein (UvA) Effective Focused Re-trieval by Exploiting Query Context and Docu-ment Structure
29 Faisal Kamiran (TUE) Discrimination-awareClassification
30 Egon van den Broek (UT) Affective Signal Pro-cessing (ASP): Unraveling the mystery of emo-tions
31 Ludo Waltman (EUR) Computational andGame-Theoretic Approaches for ModelingBounded Rationality
32 Nees-Jan van Eck (EUR) Methodological Ad-vances in Bibliometric Mapping of Science
33 Tom van der Weide (UU) Arguing to MotivateDecisions
34 Paolo Turrini (UU) Strategic Reasoning in In-terdependence: Logical and Game-theoreticalInvestigations
35 Maaike Harbers (UU) Explaining Agent Behav-ior in Virtual Training
SIKS Dissertation Series
36 Erik van der Spek (UU) Experiments in seriousgame design: a cognitive approach
37 Adriana Burlutiu (RUN) Machine Learningfor Pairwise Data, Applications for PreferenceLearning and Supervised Network Inference
38 Nyree Lemmens (UM) Bee-inspired DistributedOptimization
39 Joost Westra (UU) Organizing Adaptation us-ing Agents in Serious Games
40 Viktor Clerc (VU) Architectural KnowledgeManagement in Global Software Development
41 Luan Ibraimi (UT) Cryptographically EnforcedDistributed Data Access Control
42 Boris Reuderink (UT) Robust Brain-ComputerInterfaces
43 Herman Stehouwer (UvT) Statistical LanguageModels for Alternative Sequence Selection
44 Beibei Hu (TUD) Towards Contextualized In-formation Delivery: A Rule-based Architecturefor the Domain of Mobile Police Work
45 Azizi Bin Ab Aziz (VU) Exploring Computa-tional Models for Intelligent Support of Personswith Depression
46 Mark Ter Maat (UT) Response Selection andTurn-taking for a Sensitive Artificial ListeningAgent
47 Andreea Niculescu (UT) Conversational inter-faces for task-oriented spoken dialogues: designaspects influencing interaction quality
2012
1 Terry Kakeeto (UvT) Relationship Marketingfor SMEs in Uganda
2 Muhammad Umair (VU) Adaptivity, emotion,and Rationality in Human and Ambient AgentModels
3 Adam Vanya (VU) Supporting Architecture Evo-lution by Mining Software Repositories
4 Jurriaan Souer (UU) Development of ContentManagement System-based Web Applications
5 Marijn Plomp (UU) Maturing Interorganisa-tional Information Systems
6 Wolfgang Reinhardt (OU) Awareness Supportfor Knowledge Workers in Research Networks
7 Rianne van Lambalgen (VU) When the GoingGets Tough: Exploring Agent-based Models ofHuman Performance under Demanding Condi-tions
8 Gerben de Vries (UvA) Kernel Methods for Ves-sel Trajectories
9 Ricardo Neisse (UT) Trust and Privacy Manage-ment Support for Context-Aware Service Plat-forms
10 David Smits (TUE) Towards a Generic Dis-tributed Adaptive Hypermedia Environment
11 J.C.B. Rantham Prabhakara (TUE) ProcessMining in the Large: Preprocessing, Discovery,and Diagnostics
12 Kees van der Sluijs (TUE) Model Driven Designand Data Integration in Semantic Web Informa-tion Systems
13 Suleman Shahid (UvT) Fun and Face: Explor-ing non-verbal expressions of emotion duringplayful interactions
14 Evgeny Knutov (TUE) Generic AdaptationFramework for Unifying Adaptive Web-basedSystems
15 Natalie van der Wal (VU) Social Agents. Agent-Based Modelling of Integrated Internal and So-cial Dynamics of Cognitive and Affective Pro-cesses
16 Fiemke Both (VU) Helping people by under-standing them - Ambient Agents supporting taskexecution and depression treatment
17 Amal Elgammal (UvT) Towards a Comprehen-sive Framework for Business Process Compli-ance
18 Eltjo Poort (VU) Improving Solution Architect-ing Practices
19 Helen Schonenberg (TUE) What’s Next? Oper-ational Support for Business Process Execution
20 Ali Bahramisharif (RUN) Covert Visual Spa-tial Attention, a Robust Paradigm for Brain-Computer Interfacing
21 Roberto Cornacchia (TUD) Querying SparseMatrices for Information Retrieval
22 Thijs Vis (UvT) Intelligence, politie en veilighei-dsdienst: verenigbare grootheden?
23 Christian Muehl (UT) Toward Affective Brain-Computer Interfaces: Exploring the Neurophysi-ology of Affect during Human Media Interaction
24 Laurens van der Werff (UT) Evaluation ofNoisy Transcripts for Spoken Document Re-trieval
25 Silja Eckartz (UT) Managing the BusinessCase Development in Inter-Organizational ITProjects: A Methodology and its Application
26 Emile de Maat (UvA) Making Sense of LegalText
27 Hayrettin Gurkok (UT) Mind the Sheep! UserExperience Evaluation & Brain-Computer Inter-face Games

SIKS Dissertation Series
28 Nancy Pascall (UvT) Engendering TechnologyEmpowering Women
29 Almer Tigelaar (UT) Peer-to-Peer InformationRetrieval
30 Alina Pommeranz (TUD) Designing Human-Centered Systems for Reflective Decision Making
31 Emily Bagarukayo (RUN) A Learning by Con-struction Approach for Higher Order CognitiveSkills Improvement, Building Capacity and In-frastructure
32 Wietske Visser (TUD) Qualitative multi-criteria preference representation and reason-ing
33 Rory Sie (OUN) Coalitions in Cooperation Net-works (COCOON)
34 Pavol Jancura (RUN) Evolutionary analysis inPPI networks and applications
35 Evert Haasdijk (VU) Never Too Old To Learn –On-line Evolution of Controllers in Swarm- andModular Robotics
36 Denis Ssebugwawo (RUN) Analysis and Eval-uation of Collaborative Modeling Processes
37 Agnes Nakakawa (RUN) A Collaboration Pro-cess for Enterprise Architecture Creation
38 Selmar Smit (VU) Parameter Tuning and Sci-entific Testing in Evolutionary Algorithms
39 Hassan Fatemi (UT) Risk-aware design of valueand coordination networks
40 Agus Gunawan (UvT) Information Access forSMEs in Indonesia
41 Sebastian Kelle (OU) Game Design Patterns forLearning
42 Dominique Verpoorten (OU) Reflection Ampli-fiers in self-regulated Learning
43 () Withdrawn44 Anna Tordai (VU) On Combining Alignment
Techniques45 Benedikt Kratz (UvT) A Model and Language
for Business-aware Transactions46 Simon Carter (UvA) Exploration and Exploita-
tion of Multilingual Data for Statistical Ma-chine Translation
47 Manos Tsagkias (UvA) Mining Social Media:Tracking Content and Predicting Behavior