Fish and Wildlife Habitat Restoration in the Milwaukee Estuary AOC

Milwaukee Estuary Remedial Action Plan
progress through January 1994
A Plan to Clean Up Milwaukee's Rivers and Harbors
A Wisconsin Water Qualify
Management Program

TOTHEREADER
&To the Reader
"The lakes and rivers sustain us; they flow through the veins of the earth and into our own. But we must take care to let them flow back out as pure as they came, not poison and waste them without thought for the future.''
U.S. Vice President A I Gore, Earth in the Balance
We appreciate your interest in the quality of life in the Milwaukee River Basin. This Remedial Action Plan (RAP) for the Milwaukee Estuary Area of Concern (AOC) describes what, why, and how area groups are working to improve that quality. This section is meant to help you understand and find your way around this report by briefly discussing these topics:
Introduction Continuous Improvement Answering Your Questions Acknowledgements
Introduction
This report documents the progress made in RAP Stage 2 to recommend remedial actions. These actions, listed as RAP recommendations in Chapter 7, begin to address the RAP goals and objectives in Chapter 4 that were developed in Stage 1. It also describes strategies for implementing and evaluating these actions. Because this document lays the groundwork for remedial action, specifics about implementation are short term. Future remedial work will incorporate new technologies and knowledge from more intensive monitoring. Periodic progress reports will include details about this future work.
The RAP emphasizes an ecosystem approach to restoring polluted parts of Milwaukee River Basin waterways (all the water that eventually flows into the Milwaukee Estuary), because pollution sources are often located outside the polluted area. One pollution source whose containment is integral to RAP success is contaminated sediment, which stores and re-releases toxicants when disturbed.
Continuous Improvement
Because pollution sources will always exist, the RAP must foster continuous improvement. As long as industries, residential development, and agriculture exist near Milwaukee River Basin waterways, the RAP must identify and contain pollution from these sources.
The work to restore the quality of the Milwaukee River Basin waterways is the immediate challenge ahead of us. To many people's credit, we have already made some progress. Once waterway quality is restored, RAP work will continue in order to maintain this quality.

TOTHEREADER
Question
where is a description of proram "x"?
Answering Your Questions
As you peruse this plan, you may have general or specific questions. The table below and the table of contents on the next page are guides that may help you answer some of them.
Refer to...
Index of Programs. Proiects and Studies
what is the extent of pollution in the Area of Concern (AOC)? where is the AOC?
where does the pollution come from?
Chapter 1: What is the RAP? I what is a Remedial Action Plan (RAP)? why is there a RAP?
Chapter 2: Pollution in the Milwaukee River Basin
Chapter 3: Sources of Pollution
what will we accomplish through the RAP?
what RAP work is in progress?
how is contaminated sediment involved?
what are the RAP'S recommendations? who developed them? how will they be implemented? funded?
how will the RAP implementation take place? how will groups avoid doubling efforts?
how will someone evaluate RAP progress?
what do all these acronyms mean?!??
Chapter 4: RAP Goals and Objectives
Chapter 5 : Reaching RAP Goals Through Existing Programs
Chapter 6: Contaminated Sediment Management Strategy
Chapter 7 RAP Recommendations
Chapter 8: Implementation Strategy
Chapter 9: Monitoring Strategy
List of Acronyms

TOTHEREADER
Acknowledgements
Many people have contributed information and comments in the development of the Milwaukee Estuary Remedial Action Plan. Special thanks go to the Technical and Citizen's Advisory Committees, the staff of the Milwaukee Metropolitan Sewerage District, and the staff of WDNR who were involved in the preparation, typing and review of this document.
Citizen's Advisory Committee Participants
Supervisor Sheila Aldrich Dan Anderson Gary Beech Don Behm Peter Beitzel Representative Jeanette Bell Kathy Bero, Vice-chairperson Robert Biebel Senator Brian Burke Vince Bushell Bruce Colburn Cynthia Collyer Gene Cramer Thurmon Dansby Jeff Eagan John Erickson Representative Margaret Farrow John Haliday, Vice-chairperson Dianne Hammann Robert Harris Ralph Hollmon Steve Jann Carolyn Johnson Joe Kovacich Margo Kuisis
Mary Ladish Diane Markut Edward Madere Ald. Larraine McNamara-McGraw Michael Mervis Sharon Metz Glenn Moder, Chairperson Randy Molex Jay Multhauf Jack Murtaugh Rosemary Oliveira Jacqueline Patterson Milan Racic Rudy Salcedo Steve Skavroneck Eric Skindzelewski Don Slomski Larry Sullivan Gary Swanson Kenneth Szallai Mary Thiry Michael Wisniewski Joan Zepecki


TOTHEREADER
WDNR Staff Contributors and Reviewers
Tom Aartila Jim Amrhein Ted Bosch Rebecca Cors Mike Coshun Jim D'Antuono Mike Bruch Jim Fratrick Frances Koonce Sharon Gayan Therese Gripentrog Harvey Halvorsen Greg Hill Tom Janisch Ruth Johnson Dan Kaemmerer Phil Kaplan Ronald Kamierczak Mike Keniry Jim Kohl Chuck Ledin Lee Liebenstein Todd O'Hara
Milwaukee Estuary RAP Staff
Steve Galameau, primary author Jill Harschlip, primary author Marsha Jones, primary author Richard Sternkopf, primary author Rebecca Cors, technical editor
Steve Mace Gloria McCutcheon James McNelly Sandy Miller Kim Murphy Bob Paulson Scott Redman Jim Schmidt Candy Schrank Sharon Schaver Frank Schultz Tom Sheffy Mark Snopek Al Stenstrup Linda Talbot Donald Tills Danielle Valvassori Bob Wakeman Will Wawrzyn Steve Westenbroek

CONTENTS
contents
List of Tables . . . . . . . . . . . . . . . . . . . . . . . . . . . . . . . . . . . . . . . . . . . . . . . . . . . . . . . . . . . . . . vi
Index of Projects, Programs, and Studies . . . . . . . . . . . . . . . . . . . . . . . . . . . . . . . . . . . . . . . . . . . vii
List of Acronyms and Measurement Units . . . . . . . . . . . . . . . . . . . . . . . . . . . . . . . . . . . . . . . . . x Acronyms . . . . . . . . . . . . . . . . . . . . . . . . . . . . . . . . . . . . . . . . . . . . . . . . . . . . . . . . . . x Measurement Units . . . . . . . . . . . . . . . . . . . . . . . . . . . . . . . . . . . . . . . . . . . . . . . . . . . xv
CHAPTER 1: What is the RAP? . . . . . . . . . . . . . . . . . . . . . . . . . . . . . . . . . . . . . . . . . . . . . . . 1-1 Milwaukee River Basin History . . . . . . . . . . . . . . . . . . . . . . . . . . . . . . . . . . . . . . . . . . 1-1
Historical Development . . . . . . . . . . . . . . . . . . . . . . . . . . . . . . . . . . . . . . . . . . 1-5 Requirements List . . . . . . . . . . . . . . . . . . . . . . . . . . . . . . . . . . . . . . . . . . . . . . 1-6 Ecosystem Approach . . . . . . . . . . . . . . . . . . . . . . . . . . . . . . . . . . . . . . . . . . . . 1-7 RAP Stages . . . . . . . . . . . . . . . . . . . . . . . . . . . . . . . . . . . . . . . . . . . . . . . . . . . 1-8 RAP Documentation . . . . . . . . . . . . . . . . . . . . . . . . . . . . . . . . . . . . . . . . . . . . 1-8
RAP Progress . . . . . . . . . . . . . . . . . . . . . . . . . . . . . . . . . . . . . . . . . . . . . . . . . . . . . . 1-10 Stage 1: Develop Goals and Objectives . . . . . . . . . . . . . . . . . . . . . . . . . . . . . 1-10 Stage 2: Recommend Remedial Action . . . . . . . . . . . . . . . . . . . . . . . . . . . . . . 1-12 Stage 3: Implement and Evaluate Remedial Actions . . . . . . . . . . . . . . . . . . . . 1-13
Characteristics and Conditions . . . . . . . . . . . . . . . . . . . . . . . . . . . . . . . . . . . . . . . . . . . . . . . . . 2-1 Environmental Setting . . . . . . . . . . . . . . . . . . . . . . . . . . . . . . . . . . . . . . . . . . . . . . . . . 2-1
Surface Waters . . . . . . . . . . . . . . . . . . . . . . . . . . . . . . . . . . . . . . . . . . . . . . . . . 2-1
Climate and Topography . . . . . . . . . . . . . . . . . . . . . . . . . . . . . . . . . . . . . . . . . 2-5
Water Supply . . . . . . . . . . . . . . . . . . . . . . . . . . . . . . . . . . . . . . . . . . . . . . . . . . 2-6
Surface Water Quality Standards . . . . . . . . . . . . . . . . . . . . . . . . . . . . . . . . . . . . . . . . . . 2-8 Ecosystem Quality: Water, Biota, and Sediment . . . . . . . . . . . . . . . . . . . . . . . . . . . . . . 2-9
Sediment Quality . . . . . . . . . . . . . . . . . . . . . . . . . . . . . . . . . . . . . . . . . . . . . . 2-13 Impaired Uses of AOC Waterways . . . . . . . . . . . . . . . . . . . . . . . . . . . . . . . . . . . . . . . 2-15
Restrictions on Fish and Wildlife Consumption . . . . . . . . . . . . . . . . . . . . . . . . 2-16 Degradation of Fish and Wildlife Populations . . . . . . . . . . . . . . . . . . . . . . . . . 2-17 Fish Tumors or Other Deformities . . . . . . . . . . . . . . . . . . . . . . . . . . . . . . . . . . 2-18 Bird or Animal Deformities or Reproductive Problems . . . . . . . . . . . . . . . . . . . 2-18 Degradation of Benthos . . . . . . . . . . . . . . . . . . . . . . . . . . . . . . . . . . . . . . . . . 2-18 Restrictions on Dredging Activities . . . . . . . . . . . . . . . . . . . . . . . . . . . . . . . . . 2-18 Eutrophication and Undesirable Algae . . . . . . . . . . . . . . . . . . . . . . . . . . . . . . . 2-19 Beach Closing/Recreational Restrictions . . . . . . . . . . . . . . . . . . . . . . . . . . . . . 2-19 Degradation of Aesthetics . . . . . . . . . . . . . . . . . . . . . . . . . . . . . . . . . . . . . . . . 2-19 Degradation of Zooplankton and Phytoplankton . . . . . . . . . . . . . . . . . . . . . . . .
RAP Purpose . . . . . . . . . . . . . . . . . . . . . . . . . . . . . . . . . . . . . . . . . . . . . . . . . . . . . . . 1-3
CHAPTER 2: Existing Milwaukee River Basin
Land Uses . . . . . . . . . . . . . . . . . . . . . . . . . . . . . . . . . . . . . . . . . . . . . . . . . . . . 2-4
Water Uses . . . . . . . . . . . . . . . . . . . . . . . . . . . . . . . . . . . . . . . . . . . . . . . . . . . . . . . . . 2-6 Navigation . . . . . . . . . . . . . . . . . . . . . . . . . . . . . . . . . . . . . . . . . . . . . . . . . . . . 2-6
Recreation . . . . . . . . . . . . . . . . . . . . . . . . . . . . . . . . . . . . . . . . . . . . . . . . . . . . 2-6
. .
Water Quality . . . . . . . . . . . . . . . . . . . . . . . . . . . . . . . . . . . . . . . . . . . . . . . . . 2-9 Biota Quality . . . . . . . . . . . . . . . . . . . . . . . . . . . . . . . . . . . . . . . . . . . . . . . . . . 2-9
2-20
Milwaukee Estuary RAP i

CONTENTS
Loss of Fish and Wildlife Habitat . . . . . . . . . . . . . . . . . . . . . . . . . . . . . . . . . . 2-21 Unimpaired Uses of AOC Waterways . . . . . . . . . . . . . . . . . . . . . . . . . . . . . . . . . . . . . 2-22
Tainting of Fish and Wildlife Flavor . . . . . . . . . . . . . . . . . . . . . . . . . . . . . . . . 2-22 Added Costs to Agriculture or Industry 2-22 Restrictions on Drinking Water Consumption or Taste and Odor Problems . . . . . 2-22
CHAPTER 3: Sources of Pollution . . . . . . . . . . . . . . . . . . . . . . . . . . . . . . . . . . . . . . . . . . . . . 3-1 Summary of Pollution Sources . . . . . . . . . . . . . . . . . . . . . . . . . . . . . . . . . . . . . . . . . . . 3-2 Point Sources . . . . . . . . . . . . . . . . . . . . . . . . . . . . . . . . . . . . . . . . . . . . . . . . . . . . . . . 3-4
3-4 AOC Industries . . . . . . . . . . . . . . . . . . . . . . . . . . . . . . . . . . . . . . . . . . . . . . . . 3-4 Combined Sewer Overflows . . . . . . . . . . . . . . . . . . . . . . . . . . . . . . . . . . . . . . . 3-4 Spills, Illegal Dumping, and the Improper Disposal of Household Hazardous
Waste . . . . . . . . . . . . . . . . . . . . . . . . . . . . . . . . . . . . . . . . . . . . . . . . . 3-5 Nonpoint Sources . . . . . . . . . . . . . . . . . . . . . . . . . . . . . . . . . . . . . . . . . . . . . . . . . . . . 3-6
Rural . . . . . . . . . . . . . . . . . . . . . . . . . . . . . . . . . . . . . . . . . . . . . . . . . . . . . . . 3-6 Urban . . . . . . . . . . . . . . . . . . . . . . . . . . . . . . . . . . . . . . . . . . . . . . . . . . . . . . . 3-7
Atmospheric Deposition . . . . . . . . . . . . . . . . . . . . . . . . . . . . . . . . . . . . . . . . . . . . . . . . 3-9 Contaminated Sediments . . . . . . . . . . . . . . . . . . . . . . . . . . . . . . . . . . . . . . . . . . . . . . 3-10 Contaminated Groundwater . . . . . . . . . . . . . . . . . . . . . . . . . . . . . . . . . . . . . . . . . . . . 3-11
Leaking Underground Storage Tanks . . . . . . . . . . . . . . . . . . . . . . . . . . . . . . . . 3-11 Landfills . . . . . . . . . . . . . . . . . . . . . . . . . . . . . . . . . . . . . . . . . . . . . . . . . . . . 3-11
Upstream Sites/Sources . . . . . . . . . . . . . . . . . . . . . . . . . . . . . . . . . . . . . . . . . . . . . . . 3-12 Cedar Creek . . . . . . . . . . . . . . . . . . . . . . . . . . . . . . . . . . . . . . . . . . . . . . . . . 3-12 Lincoln Creek . . . . . . . . . . . . . . . . . . . . . . . . . . . . . . . . . . . . . . . . . . . . . . . . 3-13 Moss-American Superfund Site . . . . . . . . . . . . . . . . . . . . . . . . . . . . . . . . . . . . 3-13
CHAPTER 4: RAP Goals and Objectives . . . . . . . . . . . . . . . . . . . . . . . . . . . . . . . . . . . . . . . . 4-1 List of Goals . . . . . . . . . . . . . . . . . . . . . . . . . . . . . . . . . . . . . . . . . . . . . . . . . . . . . . . . 4-1 Purpose . . . . . . . . . . . . . . . . . . . . . . . . . . . . . . . . . . . . . . . . . . . . . . . . . . . . . . . . . . . 4-2 Development . . . . . . . . . . . . . . . . . . . . . . . . . . . . . . . . . . . . . . . . . . . . . . . . . . . . . . . . 4-2 Objectives and Rationale . . . . . . . . . . . . . . . . . . . . . . . . . . . . . . . . . . . . . . . . . . . . . . . 4-3
CHAPTER 5: Reaching RAP Goals Through Existing Programs . . . . . . . . . . . . . . . . . . . . . . . . 5-1 Recognizng Progress . . . . . . . . . . . . . . . . . . . . . . . . . . . . . . . . . . . . . . . . . . . . . . . . . . 5-1 Pollution Abatement and Prevention . . . . . . . . . . . . . . . . . . . . . . . . . . . . . . . . . . . . . . . 5-2
Federal and State Involvement . . . . . . . . . . . . . . . . . . . . . . . . . . . . . . . . . . . . . 5-2 MMSD Water Pollution Abatement Program . . . . . . . . . . . . . . . . . . . . . . . . . . . 5-5 Nonpoint Source Water Pollution Abatement Program . . . . . . . . . . . . . . . . . . . . 5-7 The Greater Milwaukee Toxics Minimization Task Force . . . . . . . . . . . . . . . . . . 5-8 Lake Michigan Federation/MMSD Household Hazardous Waste Education
Project . . . . . . . . . . . . . . . . . . . . . . . . . . . . . . . . . . . . . . . . . . . . . . . . 5-10 Clean Sweep Programs . . . . . . . . . . . . . . . . . . . . . . . . . . . . . . . . . . . . . . . . . . 5-12 Testing the Waters . . . . . . . . . . . . . . . . . . . . . . . . . . . . . . . . . . . . . . . . . . . . . 5-12 Milwaukee River Revitalization Council . . . . . . . . . . . . . . . . . . . . . . . . . . . . . 5-14 EPA - 33/50 Program . . . . . . . . . . . . . . . . . . . . . . . . . . . . . . . . . . . . . . . . . . . 5-15
Resource Management . . . . . . . . . . . . . . . . . . . . . . . . . . . . . . . . . . . . . . . . . . . . . . . . 5-16 Water Resources Management Programs . . . . . . . . . . . . . . . . . . . . . . . . . . . . . 5-16 Wildlife Management Program . . . . . . . . . . . . . . . . . . . . . . . . . . . . . . . . . . . . 5-21 USGS NAWQA Program . . . . . . . . . . . . . . . . . . . . . . . . . . . . . . . . . . . . . . . . 5-21 Lake Michigan Lakewide Management Plan . . . . . . . . . . . . . . . . . . . . . . . . . . . 5-22
. . . . . . . . . . . . . . . . . . . . . . . . . . . . . .
MMSD's Jones Island Wastewater Treatment Facility . . . . . . . . . . . . . . . . . . . . .
. . . .
11 Milwaukee Estuary RAP

CONTENTS
Regulatory Initiatives . . . . . . . . . . . . . . . . . . . . . . . . . . . . . . . . . . . . . . . . . . . . . . . . . 5-23 Wastewater Management Program . . . . . . . . . . . . . . . . . . . . . . . . . . . . . . . . . . 5-23 Permit and Pretreatment Program . . . . . . . . . . . . . . . . . . . . . . . . . . . . . . . . . . 5-25 Solid and Hazardous Waste Management Program . . . . . . . . . . . . . . . . . . . . . . 5-26 Water Regulation and Zoning Program (WDNR) . . . . . . . . . . . . . . . . . . . . . . . 5-30 Air Management Program (WDNR) . . . . . . . . . . . . . . . . . . . . . . . . . . . . . . . . . 5-31 Superfund Program (EPA) . . . . . . . . . . . . . . . . . . . . . . . . . . . . . . . . . . . . . . . 5-32
CHAPTER 6: Contaminated Sediment Management Strategy . . . . . . . . . . . . . . . . . . . . . . . . . . 6-1 Strategy Summary . . . . . . . . . . . . . . . . . . . . . . . . . . . . . . . . . . . . . . . . . . . . . . . . . . . . 6-2 Evaluate and Control Sediment Pollution Sources . . . . . . . . . . . . . . . . . . . . . . . . . . . . . 6-3
. . . . . . . . . . . . . . . . . . . . . . . . . . . . . . . . . . . . . . . . . . . . . . . . . . . . . . . . . . . 6-6 Existing Data . . . . . . . . . . . . . . . . . . . . . . . . . . . . . . . . . . . . . . . . . . . . . . . . . . 6-6 Sediment Characterization . . . . . . . . . . . . . . . . . . . . . . . . . . . . . . . . . . . . . . . . 6-7
Develop and Implement Remedial Options . . . . . . . . . . . . . . . . . . . . . . . . . . . . . . . . . . 6-10 Remedial Option Selection Criteria . . . . . . . . . . . . . . . . . . . . . . . . . . . . . . . . . 6-10 Recent Projects . . . . . . . . . . . . . . . . . . . . . . . . . . . . . . . . . . . . . . . . . . . . . . . 6-11
Strategy Implementation . . . . . . . . . . . . . . . . . . . . . . . . . . . . . . . . . . . . . . . . . . . . . . . 6-12
CHAPTER 7: RAP Recommendations . . . . . . . . . . . . . . . . . . . . . . . . . . . . . . . . . . . . . . . . . . . 7-1 Summary of Recommendations . . . . . . . . . . . . . . . . . . . . . . . . . . . . . . . . . . . . . . . . . . . 7-2
7-4 Recommendation Development by Work Groups . . . . . . . . . . . . . . . . . . . . . . . . . . . . . . . . Assessment and Monitoring Recommendations . . . . . . . . . . . . . . . . . . . . . . . . . . . . . . . 7-6 Demonstration Project Recommendations . . . . . . . . . . . . . . . . . . . . . . . . . . . . . . . . . . 7-32 Information and Education Recommendations . . . . . . . . . . . . . . . . . . . . . . . . . . . . . . . 7-47
CHAPTER 8: Implementation Strategy . . . . . . . . . . . . . . . . . . . . . . . . . . . . . . . . . . . . . . . . . . 8-1
Ecosystem Approach . . . . . . . . . . . . . . . . . . . . . . . . . . . . . . . . . . . . . . . . . . . . 8-3
Overview . . . . . . . . . . . . . . . . . . . . . . . . . . . . . . . . . . . . . . . . . . . . . . . . . . . . . . . . . . 8-1 RAP Implementation Committee (RIC) . . . . . . . . . . . . . . . . . . . . . . . . . . . . . . . 8-1
Public Information and Education . . . . . . . . . . . . . . . . . . . . . . . . . . . . . . . . . . . 8-3 Implementation Strategy . . . . . . . . . . . . . . . . . . . . . . . . . . . . . . . . . . . . . . . . . . . . . . . . 8-4
Implementing Recommendations . . . . . . . . . . . . . . . . . . . . . . . . . . . . . . . . . . . . 8-4 8-4 Who Will Pay for Environmental Clean-up? . . . . . . . . . . . . . . . . . . . . . . . . . . . .
Funding Sources . . . . . . . . . . . . . . . . . . . . . . . . . . . . . . . . . . . . . . . . . . . . . . . 8-5
CHAPTER 9: Monitoring Strategy . . . . . . . . . . . . . . . . . . . . . . . . . . . . . . . . . . . . . . . . . . . . . 9-1 Recommended Approach . . . . . . . . . . . . . . . . . . . . . . . . . . . . . . . . . . . . . . . . . . . . . . . 9-2
Strategy Evolution . . . . . . . . . . . . . . . . . . . . . . . . . . . . . . . . . . . . . . . . . . . . . . 9-2 Data Collection . . . . . . . . . . . . . . . . . . . . . . . . . . . . . . . . . . . . . . . . . . . . . . . . 9-2 Delisting Impaired Waterway Uses . . . . . . . . . . . . . . . . . . . . . . . . . . . . . . . . . . 9-3
Monitoring and RAP Goals . . . . . . . . . . . . . . . . . . . . . . . . . . . . . . . . . . . . . . . . . . . . . 9-4 Monitoring Strategy . . . . . . . . . . . . . . . . . . . . . . . . . . . . . . . . . . . . . . . . . . . . . . . . . . 9-14
GLOSSARY . . . . . . . . . . . . . . . . . . . . . . . . . . . . . . . . . . . . . . . . . . . . . . . . . . . . . . . . . . . . . g1-1
APPENDIX A: Biological Uses of Streams in the Milwaukee River Basin . . . . . . . . . . . . . . . . . . . . . . . . . . . . . . . . . . . . . . . . . . . . . . . . . A-1
Streams of the Milwaukee River North Branch Watershed . . . . . . . . . . . . . . . . . . . . . . . A-2 Streams of the Milwaukee River East-West Branch Watershed . . . . . . . . . . . . . . . . . . . . A-5 Streams of the Milwaukee River South Watershed . . . . . . . . . . . . . . . . . . . . . . . . . . . . . A-9
... Milwaukee Estuary RAP 111

CONTENTS
Streams of the Cedar Creek Watershed . . . . . . . . . . . . . . . . . . . . . . . . . . . . . . . . . . . . A-14 Streams of the Menomonee River Watershed . . . . . . . . . . . . . . . . . . . . . . . . . . . . . . . . A-18 Streams of the Kinnickinnic River Watershed . . . . . . . . . . . . . . . . . . . . . . . . . . . . . . . A-21
APPENDIX B: Pollutants of Concern . . . . . . . . . . . . . . . . . . . . . . . . . . . . . . . . . . . . . . . . . . . B-1
APPENDIX C: Sediment Assessment Methods . . . . . . . . . . . . . . . . . . . . . . . . . . . . . . . . . . . . C-1 The Site-Specific Triad Approach . . . . . . . . . . . . . . . . . . . . . . . . . . . . . . . . . . . . . . . . . C-2
Data Collected for Analysis . . . . . . . . . . . . . . . . . . . . . . . . . . . . . . . . . . . . . . . C-2 Method for Assessment . . . . . . . . . . . . . . . . . . . . . . . . . . . . . . . . . . . . . . . . . . C-5 Application . . . . . . . . . . . . . . . . . . . . . . . . . . . . . . . . . . . . . . . . . . . . . . . . . . . C-5 Project Costs . . . . . . . . . . . . . . . . . . . . . . . . . . . . . . . . . . . . . . . . . . . . . . . . . . C-6 Reference Site Comparison . . . . . . . . . . . . . . . . . . . . . . . . . . . . . . . . . . . . . . . . C-6
Contaminant-Specific Approaches . . . . . . . . . . . . . . . . . . . . . . . . . . . . . . . . . . . . . . . . . C-8 Equilibrium Partitioning Approach . . . . . . . . . . . . . . . . . . . . . . . . . . . . . . . . . . C-9 Tissue Residue Approach . . . . . . . . . . . . . . . . . . . . . . . . . . . . . . . . . . . . . . . . . C-9 Apparent Effects Threshold . . . . . . . . . . . . . . . . . . . . . . . . . . . . . . . . . . . . . . . C-10 Screening Level Concentration . . . . . . . . . . . . . . . . . . . . . . . . . . . . . . . . . . . . C-10
APPENDIX D: Sediment Sampling Densities Comparison . . . . . . . . . . . . . . . . . . . . . . . . . . . . D-1
BIBLIOGRAPHY . . . . . . . . . . . . . . . . . . . . . . . . . . . . . . . . . . . . . . . . . . . . . . . . . . . . . . . . b1b-1
iv Milwaukee Estuary RAP

CONTENTS LIST OF FIGURES
List of Figures
Figure 1.1: The 43 Great Lakes areas of concern; each is degraded to the point that beneficial uses are impaired . (Water Environment Technology. June 1993) . . . . . . 1-4
Figure 1.2: Projected Timetable for the Milwaukee Estuary RAP . . . . . . . . . . . . . . . . . . . . . . 1-9 Figure 2.1: Milwaukee River Basin . . . . . . . . . . . . . . . . . . . . . . . . . . . . . . . . . . . . . . . . . . . 2-2 Figure 2.2: Milwaukee Estuary Area of Concern . . . . . . . . . . . . . . . . . . . . . . . . . . . . . . . . . . 2-3 Figure 6.1: Contaminated Sediment Management Strategy Schedule . . . . . . . . . . . . . . . . . . . 6-17 Figure C.1: Sediment Quality Triad Diagram . (Source: Chapman et a1 . 1992) . . . . . . . . . . . C-5
Milwaukee Estuary RAP

CONTENTS LIST OF TABLES
List of Tables
Table 1.1:
Table 2.1
Table 2.2:
Table 2.3: Table 3.1: Table 3.2: Table 3.3:
Table 5.1: Table 5.2: Table 6.1: Table 6.2: Table 7.1: Table 7.2: Table 8.1: Table 8.2: Table 8.3: Table 9.1:
RAP Requirements from the IJC and Progress Made in the Milwaukee Estuary AOC . . . . . . . . . . . . . . . . . . . . . . . . . . . . . . . . . . . . . . . . . . . . . . . . . . . . . . . . 1-6 Urban and Rural Land Uses (Percent of Watershed) for the Milwaukee River Basin . . . . . . . . . . . . . . . . . . . . . . . . . . . . . . . . . . . . . . . . . . . . . . . . . . . . . . . . 2-4 Endangered, Threatened, and Special Concern Biota of the Milwaukee Estuary AOC . . . . . . . . . . . . . . . . . . . . . . . . . . . . . . . . . . . . . . . . . . . . . . . . . . . . . . . 2-13 Impaired Beneficial Waterway Uses Identified in the Milwaukee Estuary AOC . . 2-15
3-2 3-6
Probability of Storm Water Runoff Exceeding Acute Toxicity Criteria for Warm Water Fish Communities . . . . . . . . . . . . . . . . . . . . . . . . . . . . . . . . . . . . 3-8
5-5 Surface Water Monitoring Program Objectives . . . . . . . . . . . . . . . . . . . . . . . . . 5-17 Significant AOC Sediment Studies to Date . . . . . . . . . . . . . . . . . . . . . . . . . . . . . 6-7
6-10 Summary of RAP Recommendations . . . . . . . . . . . . . . . . . . . . . . . . . . . . . . . . . 7-2
. . . 7-5 8-6 8-8
U.S. EPA RAP Funding Criteria . . . . . . . . . . . . . . . . . . . . . . . . . . . . . . . . . . 8-10 Delisting Criteria and Monitoring Needs . . . . . . . . . . . . . . . . . . . . . . . . . . . . . . 9-10
Causes and Sources of Impaired Uses in the Milwaukee Estuary AOC . . . . . . . . . Rural Phosphorus Loading in the Milwaukee River Basin . . . . . . . . . . . . . . . . . .
MMSD Water Pollution and Abatement Program Actions and Improvements . . . . .
Criteria for Selecting Options for Contaminated Sediment Remediation . . . . . . . .
Recommendations that will be Developed as RAP Implementation Progresses Federal and State Programs That Support Water Quality Remediation . . . . . . . . . . Wisconsin stewardship programs that may fund RAP activities . . . . . . . . . . . . . . .
Table A.l: Biological Uses of Streams in the Milwaukee River Basin . . . . . . . . . . . . . . . . . . . . . A-2 Table B.l: First Priority Pollutants of Concern for the Milwaukee Estuary RAP . . . . . . . . . . . B-2 Table C.1: Table D.l : . . . D-1
Eight Generic Sediment Quality Triad Results and Their Interpretation . . . . . . . . . C-6 A Comparison of Sampling Densities at Various Sediment Remediation Sites
vi Milwaukee Estuary RAP

CONTENTS INDEX OF PROJECTS. PROGRAMS. AND STUDIES
Index of Projects. Programs. and Studies
1989-1990 Urban Storm Water Study on the Menomonee River . . . . . . . . . . . . . . . . . . . . . . . . . 3-8
Aeration of the Menomonee River . . . . . . . . . . . . . . . . . . . . . . . . . . . . . . . . . . . . . . . . . . . . . 7-38 Air Management Program . . . . . . . . . . . . . . . . . . . . . . . . . . . . . . . . . . . . . . . . . . . . . . . 3-10, 5-33 Assess Fish Tissue Contamination . . . . . . . . . . . . . . . . . . . . . . . . . . . . . . . . . . . . . . . . . . . . . 7-16 Assessment and Remediation of Contaminated Sediment (ARCS) . . . . . . . . . . . . . . . . . . . . . . . 6-20 Awareness of Fish Consumption Advisory . . . . . . . . . . . . . . . . . . . . . . . . . . . . . . . . . . . . . . . 7-59
Beach nourishment projects . . . . . . . . . . . . . . . . . . . . . . . . . . . . . . . . . . . . . . . . . . . . . . . . . . 6-16 2-18 7-26
Benthic Organism Surveys prior to 1990 . . . . . . . . . . . . . . . . . . . . . . . . . . . . . . . . . . . . . . . . . Bulk Chemical and Physical Analysis of Identified Sediment Deposits . . . . . . . . . . . . . . . . . . .
CDF Contaminants. Protection of Wildlife From . . . . . . . . . . . . . . . . . . . . . . . . . . . . . . . . . . . . 7-8 Cedar Creek Impoundments . . . . . . . . . . . . . . . . . . . . . . . . . . . . . . . . . . . . . . . . . . . . . . . . . . . 6-7 Clean Sweep Programs . . . . . . . . . . . . . . . . . . . . . . . . . . . . . . . . . . . . . . . . . . . . . . . . . . . . . 5-13 Community Awareness Program . . . . . . . . . . . . . . . . . . . . . . . . . . . . . . . . . . . . . . . . . . . . . . . 7-46 Conventional dredging project in the Netherlands . . . . . . . . . . . . . . . . . . . . . . . . . . . . . . . . . . . 6-8 Cryptosporidium . . . . . . . . . . . . . . . . . . . . . . . . . . . . . . . . . . . . . . . . . . . . . . . . . . . . . . . . . . 2-19 . .
DOD Hazardous Pollution Prevention Audit Grant Program . . . . . . . . . . . . . . . . . . . . . . . . . . . . 5-5
Environmental Awareness Signs . . . . . . . . . . . . . . . . . . . . . . . . . . . . . . . . . . . . . . . . . . . . . . . 7-44 EPA's 33/50 program . . . . . . . . . . . . . . . . . . . . . . . . . . . . . . . . . . . . . . . . . . . . . . . . . . . . . . 5-16
Federal domestic sewage study . . . . . . . . . . . . . . . . . . . . . . . . . . . . . . . . . . . . . . . . . . . . . . . . 5-28 Fish Community Evaluations . . . . . . . . . . . . . . . . . . . . . . . . . . . . . . . . . . . . . . . . . . . . . . . . . 7-12 Fish Health Assessment . . . . . . . . . . . . . . . . . . . . . . . . . . . . . . . . . . . . . . . . . . . . . . . . . . . . . 7-14 Fisheries Management Program . . . . . . . . . . . . . . . . . . . . . . . . . . . . . . . . . . . . . . . . . . . . . . . 5-23
Geographic Information System. Sediment . . . . . . . . . . . . . . . . . . . . . . . . . . . . . . . . . . . . . . . 7-22 Greater Milwaukee Toxics Minimization Task Force . . . . . . . . . . . . . . . . . . . . . . . . . . . . . . . . . 5-9
Hazardous Pollution Prevention Board . . . . . . . . . . . . . . . . . . . . . . . . . . . . . . . . . . . . . . . . . . . 5-3 Household Pollution Prevention Education Program . . . . . . . . . . . . . . . . . . . . . . . . . . . . . . . . . 7-42 Household Hazardous Waste Collection Facility . . . . . . . . . . . . . . . . . . . . . . . . . . . . . . . . . . . 7-30 Howmiller and Scott (1977) pollution classification system . . . . . . . . . . . . . . . . . . . . . . . . . . . 2-11
Milwaukee Estuary RAP vii

CONTENTS INDEX OF PROJECTS. PROGRAMS. AND STUDIES
Lake Michigan Lakewide Management Plan . . . . . . . . . . . . . . . . . . . . . . . . . . . . . . . . . . . . . . 5-24 Lake Michigan Federation/MMSD Household Hazardous Waste Education Project . . . . . . . . . . 5-11 Lincoln Creek Urban Storm Runoff Study . . . . . . . . . . . . . . . . . . . . . . . . . . . . . . . . . . . . . . . . 6-6 Lincoln Creek Flood Control and Storm Water Pollution Project . . . . . . . . . . . . . . . . . . . . . . . 5-20
Macroinvertebrate Populations Analysis . . . . . . . . . . . . . . . . . . . . . . . . . . . . . . . . . . . . . . . . . 7-10
Milwaukee River Mass Balance Study . . . . . . . . . . . . . . . . . . . . . . . . . . . . . . . . . . . . . . . . . . 6-21 Marina Refueling/ Operator Education Program . . . . . . . . . . . . . . . . . . . . . . . . . . . . . . . . . . . . 7-53
Milwaukee River Revitalization Council . . . . . . . . . . . . . . . . . . . . . . . . . . . . . . . . . . . . . . . . . 5-15 MMSD Permit and Pretreatment Program . . . . . . . . . . . . . . . . . . . . . . . . . . . . . . . . . . . . . . . . 5-27 MMSD Water Pollution Abatement Program . . . . . . . . . . . . . . . . . . . . . . . . . . . . . . . . . . . . 3-5, 5-6 MMSD "deep tunnel" storage system . . . . . . . . . . . . . . . . . . . . . . . . . . . . . . . . . . . . . . . . . . . . 3-5 MMSD Surface Water Quality Monitoring Program . . . . . . . . . . . . . . . . . . . . . . . . . . . . . . . . . 5-21 Monitor Bioaccumulative Toxicants . . . . . . . . . . . . . . . . . . . . . . . . . . . . . . . . . . . . . . . . . . . . 7-20 Moss-American Superfund Project . . . . . . . . . . . . . . . . . . . . . . . . . . . . . . . . . . . . . . . . . . 3-14, 6-6
Nationwide Urban Runoff Program (NURP) . . . . . . . . . . . . . . . . . . . . . . . . . . . . . . . . . . . . . . . 3-8 NAWQA study units . . . . . . . . . . . . . . . . . . . . . . . . . . . . . . . . . . . . . . . . . . . . . . . . . . . . . . . 5-23 Noupoint Source Water Pollution Abatement Program . . . . . . . . . . . . . . . . . . . . . . . . . . . . . . . . 5-8 North Avenue Dam Feasibility Study (Milwaukee) . . . . . . . . . . . . . . . . . . . . . . . . . . . . . 2-17, 5-20
Phytoplankton/Zooplankton Degradation Assessment . . . . . . . . . . . . . . . . . . . . . . . . . . . . . . . . . 7-8 Pollution Prevention Technical Assistance . . . . . . . . . . . . . . . . . . . . . . . . . . . . . . . . . . . . . . . . 7-48
RAP Column for Industry Newsletters . . . . . . . . . . . . . . . . . . . . . . . . . . . . . . . . . . . . . . . . . . 7-57 Resource Conservation and Recovery Act (RCRA) . . . . . . . . . . . . . . . . . . . . . . . . . . . . . . . . . 5-28 Riverway Public Access Trail . . . . . . . . . . . . . . . . . . . . . . . . . . . . . . . . . . . . . . . . . . . . . . . . 7-40 Runoff from Bulk Storage Piles . . . . . . . . . . . . . . . . . . . . . . . . . . . . . . . . . . . . . . . . . . . . . . . 7-32
Sediment Deposit Identification . . . . . . . . . . . . . . . . . . . . . . . . . . . . . . . . . . . . . . . . . . . . . . . 7-24 6-11
Sentinel Duck Study . . . . . . . . . . . . . . . . . . . . . . . . . . . . . . . . . . . . . . . . . . . . . . . . . . . 2-16, 3-11 SEWRPC Milwaukee Harbor Estuary Study (1987) . . . . . . . . . . . . . . . . . . . . . . . . . . . . . . 2-17. 3-9 Shorekeepers' Program . . . . . . . . . . . . . . . . . . . . . . . . . . . . . . . . . . . . . . . . . . . . . . . . . . . . . . 7-51 Solid and Hazardous Waste Management Program . . . . . . . . . . . . . . . . . . . . . . . . . . . . . . . . . . 5-28 Streambank Restoration . . . . . . . . . . . . . . . . . . . . . . . . . . . . . . . . . . . . . . . . . . . . . . . . . . . . . 7-36 Superfund Program (EPA) . . . . . . . . . . . . . . . . . . . . . . . . . . . . . . . . . . . . . . . . . . . . . . . . . . . 5-33 Surface Water Monitoring Program . . . . . . . . . . . . . . . . . . . . . . . . . . . . . . . . . . . . . . . . . . . . 5-18
Sediment remediation project in Rotterdam . . . . . . . . . . . . . . . . . . . . . . . . . . . . . . . . . . . . . . . Sediment Management And Remedial Techniques (SMART) Program . . . . . . . . . . . . . . . . . . . 5-19
Testing the Waters (TTW) program . . . . . . . . . . . . . . . . . . . . . . . . . . . . . . . . . . . . . . . . 5-14. 7-63 Toxicity Testing. Sediment . . . . . . . . . . . . . . . . . . . . . . . . . . . . . . . . . . . . . . . . . . . . . . . . . . 7-28
... VI11 Milwaukee Estuary RAP

CONTENTS INDEX OF PROJECTS. PROGRAMS. AND STUDIES
U.S . Fish and Wildlife study (Miller. 1984) . . . . . . . . . . . . . . . . . . . . . . . . . . . . . . . . . . . . . . 2-16 U.S. Pollution Prevention Act . . . . . . . . . . . . . . . . . . . . . . . . . . . . . . . . . . . . . . . . . . . . . . . . . 5-2 USGS NAWQA Program . . . . . . . . . . . . . . . . . . . . . . . . . . . . . . . . . . . . . . . . . . . . . . . . . . . 5-23 UW-Extension Solid and Hazardous Waste Education Center . . . . . . . . . . . . . . . . . . . . . . . . . . . 5-4
Vegetative Buffer Zones . . . . . . . . . . . . . . . . . . . . . . . . . . . . . . . . . . . . . . . . . . . . . . . . . . . . 7-34 Vehicle Waste Oil and Antifreeze Disposal . . . . . . . . . . . . . . . . . . . . . . . . . . . . . . . . . . . . . . . 7-55
Wastewater Management Program (WDNR) . . . . . . . . . . . . . . .
Water Resources Management Programs (WDNR) . . . . . . . . . . . Water Regulation and Zoning Program (WDNR) . . . . . . . . . . . .
WDNR Hazardous Waste Minimization Program . . . . . . . . . . . .
Water Action VoluntEers (WAVE) . . . . . . . . . . . . . . . . . . . . . .
Water Quality Monitoring . . . . . . . . . . . . . . . . . . . . . . . . . . . .
Wildlife Management Program . . . . . . . . . . . . . . . . . . . . . . . . . Wisconsin Pollutant Discharge Elimination System (WPDES) . .
. . . . . . . . . . . . . . . . . . . . . . . 5-25
. . . . . . . . . . . . . . . . . . . . . . . 7-61
. . . . . . . . . . . . . . . . . . . . . . . 5-18
. . . . . . . . . . . . . . . . . . . . . . . 5-32
. . . . . . . . . . . . . . . . . . . . . . . . 7-5
. . . . . . . . . . . . . . . . . . . . . . . . 5-3
. . . . . . . . . . . . . . . . . . . . . . . 5-23
. . . . . . . . . . . . . . . . . . . . . . . 5-27
Milwaukee Estuary RAP ix

CONTENTS LIST OF ACRONYMS AND MEASUREMENT UNITS
List of Acronyms and Measurement Units
This section lists the acronyms that appear in this document and the words for which each stands. To find definitions of terms in this document, please see the Glossary on page GL-1.
Acronyms
208 PLANS
A&M
ACP
ACOE
AOC
ARAR
ASCS
BACT
BAT
BCT
BMP
BOD
BPT
CAC
CDF
CERCLA
COD
cso DHSS
X
Area wide Water Quality Management Plans.
Assessment and Monitoring (RAP recommendation)
Agricultural Conservation Program
United States Army Corps of Engineers
Area of Concern
Applicable and Relevant and Appropriate Requirement
Agricultural Stabilization and Conservation Service of the U.S. Department of Agriculture
Best Available Control Technology
Best Available Technology
Best Conventional Technology
Best Management Practice
Biochemical Oxygen Demand
Best Practicable Technology
Citizen's Advisory Committee
Confined Disposal Facility
Comprehensive Environmental Response, Compensation, and Liability Act (a.k.a. Superfund)
Chemical Oxygen Demand
Combined Sewer Overflow
Department of Health and Social Services
Milwaukee Estuary RAP

CONTENTS LIST OF ACRONYMS AND MEASUREMENT UNITS
Dissolved Oxygcn
Demonstration Project (RAP recommendation)
Enrichment Factors
U.S. Environmental Protection Agency
Federal Drug Administration
Fish Health Assessment
Federation of Environmental Technologists
Geographic Information System, an electronic mapping system
Great Lakes Atmospheric Deposition database
Great Lakes Fishery Commission
Great Lakes National Program Office (EPA)
Greater Milwaukee Toxics Minimization Task Force
Health Education Center of Wisconsin
Intergovernmental Cooperation Council
Information and Education (RAP Recommendation)
International Joint Commission
Keep Greater Milwaukee Beautiful
The dose (amount actually ingested by an organism) of a toxic substance which is lethal to 50% of the test population.
Land Conservation Committee (of the county board)
Concentration of a toxic substance in water which is lethal to 50% of the test population exposed to the toxic substance. See Bioassay.
Lake Michigan Federation
Leaking Underground Storage Tanks
Milwaukee Metropolitan Sewerage District
National Water Quality Assessment Program (U.S. Geological Survey)
DO
DP
EF
EPA
FDA
FHA
FET
GIS
GLAD
GLFC
GLNPO
GMTMTF
HEC
ICC
I&E
IJC
KGMB
LD 50
LCC
LC,,
LMF
LUST
MMSD
NAWQA
Milwaukee Estuary RAP xi

CONTENTS LIST OF ACRONYMS AND MEASUREMENT UNITS
NPS
O&G
O & M
PAHs
PCBs
POTW
PPM
PSA
PRP
QA/QC
RAP
RIC
RI/FS
RPC
RCRA
scs SHWEC
SIC
Unionized ammonia
Ammonia-Nitrogen
Ammonium or ionized ammonia
National Oceanic and Atmospheric Administration
Nitrite
Nitrate
National Pollutant Discharge Elimination System. Requires permits for wastewater discharges.
Nonpoint Source Pollution
Oil and Grease
Operation and Maintenance
Polycyclic Aromatic Hydrocarbons
Polychlorinated Biphenyls
Publicly Owned Treatment Works
Parts Per Million; a unit of measure for concentration.
Public Service Announcement
Potentially Responsible Party
Quality Assurance/Quality Control
Remedial Action Plan
RAP Implementation Committee
Remedial Investigation/Feasibility Study
Regional Planning Commission
Resource Conservation and Recovery Act of 1976
Soil Conservation Service of the United States Department of Agriculture
UWEX Solid and Hazardous Waste Education Center
Standard Industrial Control
xii Milwaukee Estuary RAP

SMART
so* SOD
SPMD
ss
sso
TAC
TBD
TKN
TMDL
TOC
TSCA
TVS
USDA
USFWS
USGS
USLE
UWEX
UWGB
voc WDATCP
WDHSS
WDILHR
WDNR
CONTENTS LIST OF ACRONYMS AND MEASUREMENT UNITS
Sediment Management And Remediation Techniques (a program through the WDNR Bureau of Water Resources Management)
Sulphur Dioxide
Sediment Oxygen Demand
Semi-Permeable Membrane Device
Suspended Solids
Sanitary Sewer Overflow
Technical Advisory Committee
To Be Determined
Total Kjeldahl Nitrogen
Total Maximum Daily Load
Total Organic Carbon
Toxic Substances Control Act, a federal law
Total Volatile Solids
United States Department of Agriculture
United States Fish and Wildlife Service, U.S. Department of Interior.
United States Geological Survey
Universal Soil Loss Equation. Used to determine the amount of sediment carried in runoff.
University of Wisconsin - Extension
University of Wisconsin - Green Bay
Volatile Organic Compound
Wisconsin Department of Agriculture, Trade and Consumer Protection
Wisconsin Department of Health and Social Services
Wisconsin Department of Industry, Labor and Human Relations
Wisconsin Department of Natural Resources
Milwaukee Estuary RAP ... Xlll

WDOA
WDOD
WDOT
WGNHS
WLA
WPAP
WPDES
WSLH
WWTP
CONTENTS LIST OF ACRONYMS AND MEASUREMENT UNITS
Wisconsin Department of Administration
Wisconsin Department of Development
Wisconsin Department of Transportation
Wisconsin Geologic and Natural History Survey
Waste Load Allocation
Water Pollution Abatement Program (MMSD)
Wisconsin Pollutant Discharge Elimination System
Wisconsin State Laboratory of Hygiene
Wastewater Treatment Plant
xiv Milwaukee Estuary RAP

CONTENTS LIST OF ACRONYMS AND MEASUREMENT UNITS
Measurement Units
cfs
mgd
Cubic Feet Per Second, a measure of flow in streams
Million of Gallons Per Day; a measurement of water flow from wastewater treatment plants. 1 MGD = 1.55 cfs.
Milligrams Per Liter; a unit of measure of concentration generally equivalent to parts per million.
Nanograms Per Liter; a unit of measure for concentration generally equivalent to parts per trillion (ppt).
part per billion
part per million
part per trillion
milligram per kilogram (equivalent to ppm)
microgram per kilogram (equivalent to ppb)
nanogram per kilogram (equivalent to ppt)
microgram per litre (equivalent to ppb)
Milwaukee Estuary RAP

CHAPTER 1: WHAT IS THE RAP? MILWAUKEE RIVER BASIN HISTORY
CHAPTER 1: What is the RAP?
This chapter defines the Remedial Action Plan (RAP) for the Milwaukee Estuary Area of Concern (AOC). The Area of Concern, or the Milwaukee Estuary, shown in Figure 1.1, is the part of the Milwaukee River Basin that is most polluted. The Milwaukee River Basin waterways include all waters that eventually flow into the Milwaukee River. For information about the boundaries of the Milwaukee Estuary A OC, see a description of the Surface Waters on page 2-1.
This chapter contains three sections:
Milwaukee River Basin History RAP Purpose RAP Progress
Milwaukee River Basin History
For almost 200 years, four Native American groups, the Fox, Mascouten, Potawatomi, and Menominee called the Milwaukee River Watershed their home. They settled in this region as early as 1665 and remained in the area for a short time after their lands were ceded to the United States around 1833. Area rivers supplied an abundance of fish. The marshy confluence of the Milwaukee, Menomonee, and Kinnickinnic Rivers was ideal for harvesting wildlife. Adjoining uplands and wetlands were well suited for hunting and gathering. The rich wetland and forest communities provided habitat for many mammals whose fur provided the Native Americans with clothing and shelter materials.
In the 1600s, European explorers used the navigable waters of the Milwaukee River Basin. The explorers discovered a land richly forested with maple, beech, and basswood trees. In lowland swamps grew tamarack, cedar, elm and other plants that could tolerate periods of flooding. The forests, rivers, streams and wetlands provided the resources needed for the early settlers to develop their first businesses and industries.
Milwaukee's population grew rapidly in the early 1800s. In 1846, Milwaukee was first recognized as a city. Federal funds became available in the 1840s to develop the Milwaukee harbor and begin dredging operations. During harbor construction, marshes were filled and rivers were channelized and dredged, eliminating their natural buffer against pollution. The new harbor entrance was completed after four years at an unexpectedly high cost of nearly $500,000. The harhor became a centerpiece for an economic boom in Milwaukee. Machine shops, meat packing companies, brick manufacturers, breweries, granaries, sailing mast manufacturers, tanneries, and coal docks were established during the 1800s and early 1900s along both the Milwaukee and Menomonee Rivers. Wisconsin's first paper mill was built in 1848 on the north side of the Menomonee River. By 1912, eight grain storage elevators were located along the Milwaukee and Menomonee Rivers.
The population of Milwaukee grew to more than 200,000 people by 1880. Citizens complained about the stench of the river and the nausea it caused. The Milwaukee and Menomonee Rivers were used as sewers by industries and residents alike. Sewage and storm water runoff were discharged directly into the rivers. At this point, Milwaukee area citizens literally turned their backs on the river.
Milwaukee Estuary RAP 1-1

CHAPTER 1: WHAT IS THE RAP? MILWAUKEE RIVER BASIN HISTORY
A century ago some efforts were made to improve the river water quality. Combined sewers were constructed in the late 1800s to carry storm water runoff and sewage. Two flushing tunnels, one each on the Milwaukee and Kinnickinnic Rivers, were constructed to carry water from Lake Michigan to the rivers to help flush the pollution downstream. In 1909, the city appointed a sewerage commission to address the sewage problems created by growth and expansion. The first sewage treatment plant for Milwaukee was completed on Jones Island in 1925.
Upstream from the heavily polluted harbor area, residents were still able to enjoy the river's recreational uses. Resorts and park areas offered scenic boat rides, and three swimming schools utilized the river in the early 1900s. However, increased agricultural use and residential growth further upstream increased river pollution. Many forested river banks were cut for lumber, or to clear the land for farming. Soil eroded into the river causing heavy sediment accumulation behind dams, smothering fish spawning beds. Throughout the watershed, raw sewage and household waste went directly into the river and its tributaries. Woolen mills, grist mills and other commercial enterprises added to industrial waste, further degrading water quality. The extensive contamination put an end to the swimming clubs and much of the fish and wildlife habitat by the 1940s.
The river continued to be heavily polluted throughout the 1950s and 1960s by both point (direct) and nonpoint (diffused) discharges. It was not until the 1970s, with the adoption of the Federal Clean Water Act, that a new vision for the Milwaukee River Basin was conceived, a vision to achieve "fishable and swimmable waters."
Today, over a million people reside in the Milwaukee River Basin. The population growth and industrialization of the last 150 years has exacted a costly toll on the natural environment of the Milwaukee River Basin. Many efforts have been started in the last two decades to reverse the trend of pollution. The Milwaukee Estuary Remedial Action Plan (RAP) is intended to unify efforts to clean up the pollution generated over the past 150 years and to prevent further pollution.
1-2 Milwaukee Estuary RAP

CHAPTER 1: WHAT IS THE RAP? PURPOSE
RAP Purpose
A RAP (Remedial Action Plan) is being developed for each of the 43 areas of concern in the Great Lakes Basin, shown in Figure 1.1. Each area is degraded to the point that beneficial uses of the local waterways are impaired.
The RAP process begins with identification of environmental problems and impaired uses, and continues until each impaired beneficial use is restored. A list of impaired uses is on page 2-15. In order to be lasting and effective, the RAP must be a program of continuous improvement, re- evaluating its course as new scientific information and technology becomes available. The WDNR has primary responsibility for facilitating development of the Milwaukee Estuary Remedial Action Plan, with active participation by stakeholders.
This subsection describes the following:
Historical Development Requirements List Ecosystem Approach RAP Stages RAP Documentation
Milwaukee Estuary RAP 1-3

CHAPTER 1: WHAT IS THE RAP? PURPOSE
Figure 1.1: The 43 Great Lakes areas of concern; each is degraded to the point that beneficial uses are impaired. Water Environment Technology, June 1993)
Milwaukee Estuary RAP 1-4

CHAPTER 1: WHAT IS THE RAP? PURPOSE
Historical Development
The United States and Canada signed the Great Lakes Water Quality Agreement in 1972. Amended in 1978 and 1987, the Agreement identifies specific goals and remedial objectives for improving water quality. A major focus is the clean-up of toxic “hot spots” or Areas of Concerns (AOCs) in ports, harbors, and river mouths that empty into the Great Lakes. Forty-three AOCs, which are shown on page 1-4, have been identified in the Great Lakes Basin by the International Joint Commission (IJC). The IJC advises Canada and the U.S. in resolving issues of water quality and quantity, pollution problems and border disputes in the Great Lakes. In addition to restoring these AOCs, the states and provinces, local governments and citizens insure that the cumulative effects of their actions will improve water quality throughout the Great Lakes region.
The IJC, United States Environmental Protection Agency (EPA), and the Wisconsin Department of Natural Resources (WDNR) have targeted the Milwaukee Estuary and near shore Lake Michigan as one of the forty-three AOCs requiring remedial action. The IJC augmented the RAP program to address the remedial objectives of the Great Lakes Water Quality Agreement. These remedial objectives are embodied in the IJC RAP requirements, which are listed in Table 1.1.
Milwaukee Estuary RAP

Requirements List
The RAP Process for restorine beneficial
CHAPTER 1: WHAT IS THE RAP? PURPOSE
., Useses of waterways in areas of concern involves meeting the requirements listed in the table below. The table lists the progress to date in the Milwaukee. Estuary on each requirement.
Table 1.1: RAP Requirements from the IJC and Progress Made in the Milwaukee Estuary AOC.
RAP step
1) Quantitatively define the area's environmental problems, including the geographic extent of the area affected.
Identify which beneficial uses are impaired.
Describe the causes of the problems and identifv all known sources of oollution.
2)
3)
~ ~ ~
4) Identify remedial actions to restore imoaired uses.
5 ) Identify a schedule for implementing remedial actions.
6) Identify jurisdictions and agencies responsible for implementing and regulating remedial measures.
7) Describe the process for evaluating remedial program implementation and regulating remedial actions.
8) Describe the surveillance and monitoring activities that will be used to track program effectiveness and eventual confirmation that beneficial waterway uses have been restored.
Progress
See Chapter 2, Pollution in the Milwaukee River Basin. *
See page 2-15
See Chapter 3, Sources of Pollution.*
See Chapter 7, RAP Recommendations
RAP Recommendations listed in Chapter 7 will be implemented in the next 2-3 years. Also see Figure 6.1, a schedule for contaminated sediment management. Also see Chapter 5 , Reaching RAP Goals Through Existing Proerams.
See description of RAP Implementation on page 8-1. Also see "Leaders" listed in each RAP recommendation in Chapter 7.
Described in Chapter 9, Monitoring Strategy.
Described in Chapter 9, Monitoring Strategy.
* Further monitoring, described in Chapter 9, Monitoring Strategy, will help to further quantify these items.
1-6 Milwaukee Estuary RAP

CHAPTER 1: WHAT IS THE RAP? PURPOSE
Ecosystem Appmach
An ecosystem approach is one that recognizes that all elements of the environment, including land, air, water and all living things, must be jointly managed. RAPs use an ecosystem approach that involves the public to remediate AOC waterways. State, provincial, and federal governments provide leadership and resources to facilitate the process. The Milwaukee Estuary RAP is part of Wisconsin's area-wide water quality management plans which the WDNR prepares for the EPA under Section 208 of the Clean Water Act.
Incorporating this ecosystem approach require viewing organizations, government agencies, and stakeholders as equal members in a partnership to identify and solve environmental problems. Milwaukee Estuary RAP solutions will reflect how all citizens, businesses, industries, and governments view the Milwaukee Estuary and its potential to be a centerpiece of an environmentally sustainable community.
Milwaukee Estuary RAP 1-7

CHAPTER 1: WHAT IS THE RAP? PURPOSE
RAP Stages
There are three RAP stages listed below. Once restoration is well underway, plans for long-term maintenance and protection of beneficial waterway uses must be considered. Figure 1.2 below shows a projected timetable for the Milwaukee Estuary RAP stages.
Stage 1 : Identify Impaired Uses and Develop Goals and Objectives. (Initiated in 1988; completed in 1991)
Recommend Remedial Actions. (Initiated in March 1991 and ongoing) Stage 2:
Stage 3: Implement and Evaluate Remedial Actions. (forthcoming)
These RAP stages provide milestones to facilitate the two-track process to implement RAPs. In the RAP Program document (IJC, 1991a), the IJC states
"The Water Quality Board has recognized that implementing RAPs and restoring beneficial uses is a two-track process: 1) existing
programs must be expedited and accelerated; and 2) the schedule of steps must be identified ... to determine actions beyond existing
process, it is essential that a schedule of key action steps or 'milestones' be identified to measure progress in RAPS."
programs that are needed ... Because this is a long term, iterative
RAP Documentation
This document, the 1993 Milwaukee Estuary RAP, documents progress made on RAP work and does not represent complete stages. The RAP will be completely updated every 5 years. Annual progress reports will be published, outlining the status of major projects and initiatives, presenting recent data, updating our understanding of the environment, and discussing new issues.
RAP documents fulfill the reporting requirements of the 1990 Great Lakes Critical Programs Act, which states
"'Remedial Action Plan' means a written document which embodies a systematic and comprehensive ecosystem approach to restoring and
protecting the beneficial uses of areas in concern, in accordance with _.. the Great Lakes Water Quality Agreement."
RAP documents will promote the efficiency, effectiveness, and endurance of RAP work. RAP documents also fulfill the IJC requirement that the WDNR provide a historical record of each step and consult the public throughout the plan.
1-8 Milwaukee Estuary RAP


CHAPTER 1: WHAT IS THE RAP? RAP PROGRESS
RAP Progress
This section describes the development, and accomplishments of each stage of the Milwaukee Estuary RAP. For a list of specific IJC-defined RAP requirements and the progress on each, see the table on page 1-6.
Stage 1: Develop G o a l s and Objectives
The purpose of Stage 1 is to define the problems of the Milwaukee Estuary AOC and the sources of these problems in order to develop goals and objectives for its RAP.
Development Stage 1 of the Milwaukee Estuary RAP was initiated in 1988. The WDNR has primary responsibility for the development of the Milwaukee Estuary RAP. In order to successfully restore and protect our natural resources, participation from individuals with a diversity of interests is essential. Advisory committees serve an instrumental role in preparing the RAP. The Technical Advisory Committee (TAC), the Citizen's Advisory Committee (CAC), and its sub-committee, the Citizen's Education and Participation Sub-committee advised the WDNR during the development of the Stage 1 RAP document.
Leading the citizen effort for the Milwaukee Estuary RAP was the CAC. The CAC is comprised of representatives from local government, the University of Wisconsin-Milwaukee, organized labor, the Southeastern Wisconsin Regional Planning Commission (SEWRPC), business organizations, civic organizations, environmental and citizen groups, and other key constituencies. The CAC built consensus from divergent views, striving for community-wide unity and enthusiasm for the RAP.
The TAC consists of technical experts familiar with the water quality issues in the AOC. The TAC identified problems, analyzed pollution sources, determined human health and environmental concerns, and prepared recommended actions to restore the beneficial uses. The TAC also developed a monitoring strategy for gathering additional information needed to develop RAP recommendations, which are listed in Chapter 7.
In the RAP planning process, public awareness was generated through several activities. Monthly CAC and TAC meetings were open to the public. Additional public meetings were held in February 1989, and June 1990. Media coverage was generated through meetings with editorial boards, press briefings, and other media events. Similarly, briefings were scheduled for local public officials and business leaders.
1-10 Milwaukee Estuary RAP

CHAPTER 1: WHAT IS THE RAP? RAP PROGRESS
Results The Stage 1 document contained these items:
1) A definition and detailed description of the environmental problems of the AOC, including the beneficial uses of the waterways that are impaired, the degree of impairment, and the geographical extent of the impairment.
A definition of the causes of the waterway use impairments, including a description of all known and potential sources of pollution.
Goals and objectives to remediate the Milwaukee Estuary AOC and maintain its water quality. The goals and objectives, derived from the "desired future state", describes the community's vision for the estuary that will result from the successful implementation of the RAP's recommendations.
2)
3)
Desired Future State
Waterways which because of their purity, contribute greatly to the economic vitality and quality of life in Milwaukee
Waters, sediments, and biota free of toxic, persistent, or harmful substances resulting from industrial or other human activities past, present or future
Maximum public access and recreational opportunities along the rivers and near shore areas of Lake Michigan for boating, swimming, fishing, hiking, bicycling, nature study, and other leisure activities
An estuary whose cleanliness and continued multiple uses have broad community and governmental support and are a top priority for the local political agenda
Milwaukee Estuary RAP 1-1 1

CHAPTER 1: WHAT IS THE RAP? RAP PROGRESS
Stage 2: Recommend Remedial Action
The IJC suggests that these components be included in Stage 2.
1)
2)
3)
An evaluation of remedial measures in place
An evaluation of alternative additional measures to restore beneficial uses.
A selection of additional remedial measures to restore beneficial uses and a schedule for their implementation.
An identification of the persons or agencies responsible for implementation of remedial measures.
4)
Dcveloument The development of Stage 2 began in March, 1991. The CAC and TAC, which played key roles in Stage I , are also very involved in Stage 2. Additional work groups were established to develop recommendations to achieve the goals and objectives established in Stage 1. Technical work groups developing recommendations included those addressing water quality, sediment, fish and wildlife. Education-oriented work groups were also formed to develop river appreciation and community partnership recommendations. The work groups had representation from local governmental and community groups. The work groups prepared recommendations by identifying and developing a wide array of remedial and pollution prevention actions. The evaluation and selection of remedial options will be forthcoming.
The work groups had recognized early on in the RAP process that a Basin-wide approach is needed in order to achieve the RAP's "Desired Future State." The CAC, in cooperation with the Milwaukee Metropolitan Sewerage District, University of Wisconsin-Extension, WDNR and the North Shore Rotary sponsored a Milwaukee River Basin Public Information Workshop in March, 1993. The purpose of the public workshop was to allow citizens, community leaders and industry representatives to share their views about how the quality of the water, wildlife, and aquatic organisms in the Milwaukee River and its tributaries should be enhanced.
The 1993 RAP, reviewed, approved and published in April 1994, outlines progress to date.
1-12 Milwaukee Estuary RAP

CHAPTER 1: WHAT IS THE RAP? RAP PROGRESS
Stage 3: Implement and Evaluate Remedial Actions
In Stage 3, a RAP implementation committee will facilitate implementation and evaluation of remedial actions defined in Stage 2. Because implementation of restoration activities has already begun, Stage 3 work is ongoing.
Milwaukee Estuary RAP 1-13

CHAPTER 2: POLLUTION IN THE MILWAUKEE RIVER BASIN ENVl RONMENTAL SETTl NG
CHAPTER 2: Existing Milwaukee River Basin Characteristics and Conditions
The purpose of this chapter is to describe the characteristics of the Milwaukee Estuary Area of Concern (AOC) in relation to its environmental setting, land use and the existing quality of water, sediment, aquatic organisms and wildlife. Emphasis is on problems in and near the AOC, however this chapter also identifies pollution problems in the upstream portions of the Milwaukee River Basin contributing to the existing conditions in the AOC.
Pollution is measured according to the IJC-developed criteria of impaired beneficial uses of waterways, listed on page 2-15. The following topics are covered in this chapter.
Environmental Setting Water Uses Surface Water Quality Standards Ecosystem Quality: Water, Biota, and Sediment Impaired Uses in the Milwaukee Estuary AOC Unimpaired Uses in the Milwaukee Estuary AOC
Environmental Setting
Surface Watea
The Milwaukee River Basin covers approximately 850 square miles and is comprised of six watersheds (Figure 2.1): 1) the East-West branch, 2) North branch, 3) South branch, 4) Cedar Creek, 5) the Menomonee River, and 6) the Kinnickinnic River. Surface waters in the Basin include 430 miles of perennial streams and 87 lakes and ponds that are 5 acres or larger. The AOC is contained in the Milwaukee River South branch, the Menomonee River and Kinnickinnic River watersheds. Portions of 7 counties lie in the Milwaukee River Basin, with more than one million people residing in 14 cities, 23 villages and 31 townships.
Figure 2.2 shows the surface waters of the Milwaukee Estuary AOC, which include these waters: The lower Milwaukee River downstream of North Avenue Dam (3.1 miles/5.0 km) The lower Menomonee River downstream of 35th Street (3.0 miles/4.8 km) The lower Kinnickinnic River downstream of Chase Avenue (2.5 miles/4.0km) The Inner and Outer Harbor The near shore areas of Lake Michigan, outside the Outer Harbor, bounded by a line extending north from Sheridan Park, northwest to the city of Milwaukee’s Linnwood water intake
Besides being a source of Lake Michigan pollution, the AOC acts as a sink for pollutants generated throughout the Basin, hence, the water quality of the AOC is affected by pollution sources associated with land use from the entire Milwaukee River drainage area. The area draining to the AOC encompasses 22.2 square miles, or 2.6 percent of the entire Basin, including lands that drain directly to the AOC via storm and combined sewer systems. This relatively small drainage area contributes disproportionately large amounts of pollutants associated with urban runoff.
Milwaukee Estuary RAP 2-1

i m
CHAPTER 2: POLLUTION IN THE MILWAUKEE RIVER BASIN ENVIRONMENTAL SETTING
Milwaukee River Basin
.WAUKEE
2-2

CHAPTER 2: POLLUTION IN THE MILWAUKEE RIVER BASIN ENVIRONMENTAL SETTING
2
,/’ ,,.,” ’ 235th !
Bridge
/ ”’
0 025 0 5 075 1 Mlln - 0 025 0 5 075 1 125 1 5 Kllornetars
Nominal scale 153625
Figure 2.2 Milwaukee Harbar Estuary Area of Concern
Milwaukee Eshlary RAP 2-3

CHAPTER 2: POLLUTION IN THE MILWAUKEE RIVER BASIN ENVIRONMENTAL SETTING
Land Uses
Approximately 75 percent of the Basin is rural, with agricultural uses making up approximately 48 percent (see table below). The urban land uses in the drainage Basin are represented by residential use (12 percent), transportation and utilities (9 percent), while other urban land uses total less than 5 percent of the Basin.
Land Use
Agricultural and Other Open
Woodland
Table 2.1 (Wisconsin DNR, Water Resources Management Program)
Urban and Rural Land Uses (Percent o f Watershed) for the Milwaukee River Basin.
WATERSHED
Cedar Creek Kinnickinnic Milwaukee River Milwaukee River Milwaukee River Menomonee East-West Branch North Branch South Branch River River
57 67 43 33 64 9
20 9 4 3 5 0
Rulal Subtotal 90 93 55
0 I P I Wetlands and Surface Water
43 87 9
I I I I I I 1 I
Ulban Subtotal 10 7 45 57 13 91
Residential I 4 3 I 22 27 I 7 35
Transportation and 36 Utilities 5
Other (includes commercial and industrial)
1 1
2 4 Milwaukee Estuary RAP

CHAPTER 2: POLLUTION IN THE MILWAUKEE RIVER BASIN ENVIRONMENTAL SETTING
Climate and Topography
The climate of the Milwaukee area is influenced by the storms which move eastward across the upper Ohio River valley and the Great Lakes region. Large high pressure systems moving southeastward out of Canada also have a pronounced effect on the Milwaukee area climate, and it is seldom that a period of more than 2 or 3 days will pass without a distinct change in the weather, particularly during the winter and spring months. Milwaukee's climate is influenced to a considerable extent by Lake Michigan. This is especially true when the temperature of the lake water differs considerably from the air temperature. During the spring and early summer, a shift of wind from a westerly to an easterly direction frequently causes a sudden 10" F to 15' F drop in temperature. In the autumn and winter, the relatively warm Lake Michigan water prevents night time temperatures from falling as low as in areas a few miles inland.
Milwaukee's annual average temperature is 46.4" F. The city has an average of 13 days per year when the temperature is zero degrees (F) or lower, and an average of 132 days when it is 32°F or lower. The average number of days per year with the temperature reaching 90°F or higher is 8. Average annual precipitation is approximately 30 inches. About two-thirds of the annual amount occurs during the growing season. The long-term average annual snowfall is about 46 inches, but varies considerably from season to season.
The topography of the Milwaukee River Basin was formed by glacial deposits superimposed on underlying bedrock, and ranges from a high of 1,360 feet above sea level to 580 feet at the Milwaukee Harbor. The surface slopes downward from the north and west to the south and east (SEWRPC, 1987). Physiography is typical of rolling ground moraine, although surface drainage networks are generally well connected, leaving relatively few areas of the watershed that are internally drained.
Milwaukee Estuary RAP 2-5

CHAPTER 2: POLLUTION IN THE MILWAUKEE RIVER BASIN WATER USES
Water Uses
This section describes Milwaukee Estuary AOC water uses: Navigation, Water Supply, and Recreation.
Navigation
The AOC is connected to the Atlantic Ocean through the Great Lakes and the St. Lawrence Seaway, and to the Gulf of Mexico through the Illinois, Chicago and Mississippi Rivers. Commercial navigation is important to the economy of the region, offering low cost transportation to the region. Among commercial navigation uses are a public port, grain elevators, coal storage, salt storage, barge terminals, restaurant vessels, tour vessels and commercial fishing.
The Army Corp of Engineers (ACOE) maintains federal navigation channels within the AOC and periodically dredges the harbor and river portions to maintain navigability. The Army Corps of Engineers (ACOE) maintains the federal channels to project depths ranging from 21 to 30 feet. In addition, the Port of Milwaukee or private industries occasionally dredge portions of the AOC. Contaminated sediments dredged from these areas are disposed of by the ACOE in the in-water confined disposal facility (CDF), located at the Port of Milwaukee. The Milwaukee River is no longer dredged.
Water Supply
The city of Milwaukee draws its drinking water supply via two submerged intakes located 6,500 and 7,600 feet out into Lake Michigan. The Linnwood plant on the north side has a treatment capacity of 275 million gallons per day (MGD), while the Howard plant on the south side has a treatment capacity of 100 MGD. The plants provide chlorine gas disinfection, coagulation and softening, flocculation and settling, filtration, fluorization and, when necessary, taste and odor control and post chlorination.
Recreation
Physical barriers and poor water quality restrict swimming and wading in the surface waters of the Milwaukee Estuary AOC. The Milwaukee River is navigable up to the North Avenue dam for pleasure craft during the ice-free portion of the year. Smaller pleasure craft also navigate above the North Avenue Dam. Private docking facilities for recreational watercraft are located in some areas of the AOC. In Milwaukee County, public access for fishing and boating is provided to Lake Michigan through some of the county's lakefront parks.
Anglers fish along the Milwaukee River, off the breakwall in the Outer Harbor and the walls of the confined disposal facility (CDF). Many anglers fish the Milwaukee River during the annual spring and fall runs of salmonids which have travelled as far upstream as the Theinsville Impoundment, while private and charter boats troll the mouth of the Milwaukee River and Outer Harbor (Bruzynski, 1994).
The Milwaukee River downstream of the North Avenue Dam has the potential to support partial body- contact recreation (e.g. canoeing, boating, fishing, wading). High levels of bacteria and pollutants in this section keep the river from meeting its full recreational use potential (WDNR, 1992). On the Menomonee River, high bacteria and pollutant levels limit uses such as swimming and wading in and near the AOC. Recreation in the Burnham and South Menomonee Canals is limited to boating. The
2-6 Milwaukee Estuary RAP

CHAPTER 2: POLLUTION IN THE MILWAUKEE RIVER BASIN WATER USES
Kinnickinnic River above the AOC has concrete-lined channels which detract from recreational use. Above the concrete lined channels, flows are low most of the year. The upper end of the river within the AOC is used by anglers during the spring and fall trout and salmon runs. The Kinnickinnic River within the AOC is classified as potentially supporting partial body contact.
Milwaukee Estuary RAP 2-7

CHAPTER 2: POLLUTION IN THE MILWAUKEE RIVER BASIN SURFACE WATER QUALITY STANDARDS
Surface Water Ouality Standards
Water quality standards form the basis for deriving water quality-based effluent limitations. These standards are helpful in making decisions related to discharge permitting, sewage treatment plant construction and funding, and resource management. Water quality standards for recreational use and public health and welfare apply to all the classified waters and designated uses.
The Milwaukee Estuary AOC is classified as a Great Lakes water in NR 102.12, Wisconsin Administrative Code. Various reaches of the streams that feed into the AOC have different fish and aquatic use classifications as listed in NR 102.04. Appendix A, Biological Uses of Streams in the Milwaukee River Basin, shows the current and potential biological uses of all perennial streams in the Basin. It also lists factors that impair any potential biological uses of these streams.
The WDNR developed water quality criteria standards and procedures for calculating point source discharge limits for toxic substances discharged to surface waters. Chapter NR 105, Wisconsin Administrative Code, establishes numerical standards for fish and aquatic life, wildlife and human health for about 100 toxic substances. Chapter NR 106, Wisconsin Administrative Code, establishes the methods to calculate effluent limits for point source dischargers to ensure water quality standards for toxic substances are met in surface waters.
2-8 Milwaukee Estuary RAP

CHAPTER 2: POLLUTION IN THE MILWAUKEE RIVER BASIN ECOSYSTEM QUALITY: STATUS OF WATER, BIOTA, AND SEDIMENT
Ecosystem Quality: Water, Biota, and Sediment
This section describes how pollution in the Milwaukee Estuary AOC has affected the quality of water, biota, and sediment, Appendix B, Pollutants of Concern, lists the pollutants that have had the greatest impact upon the AOC's ecosystem.
Water Quality
Water quality in the Milwaukee Estuary AOC is diminished by both conventional and toxic pollutants. Eutrophic conditions prevail and high levels of chemical contaminants, both organics and metals, are found in the water column.
Eutrophic conditions caused by conventional pollutants in the AOC induce excessive algae blooms which contribute to low dissolved oxygen levels and fish kills. Undesirable algal blooms occur in response to excessive nutrient loading from combined sewer overflows (CSO), sanitary sewer overflows (SSO), agricultural nonpoint pollution and urban nonpoint pollution such as runoff from streets, storm sewers, and construction sites.
Acute toxicity from metals and other chemicals may contribute to intermittent fish kills in the AOC. Average metals concentrations at stations throughout the AOC exceed chronic ambient water quality standards for cadmium and lead (MMSD, 1992, years: 1979-85).
Biota Quality
The biota considered in this RAP include benthos (bottom-dwelling invertebrates), plankton communities, fish, and wildlife. All are adversely affected by poor water quality and poor quality habitat. Dams and impoundments, concrete-lined channels, sheet pilings, concrete walls, eroding streambanks, lack of shoreline vegetation, excessive sedimentation and loss of wetlands negatively affect the biotic community.
Benthos The benthic community lacks diversity with pollutant tolerant species dominating. A number of factors contribute to the relative abundance and diversity of benthic organisms including type of substrate, water column chemistry, sediment chemistry, availability of food resources, and stream currents.
The dominant oligochaetes found in the benthic samples from the Milwaukee Estuary (SEWRPC, 1987) are tolerant of extreme enrichment and organic pollution according to the Howmiller and Scott (1977) pollution classification system. Metals in AOC bottom sediments may become available and are toxic to benthic organisms through sediment and pore water interactions. Tubificids found throughout the AOC are tolerant of anaerobic sediment conditions and thrive in habitats where the water column is polluted with heavy metals (Brooks and Kaster, 1992).
Milwaukee Estuary RAP 2-9

CHAPTER 2: POLLUTION IN THE MILWAUKEE RIVER BASIN ECOSYSTEM QUALITY: STATUS OF WATER, BIOTA, AND SEDIMENT
Plankton Communities The planktonic community lacks diversity and the more pollutant tolerant species prevail. Phytoplankton populations (aquatic plant life contained within the water column) are impaired in the Milwaukee Estuary AOC because of poor water quality. The eutrophic (nutrient rich) conditions in the estuary lead to quantity-rich, diversity-poor biological communities.
Zooplankton (planktonic invertebrate aquatic animal life contained within the water column) populations are also impaired in the AOC. MMSD studies conducted from 1980 through 1988 indicate a decline of species richness and a dominance of pollutant tolerant species in the outer harbor as compared with the community structure of the open lake.
Low dissolved oxygen levels, excessive amounts of nutrients, degraded habitat and high water temperatures limit the abundance and diversity of the resident fish populations in the AOC.
Many resident fish species in the AOC (carp, suckers, bullheads, mudminnows) are pollution tolerant organisms that can survive under conditions indicative of poor water quality. Periodic low dissolved oxygen concentrations and contaminant spills have resulted in periodic fish kills (WDNR Water Resources and Fisheries Management files).
Many pollutants may he affecting the health and ability of fish in the Milwaukee area of concern to survive and reproduce. The primary pollutants of concern based on the analysis presented in Appendix B are cadmium, copper, zinc because the water column concentrations of these pollutants have been found to exceed water quality criteria. However, many other metals, pesticides and other organic chemicals, and polycyclic aromatic hydrocarbons have been documented to be present in the AOC's sediments, effluents, and storm water. Various studies have shown that these chemicals are associated with adverse effects on some fish depending on the concentration or dose of the chemical (Baumann 1990). The presence of all these chemicals likely adversely affects fish populations in the Milwaukee AOC. For example, PAHs in AOC sediments are at levels which have been associated with the presence of cancers in fish (Baumann, 1990). However, identification of the major chemicals and quantifying the extent of their impact on the Milwaukee AOC fish populations would be difficult.
The primary pollutants of concern which are found in fish tissue and are associated with human consumption advisories are: PCBs, dieldrin, chlordane, and dioxins. In addition, pentachloroanisol (a breakdown product of pentachlorophenol), lindane, pentachlorobenzene, and chlorpyrifos have been detected in fish tissue (U.S. EPA, 1990). There are fish consumption advisories because of PCBs for most of the resident fish species throughout the entire Milwaukee Estuary AOC, the Milwaukee River upstream of the AOC and Cedar Creek from its confluence with the Milwaukee River, to Bridge Road in the village of Cedarburg. Two pesticides, chlordane and dieldrin, also exceed consumption advisory tissues standards in lake trout which may be affecting fish from Lake Michigan and near the Milwaukee Harbor.
Fish populations are also affected by poor quality habitat in the estuary and its tributaries. The lack of natural streambanks (resulting from installation of steel sheet pilings and concrete channels), urban and agricultural runoff and excessive sedimentation all interfere with fish foraging, spawning and overwintering. On the Milwaukee River, habitat diversity and quality are limited by combined sewer overflow events, nonpoint and point source pollution, sediment and silt deposition. When closed, the North Avenue Dam inhibits migration of salmonids and
2-10 Milwaukee Estuary RAP

CEAPTER 2: POLLUTION IN THE MILWAUKEE RIVER BASIN ECOSYSTEM QUALITY: STATUS OF WATER, BIOTA, AND SEDIMENT
other species.
On the Menomonee River, streambank erosion, channelization and urban runoff degrade habitat quality. Above the AOC, the Menomonee River passes railroad yards and material storage areas with impervious surfaces that contribute contaminants to the river via storm water runoff.
Portions of the Kinnickinnic River above the AOC are concrete-lined and prone to high velocity flows during storm events. Within the AOC, the bottom sediments of the Kinnickinnic River are dominated by thick deposits of muck over sand and clay. Downstream of Becher Street, the natural banks have been replaced by steel sheet pilings. Concrete channels lack the variety of substrate needed for balanced communities, and exhibit flashy flows. Hence, these channels support populations of very pollution-tolerant macroinvertebrates and an occasional fish.
The outer harbor provides good habitat for perch, walleye and northern pike. Some of the naturally occurring perch spawning beds were lost in 1989 when Lakefront Island was constructed in the outer harbor.
Sport fishing for species resident in the AOC is restricted because of lack of shoreline access to anglers, degraded habitat from channel modifications (e.g. dams, concrete lining, sheet piling), and the extent of fish tissue contamination. On Lake Michigan, large-scale stocking of salmon and trout continue to sustain Wisconsin's Lake Michigan sport fishery, despite recent reductions and possible future reductions. The WDNR stocks about 5 million chinook and coho salmon, lake, brown, rainbow and brook trout in Lake Michigan annually. Alewife are a preferred food source for many of the stocked salmonids (e.g. chinook and coho). Recent declines in alewife populations will affect future stocking programs. Chinook survival in Lake Michigan has been impaired recently, perhaps because of the decline in alewife populations as forage food and/or recent incidences of bacterial kidney disease (Coshun, 1992). Construction of Lakefront Island in 1989 created additional habitat for Yello Perch and Smallmouth Bass.
Wildlife About 26 percent of the land in the Milwaukee River Basin is either environmental corridor or open land (such as parkland), 25 percent is in urban land use, 47 percent is agricultural, and 2 percent represents surface water. About 4.5 square miles of open land lies along the near shore areas of Lake Michigan within the AOC. Available wildlife habitat is limited and often of poor quality. The chronic toxicity caused by low levels of contaminants in wildlife may be having adverse effects on the health of these organisms.
The existing habitat supports animals such as fox, cottontail rabbits, raccoons, Norwegian rats, bats, shrews, woodchucks, uirrels, skunks and mice. Amphibians found in the area include tiger salamanders, Amci-ii in toads, mudpuppies, and chorus frogs. Reptiles include snapping turtles, musk turtles, mi and painted turtles, western painted turtles, the brown snake, the northern red-bellied snake and Butler's garter snake (SEWRPC, 1987). Game birds present include pheasants, coots, several duck species, and geese. Several hawk and owl species serve as predators on the small mammals found in the area. Swallows, whippoorwills, nuthatches and woodpeckers are major insect predators. Other bird species present include robins, orioles, cardinals, blue jays, mourning doves, and several species of sparrows,
Milwaukee Estuary RAP 2-1 1

2-12
CHAPTER 2: POLLUTION IN THE MILWAUKEE RIVER BASIN ECOSYSTEM QUALITY: STATUS OF WATER, BIOTA, AND SEDIMENT
Portions of the Milwaukee and Menomonee Rivers and adjacent land upstream of the AOC provide habitat for fox, bats, herons, deer, coyote, rabbits, squirrels, waterfowl, and song birds Milwaukee County operates an extensive park system in the lower portions of the Milwaukee River Basin which provide some beneficial wildlife and aquatic habitat. Some plants and animals in or adjacent to the AOC, listed in the table below, have been identified as endangered, threatened or of special concern.
Milwaukee Estuary RAP,

Species status American eel (Anguilla rostrata)
Common tern (Sterna hirundo) endangered Cooper's milk vetch (Astragalus neglectus) endangered
Forked aster (A ster furcatus) threatened
Hairy beardtongue (Penstemon hirsutus)
special concern
special concern Hop-like sedge (Carex lupulifomis) endangered
Sediment Quality
Over time, the estuary bottom sediment has become a repository of highly polluted material. The "in-place pollutants" that have accumulated are also a major source of contaminants. The polluted sediment in the Milwaukee Estuary AOC may have serious detrimental effects on these aspects of its ecosystem :
Ambient water quality The health, diversity and abundance of benthic and aquatic organisms Human health, from exposure to toxic organic compounds that bioaccumulate in the food chain Disposal options for dredge spoils from harbor maintenance projects
Some data are available regarding sediment quality in the Milwaukee Estuary AOC (Kizlaukas, 1982; SEWRPC, 1987; MMSD, 1987; ACOE, 1989; Christensen, 1990). Sediment contamination in the. AOC is a serious problem but the location and extent of contamination is not fully defined. Sediments are highly enriched with organic material and nutrients, which upon bacterial decomposition, generate large amounts of methane gas and consume large amounts of oxygen from the water column. Oxygen depletion of the water column adversely effects desirable biota,
The organically enriched sediments contain a variety of toxic metals and chlorinated organic compounds. The pollutants of greatest concern are arsenic, cadmium, chromium, cyanide, lead, mercury, zinc, PAHs, PCBs, chlordane and toxaphene. Sediment serves as a source of toxic substances back to sediment pore water, the water column and biota. If this sediment source of toxi substances is not removed or isolated, the present adverse effects on biota and human health will continue. Therefore, sediments are a primary source of pollutants travel t h E & t h e k d c+: accumulating in fish, wildlife and humans. /'&iGfhe%d'ment issue pervades all aspects of the RAPan entire chapter is devoted to the discussion of AOC sediment: Chapter 6, Contaminated Sediment Management Strategy.
1
Pickerel frog (Rana palustris) I special concern
Milwaukee Estuary RAP 2-13
Queen snake (Regina septemvittata) endangered

CHAPTER 2: POLLUTION IN THE MILWAUKEE RIVER BASIN ECOSYSTEM QUALITY: STATUS OF WATER, BIOTA, AND SEDIMENT
How do toxicants from contaminated sediment enter the food chain? The rate at which contaminants from sediments are introduced into the food chain depends upon their availability to organisms. This is partially a function of the affinity between particular contaminants and the sediments to which they are adsorbed. This affinity differs among various chemicals and sediment types. Many contaminants tend to be sorbed and held tightly to the organic matter and fine sized particles in sediments. The degree to which contaminants are bound to sediments affects their release to the water column or sediment pore water where they are assimilated by organisms. Thus, equal concentrations of contaminants in different sediment types can vary widely in their toxicity to aquatic organisms (Burton 1991).
Many natural mechanisms free toxic substances from sediments for uptake into the food chain. Bioavailability can change over time as it is affected by organic loadings and losses, temperature, pH and other environmental factors. Also, the natural interaction between water and bottom sediment, aquatic organisms moving through the sediments, floods scouring the river bottoms and human activities such as dredging, continually expose and free contaminants from the sediments.
Some contaminated sediments have a harmful effect on the bottom dwelling communities in close contact with them. These communities are an important food source for numerous species of fish and wildlife. Their contamination leads to bioaccumulation of contaminants throughout the food chain.
What are the effects of contaminated sediment toxicants? Consumption of certain resident fish species in and upstream of the AOC, and in Lake Michigan poses a public health risk (WDNR, 1993). Contaminants in sediments are thought to be a significant source of contamination in these fish. Human consumption of Lake Michigan fish contaminated with PCBs, for example, has been linked to neurological and behavioral abnormalities and decreased learning abilities in children (IJC, 1991). Therefore, critical warning is given to pregnant and nursing women and young children to restrict consumption of certain Great Lakes fish. Unexpected harmful effects also occur in wildlife living in the Great Lakes Basin from exposure to toxicants in the food chain from a variety of sources including sediments (National Wildlife Federation, 1991).
Various publications from IJC, Environment Canada, and the EPA present evidence linking many metals, synthetic organics, and petroleum and coal derived hydrocarbons in the Great Lakes ecosystem to lethal and sublethal effects in organisms including humans. Reproductive failure, population declines, developmental abnormalities, neurobehavioral deficiencies in offspring and genetic effects are observed in aquatic organisms and wildlife contaminated with certain toxicants. Adult and embryonic mortality, malignancy or carcinogenic effects, bioaccumulation of contaminants and subsequent biomagnification up through the food chain, and neurobehavioral deficiencies in offspring has been observed in contaminated wildlife. In addition, other more subtle biochemical and physiological changes are associated with contaminated exposure. These changes may reduce the ability of organisms to tolerate environmental changes, stress and disease (IJC, 1991b).
While single compound effects for many substances are known, the effects on organisms of exposure to multiple compounds present in heterogeneous mixtures in the environment are largely unknown. Heterogenous mixtures of contaminants, such as those in the AOC, may be additive, synergistic, or antagonistic in their actions on biota.
2-14 Milwaukee Estuary RAP

CHAPTER 2: POLLUTION IN THE MILWAUKEE RIVER BASIN IMPAIRED USES OF AOC WATERWAYS
Impaired Uses of AOC Waterways
The International Joint Commission (IJC) developed criteria of 14 uses of waterways that enter the Great Lakes (IJC, 1987a). These criteria, known as beneficial waterway uses, are used to identify areas in need of a remedial action plan. By definition in the Great Lakes Water Quality Agreement, "impairment of beneficial use(s)" means a change in the chemical, physical or biological integrity of the Great Lakes system sufficient to impair any of these 14 waterway uses. This section discusses these impaired uses of the Milwaukee Estuary AOC in the order they are listed in the table below.
The RAP must examine and document the extent of use impairments. Recommendations in the RAP must outline implementation strategies to eliminate identified use impairments. In order to remove these beneficial uses from the impaired list they must meet the delisting criteria, which are listed in the table that begins on page 9-10.
Table 2.3: Impaired Beneficial Waterway Uses Identified in the Milwaukee Estuary AOC.
Degraded Aesthetics X Added Costs to Agriculture or Industry X
Degradation of Phytoplankton and Zooplankton Populations Phytoplankton X Zooplankton X
Loss of Fish and Wildlife Habitat Fish Habitat X Wildlife Habitat X
Use Impairment Use is Impaired Use is Unimpaired I Restrictions on Fish and Wildlife Consumption
Fish Wildlife
X X
Tainting of Fish and Wildlife Flavor X"
Degradation of Fish and Wildlife Populations Fish X Wildlife X
Xb X
Fish Tumors or Other Deformities
Bird or Animal Deformities or Reproduction Problems
Degradation of Benthos I X I
Odor Problems I I Beach Closings/RecreationaI Restrictions I X I
Milwaukee Estuary RAP 2-15.

CHAPTER 2: POLLUTION IN THE MILWAUKEE RIVER BASIN IMPAIRED USES OF AOC WATERWAYS
Restrictions on Fish and Wildlife Consumption
The WDNR uses the U.S. Food and Drug Administration (FDA) action levels and the Wisconsin Department of Health and Social Services (DHSS) criteria to determine consumption advisories for fish and waterfowl. The FDA establishes "action levels" and "tolerance levels" to regulate the commercial sale of food containing chemical contaminants. In addition, the DNR and DHSS have developed tissue standards for sport fish from Wisconsin waters. Wisconsin uses these standards as a basis for issuing health advice to the public. WDNR and DHSS publish this information twice each year in the "Health Guide for People Who Eat Sport From Wisconsin Waters. Fish and waterfowl consumption advisories exist for several species found in the Milwaukee Estuary AOC.
Fish consumption advisories for PCBs are in effect for both resident and migratory fish species in the AOC. Strict "Do Not Eat" advice exists for consumption of resident fish such as crappie, northern pike, carp, smallmouth bass, redhorse, and white sucker. In all of the previously listed species (with the exception of carp), 50 percent or more of the fish tested contained contaminant levels higher than one or more health standards. More than 90 percent of the carp tested from the AOC contain contaminant levels higher than one or more health standards. Yellow perch pose the lowest health risk for consumption in the AOC. Although over 90% of the yellow perch tested meet the PCB tissue standard, they are still included in the advisory, which was last published in October, 1993. Depending upon the species, size, and percentage of tested fish that exceed action levels, the advisory suggests that women who are pregnant, or who intend to have children, and children 18 years or younger should take the greatest precaution when consuming fish.
A waterfowl advisory issued for certain species harvested in the Milwaukee Estuary AOC suggests consumption of mallard, black ducks, scaup, and ruddy ducks from the Milwaukee area is unsafe. Because the targeted waterfowl migrate through the Great Lakes region and along flyways from Canada to the Gulf of Mexico and the Atlantic Ocean, more data are needed to identify the role of the AOC in contaminating waterfowl.
The confined disposal facility (CDF) provides sheltered water habitat and is used for loafing and forage by many migratory and resident duck species and geese. The CDF's polluted sediment contains heavy metals, PCBs, oil, grease, PAHs and pesticides. A U.S. Fish and Wildlife study (Miller, 1984) documented that ducks accumulate detectable levels of contaminants in two to three months from the Saginaw Bay CDF. Similarly, a Sentinel Duck Study was conducted in the summer of 1990 to determine if waterfowl were accumulating contaminants from the Milwaukee CDF. Game farm mallards were released on the Milwaukee CDF, collected 70 days later, and were analyzed for total PCBs, metals, pesticides and PAHs. The study concluded that ducks released into the CDF did not accumulate significant concentrations of contaminants as compared to field and background levels. However, preliminary results indicated that the ducks on the Menomonee River sites accumulated PCB concentrations greater than the human consumption standard for poultry. Further study is needed to determine contaminant availability to wildlife living in the CDF. See the recommendation to protect wildlife from CDF contaminants on page 7-20.
2-16 Milwaukee Estuary RAP

CHAPTER 2: POLLUTION IN THE MILWAUKEE RIVER BASIN IMPAIRED USES OF AOC WATERWAYS
Degradation of Fish and Wildlife Populations
Fish community surveys were conducted in the lower reaches of the Milwaukee, Menomonee and Kinnickinnic rivers by the WDNR in 1983 (Holey, 1984) as part of the SEWRPC Milwaukee Estuary Study. Following is a description of each survey and a summary of the findings.
Milwaukee River Thirty-five species were identified in the Milwaukee River, with 23 sport fish species represented. The most abundant species surveyed were carp and white suckers, followed by redhorse, alewife, bluegills, rainbow trout, black crappie, black bullhead, rock bass and goldfish. In 1984, a survey conducted upstream of the North Avenue Dam to Pioneer Road identified 29 species, including 12 sport and 10 pollution intolerant species.
Menomonee River Surveys were conducted in the Menomonee River in 1973 and 1983 (WDNR, 1985). The 1973 survey showed a fishery dominated by the pollution tolerant green sunfish. In 1983, 20 species were collected from the 29th Street bridge to the junction with the Milwaukee River. Carp were the most abundant, followed by migratory salmonids, other sport fish, intolerant and tolerant forage species. In the 1983 survey, 21 species were surveyed, with the central mudminnow (a pollution tolerant species) the most abundant. Of the 7 sport species identified, the pollution tolerant green sunfish and black bullhead dominated. The common shiner was the most abundant forage species collected.
Kinnickinnic River In the Kinnickinnic River, from its confluence with Lake Michigan upstream to the concrete channel at 6th Street, 23 species were identified, with white suckers, black bullheads and carp as the most abundant. Fourteen species are classified as sport fish. No fish were caught or observed above the concrete lined channel.
Survey Summary Overall, fish species diversity in the AOC is low, with many pollution tolerant species resident. Several of the species identified are seasonal migrants to the AOC. The lack of natural features in the AOC in conjunction with installation of steel pilings, channelization and concrete lining, urban and rural runoff, and high sediment input lead to poor quality habitat for fish foraging and spawning. The North Avenue Dam once inhibited trout and salmon migration, but has been open since early 1991 to study the feasibility of dam removal or retention. Since that time, the North Avenue Dam Feasibility Study reported trout and salmon as far upstream as the Theinsville Impoundment, upstream from the North Avenue Dam.
Sufficient evidence is not available to show that chemical contamination or water quality problems have diminished wildlife abundance and diversity in the AOC. Regardless of water quality problems, the declines in wildlife populations and decreases in species diversity can be attributed, in part, to urban development in the Milwaukee Estuary AOC. Nearly all the wetlands which existed were filled as development occurred. The wildlife habitat that remains is concentrated in and around existing parkland and other open areas. Further investigations are needed to determine whether problems related to poor water quality or toxic contamination impair wildlife populations, but these sources are suspected.
Milwaukee Estuary RAP 2-17

CHAPTER 2: POLLUTION IN THE MILWAUKEE RIVER BASIN IMPAIRED USES OF AOC WATERWAYS
The Stage 1 document identified this impairment as unknown for wildlife. Since contaminants present in the AOC (e.g. PAHs, PCBs and metals) are known to affect wildlife reproduction and growth, and/or bioaccumulate through the food chain, this use should be considered impaired. Further data are necessary to determine baseline contaminant values in wildlife, and to determine the extent of this impairment in relation to available habitat.
Fish Tumors or Other Deformities
Detailed studies of possible deformities in Milwaukee AOC fish populations have not been conducted. Concentrations of fluoranthene, pyrene, benzo(a)anthracene and benzo(a)pyrene found in AOC sediments are similar to concentrations found at sites where fish have high cancer rates (Baumann, 1990). Because these concentrations correspond to dose/response tables provided by Baumann, fish tumors are considered an impaired use in the AOC. No studies have been conducted to determine the incidence of liver tumors in AOC fish. An assessment of resident fish in the rivers within and near the AOC should be conducted to document the appearance of tumors and/or other deformities.
Bird or Animal Deformities or Reproductive Problems
Insufficient data are available to show whether contaminants are causing these problems in the AOC. The Stage 1 document considered this use unimpaired because of lack of information. Since organochlorine contaminants (e.g. PCBs, dieldrin, DDT) and metals (e.g. cadmium, mercury and lead) impair reproduction and development in wildlife elsewhere (King and Krynitsky, 1986; Scheuhammer, 1987), this use should be considered impaired. Studies are needed determine the extent of this impairment.
Degradation of Benthos
The results of several Benthic Organism Surveys prior to 1990 reveal that the benthos were lacking in diversity, and were dominated by pollution tolerant species including large populations of oligochaetes (SEWRPC, 1987). Because of this lack of diversity and prevalence of pollution tolerant organisms, this use is considered impaired.
Benthic organisms were collected for qualitative analysis in the fall of 1990 at several locations throughout the AOC (Brooks and Kaster, 1992). The major taxa found were of the families Tubificidae and Chironomidae. Most tubificid species collected were pollution tolerant forms that are common in urban rivers. The chironomid species collected were also considered pollution tolerant.
For long term trend analysis, a quantitative benthic baseline survey and periodic surveys are needed in order to determine the extent of this impairment, and to gauge the effectiveness of any clean-up actions over the long term.
Restrictions on Dredging Activities
The concentrations of toxic contaminants contained in AOC sediments restrict the options for disposal of dredged materials. Dredging is continually required to maintain sufficient water depth to accommodate the 27-foot draft of larger seagoing commercial ships.
2-18 Milwaukee Estuary RAP
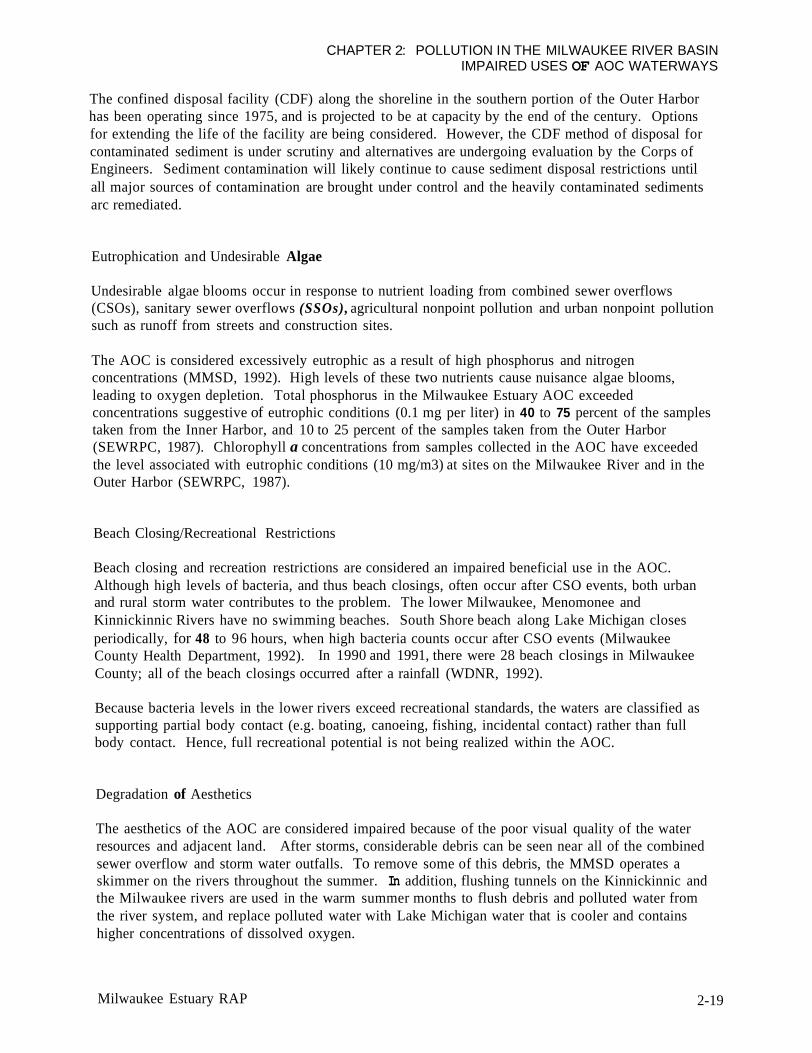
CHAPTER 2: POLLUTION IN THE MILWAUKEE RIVER BASIN IMPAIRED USES OF AOC WATERWAYS
The confined disposal facility (CDF) along the shoreline in the southern portion of the Outer Harbor has been operating since 1975, and is projected to be at capacity by the end of the century. Options for extending the life of the facility are being considered. However, the CDF method of disposal for contaminated sediment is under scrutiny and alternatives are undergoing evaluation by the Corps of Engineers. Sediment contamination will likely continue to cause sediment disposal restrictions until all major sources of contamination are brought under control and the heavily contaminated sediments arc remediated.
Eutrophication and Undesirable Algae
Undesirable algae blooms occur in response to nutrient loading from combined sewer overflows (CSOs), sanitary sewer overflows (SSOs), agricultural nonpoint pollution and urban nonpoint pollution such as runoff from streets and construction sites.
The AOC is considered excessively eutrophic as a result of high phosphorus and nitrogen concentrations (MMSD, 1992). High levels of these two nutrients cause nuisance algae blooms, leading to oxygen depletion. Total phosphorus in the Milwaukee Estuary AOC exceeded concentrations suggestive of eutrophic conditions (0.1 mg per liter) in 40 to 75 percent of the samples taken from the Inner Harbor, and 10 to 25 percent of the samples taken from the Outer Harbor (SEWRPC, 1987). Chlorophyll a concentrations from samples collected in the AOC have exceeded the level associated with eutrophic conditions (10 mg/m3) at sites on the Milwaukee River and in the Outer Harbor (SEWRPC, 1987).
Beach Closing/Recreational Restrictions
Beach closing and recreation restrictions are considered an impaired beneficial use in the AOC. Although high levels of bacteria, and thus beach closings, often occur after CSO events, both urban and rural storm water contributes to the problem. The lower Milwaukee, Menomonee and Kinnickinnic Rivers have no swimming beaches. South Shore beach along Lake Michigan closes periodically, for 48 to 96 hours, when high bacteria counts occur after CSO events (Milwaukee County Health Department, 1992). County; all of the beach closings occurred after a rainfall (WDNR, 1992).
Because bacteria levels in the lower rivers exceed recreational standards, the waters are classified as supporting partial body contact (e.g. boating, canoeing, fishing, incidental contact) rather than full body contact. Hence, full recreational potential is not being realized within the AOC.
In 1990 and 1991, there were 28 beach closings in Milwaukee
Degradation of Aesthetics
The aesthetics of the AOC are considered impaired because of the poor visual quality of the water resources and adjacent land. After storms, considerable debris can be seen near all of the combined sewer overflow and storm water outfalls. To remove some of this debris, the MMSD operates a skimmer on the rivers throughout the summer. In addition, flushing tunnels on the Kinnickinnic and the Milwaukee rivers are used in the warm summer months to flush debris and polluted water from the river system, and replace polluted water with Lake Michigan water that is cooler and contains higher concentrations of dissolved oxygen.
Milwaukee Estuary RAP 2-19

CHAPTER 2: POLLUTION IN THE MILWAUKEE RIVER BASIN IMPAIRED USES OF AOC WATERWAYS
Degradation of Zooplankton and Phytoplankton
Phytoplankton populations are impaired in the Milwaukee Estuary AOC as a result of poor water quality, negatively affecting growth conditions. Additionally, rain events cause scouring of river embankments which displaces a portion of the periphyton (attached) community into the phytoplankton community.
Phytoplankton have been collected by the Milwaukee Metropolitan Sewerage District (MMSD) within the Milwaukee Estuary AOC since 1979. Collections in 1980, '81 and '82 indicate that more pollution tolerant species exist in greater numbers in the outer harbor than in the nearshore waters (1 mile outside the breakwalls). The greater concentrations of nutrients within the harbor not only allow the more pollution tolerant organisms to gain the competitive advantage over other organisms, but also adds to the quantity of organisms found. Eutrophic (nutrient rich) conditions usually lead to a quantity-rich, species-poor community. Conversely, oligotrophic (nutrient poor) conditions usually lead to a quantity-poor, species-rich community. This is not always the case however, since some eutrophic lakes have many species, because of immigration from other sources (Wetzel, 1975).
The incidence of brackish water species indicates that the phytoplanktonic community may be influenced by chlorides (Stoermer, 1980). These organisms were found on 38 occasions over a three- year study in the harbor while only 4 occurrences were noted outside the breakwall (Welling, 1985).
The total number of phytoplankton cells per milliliter of water were higher inside the harbor than one mile outside the breakwall. The concentrations of ammonia, total phosphorus, specific conductance and temperature are higher in the outer harbor than in the open lake, while dissolved oxygen was slightly lower in the outer harbor than in the open water (Welling, 1985).
The dominance of attached diatoms in the outer harbor, various spectral analyses, and water chemistry data indicate that the three rivers draining to the Milwaukee Estuary have a significant influence on the phytoplankton community in the outer harbor. The nearshore waters in the AOC are also affected by the rivers, but to a lesser extent.
Diatoms and other phytoplankton species can be used as indicators of trophic status and long-term trend analysis (Rawson, 1956). The phytoplankton populations in the outer harbor are more representative of river systems than open lake systems. Research in Saginaw Bay has shown that the Saginaw River actually acts as a "seed" mechanism contributing to the phytoplankton community within the bay (Stoermer and Theriot, 1985). High nutrient loading from the three rivers, nonpoint sources, wastewater treatment plant discharges and industrial point sources support the present phytoplankton assemblages. An increase in species tolerant of eutrophic conditions indicate degraded water quality conditions (Rawson, 1956; Welling, 1985).
Zooplankton populations are also impaired in the AOC. In studies conducted from 1980 to 1988, the MMSD identified and quantified zooplankton species in the Outer Harbor and nearshore areas of Lake Michigan. These studies indicate a decline of species richness, and a dominance of pollution tolerant species in the outer harbor as compared with the community structure of the open lake. This trend is most evident from late spring through early fall, when the zooplankters are most active.
The zooplankton community can be divided into three groups: cladocerans, copepods and rotifers. In the outer harbor, the cladoceran population is dominated by Bosmina longirostris which can reach densities of 20,000 to 100,000 per m3 during the summer months. The large Daphnia spp. and large predator species found in the open lake are rare in samples from the outer harbor. The copepod
2-20 Milwaukee Estuary RAP

CHAPTER 2: POLLUTION IN THE MILWAUKEE RIVER BASIN IMPAIRED USES OF AOC WATERWAYS
community follows a similar pattern with Diacyclops thomasi dominating the outer harbor, and the species from the open lake being rare. The rotifer community is dominated by Keratella spp., Brachionus spp., Svnchaeta spp. and Polvarthra spp. The high densities of these species found in the outer harbor throughout the summer in comparison with the open lake are good indications of high nutrient loading (Gannon, 1983). Species from the open waters do appear in the outer harbor, but only for short periods and in low numbers throughout the summer.
While water quality may have a significant effect on the zooplankton community, other factors also play a role. Fish predation on cladocerans and copepods, food availability and physical structures (breakwalls) can help determine population densities and community structure. Nutrient loading from the Jones Island wastewater treatment plant and discharge from the Milwaukee, Menomonee and Kinnickinnic rivers play a large part in the harbor zooplankton community ecology.
Loss of Fish and Wildlife Habitat
Lack of habitat is a major limiting factor for fish and wildlife in the Milwaukee Estuary AOC. The urban development in areas adjacent to the estuary has greatly diminished aquatic and wildlife habitat. Replaced by steel pilings, natural streambanks do not exist below the North Avenue Dam on the Milwaukee River. Almost no natural areas exist on adjacent streambanks in the harbor or along the rivers.
From a water quality perspective, fish and aquatic habitat is impaired by contaminated sediments and poor ambient water quality. Nutrient and sediment loading further degrade habitat available for fish forage and spawning.
Loss of wildlife habitat was not included in Stage 1 as a impaired use for the reason that it is not a result of poor water quality or toxic contamination, but rather caused by the loss of physical habitat. Stage 2, however, includes recommendations that address the lack of physical habitat, so this use is being treated as impaired. This is consistent with the definition of "impaired use" used by the Great Lakes Water Quality Agreement and the ecosystem approach to restoration.
Milwaukee Estuary RAP 2-21

CHAPTER 2: POLLUTION IN THE MILWAUKEE RIVER BASIN UNIMPAIRED USES OF AOC WATERWAYS
Unimpaired Uses of AOC Waterways
This section describes the uses of the Milwaukee Estuary AOC that have not been impaired by degradation of AOC waterways. These uses are from a list of 14, listed in the table on page 2-15.
Tainting of Fish and Wildlife Flavor
In other areas of Wisconsin, fish tainting is associated with paper mill discharges. WDNR fish managers have not received complaints about fish or wildlife flavor tainting in the AOC, and it is not considered an impaired use in the AOC. When water quality improves and the fishery is restored, a study or survey of anglers may be warranted to verify that tainting is not a problem.
Added Costs to Agriculture or Industry
The Milwaukee Estuary AOC does not support any agriculture. Only two industries pretreat intake water from the AOC as standard procedure to guard against the bio-fouling of equipment, or for water softening purposes. The frequency of chlorination/dechlorination might be less if water quality were to improve significantly, but it would not be eliminated.
Restrictions on Drinking Water Consumption or Taste and Odor Problems
Milwaukee's water treatment facilities meet all federal drinking water standards for health, taste and odor. The Milwaukee Estuary AOC is not a water supply source for the city of Milwaukee. Drinking water is drawn from Lake Michigan from either the Linnwood treatment plant or the Howard Avenue treatment plant. Both have intakes which extend 6,500 feet into Lake Michigan. The plants provide coagulation, settling and filtration to remove suspended particles, chlorinated disinfection and fluoridation. Additional water treatment is provided during periods of high algal production to control taste and odor problems with activated carbon.
2-22 Milwaukee Estuary RAP

CHAPTER 3: SOURCES OF POLLUTION SUMMARY OF POLLUTION SOURCES
CHAPTER 3: Sources of Pollution
This chapter describes the sources of pollution in the Milwaukee Estuary AOC. The information is a revision of information collected and presented in the Stage 1 RAP document.
Many pollutants contribute to the poor water quality in the Milwaukee Estuary AOC. Appendix B, Pollutants of Concern, lists the major pollutants of AOC water, biota, and sediment. Chapter 6, Contaminated Sediment Management Strategy, discusses sediment as a source itself.
Chapter 2, Pollution in the Milwaukee River Basin, discusses the impaired beneficial uses of the AOC waterways (page 2-15). The table on page 3-2 correlates these impaired uses with their likely causes and sources.
The pollution sources in this chapter are described in the categories listed below. A brief summary precedes these descriptions.
Summary of Pollution Sources Point Sources Nonpoint Sources Atmospheric Deposition Contaminated Sediments Contaminated Groundwater Upstream Sources
Milwaukee Estuary RAP 3-1

CHAPTER 3: SOURCES OF POLLUTION SUMMARY OF POLLUTION SOURCES
Impaired Use
Testrictions on fish and wildlife consumption
Summarv of Pollution Sources
Likely Cause
- High concentrations of PCBs - High concentrations of chlordane
Table 3.1 summarizes impaired uses in the Milwaukee Basin, the likely cause of the impairment, and the likely sources of the contaminants.
Table 3.1: Causes and Sources of Impaired Uses in the Milwaukee Estuary AOC.
Restrictions on waterfowl - High concentrations of PCBs consumption I
Degradation of fish and wildlife populations (diversity and abundance)
Fish tumors or other deformities
- Poor ambient water quality (low dissolved oxygen)
- Poor quality habitat resulting from excessive sedimentation and urban development along the rivers io the .Basin
reproduction and bioavailability - PAHs (e.g. fluoranthene, pyrene,
- Effects of contaminants on
benzo(a) anthracene, benzo(a)pyrene)
- Heavy metals
Bird or animal deformities Unknown or reproduction problems I Degradation of benthos - Contaminated sediment (see
Appendix B for pollutants of concern) ~ ~~~~
- Poor quality habitat Restrictions on dredging I - Sediments contaminated with a activities variety of pollutants (see Chapter
6 for details)
Eutrophication or undesirable algae
~~
- Excessive inputs of phosphorus and nitrogen
- High water temperatures - Stagnant water
Likely Sources of Pollution or Pmblem
. Upstream sources of PCBs and other toxic substances
. Contaminated sediment
. Urban and rural nonpoint source pollution
. Atmospheric deposition
. Sources such as those listed for fish found throughout the flvwavs
. Rural and urban nonpoint source pollution
- Combined sewer overflows - Physical habitat restraints
- Contaminated sediments - Spills - Urban nonpoint sources - Storm water runoff - Atmospheric deposition unknown
- Nonpoint and point source pollution (including storm water runoff)
- Point source pollution - Urban and rural nonpoint source
pollution - Atmospheric deposition - Spills - Combined sewer overflows - Point source pollution - Urban and rural nonpoint source
pollution - Thermal discharges - Combined sewer overflows - Dams
3-2 Milwaukee Estuary RAP

CHAPTER 3: SOURCES OF POLLUTION SUMMARY OF POLLUTION SOURCES
Impaired Use Likely Cause Likely Sources of Pollution or Problem
Beach closings/ - Elevated bacteria levels - Combined sewer overflows recreational restrictions - Nonpoint source pollution (e.g. runoff
from barnyards, stockyards, streets etc.)
- Contaminated sediment
Degraded aesthetics Surface water debris - Point source pollution - Oil and grease - Nonpoint source pollution ~ Overdevelopment - Litter
A Degraded phytoplankton - Contamination of the water and - Point source pollution sediment
- Concrete channelization above the AOC and other habitat constraints
and zooplankton populations
- Nonpoint source pollution - Habitat loss - Contaminated sediment
Loss of fish and wildlife habitat
- Contamination of the water and - River modifications sediment - Point source pollution
- Habitat destruction - Nonpoint source pollution (channelization and concrete - Migration restrictions (e.g. dams) lining) - In-place pollutants
- Excessive sedimentation
Milwaukee Estuary RAP 3 -3

CHAPTER 3: SOURCES OF POLLUTION SUMMARY OF POLLUTION SOURCES
Point Sources
Point sources of pollution have discrete discharges, usually from a pipe or outfall. Historically, these "end of the Pipe" pollution sources have been targeted and successfully controlled by state an fedral regulations. Described below are the following primary point sources for pollution in the Milwaukee Estuary AOC. Total annual loading of toxic compounds from major and minor industrial and municipal point sources in the Milwaukee River Basin is estimated at 248,630 lbs/year (WDNR, 1992 b).
MMSD's Jones Island Wastewater Treatment Facility
A major point source discharge within the AOC is the Milwaukee Metropolitan Sewerage District's (MMSD) Jones Island wastewater treatment facility. The plant discharges effluent directly to Milwaukee's Outer Harbor. MMSD conducts priority pollutant scans on influent, effluent and sludge on an annual basis at both the Jones Island and South Shore treatment plants. MMSD is required to operate a pretreatment program to control pollution from the industrial wastewater entering the Jones Island and South Shore plants. Through its sewer use ordinance and local discharge control permits, MMSD regulates over 500 industries, of which 150 must meet pretreatment requirements.
AOC Industries
In the AOC, 15 industries discharge directly into the Milwaukee River. Nine of these discharges contain noncontact cooling water. Twenty-one industries discharge directly to the Menomonee River, while 4 discharge to the Kinnickinnic River. Along the near shore areas of the AOC, five industries discharge directly to the surface water. Some of these industrial discharges may require specific Wisconsin Pollution Discharge Elimination System (WPDES) permits with effluent limits.
Combined Sewer Overflows
The sewers servicing the urban areas around the AOC are classified as combined sewers, sanitary sewers or storm water. Combined sewers combine both storm water runoff and sewage flows, while sanitary sewers carry only sewage. These sewers were originally built with pressure relief devices designed to overflow when the sewer system was unable to handle high volumes.
Combined sewer overflows (CSOs) to the AOC contribute greatly to pollution in the Milwaukee Estuary. CSO discharges contain both conventional and toxic pollutants from storm water runoff, residential, commercial and industrial users of the system. The combined sewer service area totals approximately 27 square miles, with 11 1 combined sewer outfalls discharging to the surface waters of this area. About 33 percent of the total pollutant load from CSOs is discharged to the rivers upstream of the estuary. Sixty-one percent is discharged directly to the Inner Harbor. The remaining 6 percent is discharged to the Outer Harbor. Combined sewer overflows account for approximately 20 to 40 percent of the total pollutant load to the Inner Harbor.
Once MMSDs comprehensive water pollution abatement program (WPAP), which includes the MMSD "deep tunnel" storage system, is completed, CSOs will be reduced from approximately
3 -4 Milwaukee Estuary RAP

CHAPTER 3: SOURCES OF POLLUTION SUMMARY OF POLLUTION SOURCES
50 events to 1-2 overflow events per year. Overflows, held temporarily in the deep tunnel, will be treated at the Jones Island and South Shore plants, and discharged to Lake Michigan. For details about the "deep tunnel" storage system and other elements of the program, see page 5-5 .
Spills, Illegal Dumping, and the Improper Disposal of Household Hazardous Waste
Industrial spills, illegal dumping, and the improper disposal of household hazardous waste collectively contribute a significant amount of oil, gasoline and other pollutants to the AOC.
For years there has been substantial spilling of oil into many of the streams in the Milwaukee River Basin. Creek because of chronic pollution resulting from illegal storm sewer hook-ups. Similarly, from March 1990 until February 1991, more than $33,000 was spent in the recovery or containment of spills on Lincoln Creek and the Kinnickinnic and Milwaukee Rivers.
ImDroDer Disposal of Household Hazardous Waste The improper disposal of household hazardous waste may also be an additional source of pollutants to the AOC. Each year used motor oil, paints, and other household hazardous wastes are dumped on the ground or down storm sewers.
In Wisconsin each year, "do-it-yourself' mechanics dump approximately 90,000 gallons of used oil down storm sewers and another 2.6 million gallons on the ground. In an effort to address this problem, the city of Milwaukee has sponsored the one-day Clean Sweep program from 1989-1993. For more information about the Clem Sweep program, see page 5-12.
In 1988, the WDNR spent over $25,000 for repeated clean-ups of Lincoln
Milwaukee Estuary RAP 3 -5

CHAPTER 3: SOURCES OF POLLUTION NONPOINT SOURCES
Watershed
Cedar Creek
North Branch
East and West Branches
Milwaukee River South
Menomonee River
Nonpoint Sources
# of Barnyards Lbs. Phosphorus
136 934
156 2020
90 1516
43 769
50 338
Pollutants from nonpoint sources enter surface waters as particulates, some of which settle to the bottom of the waterways, and dissolved pollutants. This section describes rural and urban nonpoint scources of pollution in the Milwaukee River Basin.
Nonpoint pollutants contribute to the degraded water quality, sediment volume and contaminated sediments found in the Milwaukee River Basin. Nonpoint sources of pollution account for approximately 90 percent of the total Inner Harbor load of total solids, nitrate nitrogen, and copper; and for more than 50 percent of the loadings of total suspended solids, chemical oxygen demand, phosphorus, ammonia nitrogen, total Kjeldahl nitrogen, chloride, cadmium, chromium, and other metals.
WDNR has completed four nonpoint source control watershed plans in the Milwaukee River Basin and has two, the Cedar Creek and Kinnickinnic River Watersheds, in progress (WDNR, 1989; 1991a; 1991b; 1992~). These plans assess nonpoint and other sources of pollution and identifies best management practices to meet specific water resource objectives. For information about WDNR ‘s Nonpoint Source Water Pollution Abatement Program, see page 5-7.
Rural
Rural sources of nonpoint pollution include barnyard and livestock area runoff; eroding croplands; eroding, slumping or trampled stream banks; and areas contributing runoff from winter spread
The table below lists each watershed in the Milwaukee River Basin, the number of barnyards in each, and the pounds of phosphorus deposited into that watershed during a 10 - 24 year rain event. Rural phosphorus loading is one of the primary causes of excessive nutrients in the Milwaukee Estuary AOC.
3-6 Milwaukee Estuary RAP

CHAPTER 3: SOURCES OF POLLUTION NONPOINT SOURCES
Urban
Urban nonpoint pollution comes from the sources listed below. Although these sources are concentrated in urban areas, some are also pollution sources for rural areas. About 75 mi' of urban area in the Milwaukee River Basin have "critical land uses." This means they contribute the largest amount of pollutants originating in the urban part of the Basin.r- of criticaI land.use areas- are high density residential development, commercial areas, industrial sites, and streets and highwa s
Runoff from construction sites Automobile emissions and leaks Runoff from paved or other impermeable surfaces Discarding chemicals down storm sewers ( e g antifreeze and motor oil) Leaking underground storage tanks Runoff from bulk storage piles Eroding streambanks Use of various chemicals around households (e.g. fertilizers and pesticides, paint, cleani products, etc).
In 1993, almost $675,000 went toward urban nonpoint source pollution control. Requests for 1994 total about $10 million.
analysis of runoff from ten storm events showed that concentrations of lead, zinc and copper exceed
insecticides such as dicamba and 2,4-D; nine PAHs including benzo(a) pyrene and anthracene; PCBs;
In a 1989-1990 urban storm water study on the Menomonee River upstream of the AOC, chemical
acute and/or chronic standards, The analysis also showed detectable levels of: pesticides and
phosphorus; bacteria and sediment (Bannerman, 1990).
Urban runoff samples from commercial, high density residential, medium density residential and parking lot areas were collected and analyzed under the Nationwide Urban Runoff Program (NURP) in Milwaukee County (Bannerman et. al, 1983). The lead, copper and zinc acute toxicity standard for warm water fish communities was frequently exceeded in the storm sewers monitored during the NURP study (see table on page 3-8). The standard was compared to probability plots of the event mean concentrations for each metal. The event mean concentration is a flow weighted measure used by the EPA to determine whether a water quality standard has been exceeded.
The NURP studies also found that, in general, toxic organic pollutants were present in runoff at problem levels much less frequently than metals. The most commonly detected organic substances include the plasticizer bis(2 ethyl hexy1)phthalate and the pesticide alpha-hexachlorocyclohexane (alpha BHC), which were detected in 22 and 20 percent of the urban runoff samples, respectively.
Milwaukee Estuary RAP 3-7
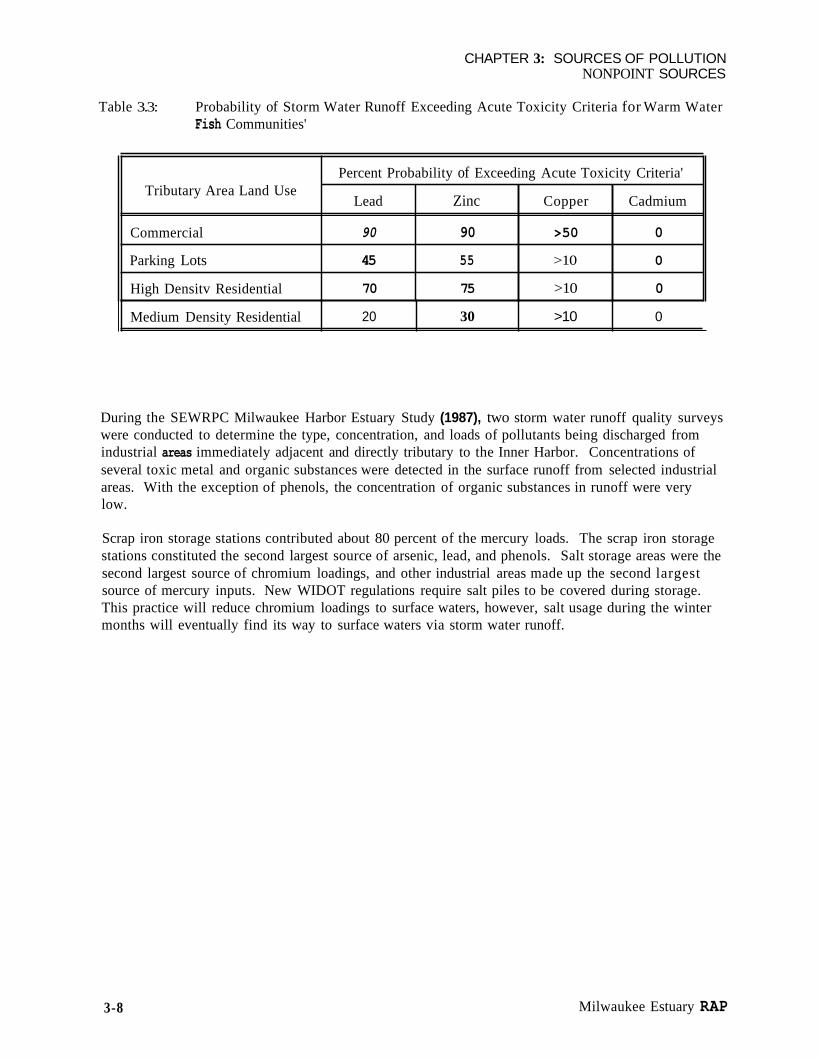
CHAPTER 3: SOURCES OF POLLUTION NONPOINT SOURCES
Probability of Storm Water Runoff Exceeding Acute Toxicity Criteria for Warm Water Fish Communities'
Table 3.3:
Tributary Area Land Use
Commercial
Parking Lots
High Densitv Residential
Percent Probability of Exceeding Acute Toxicity Criteria'
Lead Zinc Copper Cadmium
90 90 >50 0
45 55 >10 0
70 75 >10 0
Medium Density Residential
During the SEWRPC Milwaukee Harbor Estuary Study (1987), two storm water runoff quality surveys were conducted to determine the type, concentration, and loads of pollutants being discharged from industrial areas immediately adjacent and directly tributary to the Inner Harbor. Concentrations of several toxic metal and organic substances were detected in the surface runoff from selected industrial areas. With the exception of phenols, the concentration of organic substances in runoff were very low.
stations constituted the second largest source of arsenic, lead, and phenols. Salt storage areas were the Scrap iron storage stations contributed about 80 percent of the mercury loads. The scrap iron storage
second largest source of chromium loadings, and other industrial areas made up the second largest source of mercury inputs. New WIDOT regulations require salt piles to be covered during storage. This practice will reduce chromium loadings to surface waters, however, salt usage during the winter months will eventually find its way to surface waters via storm water runoff.
20 30 >10 0
3-8 Milwaukee Estuary RAP

CHAPTER 3: SOURCES OF POLLUTION ATMOSPHERIC DEPOSITION
Atmospheric Deposition
Long-range atmospheric transport and deposition of heavy metals and organic compounds are of great concern to the Great Lakes. The airborne contribution of pollutants to the surface waters in the AOC has not been quantified. Wet/dry techniques for monitoring air deposition are in the developmental stage and are not consistently reliable (Julian Chazin, 1992). Some specific data, detailed below, are available about ozone, the main component of smog.
Atmospheric deposition may have been underestimated in the Stage 1 document by considering only the wetted surface area of the AOC as the receiving area for air deposited pollutants. The entire watershed is more correctly the receiving area which delivers air deposited pollutants to the AOC surface waters via storm water runoff. This may significantly increase the relative importance of atmospheric deposition to the AOC.
Wisconsin's Air program regularly monitors 15 sites throughout the Southeast District for 6 criteria pollutants: particulates, sulfur dioxide, nitrogen dioxide, ozone, carbon monoxide and lead. The only exceedances found in Southeastern Wisconsin are for the ozone standard (WDNR, 1990). A six county area in southeastern Wisconsin exceeds the acceptable level for ozone. This region is included in a larger severe nonattainment area that covers metropolitan Chicago, northern Indiana and the entire southern Lake Michigan shoreline.
Ozone, the main component of smog, is formed from volatile organic compounds (VOCs) and nitrogen oxides (NO,). VOCs come from paint thinners, vehicle exhaust, solvents and other petroleum based products. NO, comes from emissions from vehicles, factories and utilities. Ground level ozone is formed when VOCs and NO, combine and are chemically-activated by hot sunlight, posing a significant health risk for the elderly, young children and persons suffering from respiratory ailments.
Heavy industrial sources contribute only 16 percent of ozone forming pollutants. The larger sources of air pollutants are contributed by all individuals who drive motorized vehicles (e.g. trucks, automobiles, boats), paint outdoors, and operate machinery with small engines (e.g. lawn mowers). On hot days, cars contribute nearly 60 percent of the pollutants that form ozone in southeastern Wisconsin.
In order to keep track of industries emitting air pollutants, the WDNR's Air Management Program conducts an annual emission inventory of the more than 500 facilities in southeastern Wisconsin. The inventory includes information about the sources of pollution such as processes, boilers, or incinerators and any fuels associated with these sources. From the inventories, the WDNR is able to determine how much of the air resource is being consumed and to determine if the facility is in compliance with air regulations.
Milwaukee Estuary RAP 3 -9

CHAPTER 3: SOURCES OF POLLUTION CONTAMINATED SEDIMENTS
Contaminated Sediments
The contaminated sediments in the Milwaukee Estuary AOC serve as a source as well as a sink for a variety of pollutants listed in Appendix B, Pollutants of Concern. Decomposing organic matter is the primary cause of dissolved oxygen depletion in the slow-moving AOC surface waters. The degree to which sediments are enriched with organic carbon (primarily from CSO discharges) directly affects the amount of organic chemicals and metals held by thcse sediments. Also see Chq ter 6, Confaminded Sediment Management Strdegy.
In addition to upstream sources of contamination, a suspected source of contamination to the Outer Harbor is the confined disposal facility (CDF), the disposal site containing the contaminated sediments dredged from the harbor. These polluted sediments contain heavy metals, PCBs, oil and grease, PAHs and pesticides which may leak into the Outer Harbor waters and become redeposited in the surrounding sediments. All sediments removed from the Milwaukee navigational channel since 1975 have been disposed of in the CDF. Additional testing needs to be conducted to determine the impact, if any, the CDF has on the outer harbor's water quality.
The Army Corp of Engineers (ACOE) analyzes sediment in Milwaukee's navigational channels at approximate five year intervals to determine the extent of contamination in order to provide proper disposal of dredged materials. Samples collected by the ACOE in 1989 indicated sediment PCB concentrations ranging from 1 to 6 parts per million. Each sample was classified as moderately or heavily polluted for cadmium, arsenic, copper, iron, lead, zinc, merculy, chromium, PAHs, conventional pollutants (such as BOD and phosphorus), oil and grease.
I.
3-10 Milwaukee Estuary RAP

CHAPTER 3: SOURCES OF POLLUTION CONTAMINATED GROUNDWATER
Contaminated Groundwater
Many types of pollutants may be transported to surface waters via the groundwater system. Toxic organic substances and metals are the major contaminants of concern in groundwater. The groundwater throughout the Basin has not been sufficiently monitored to determine the overall contribution of contaminated groundwater to the Milwaukee Estuary. Groundwater accounts for approximately 35 percent of the total annual discharge at the Menomones River gauging station in Wauwatosa (Cherkhauer, 1992). A similar percentage probably occurs throughout the watershed, although groundwater recharge is limited in extensively paved urban areas. The upstream contribution from groundwater to annual stream flow is apparently significant. Little information exists on the quality of this groundwater inflow. Two major sources of groundwater contamination, described below, are leaking underground storage tanks and landfills.
Leaking Underground Storage Tanks
Leaking underground storage tanks are a serious potential source of pollution to groundwater. In Milwaukee County more than 500 cases of leaking underground tanks are under investigation by the WDNR for corrective action.
Landfills
Landfills pose potential water quality problems since leachate may contaminate surface water or
groundwater. Milwaukee County has ten active landfills. Ninety abandoned or inactive waste disposal sites are located within one mile of streams in the Milwaukee County portion of the Milwaukee River Basin.
In Wisconsin, no active landfills are licensed to accept commercial or industrial hazardous waste. They may, however, accept household hazardous waste. Some abandoned or closed landfills in the AOC accepted hazardous waste prior to the development of regulations restricting its disposal.
Milwaukee Estuary RAP 3-11

CHAPTER 3: SOURCES OF POLLUTION UPSTREAM SITES/SOURCES
Upstream Sites/Sources
The Milwaukee Estuary is the recipient of pollution from many sources upstream of the AOC. Agricultural pollutants from the rural areas, contaminated sediments being washed downstream, point and nonpoint pollution from upstream urban areas all contribute significantly to the pollution found in the AOC. Described below arc three major sources of upstream contamination.
Cedar Creek
The 126 square mile Cedar Creek watershed, which lies north of the AOC, is the smallest of the six watersheds comprising the Milwaukee River basin. A 5.7 mile section of Cedar Creek flows through Cedarburg and joins the Milwaukee River approximately 24 miles upstream from the AOC. This stream section includes five dams and impoundments. Four of the impoundments, Columbia Pond, Ruck Pond, Wire and Nail Pond and Hamilton Pond contain sediments heavily contaminated with PCBs. In 1986, a study conducted by the DNR (Wawrzyn and Wakeman, 1986) concluded that PCB- contaminated fish populations exist in the lower portion of Cedar Creek due to large volumes of PCB Contaminated sediments. These contaminated sediments were thought to be a potentially significant source of PCB contamination to the Milwaukee River. The results of the 1986 study prompted a transport study of sediment movement downstream from Cedarburg to determine the extent to which these contaminated sediments contribute to downstream sediment PCB concentrations.
A PCB mass balance to determine the transport of PCB-contaminated sediments to downstream reaches was completed in 1993. The results of this effort are as follows (Westenbroek, 1993):
1) Between 4 and 38 kilograms of PCBs entered the Milwaukee via Cedar Creek. This mass of PCB has a high potential to contaminate large volumes of sediment.
Average PCB concentrations in the water column increase as one moves downstream.
Collected water column samples exceed state water quality criteria established in NR 105 for the warm water fishery stream classification.
Ruck Pond and Columbia Pond contain the highest masses of PCB, respectively.
During a documented storm event Ruck Pond delivered an extremely high dose of PCBs to the Cedar Creek system.
2)
3)
4)
5 )
Timely remediation of Ruck Pond is a high priority because it would allow the capture of highest mass of PCB distributed over the smallest volume of sediment.
During the fall of 1993 the DNR collected several sediment cores from the Thiensville impoundment, which is the next impoundment downstream from the confluence of Cedar Creek and the Milwaukee River. Results of this effort will be forthcoming.
3-12 Milwaukee Estuary RAP

CHAPTER 3: SOURCES OF POLLUTION UPSTREAM SlTES/SOURCES
Lincoln Creek
toxic pollutants to the AOC. The creek is a tributary to the Milwaukee River draining approximately
watershed (WDNR, 1991). In addition, Lincoln Creek contributes 56 percent (6,500 tons) of sediment
Lincoln Creek is a significant source of sediment, heavy metals, nutrients, oil and grease, and other
19 square miles of the communities of Milwaukee, Glendale and Brown Deer. Lincoln Creek joins the Milwaukee River approximately four miles upstream of the AOC.
The Lincoln Creek subwatershed contributes approximately 40 percent of the urban pollutants (lead, phosphorus and suspended solids) entering surface waters in the entire Milwaukee River South
to the Milwaukee River South watershed. The major sources of sediment are construction site erosion (65 percent), urban runoff (29 percent) and streambank erosion (7 percent). Sediments in Lincoln Creek indicate moderate to heavy pollution by zinc, oil, grease, chromium and copper (MMSD, 1987).
Prior to 1983, one or more known sources of iron sulfate and other heavy metals were randomly discharged to Lincoln Creek via a major storm sewer outfall. Similarly, industrial spills containing solvents, paint, cutting and lubricating oils, fuel oils and "pickling" liquor (Fe,SO,) are a chronic problem in Lincoln Creek. In addition, leachate seepage from an abandoned municipal and U.S. Army Reserve landfill was identified as a source of ammonia-nitrogen and iron to Lincoln Creek. The Army is planning remediation of two landfills on its properly.
The MMSD is leading a restoration project for Lincoln Creek. The project will address flood control and channelization issues, water quality problems, and fish and wildlife habitat. A description of this project is on page 5-19.
Moss-American Superfund Site
The Moss-American Superfund Project encompasses a five mile reach of the Little Menomonee River extending from the northernmost edge of the site to the river's confluence with the Menomonee River. The site is located at a former wood preserving facility that used a creosote and fuel oil mixture. The plant was in full operation from 1921 until 1976, when the facility was closed by the Kerr-McGee Chemical Corporation. Environmental problems observed at the site are related to the use and disposal of the creosote mixture.
The EPA initiated Superfund activities in 1983. The Superfund Remedial Investigation was completed in January 1990 and the Feasibility Study of remediation alternatives was finished in May 1990. The Remedial Investigation (RI) detected numerous organic contaminants in the onsite soil. The most prevalent contaminants are PAHs, common constituents of creosote. The highest total PAH concentration detected was 32,000 ppm.
Sediment contamination was found throughout the reach of the Little Menomonee River between the site and its confluence with the Menornonee River. Contaminants detected were similar to those in the onsite soil, with PAHs the primary contaminants of concern.
The selected remedial option for the site includes rerouting the Little Menomonee River, removing and treating highly contaminated soil and sediment using an on-site slurry bioreactor, collecting and treating contaminated groundwater, and covering the remaining untreated soil and sediments. Costs for implementing this proposal are projected at $26 million. Once the design phase is completed, the project will enter the clean up, or remedial action, phase. During this period, scheduled for 1997 or
i J --
Milwaukee Estuary RAP 3-13

CHAPTER 3: SOURCES OF POLLUTION UPSTREAM SITES/SOURCES
1998, the park adjacent to the river between Brown Deer Road and including hiking and bicycle paths, could be temporarily closed.
3-14 Milwaukee Estuary RAP

CHAPTER 4: RAP GOALS AND OBJECTIVES LIST OF GOALS
CHAPTER 4: RAP Goals and Objectives
This chapter describes specific goals and objectives for resolving the water quality problems in the Milwaukee Estuary AOC (discussed in Chapters 2 and 3) so that beneficial uses can be restored.
List of Goals
Goal 1: Restore the estuary through a community partnership, including business and industry that achieves a clean estuary and sustained economic growth.
Achieve and maintain water quality that protects the ecosystem, including human health.
Eliminate the contribution of contaminants from sediments to the ecosystem
Establish high quality fisheries and urban wildlife populations free from toxic contamination and other human-made hazards.
Develop high quality aquatic and wildlife habitats
Provide an aesthetically pleasing and accessible estuary.
Generate community-wide appreciation for the characteristics, ecological health and importance of the estuary.
Generate community-wide participation in restoration and responsibility for the vitality of the estuary.
Goal 2:
Goal 3:
Goal 4:
Goal 5:
Goal 6:
Goal 7:
God 8:
Milwaukee Estuary RAP 4-1

CHAPTER 4: RAP GOALS AND OBJECTIVES PURPOSE
Purpose
The goals and objectives provide the criteria for evaluating the short- and long-term pollution abatement and resource management decisions needed to clean up the estuary. These goals and objectives identify a high quality estuary and river system with all resources free of toxic contamination as the desired endpoint. As goals are achieved and the ecosystem is systematically restored, impaired uses in the Milwaukee Estuary AOC will be delisted according to the IJC's delisting guidelines (see page 9-10).
The objectives provide specific guidance on the conditions that should be met if the goals are to be achieved. Objectives are listed under the applicable goal, however, in many cases objectives will apply to more than one goal.
Development
The goals and objectives have been derived from the CAC's "Desired Future State," which the CAC adopted on February 19, 1990 (see page 1-11). The CAC also developed goals with input from the Technical Advisory Committee (TAC). Goals express the ecosystem ideals and aspirations applied to the Milwaukee Estuary RAP.
Objectives were developed through the input of WDNR resource managers from different programs, the TAC and the CAC. The TAC worked carefully on the objectives, which were then reviewed by the CAC.
The goals and objectives draw upon the legal mandates of the Clean Water Act, the Great Lakes Water Quality Agreement and the environmental protection and resource management authority established by state statutes. In the interest of coordinating a unified pollution abatement effort, they take into consideration ongoing activities such as the nonpoint source pollution abatement and integrated resource management plans for the Milwaukee River South and Menomonee River watersheds. The RAP is not limited to only working with established programs; new and innovative initiatives will also be considered.
4-2 Milwaukee Estuary RAP

CHAPTER 4: RAP GOALS AND OBJECTIVES OBJECTIVES AND RATIONALE
Obiectives and Rationale
Goal 1: Restore the estuary through a community partnership, including business and industry that achieves a clean estuary and sustained economic growth.
Objectives
Maintain an economically healthy and environmentally responsible commercial port.
Encourage waste generators to implement waste minimization and source reduction technologies that help restore water quality.
Support growth in Milwaukee by promoting improved water quality and reduced water treatment costs.
Promote improved water quality - and an improved quality of life - that encourages business relocation to Milwaukee and ensures that new or expanding businesses and associated development do not degrade water quality.
Weigh both environmental and economic efficiencies and impacts of all alternatives prior to recommendation and implementation.
Where waterfront development is to occur, encourage development that is compatible with improving and protecting water quality.
Achieve a community stewardship ethic for a clean estuary by attaining the goals of the RAP.
Rationale
The first goal and the corresponding objectives emphasize the need for a community partnership and community-wide stewardship ethic to achieve RAP implementation. This partnership recognizes our future local economic vitality goes hand-in-hand with restoring the estuary. Businesses must implement waste minimization and source reduction strategies. Waterfront development must be compatible with improving and protecting water quality. A restored estuary, in turn, will facilitate business development and sustained economic growth.
Milwaukee Estuary RAP 4 -3

CHAPTER 4: RAP GOALS AND OBJECTIVES OBJECTIVES AND RATIONALE
Goal 2: Achieve and maintain water quality that protects the ecosystem, including human health.
Objectives
A) Achieve adequate dissolved oxygen concentrations, pH levels, and temperature to support warm water and migratory cold water fish and aquatic life.
Reduce excessive nutrient loadings and manage other factors contributing to excessive algae growth.
Protect recreational uses from possible impacts of toxic substances and objectionable micro-organisms; eliminate beach closings resulting from high fecal coliform levels.
B)
C)
D)
E)
Eliminate acute and chronic toxicity to biota.
Eliminate or significantly reduce the discharge of toxic substances to the AOC via direct and indirect discharges, including runoff, and air emissions.
Once desired levels of water quality are achieved, maintain these through effective implementation and enforcement of a strong antipollution policy.
F)
Rationale
Goals 2, 3, and 4 and the related objectives focus on protecting aquatic life, wildlife, and human health from the adverse effects of toxic substances. They call for reduced exposure to toxic substances so no consumption advisories are needed. These goals and objectives are consistent with the Great Lakes Water Quality Agreement's objective, "The discharge of toxic substances in toxic amounts be prohibited and the discharge of any or all persistent toxic substances be virtually eliminated. Objectives 2D and 2E, in particular, support a policy of "virtual elimination" of toxic substances.
4-4 Milwaukee Estuary RAP

CHAPTER 4: RAP GOALS AND OBJECTIVES OBJECTIVES AND RATIONALE
Goal 3: Eliminate the contribution of contaminants from sediments to the ecosystem
Objectives
A) Implement an effective, environmentally sound method for abating contaminated sediments.
Target significant sediment deposits of toxic pollutants for priority remedial efforts.
Improve sediment quality such that its disposal is not restricted because of contaminants.
B)
C)
Rationale
See rationale for Goal 2.
Milwaukee Estuary RAP 4-5

Goal 4:
CHAPTER 4: RAP GOALS AND OBJECTIVES OBJECTIVES AND RATIONALE
Establish high quality fisheries and urban wildlife populations free from toxic contamination and other human-made hazards.
Objectives
A) Eliminate the need for fish and wildlife consumption advisories and reduce toxic contamination to levels that do not adversely affect other biota.
Establish high quality fisheries by restoring both cold water and warm water species such as yellow perch, northern pike, smallmouth bass, walleye, trout and salmon, etc.
Protect against significant infestations of the sea lamprey, zebra mussel and other undesirable exotic species.
Establish a balanced predator/prey ratio in the resident fish community.
Restore and protect the quantity and quality of the benthic macroinvertebrate, aquatic macrophyte, phytoplankton, and zooplankton communities.
F) Establish high quality, desirable, native wildlife populations. Such wildlife populations would include song birds, peregrine falcons, perching birds (sparrows, cardinals, etc.), migratory birds of prey (short-eared owls, marsh hawks, etc.), native shore birds (hemng gulls, ring-billed gulls, etc), waterfowl (Canada geese, ducks, etc.), wading birds (herons, bitterns, etc.), water birds (belted king fishers, purple martins, etc.), turtles, mink, muskrat, and resident and migratory butterflies.
B)
C)
D)
E)
Rationale
Goal 4 and the corresponding objectives list some of the desired species of fish and urban wildlife populations for the AOC. Also see rationale for Goal 2.
4-6 Milwaukee Estuary RAP

CHAPTER 4: RAP GOALS AND OBJECTIVES OBJECTIVES AND RATIONALE
Goal 5 : Develop high quality aquatic and wildlife habitats.
Obiectives
Upgrade aquatic conditions and provide and protect streambank vegetation and in-stream habitat in the Menomonee, Kinnickinnic, and Milwaukee Rivers and their tributaries to restore, to the fullest extent possible, species historically present but currently lost or present only in small numbers.
Evaluate and implement recommendations regarding removal or modification of human-made obstructions along the rivers which restrict navigation and natural fish movement, spawning, feeding, protection, development or winter habitat.
Restore and/or enhance upstream fish and wildlife habitat.
Establish protective cover and food sources for native wildlife species.
Prevent contamination of local and migratory wildlife from confined disposal facilities.
Protect upstream wetlands from any further loss or degradation and increase wetlands by restoration wherever feasible.
No filling of near shore areas of Lake Michigan unless it also improves aquatic and wildlife habitat.
Where filling is to occur, assure that any filling does not negatively impact water quality and is designed to optimize fish and wildlife habitat.
Rationale
Goal 5 describes aquatic and wildlife habitat restoration and protection necessary to achieve healthy aquatic and terrestrial wildlife populations. This goal and its objectives reflect an awareness of the human impacts on habitat.
Milwaukee Estuary RAP 4-7

Goal 6:
CHAPTER 4: RAP GOALS AND OBJECTIVES OBJECTIVES AND RATIONALE
Provide an aesthetically pleasing and accessible estuary.
Objectives
A) Eliminate or significantly reduce grease, oil, scum, excessive algae, litter and debris from the estuary and minimize objectionable odors.
Provide optimal public access in all waterfront development.
Develop environmental and recreational comdors in the estuary.
Preserve and protect the existence of sheltered water.
B)
C)
D)
Rationale
Goal 6 and the related objectives outline a vision of an aesthetically pleasing estuary that provides optimal opportunities for public enjoyment and use.
4-8 Milwaukee Estuary RAP

CHAPTER 4: RAP GOALS AND OBJECTIVES OBJECTIVES AND RATIONALE
Goal 7: Generate community-wide appreciation for the characteristics, ecological health and importance of the estuary.
- and - Goal 8: Generate community-wide participation in restoration and responsibility for the vitality
of the estuary.
Objectives
A) Increase understanding of the sources of pollution and support for the implementation of pollution abatement and management efforts among the general public and the private sector.
Encourage understanding and active support of pollution abatement and management effort, as a high priority among public officials.
Coordinate with existing programs and promote new efforts to involve volunteers in the physical clean-up of the estuary and other aspects of water quality improvement projects.
Develop and implement teacher training and a kindergarten through 12th grade curriculum for our school systems highlighting the Milwaukee estuary, upstream tributaries, and Lake Michigan.
Include public participation as an integral ingredient in the development and implementation of management programs that affect the Milwaukee estuary.
Develop a sense of public stewardship for water quality, naturally sustainable fisheries and urban wildlife populations.
B)
C)
D)
E)
F)
Rationale
Goals 7 and 8 and the corresponding objectives further address the need to develop a sense of public stewardship throughout the community. Goal 7 stresses the importance of citizen education, while Goal 8 focuses on citizen participation. The importance of both of these activities warrants separate goals. Implementing these goals includes achieving an understanding of the sources of pollution among the general public, emphasizing water quality education and ecosystem health in school curricula, encouraging citizen participation in RAP implementation activities, and convincing public officials that pollution prevention and abatement is a high priority.
Milwaukee Estuary RAP 4-9

CHAPTER 5: REACHING RAP GOALS THROUGH EXISTING PROGRAMS RECOGNIZING PROGRESS
CHAPTER 5: Reaching RAP Goals Through Existing Programs
While the RAP serves to initiate remedial actions, it also works to unify area remediation by combining efforts with existing programs. This chapter describes these on-going programs that are working to restore the waterway quality of the Milwaukee Estuary AOC. Although these programs go a long way toward impovement of the basin's water quality, additional effort will be needed.
According to the International Joint Commission (1991), several billion dollars have been spent since 1988 on remedial actions by local, state and federal programs that are already in place in the Great Lakes Basin. Continuing and improving such programs in the Milwaukee River Basin will prove essential in helping RAPs achieve their goals.
A description of each program and how it works toward RAP goals is provided in these sections:
- Recognizing Progress - Pollution Abatement and Prevention - Resource Management
Regulatory Initiatives
Recognizing Progress
The Milwaukee Estuary RAP would like to recognize the following programs for having made considerable progress toward the goals of the RAP. The page number where each program is described is in parentheses. MMSD Water Pollution Abatement Program (5-5) Nonpoint Source Water Pollution Abatement Program (5-7)
The Greater Milwaukee Toxics Minimization Task Force ( 5 - 8 ) Lake Michigan Federation/MMSD Household Hazardous Waste Education Project (5-10) Clean Sweep Programs (5-12)
Testing the Waters (5-12) Milwaukee River Revitalization Council (5-14)
Milwaukee Estuary RAP 5-1

CHAPTER 5: REACHING RAP GOALS THROUGH EXISTING PROGRAMS POLLUTION ABATEMENT AND PREVENTION
Pollution Abatement and Prevention
Pollution abatement and prevention is a high priority for all 43 RAPs in both the United States and Canada. There are many programs at the federal, state and local levels that encourage pollution abatement and prevention activities in all aspects of our society.
Federal and State Involvement
This section describes the federal and state involvement in pollution abatement and prevention. More specifically, it describes the U.S. Pollution Prevention Act and Wisconsin's Pollution Prevention Management Groups.
U.S. Pollution Prevention Act
The 1990 Pollution Prevention Act set forth a national policy aimed at controlling pollution by means of reducing pollutants at the source or prior to generation. Section 6602(b) of the act outlines the "pollution prevention hierarchy", or preferred methods of controlling pollution:
"...pollution should be prevented or reduced at the source whenever feasible; in an environmentally safe manner, whenever feasible; pollution that cannot be prevented or recycled should be treated in an environmentally safe manner whenever feasible; and disposal or other release into the environment should be employed only as a last resort and should be conducted in an environmentally safe manner."
Pollution prevention programs seek to prevent contamination through source reduction. Section 6603(5) of the Pollution Prevention Act provides a definition of source reduction as any practice that:
1) Reduces thc amount of any hazardous substance, pollutant, or contaminant entering any waste stream or otherwise released into the environment (including fugitive emissions) prior to recycling, treatment, or disposal; and
Reduces the hazards to public health and the environment associated with the release of such substances, pollutants, or contaminants.
2)
Wisconsin's Pollution Prevention Management Groups
Pollution Prevention in Wisconsin is managed by the Hazardous Pollution Prevention Board, WDNRs Hazardous Waste Minimization Program and Office of Pollution Prevention, and the UW-Extension Solid and Hazardous Waste Education Center.
c Hazardous Pollution Prevention Board Established by the Wisconsin Legislature, the Hazardous Pollution Prevention Board advises various state departments and agencies, recommends educational priorities, and reports pollution prevention efforts to interested branches of state government.
The Board works with the University of Wisconsin Extension (UWEX) to identify the educational components needed by a non-regulatory pollution prevention technical
5-2 Milwaukee Estuary RAP

CHAPTER 5: REACHING RAP GOALS THROUGH EXISTING PROGRAMS POLLUTION ABATEMENT AND PREVENTION
assistance program. These components relate to volume and toxicity of hazardous substances, classes of toxic pollutants and hazardous materials produced, questions of compliance, the potential for hazardous pollution prevention, and anticipated shortfalls in hazardous waste treatment.
c WDNR Hazardous Waste Minimization Program and Office of Pollution Prevention WDNR contributes to the state's pollution prevention effort through the Office of Pollution Prevention and the Hazardous Waste Minimization Program. As part of the state's regulatory structure, the Office of Pollution Prevention is responsible for training state regulatory personnel regarding pollution prevention issues. The Office is also responsible for creating a focus for multimedia policy development, recognizing businesses for pollution prevention successes and identifying pollution prevention reporting and environmental needs. The Hazardous Waste Minimization Program operates an information clearing house including over 150 pollution prevention publications and a limited technical assistance program, sponsors outreach workshops for industry and publishes a newsletter concerning pollution prevention issues.
Supplemental to the above educational efforts, the Office has set up an information depository and technical assistance program in cooperation with the University of Wisconsin-Extension (UWEX) Solid and Hazardous Waste Education Center (described below). This Pollution Prevention Information Clearinghouse is designed to educate pollution generators and regulators about solutions to general and technical problems that impede effective pollution prevention.
+ UW-Extension Solid and Hazardous Waste Education Center The Solid and Hazardous Waste Education Center (SHWEC) is a free, non-regulatory educational program established under the authority of Wisconsin Act 335 by the state legislature and administered by UWEX. SHWEC provides information and assistance to help industry, business, local government, and citizens meet regulatory mandates, reduce waste volumes and protect the environment. The Center's programs, described below, are funded by the Wisconsin legislature and available grant funding. Through these programs, SHWEC reaches large and diverse audiences. The Pollution Prevention and Integrated Waste Management Programs, for example, have reached several thousands of people state wide.
Educational Outreach Programs provide a forum for SHWEC pollution prevention specialists to assist industry, business, municipalities, and government agencies in finding ways to achieve source elimination, substitution or reduction of toxic releases and hazardous wastes. Assistance comes in the form of seminars, presentations, and technical assistance.
Pollution Prevention Programs inform interested individuals such as residents, manufacturers, regulators, waste water treatment practitioners and local governments about pollution prevention methods. Topics include pollution prevention measures for processes such as metal finishing, paints and coatings, machine and fabrication, cleaning and degreasing operations and service industries such as dry cleaning and vehicle maintenance and repair.
SHWEC specialists provide technical assistance through non-regulatory on-site pollution prevention assessments and through detailed literature searches to address
Milwaukee Estuary RAP 5 -3

CHAPTER 5 : REACHING RAP GOALS THROUGH EXISTING PROGRAMS POLLUTION ABATEMENT AND PREVENTION
specific process or problematic requests. In the last half of 1992, the first year a SHWEC specialist was available in Milwaukee, over 25 entities in southeast Wisconsin requested specific technical assistance through on-site assessments or by telephone consultation. Requests for detailed assistance are expected to increase as more small businesses become aware of this free non-regulatory program.
The SHWEC is also assisting the Greater Milwaukee Toxics Minimization Task Force, Incorporated with developing a "Business to Business. Pollution Prevention Information Exchange." The objective of this project is to provide Milwaukee and southeast Wisconsin with a comprehensive single source of pollution prevention and source reduction information. The information will be provided by, and shared with, business, industry, organizations, local government and firms who are interested in pollution prevention in southeast Wisconsin.
The Integrated Waste Management Program provides educational programming for municipalities, businesses and consumers on recycling topics including legal and technical issues. businesses on waste processing technologies such as yard waste composting, solid waste composting, waste-to-energy and material recovery facilities and the legal and technical aspects of landfill siting and operation.
b DOD Hazardous Pollution Prevention Audit Grant Program The Department of Development's (DOD's) Hazardous Pollution Prevention Audit Grant Program encourages business and industry to evaluate their hazardous waste generating processes in order to target pollution prevention opportunities.
Grant applicants must pay at least 25 percent of the cost of the waste audit, identify the auditor and report to the state a summary of the audit findings within 60 days after completion of the audit. Grants are limited to $7,500 or 75% of the cost of the audit, whichever is less. Grant recipients must also develop and implement a plan that uses the information from the audit to revise waste management practices.
DOD staff members are responsible for providing a copy of each application to the Hazardous Pollution Prevention Board, which awards the grants. The DOD is also responsible for evaluating applications, making the actual grant application and reviewing the audit and implementation summaries submitted by the recipients. When evaluating grant applications, DOD staff consider the following criteria:
lnformation is provided for individuals, municipalities and
- The applicant's ability and willingness, both technically and financially, to implement hazardous pollution prevention methods.
The volume and toxicity of hazardous substances, toxic pollutants and hazardous waste used or produced by the applicant.
The secondary uses of the information gained from specific applicants hazardous pollution prevention audit.
The legislature's directive to provide grants to a variety of industries
5 -4 Milwaukee Estuary RAP

CHAPTER 5 : REACHING RAP GOALS THROUGH EXISTING PROGRAMS POLLUTION ABATEMENT AND PREVENTION
MMSD Water Pollution Abatement Program
In 1977, the WDNR and MMSD entered into a stipulation in the Dane County Circuit Court, which determined the actions and time schedule for MMSD to follow to meet secondary sewage treatment and control of separate and combined sewer overflows. The MMSD Water Pollution Abatement Program (WPAP) is designed to meet the requirements of this agreement. The project will cost about $2.2 billion and is scheduled for completion by 1996. Below is a description of project improvements and a discussion of combined sewer overflows, which are the primary target for abatement.
Project Improvements The completion of the WPAP will result in the actions and improvements listed in the table below. The cumulative results of these actions will help advance the RAP by raising dissolved oxygen levels, while lowering concentrations of ammonia, fecal coliform, and other contaminants in the AOC waterways.
Table 5.1: MMSD Water Pollution and Abatement Program Actions and Improvements
Action
Rehabilitate sanitary sewer lines
Construct relief sewers and the Deep Tunnel.
Construct an intercepting sewer system for near surface collectors
Rehabilitate and expand the Jones Island and South Shore Wastewater Treatment Plants.
Improve methods to process and utilize waste solids.
Improvement
Reduction of storm water entry to sewers.
Abatement of most combined sewer overflows (CSOs) to rivers and Lake Michigan and complete elimination of separate storm sewer overflows.
Creation of a means to carry overflows from a local municipal combined sanitary and storm sewer system to the inline storage system.
Enable secondary treatment of all wastewater flowing to AOC wastewater treatment plants.
Allows sludge to be recycled rather than disposed in landfills or incinerated.
Increase treatment capacity of the Jones Island plant from 200 million gallons per day (mgd) to 300 mgd by 1994. Increased treatment capacity of the South Shore plant from 120 mgd to 250 mgd in 1992.
Combined Sewer Overflows The improvements to the system will alleviate practically all dry weather and most wet weather bypasses of untreated wastewater into Milwaukee's rivers and Lake Michigan. Such bypasses are known as combined sewer overflows (CSOs). Dry weather bypasses occur when sanitary sewage simply exceeds collection and treatment capacity. Wet weather bypasses occur in combined sewer systems, as well as in sanitary (separated) sewers when excess clear water infiltrates.
During wet weather periods, the sewage collection systems become overloaded with storm
Milwaukee Estuary RAP 5-5

CHAPTER 5: REACHING RAP GOALS THROUGH EXISTING PROGRAMS POLLUTION ABATEMENT AND PREVENTION
water runoff. Approximately 50 days per year, storm water overloads the system to the extent that untreated sewage is bypassed into these locations in Milwaukee River Basin waterways:
Nearly 500 locations in the local collection system Fifty-two locations in the District's sewerage system Additional locations at the two treatment plants
Bypassing of untreated wastewater to Milwaukee's rivers contributes to the violation of water quality standards, especially in terms of dissolved oxygen concentration and bacteria levels.
5-6 Milwaukee Estuary RAP

CHAPTER 5: REACHING RAP GOALS THROUGH EXISTING PROGRAMS POLLUTION ABATEMENT AND PREVENTION
Nonpoint Source Water Pollution Abatement Program
Wisconsin's nationally renowned Nonpoint Source (NPS) Pollution Abatement Program continues to be an integral part of water quality restoration in the Milwaukee Estuary AOC. The NPS Program was established in 1978 by the state legislature. Its purpose is to improve and protect the quality of streams, lakes, wetlands and groundwater by reducing pollutants from urban and rural nonpoint sources. WDNR Southeast District's average annual expenditures to support local staff and provide cost share dollars to implement urban nonpoint projects and rural best management practices exceeds $2.5 million.
WHAT? Nonpoint sources include eroding agricultural lands, eroding streambanks and roadsides, runoff from livestock wastes, erosion from developing urban areas and runoff from established urban areas. Pollutants from nonpoint sources are carried to the surface water or groundwater via rainfall runoff, snow melt, and seepage.
The Program is administered by the WDNR and the Department of Agriculture, Trade, and Consumer Protection (DATCP). It focuses on critical hydrologic units called priority watersheds. The program is implemented through priority watershed projects for which a plan has been prepared.
WHO?
n o w ?
WHERE? The six watersheds, Milwaukee River East-West Branch; Milwaukee River North Branch, Milwaukee River South Branch; Cedar Creek; Menomonee River; Kinnickinnic River, of the Milwaukee River Basin, were designated as Priority Watersheds under this program in 1984. Priority Watershed Plans for four of the six drainage areas have been completed and approved. The Kinnickinnic River Watershed Plan will be completed in 1994.
Implementation is by local units of government. Water quality improvement is achieved through voluntary implementation of nonpoint source controls (best management practices) and adoption of ordinances. Landowners, land renters, counties, cities, villages, towns, sanitary districts, lake districts, and regional planning commissions are eligible to participate. The program is divided into two parts: rural and urban. '
Rural Nearly three-quarters of the Milwaukee River Basin is rural. Agricultural nonpoint source pollution control is critical in reducing the excessive amounts of nutrients, sediment and pesticides entering the streams in the basin. Wisconsin's Land Conservation Department's technical staff in Fond du Lac, Milwaukee, Ozaukee, Sbeboygan, Washington, Waukesha counties have worked with over 300 rural landowners to encourage land management practices which improve both water quality and farm profitability. To date, nearly 150 rural landowners have signed cost-share agreements to implement rural best management practices to reduce nonpoint source pollution on their property. The WDNR provided more than $1 million, or about 70 percent of total costs, to install these practices.
Milwaukee Estuary RAP 5-7

CHAPTER 5: REACHING RAP GOALS THROUGH EXISTING PROGRAMS POLLUTION ABATEMENT AND PREVENTION
Urban Urban nonpoint source pollution control efforts began in 1990. Programs focus on construction site erosion control, urban housekeeping, water quality information and education programs, and storm water management engineering studies and implementation. WDNR staff have worked closely with representatives of 21 communities to begin implementing comprehensive urban nonpoint source control programs. These encompass more than 90% of the critical urban land uses in the Milwaukee River Basin. So far, WDNR and these communities have spent $2 million on the effort. Costs for 1994 total about $5 million.
The Greater Milwaukee Toxics Minimization Task Force
Initially sponsored by MMSD, the Greater Milwaukee Toxics Minimization Task Force is a non-profit pollution prevention workgroup made up of local representatives from industry, business, labor unions, state and local agencies, environmental groups, law and engineering firms. In 1992 the Task Force incorporated as a not for profit organization and is now independent from MMSD.
Task Force Description The Task Force formed and operates on the premise that despite current regulations, toxics continue to enter the Great Lakes region through a variety of sources. Pollutants discharged from a variety of industrial, institutional, commercial and residential sources pass through the sewage treatment facility into surface waters and directly into surface waters via urban and rural runoff.
The Task Force strives to minimize toxic pollutants entering the system
The Task Force will focus on implementation of the following tasks:
Improve the local toxic substances data base
Create a community wide support for a hazardous waste education program and a permanent residential collection facility.
Reduce the use of hazardous household products and ensure their proper disposal
Improve the delivery of waste minimization information to small businesses
Create and promote a business-to-business pollution prevention information exchange.
Toxicants Reduction Strategy The Task Force has produced a Toxicants Reduction Strategy which identifies Toxic Pollutants of Concern (TPOC) and recommends activities and programs to minimize the discharge of toxic substances into the sewerage system and surrounding environment. These recommendations are based on three goals:
Improving the toxicant database. Reducing toxicants from non-regulated sources. Further reducing toxicants from regulated sources.
5-8 Milwaukee Estuary RAP

CHAPTER 5 : REACHING RAP GOALS THROUGH EXISTING PROGRAMS POLLUTION ABATEMENT AND PREVENTION
The toxics reduction strategy recommendations include both regulatory and non-regulatory methods to promote toxicant reduction. For example, provisions for waste minimization education and technical assistance are included along with regulatory requirements for waste minimization planning.
Committees Several committees, described below, develop programs based on recommendations, and implement certain strategy recommendations.
Education and Impacts Co mmittee Develops technical assistance and educational opportunities to aid the community in the prevention of toxic waste discharges. Assesses economic, environmental and social impacts of toxicant reduction programs.
Database and Technoloev Co mmittee Identifies toxic pollutants of concern, relevant databases and data needs in order to support toxic reduction programs. Assesses new technologies, approaches and programs for reducing or eliminating the discharge of toxic substances.
Legal and Regulatory C ommit t e e Monitors and evaluates current and upcoming legislative activity and regulatory developments relating to toxic substances. Assesses the legal and regulatory impacts of implementing toxicant reduction programs.
Milwaukee Estuary RAP 5 -9

CHAPTER 5: REACHING RAP GOALS THROUGH EXISTING PROGRAMS POLLUTION ABATEMENT AND PREVENTION
Lake Michigan Federation/MMSD Household Hazardous Waste Education Project
The Lake Michigan Federation and MMSD have embarked on a two-year joint pollution prevention education campaign targeting household hazardous waste. Many types of pollutants come into the sewer system and enter the ecosystem from sources including industries, commercial properties and households. Through their pretreatment program, the MMSD is reducing the amount of toxicants coming into the system from industry. However, household and commercial sources are harder to identify and reduce because they are widely dispersed and not easily monitored. The recommendation to continue this campaign is on page 7-46.
It is essential to educate those members in the community who contribute to pollution but are unaware of their effects on the environment through the products they purchase. This education program reaches out to the public in many ways:
Nan-toxic cleaners recipe book
Household audits
Improving educational material
scoot group involvement
Storm sewer stenciling
Neighborhood hands-on workshops
Public service announcements
A recipe book is available, which describes alternative, non-toxic cleaners The book is designed to be a "ready reference" for individuals wanting to make a difference at home. To date, over 40,000 booklets have been translated into Spanish and distributed.
To raise awareness, household audit offers have been distributed through area neighborhoods, offering a look into thousands of Milwaukee homes and the types of products they use.
Gaps in educational materials are being filled and translated into Spanish. Where necessary, new activities and exercises are being developed to provide schools with projects and community involvement opportunities.
A relationship with area scout groups has been established. They are assisting in the dissemination of new materials and will participate in a storm sewer stenciling project. LMF is working with the scouts to adopt pollution prevention activities into their badge program.
LMF and UW-Extension (UWEX) are working cooperatively to involve a large network of volunteers in becoming involved in storm sewer stenciling projects. This project educates residents about the relationship between storm sewer discharge and surface water quality. The LMF office acts as the downtown materials distribution site in addition to the Milwaukee area coordinating site.
Workshops have been given to various groups, primarily teachers, labor, and community associations. These "hands on" workshops will be continued in the community, giving individuals the information needed to make informed purchasing decisions. Participants also receive information on how to start a "pollution free zone" program in their neighborhood.
Interview and public service announcement campaigns are underway to reach a broader audience through electronic media.
5-10 Milwaukee Estuary RAP

CHAPTER 5: REACHING RAP GOALS THROUGH EXISTING PROGRAMS POLLUTION ABATEMENT AND PREVENTION
Household hazardous waste video
One adult educational video was produced about household hazardous waste. A children's video was completed in December, 1992. In addition, a slide show promoting household "pollution free" zones was produced. All products are available community wide.
Display A free-standing display to offer quick pollution prevention information to a wide variety of people was developed. The display has been used at trade shows, festivals and area stores.
Brochures A series of informational brochures has been developed including a Safe Water House Quiz, a Shoppers Guide, Health and Environmental effects of Common Household Products, Lawn and Garden the Natural Way and a poster illustrating individual household's pollution contribution.
Milwaukee Estuary RAP 5-11

CHAPTER 5: REACHING RAP GOALS THROUGH EXISTING PROGRAMS POLLUTION ABATEMENT AND PREVENTION
Clean Sweep Programs
Many communities in the Greater Milwaukee area, including Glendale, Milwaukee, Shorewood, West Allis and Whitefish Bay, have held clean sweeps. Clean sweeps are events that make designated sites mailable for residents to dispose of their hazardous household waste.
What's involved in a Clean Sweep? Clean sweep events arrange for residents to bring in their old and unwanted hazardous household materials such as pesticides, solvents, acids, oil-based paints, waste oil and other potentially harmful products for proper treatment, disposal or recycling. Residents bring these materials to conveniently located collection sites where they are sorted by facility staff for contract disposal in a licensed and approved hazardous waste landfill or incinerator. Materials that are not accepted include: business generated waste, containers larger than five gallons or more than 50 pounds, ammunition and explosives, radioactive materials, biological waste, yard waste, or aerosol cans (except pesticides).
City of Milwaukee Clean Sweeu The Milwaukee Clean Sweep Program has been a one-day annual event since 1989. In 1990 and 1991 approximately 1 percent of the 240,000 households in Milwaukee participated each year. In 1990, 3,455 gallons of hazardous material was collected. In addition, 2,200 gallons of used motor oil and approximately 178 gallons of latex paints were recycled. The Waste Reduction and Recycling office of Milwaukee consistently receives 10 to 15 calls per week regarding household hazardous waste disposal options. In 1992, the Milwaukee Program collected about 5000 gallons of used motor oil and about 11,300 gallons of hazardous wastes.
The Clean sweeps are coordinated by the Department of Public Work's Waste Reduction and Recycling Program in conjunction with the city's Health Department, Department of City Development, MMSD, Milwaukee Fire Department's Hazardous Materials Team (HAZMAT), Bureau of Sanitation, and numerous volunteer, civic and educational groups.
What's Next? A permanent facility, or facilities, is needed to provide convenient access and greatly increase participation. The Intergovernmental Cooperation Council (ICC) with assistance from Greater Milwaukee Toxics Minimization Task Force (GMTMTF) are investigating the feasibility of a regional permanent facility. This effort, in combination with ongoing technical assistance and educational efforts will reduce the amount of household hazardous waste entering our surface waters. Public information and education is an important component of a sucessful clean sweep program. Encouraging consumers to purchase purchase enviromentally friendly products is the most effective way to reduce pollution.
Testing the Waters
The Testing the Waters (TTW) program in the Milwaukee River Basin was formed in 1989 through the efforts of eight public and private organizations. This program involves students in testing local waterways to educate them about protecting and improving their environment. The eight organizations forming the TTW Consortium include the WDNR, Havenwoods Environmental Awareness Center, Milwaukee County Extension, MMSD, Schlitz Audubon Center, Riveredge Nature Center, University of Wisconsin-Extension and Wehr Nature Center.
5-12 Milwaukee Estuary RAP

CHAPTER 5: REACHING RAP GOALS THROUGH EXISTING PROGRAMS POLLUTION ABATEMENT AND PREVENTION
Obiectives Following are the program objectives:
1) Provide training for teachers and students in riverine system ecology, Milwaukee River issues and intervention strategies to improve the watershed and the quality of life within the watershed.
Establish a network of high schools collecting and reporting water quality data through a central computer system and an annual watershed forum.
Develop students who are knowledgeable of local environmental issues, competent in using scientific equipment and research methods and aware of potential careers in science, computer science and natural resources.
Develop a citizenry who are able to take active and responsible steps in resolving complex socio-environmental issues.
2)
3)
4)
Particiuation In 1991-92, thirty-two schools in the Milwaukee, Menomonee and Kinnickinnic watersheds encompassing an area from South Division High School to Random Lake in Sheboygan County participated in Testing the Waters. Participants consisted of about 2000 students, and 50 school faculty and staff.
In the fall, each school sends a team of one teacher and four students to a TTW training workshop. In their classrooms, the students then become peer teachers and assist their instructor in preparing the class for the water quality monitoring field trips. Students test the water twice during the school year (or more, depending on the school) for ten different chemical, physical and biological water quality variables.
Through computer modems students are allowed to compare their data with schools in the Milwaukee River watershed as well as schools around the globe. Each spring, results are presented at a Student Conservation Congress; bringing all participating schools together to share their results and ideas.
The Testing the Waters project enforces for students the lesson that life is a series of complex relationships. These relationships are home of three components; economics, politics and the environment (the same relationships recognized by the RAP). One unavoidably affects the other.
Students learn ways in which they can take responsibility for protecting and bettering their environment. For example, they can improve water quality in the rivers and help beautify their communities by helping to correct nonpoint sources of pollution (e.g. by properly disposing of household hazardous waste).
Results Testing the Waters has influenced students' choices for the future. Several students that participated in the first Student Congress have chosen to pursue careers in environmental studies. Still other students who have graduated from the program, have chosen to continue their learning with the Schlitz Audubon Center lake monitoring project.
Milwaukee Estuary RAP 5-13

CHAPTER 5: REACHING RAP GOALS THROUGH EXISTING PROGRAMS POLLUTION ABATEMENT AND PREVENTION
At the first Student Congress, the keynote speaker urged students to "protect the river, it's our future". The message: students have a responsibility. An equally important message: students have the capability to influence the future.
Milwaukee River Revitalization Council
In 1987, The Wisconsin Legislature created the Milwaukee River Revitalization Council, a 13-member assembly appointed by the Governor. The Council advises the Governor, the legislature and the state departments of Natural Resources and Development on matters related to the revitalization of the Milwaukee River Basin. The Council's purpose was to develop a plan that encourages recreational, entrepreneurial and cultural activities along the Milwaukee River and its tributaries. To implement this Riverway Plan, the Council involved area public schools, policy makers, businesses and civic organizations.
Public Education The Council relics on public education to accomplish the objectives it set forth in The Riverway Plan Each ycar, the Council publishes a report to the Legislature that relates that year's accomplishments by individuals, communities and government to improve and protect the Milwaukee River Basin's water resources. Highlights of Remedial Action Plan progress are also included in the annual report. The Council also hosts a yearly half-day tour of the Basin for local policy makers. The aim of both the report and the tour is to focus attention on the Milwaukee River and challenge the public, legislators and businesses to discover ways to preserve and restore our water resources. In May 1993, the Council released a 30 minute documentary titled "The Milwaukee, Rebirth of a River." The video promotes stewardship.
Joining the Council to promote clean water, hundreds of area grade school artists lend their creativity to the Council's water quality poster campaign. The resulting masterpiece is an array of artwork arranged in a 12-month calendar. Each month presents one young artist's poster and includes a tip or fact to safeguard our rivers and lakes. In 1993, the Council published its first calendar.
Civic Organizations In the next step to advance The Riverway Plan, the Council has embraced two of the Basin's largest civic organizations, the Milwaukee Rotary and Kiwanis clubs, to establish the Milwaukee River Revitalization Foundation. Modeled after the efforts of the West Bend Rotary Waterways Foundation, the mission of this nonprofit group is to spur the development of a continuous greenway along the Milwaukee River. The Foundation will build on the community relationships forged by the Council to temporarily acquire lands abutting the river. The land the Foundation obtains will be transferred to city, county or state parks departments for management.
The goals of bolh the Council and Foundation are consistent with many RAP goals and objectivcs. Both organizations work to preserve and enhance greenspace in the Milwaukee River Basin for thc use and enjoyment of the public and for quality wildlife habitat. For example, the Kiwanis Club has sponsored an annual Milwaukee River Clean-up since 1982.
5-14 Milwaukee Estuary RAP

CHAPTER 5: REACHING RAP GOALS THROUGH EXISTING PROGRAMS POLLUTION ABATEMENT AND PREVENTION
EPA - 33/50 Program
The EPA's 33/50 program is a nation-wide voluntary pollution prevention initiative which began in February 1991, aimed at reducing emission toxic chemicals from industrial sources. The program targets 17 chemical groups for reduction:
Benzene Cadmium and cadmium compounds Carbon tetrachloride Chloroform (trichloromethane) Chromium and chromium compounds Cyanide compounds and hydrogen cyanide Lead and lead compounds Mercury and mercury compounds Methylene chloride (dichloromethane) Methyl ethyl ketone Methyl isobutyl ketone Nickel and nickel compounds Tetrachloroethylene (perchloroethylene) Toluene l,l,l, trichloroethane (methyl chloroform) Trichloroethylene Xylene (all xylenes)
The program is taking a multi-media approach (air, water, land) to reduce release of the 17 toxic chemical compounds by major dischargers by an aggregate of 33 percent in 1992, and a 50 percent reduction by 1995. The Toxics Release Inventory (TRl) will be used to track these reductions using 1988 data as a baseline. The program aims to achieve these targeted reductions through encouraging industry to further develop its pollution prevention activities.
According to the baseline data, 1.4 billion pounds of the targeted chemicals were either released to the environment or transferred off-site to waste management facilities in 1988. The aim is to reduce this figure to 700 million pounds by 1995.
The EPA sent letters to CEOs of companies emitting the largest quantities of the targeted chemicals in mid 1991, inviting their companies to join this voluntary program. In Wisconsin, approximately 224 industries were contacted. Of the industries contacted in the state, 35 (as of March 1992) agreed to voluntarily decrease their emissions as set forth in the 33/50 program (Nowakowski, 1992). The EPA estimates that by 1995, companies in Wisconsin will eliminate emission of 10.5 million Ibs/year (of the 35.1 million lbs/year currently emitted) of the 17 targeted chemicals.
Milwaukee Estuary RAP 5-15

CHAPTER 5: REACHING RAP GOALS THROUGH EXISTING PROGRAMS RESOURCE MANAGEMENT
Resource Management
Resource management is an integral part of pollution monitoring, remediation, and prevention. Described below are the programs that strive to understand and improve conditions of Milwaukee River Basin waterways.
Water Resources Management Programs
The Water Resources Management Program in the WDNRs Southeast District has a variety of responsibilities including: monitoring, conducting field investigations, areawide water quality plan updates, nonpoint source appraisals, and special studies. In addition, the MMSD monitors water quality throughout its sewer service area. Described below are these water resources management programs:
Surface Water Monitoring Program Sediment Management and Remedial Techniques (SMART) Program North Avenue Dam Feasibility Study Lincoln Creek Flood Control Project MMSD Surface Water Quality Monitoring Program Fish Contaminant Monitoring for Consumption Advisories
Surface Water Monitoring Program The purpose of the WDNRs surface water monitoring program is to provide the information required to meet water quality requirements set by the Natural Resources Board. The table below lists the objectives the program strives to achieve through various types of monitoring.
5-16 Milwaukee Estuary RAP

Monitoring
Condition Monitoring
Assessment Monitoring
Evaluation Monitoring
With Wisconsin's success managing point source effects on surface waters, more emphasis has been placed in recent years on other water quality problems such as toxic substances in water, sediment and biota, and nonpoint sources of pollution.
The WDNR's water quality monitoring program has evolved from assessing water quality based on single indicators, to a more integrated approach that evaluates the effects of specific discharges and substances on the entire aquatic ecosystem. This ecosystem approach complements the RAPS goals. While highest priority for monitoring is assessing effects of toxic substances and nonpoint source pollution, other monitoring activities such as surface water use classifications continue.
WDNR Water Quality Management Plans, updated every five years, address water quality issues and problems in a given river basin. WDNR uses Basin Plans to:
Select priority watersheds and lakes for the Wisconsin Nonpoint Source Water Pollution Abatement Program. Identify monitoring needs in the Basin. Note stream that need to be classified. Identify lake monitoring needs.
Objeetive(s) 1
- - Identify problem areas
- Identify pollution sources - Identify water management needs
-
Characterize water conditions, uses, trends
Evaluate effectiveness of water quality management actions according to state standards and impaired uses of waterways
Sediment Management And Remedial Techniques (SMART) Program
In 1989 the State Legislature recognized the need to address the issue of contaminated sediment by appropriating $240,000 annually to begin work in this area. The goal of the SMART Program is to restore surface waters which have been impaired or damaged by contaminated sediments. Activities to achieve this goal include: identification of the nature and extent of contamination, investigation of remedial measure options, implementation of effective remedial actions, development of sediment quality criteria, and monitoring the restoration of the resource. Proper remediation will assure that contaminated sediments no longer pose a threat to human health and aquatic life.
The responsibility for developing Wisconsin's overall sediment management program strategy has been assigned to the Surface Water Standards and Monitoring Section, Bureau of Water Resources Management. Since 1989, the Department's sediment management activities have
Milwaukee Estuary RAP 5-17

CHAPTER 5: REACHING RAP GOALS THROUGH EXISTING PROGRAMS RESOURCE MANAGEMENT
increased. described below.
The SMART team is involved in a wide variety of activities including those
Developing a comprehensive sediment management guidance docu ment which will deal with the assessment and remediation of contaminated sediment, as well as related institutional and legal issues. The document will eventually contain sediment quality criteria, standard operating procedures for sediment sampling and monitoring, methods for performing ecological and human health risk assessments, engineering aspects of remediation design plans and feasibility studies of remedial alternatives, and a ranking system for prioritizing sites.
Compiling a statewide p. Staff will conduct a statewide survey to identify sites that have, or potentially have, contaminated sediments. This will be accomplished in part through the Basin assessment/basin planning process. Additionally, a scoring system will he developed to rank sites for additional data collection, feasibility studies, and remediation.
Reviewing sediment quality in AOCs and developing sediment manage ment ootions for the five remedial action plans in the state.
Trackine and commenting on developments from the USEPA's Assessment and Remediation of Contaminated Sediment (ARCS) Program, as well as coordinating WDNR activities with the USEPA, U.S. Army Corps of Engineers (ACOE), NOAA, USGS and the Fish and Wildlife Service.
Conducting four sediment remediation demonstration projects in the state, including two in the Milwaukee Area:
Starkweather Creek (Madison): Includes plans to dredge 17,000 cubic yards of mercury-contaminated sediment, reshape and stabilize streambank, restore fish and wildlife habitat.
Cedar Creek (Cedarburg; Milwaukee Area): Includes plans to model the amount of PCB being transported from sediment hot spots to the Milwaukee River and harbor, conduct a feasibility study of remedial alternatives.
North Avenue Dam Feasibility Study (Milwaukee): Includes plans to conduct a feasibility study to evaluate management alternatives relating to the retention, partial or complete removal of the dam. Also, quantify the environmental, economic and social benefits and effects of these alternatives.
Little Lake Butte des Morts (Neenah): Includes plans to conduct a feasibility study of remedial options for removing or isolating a 67,000 cubic yard deposit of soft sediment containing 3600 pounds of PCB, select the best overall environmental solution, and implement clean up in 1994.
5-18 Milwaukee Estuary RAP

CHAPTER 5 : REACHING RAP GOALS THROUGH EXISTING PROGRAMS RESOURCE MANAGEMENT
Lincoln Creek Integrated Watershed Management and Storm Water Pollution Proiect
Lincoln Creek is a 9-mile continuous tributary to the Milwaukee River that drains 19.3 square miles of the communities of Milwaukee, Glendale and Brown Deer. Lincoln Creek is located north of the AOC. The Lincoln Creek subwatershed contributes 40 percent of the urban pollutant load generated in the entire Milwaukee River South Watershed. Because of pollution and flooding problems in the creek, the Milwaukee Metropolitan Sewerage District formed the Lincoln Creek Steering Committee to help develop a comprehensive strategy to provide flood control, protect and improve water quality, and enhance fish and wildlife habitat, urban green space and recreational uses.
Recently, the State of Wisconsin allocated $370,000 of the estimated $1.5 million project design cost. In 1994, recommendations addressing comprehensive flood control, water quality and aquatic habitat issues will be developed. The Lincoln Creek Steering Committee will continue to oversee the project and public information activities.
MMSD Surface Water Quality Monitoring Program
The MMSD began its surface water quality monitoring program in 1979 to comply with the Federal Water Pollution Control Act objectives and state water quality standards. This comprehensive monitoring program is being conducted to document long-term beneficial water quality trends as a direct result of implementation of MMSD's Water Pollution Abatement Program (WPAP).
At present, 24 sites are sampled on the Milwaukee, Kinnickinnic and Menomonee Rivers (including the inner harbor). In addition, 10 sites are sampled in the outer harbor and 11 sites are sampled in near shore Lake Michigan area.
Sampling is conducted biweekly from spring to autumn. River samples are analyzed for water temperature, dissolved oxygen, specific conductance (conductivity), turbidity, pH, alkalinity, chlorides, calcium, magnesium, total hardness, metals (Cu, W3, phosphorus, ammonia-nitrogen, total Kjedhal nitrogen, nitrate, nitrite, total organic carbon, total inorganic carbon, COD, BOD, fecal coliform bacteria, total solids, suspended solids, volatile suspended solids, and chlorophyll a. The outer harbor and near shore Lake Michigan sites are also analyzed for dissolved silica and plankton.
MMSD has four continuous monitoring stations. Data on dissolved oxygen, specific conductance, precipitation, and temperature have been collected at five minute intervals from spring to autumn since 1980.
This program is an essential component for monitoring the AOC for many critical water quality variables. Data collected have been shared by MMSD with WDNR Water Resources Staff, and have been proven invaluable in developing a comprehensive water quality monitoring program for the RAP.
Cd, Zn, Pb), total
Milwaukee Estuary RAP 5-19

CHAPTER 5 : REACHING RAP GOALS THROUGH EXISTING PROGRAMS RESOURCE MANAGEMENT
Fish Contaminant Monitoring for Consumption Advisories
An updated sport fish consumption advisory was issued in April 1993. The advice lists species and sizes of sport fish containing contaminant levels that may pose a risk to humans if eaten in certain quantities. The Wisconsin Department of Health and Social Services (DHSS) and WDNRs Bureau of Fisheries Management issued the first fish advisory in 1977. Currently, the advisory lists more than 235 Wisconsin lakes and rivers and is updated every April and October.
In the Milwaukee River Basin, sport fish with PCB consumption advisories include these species: crappie, northern, pike, redhorse, smallmouth bass, white sucker. Perch consumption poses the lowest health risk for sport species. Salmonids migrating seasonally into AOC waterways are also included in the advisories; these species include rainbow and brown trout, and coho and chinook salmon.
DHSS establishes appropriate health advice after reviewing fish contaminant test results with the WDNR. To test fish contaminant levels, WDNR staff begin by collecting fish using nets or electroshocking devices. The fish are wrapped, labeled, frozen and shipped to an agency laboratory in Madison, where they are thawed and filleted. Fillets (with the skin left on) are finely ground, placed in labeled jars, frozen and sent to a laboratory for contaminant analysis. DNR records show that PCB levels in Lake Michigan fish have dropped more than 80 percent in the last decade.
Wildlife Containment Monitoring for Consumption Advisories
A waterfowl consumption advisory is issued each year in the hunting regulations pamphlet since 1983. The advisory lists species of waterfowl containing levels that may cause risks to humans if consumed in certain quantities.
As with the fish consumption advisory, the DHSS establishes appropriate health advice after reviewing waterfowl contaminant test results with WDNR. To test waterfowl contaminant levels, WDNR staff collects wild waterfowl, then wraps, labels and ships the specimens to a laboratory in Madison where breast muscle is finely ground and analyzed for contaminants,
5-20 Milwaukee Estuary RAP

CHAPTER 5: REACHING RAP GOALS THROUGH EXISTING PROGRAMS RESOURCE MANAGEMENT
Fisheries Management Program
The WDNR's Fisheries Management Program is responsible for protecting, maintaining and enhancing Wisconsin's fisheries and the habitat that sustains them. Major program activities include assessing the status of fish populations, implementing and evaluating fishing regulations, habitat development, stocking of fish and identifying critical habitat. Other program activities include conducting resource surveys for environmental impact assessments, nonpoint source management and general permit review. An important program component is the acquisition, development and maintenance of public access and fishing areas. Public education, participative management and the promotion of resource stewardship arc a focus of public involvement in the fisheries program. Fisheries Management is initiating a study to assess the impacts of toxicants on fish populations.
The objectives of the Wildlife 2000 Strategic Plan, Biodiversity Plan, Fisheries' Strategic Plan, the Lake Michigan Integrated Fisheries Management Plan and other fisheries management plans, Integrated Resource Management Plans and the goals of the Great Lakes Fisheries Commission will be represented in RAP planning process. DNR wildlife and fisheries staff will work to ensure consistency among RAP goals, and other Great Lakes Programs such as the Great Lakes Water Quality Agreement, Lakewide Management Plans and the Great Lakes Fisheries Ecosystem Objectives. The RAP will work to support and enhance the objectives of these programs.
Wildlife Management Program
The focus of the WDNRs Wildlife Management Program is to maintain healthy life systems for area wildlife populations. The maintenance or restoration of healthy wildlife populations at areas of concern arc important aspects of the overall management program in the bureau of Wildlife Management. The wildlife toxicology program was initiated to identify problems, assess remediation progress, protect wildlife consumers and wildlife health. Wildlife disease surveillance, diagnosis and suppression minimize the risk of disease outbreak in wildlife populations. Wildlife management also includes leasing private lands to increase public hunting opportunities, conducting wildlife damage and nuisance animal control, monitoring environmental contaminants in wildlife, restoring and managing the wild turkey population, and assisting with the management of state scientific and natural areas. Public educational programs support these responsibilities. Additionally, habitat acquisition, maintenance and development provides opportunities for nonconsumptive wildlife observation and other non-hunting recreational activities.
USGS NAWQA Program
In 1991, the U.S. Geological Survey (USGS) began to implement a full-scale National Water-Quality Assessment (NAWQA) Program. The program has two goals: 1) Describe the status and trends in the quality of a large, representative part of the nation's surface and ground water resources, and 2) Provide a sound, scientific understanding of the primary natural and human factors affecting the quality of these resourccs.
The Western Lake Michigan Basin was among the first 20 NAWQA study units selected (1991) under the full-scale implementation plan. In the Milwaukee River Basin, three sites were chosen to represent rural, urban, and mixed rural-urban influences on water quality.
Milwaukee Estuary RAP 5-21

CHAPTER 5 : REACHING RAP GOALS THROUGH EXISTING PROGRAMS RESOURCE MANAGEMENT
The major water quality issues in the Western Lake Michigan Basin study unit are:
1) Nonpoint source contamination of surface and ground water by agricultural chemicals, including nitrate and pesticides. Aldicarb, atrazine, and alachlor are the most commonly detected pesticides.
Contamination by toxic substances, including PCBs, other synthetic organic compounds, and trace elements in bottom sediments of rivers and harbors (e.g. Milwaukee Harbor, Sheboygan Harbor).
Nonpoint source pollution and nutrient enrichment of rivers and lakes from the industrial and municipal waste discharges
2 )
3)
This program will greatly benefit the RAP by providing valuable data about toxicants in Lake Michigan that the WDNR would not otherwise have the resources to collect. Much of the information obtained will allow us to design and implement a more powerful monitoring program, and to gauge effectiveness of remedial measures, once implemented.
Lake Michigan Lakewide Management Plan
Lake Michigan was the first site chosen by the USEPA, as part of the 1990 Great Lakes Critical Programs Act, to develop and implement a Lake Wide Management Plan (LaMP). The LaMP is meant to identify lake wide problems, quantify loads of pollutants, identify sources of those loads and implement control strategies to reduce or eliminate the loads of toxic substances to Lake Michigan. The second draft of the Lake Michigan LaMP will be released for review in Fall 1993.
The USEPA is working in conjunction with Federal, State, Tribal and local agencies, the public, and the regulated community to direct existing programs and establish new programs as a part of LaMP. The Plan has two primary environmental objectives, listed below. The LaMP and the RAP complement each other's goals. The RAP targets the reduction or virtual elimination of pollutants causing problems in rivers and harbors, while the LaMP targets reduction of pollutants affecting the entire lake.
1) To achieve specific reductions in the release and deposition of pollutants in the Lake Michigan ecosystem on established time tables and to isolate, treat, and/or remove contaminated sediments to levels that provide:
Water quality and sediments capable of sustaining communities of sensitive living resources (aquatic or terrestrial); and
Drinking water, fish, and wildlife which pose minimal risks upon human or wildlife consumption.
2 ) To virtually eliminate the release of persistent, toxic, and/or bioaccumulative pollutants within the Lake Michigan Basin in order to prevent any further degradation of Lake Michigan and to avoid costly remedial actions in the future.
5-22 Milwaukee Estuary RAP

CHAPTER 5: REACHING RAP GOALS THROUGH EXISTING PROGRAMS REGULATORY INITIATIVES
Regulatory Initiatives
Regulatory initiatives are a necessary part of reducing and eliminating the amounts of toxic pollutants from entering our waterways. These initiatives, combined with voluntary compliance, will enable us to meet RAP goals.
Wastewater Management Program (WDNR) Permit and Pretreatment Program (MMSD) Solid and Hazardous Waste Management Program (WDNR) Water Regulation and Zoning Program (WDNR) Air Management Program (WDNR) Superfund Program (USEPA)
Wastewater Management Program (WDNR)
The mission of the WDNRs Wastewater Management Program is to protect, maintain and improve the chemical, physical and biological quality of state waters. The WDNR manages present and potential point sources of discharge and related sludges toward that end. The program has these goals:
Protect public health. Safeguard fish, aquatic life, scenic and ecological values. Enhance the urban and rural uses of water by regulation and control of point source discharges.
At the WDNR Southeast District, wastewater is divided into Industrial and Municipal Wastewater Programs, which are described below. The Industrial Wastewater Section, in addition to its industrial discharge permit activities is in the process of setting storm water monitoring criteria for the city of Milwaukee.
Milwaukee Estuary RAP 5-23

CHAPTER 5: ??::ACHING RAP GOALS THROUGH EXISTING PROGRAMS REGULATORY INITIATIVES
Industrial Wastewater
Industrial direct discharges to Wisconsin ground and surface waters are regulated through WDNRs Wisconsin Pollutant Discharge Elimination System (WPDES) permits. There are two types of WPDES permits: a specific permit for an individual discharge and a general permit for discharge that falls into a particular category. To date, WDNR's Southeast District has issued about 150 specific permits and 18 general permits covering 600 facilities.
Industrial indirect discharges to publicly owned treatment works (POTW) are regulated by WDNRs pretreatment program. Industries that discharge to POTWs and have a design capacity over 5 MGD (million gallons per day) are administered pretreatment permits. These pretreatment permits are administered by the POTW (wastewater treatment plant) receiving the discharge. Industries discharging to POTWs less than 5 MGD (million gallons per day) are administered pretreatment permits by the WDNR. Currently, about 270 Southeast District industries have been administered pretreatment permits by POTWs and 46 by the WDNR. Industries wishing to discharge directly to surface water must be able to meet state water quality standards in their effluent. As with municipal WWTPs, monitoring requirements are included in WPDES permits and are based on an analysis of discharge from the facility.
Federal regulations requiring storm water permits for certain categories of industrial and municipal discharges became effective November 1990. The regulations emphasize the use of best management practices to prevent contaminants from getting into storm water. In the Greater Milwaukee area approximately 5000 industries will be affected by the new storm water regulations. The WDNR is the authority for storm water permitting in Wisconsin, and is in the process of developing administrative code for the program. Once the codes are complete, the WDNR will issue general permits to all eligible facilities.
5-24 Milwaukee Estuary RAP

CHAPTER 5: REACHING RAP GOALS THROUGH EXISTING PROGRAMS REGULATORY INITIATIVES
Municipal Wastewater
Municipal wastewater discharges are regulated through the Wisconsin Pollutant Discharge Elimination System (WPDES). WDNR drafts and issues permits for a period of five years,
Treatment plants conduct initial effluent sampling and report their results to WDNR before they can receive a permit. Effluent limits are based on daily, weekly and monthly averages of discharge. Monitoring requirements are also included in WPDES permits and are based on an analysis of discharge from the facilities.
Most facilities with permits are required to send monthly reports indicating their monitoring results to the WDNR for review. In addition to this monthly reporting, municipalities must report annually to the state. The purpose of these reports is to provide the community, as well as the WDNR, with an assessment of the current conditions of the wastewater treatment plant and the collection system.
WDNR has plans to issue a permit for the City of Milwaukee for control of their municipal storm water runoff. Federal regulations require that incorporated areas over 100,000 in population apply for storm water permits. In Wisconsin, this includes Madison and Milwaukee. To receive a permit, the municipality must inventory storm sewer outfalls, analyze dischargc, describe existing programs to control pollutants from the storm sewer system, and propose a management plan to minimize pollutant loading to storm sewers. Examples of pollutant minimization actions include ordinances to control pesticide and fertilizer; pet waste control ordinances; increased street sweeping; educational programs; construction erosion control measures; and installation of detention basins.
Permit and Pretreatment Program (MMSD)
The Milwaukee Metropolitan Sewerage District (MMSD) must adhere to WPDES permit standards. MMSD is also required to operate a pretreatment program to control pollution in industrial wastewater entering the sewerage system.
WPDES Permit Standards Both of MMSD's facilities regularly conduct priority pollutant scans on influent, effluent and sludge. Information from the scans is used to estimate quantities of pollutants being discharged to Lake Michigan.
The Jones Island and South Shore treatment plants received revised WPDES discharge permits in 1991. On a monthly basis, both facilities monitor for cadmium, trivalent chromium (+3), total chromium, total copper, total lead, total mercury, total nickel, total zinc, total phosphorus, total silver and total cyanide. In 1992, Jones Island went into effect for hexavalent chromium, total recoverable copper, lead and silver, cyanide, mercury, phenanthrene and pyrene. South Shore effluent limits for hexavalent chromium, total recoverable coppcr, lead and silver, cyanide, benzo(a)anthracene, bromoform, bromodichloromethanc, 2,4,6-trichlorophenoI, methyl bromide, methyl chloride and pyrenc. Sludge monitoring takes place at both plants for three lists of parameters identified in MMSDs permits. Limits may be required for sludge constituents if warranted based upon reviews of monitoring data.
Pretreatment Proeram
Milwaukee Estuary RAP 5-25

CHAPTER 5: REACHING RAP GOALS THROUGH EXISTING PROGRAMS REGULATORY INITIATIVES
Through its sewer use ordinance and local discharge control permits, MMSD regulates over 500 industries, of which more than 200 must meet pretreatment requirements. Most of these 200 facilities have federal categorical limits which they must meet based upon the type of waste generated. The remaining facilities are regulated under local limits.
Under the Resource Conservation and Recovery Act (RCRA), the USEPA was required to estimate hazardous waste discharged to sewers. The results indicate a need to regulate additional discharges under the industrial wastewater pretreatment program. MMSD is in the process of issuing permits to approximately 80 additional industrial dischargers in response to the results of the federal domestic sewage study.
Solid and Hazardous Waste Management Program
The Solid and Hazardous Waste Management Program at Southeast District has four organizational sections including: Hazardous Waste Management, Solid Waste Management, Emergency and Remedial Response and Recycling
Hazardous Waste Management
The function of the Hazardous Waste Program is to ensure that hazardous waste generators, transporters, treatment, storage and disposal facilities are complying with regulations so that contamination (e.g. of soil and groundwater) from hazardous waste does not occur. The program requires facilities to investigate and remediate any contamination caused by their hazardous waste activities. Hazardous waste regulations are found in NR 600-685 of the Wisconsin Administrative Code.
The Southeast District (SED) Hazardous Waste Program is responsible for licensing hazardous waste transporters and treatment/storage/disposal facilities, conducting generator and site inspections of facilities where hazardous waste is managed (including transporters), and responding to complaints. The program also manages projects for the investigation and remediation of hazardous waste and offers a Technical Assistance Program to prevent pollution.
Remedial measures A facility must investigate and, if necessary, implement specific clean- up remedies if there is evidence of contamination, including releases from past disposal activities. This program is implemented by the DNR Southeast District Hazardous Waste Program. The Hazardous Waste Program has extensive authorities to require corrective action at hazardous waste facilities to address both on-site and off-site contamination.
Pollution prevention is another important aspect of the Hazardous Waste program. The Hazardous Waste Minimization Technical Assistance Program is discussed in the Wisconsin Pollution Prevention Management Groups section on page 5-2. It provides general information on waste minimization for all generators and specifically targets three categories:
1) Electroplaters and metal finishers
Pollution prevention
5-26 Milwaukee Estuary RAP

CHAPTER 5: REACHING RAP GOALS THROUGH EXISTING PROGRAMS REGULATORY INITIATIVES
2) 3)
Solid Waste Management
The Solid Waste Management Program, Chapter NR 502, Wisconsin Administrative Code, is responsible for licensing and overseeing solid waste disposal facilities (e.g. landfills), storage facilities, the review of initial site reports, feasibility reports and in-field conditions reports: plans of operation, site construction documentation, closure plans, and land spreading plans and modifications. The program is also responsible for licensing and oversight for solid waste transportation, transfer, incinerators, air curtain destructors, processing, wood burning, one time disposal and small demolition facilities, as well as implementation of the state's infectious waste program
The goal of the program is to ensure that efficient, nuisance-free and environmentally acceptable solid waste management procedures are practiced so that they do not have a detrimental effect on wetlands, critical habitat areas, and surface and ground water quality. During the operation of a landfill and prior to closure, assessment and monitoring must be conducted. If contamination is found, remedial measures must he taken to correct the problems.
Environmental Response and Repair
The Environmental Response and Repair Program at the Southeast District WDNR is responsible for the implementation of the state's environmental repair programs and corresponding federal programs described below.
The Leaking Undereround Sto rage Tank (LUST) Program provides federal resources and authority to clean up petroleum leaks and spills from underground storage tanks.
The Superfund Program provides federal resources and authority to respond directly to releases (or threatened releases) of hazardous substances that could endanger human health or the environment (see Superfund Program description on page 5-32).
The Wisconsin Environmental Reoair Program utilizes state resources provided through the Environmental Fund (EF) to correct environmental damage problems which are not eligible for remedial action under Superfund.
The WDNR operates a Hazardous S ubstance Sp ill Proeram under the authority of s. 144.76, WI Statutes. When a spill (or discharge) occurs, the WDNR's primary role is to protect the environment. The party responsible for the spill is required to undertake the cleanup action deemed necessary by the WDNR. If the identity of the responsible party is unknown, the WDNR is authorized to take the necessary action to return the environment, as nearly as possible, to the condition it was in prior to the spill.
The Abandoned Container Program (s.144.77 WI Statutes) requires responsible parties to properly monitor and maintain containers of hazardous substances. If the WDNR determines that a container containing a hazardous substance is not being adequately monitored and maintained, the WDNR has the authority to take the action it deems necessary under the circumstances. Such action is usually limited to cases constituting an imminent threat to
Auto repair and body shops Local governments, universities and trade schools
Milwaukee Estuary RAP 5-27

CHAPTER 5: REACHING RAP GOALS THROUGH EXISTING PROGRAMS REGULATORY INITIATIVES
public l a , health safety, welfare, or the ~ environment and typically consists of repackaging of the hazardous material, or remov ;a1 and disposal.
The Environmental Response and Repair (State Superfund) Program is administered by the WDNR under the authority of s. 144.442, WI Statutes. The WDNR may use the authority of this statute to undertake environmental response and repair actions or enter into contracts with any person to take such action. The WDNR is authorized to seek recovery of its environmental response and repair costs if the responsible party: should have known that the disposal was likely to result in or cause contamination; violated any legally applicable requirement and the violation caused or contributed to the contamination; contributed to the contamination and would result in liability under common law in effect at the time the disposal occurred.
Recycling
The function of the Recycling Program is to implement and administer the State of Wisconsin's "Recycling Law" (Wisconsin Act 335, 1990). The law is a broad statute that will change the state's throw-away habits. The purpose of the Recycling Program is to reduce the use of landfills and incinerators, and emphasize waste reduction, reuse, recycling and composting methods.
The Recycling Program has numerous pollution prevention related goals:
Recycle 25 percent of solid waste by 1995. Recycle 30 to 40 percent of solid waste by 2000. lnvolvc 100 percent of the state's population in the recycling program by 1995. Provide convenient yard composting and oil collection facilities for all residents by 1995. Require 40 percent recycled paper content in paper products purchased by governments agencies by 1995. Require newspapers to contain 45 percent recycled paper content by 2001. Require plastic containers to contain 10 percent recycled plastic content by 1995. Expand use of tires, glass, paper mill sludge, wastepaper, and ash in road construction,
The program works with the Department of Development (DOD) and the Wisconsin Housing and Economic Development Authority (WHEDA) to provide businesses economic assistance; DATCP to establish labeling standards and monitor market entry of new or existing recyclable products; and DILHR to modify commercial building codes to require building owners to allocate space for recycling.
By 1995, all communities which r.e .ceive state recycling grants will be required to define and measure their solid waste stream, re cyclables generated, and residual materials landfilled. This will enable the WDNR to closely m onitor recycling and landfill activities and work with communities to reduce waste generati 1 on and illegal disposal.
Ninety percent of the communities in SED (65 percent state-wide) already participate in the Grant Program, which provides monies to responsible units for recycling and yard composting activities. Eight-hundred communities state-wide have started or plan to start a recycling program in the near future.
5-28 Milwaukee Estuary RAP

CHAPTER 5: REACHING RAP GOALS THROUGH EXISTING PROGRAMS REGULATORY INITIATIVES
Milwaukee's Clean Sweep program, described on page 5-12, is collecting more hazardous waste each year. Over 86,000 households, or one third of the City, participates in recycling. Nearly 11,000 tons of recycling material were collected from these households during 1992. This represents a 57 percent increase over the second year of the program.
Milwaukee Estuary RAP 5-29

CHAPTER 5: REACHING RAP GOALS THROUGH EXISTING PROGRAMS REGULATORY INITIATIVES
Water Regulation and Zoning Program (WDNR)
The Water Regulation and Zoning Program protects public rights and interests in surface waters by providing the services listed below. Permits are required for these types of projects: grading, utility crossings, ponds within 500' of a water body, culverts, and outfall structures into a water body.
Specific functions of the WDNR Southeast District program include:
Water Regulation. In the Southeast District, about 800 permit applications are received annually and reviewed by program staff. An additional 1500 to 2000 informal inquiries are received each year which do not proceed to a formal decision because they are not in compliance with state law. Some activities requiring permits include: dredging, grading, channel changes, diversions, and dam construction, operation and maintenance. Over 95 percent of the formal applications are granted, although the majority have been modified from the original proposal to conform to state law. Statewide, staff respond to approximately 300 inquiries regarding the U. S. Army Corps of Engineers' Section 10 and Section 404 permit programs.
Shoreland Zoning. Assistance is provided to counties to effectively administer zoning ordinances applying to areas near navigable lakes and streams. Seventy counties have both the "basic" shoreland and shoreland/wetland ordinances in place. In the Milwaukee River Basin, over 30 municipalities have these ordinances in place as well. Cities and villages with wetlands in their shoreland areas are required to adopt wetland protection zoning ordinances. Most have done so.
Dam Safety. This inspection program examines dams each year and provides substantial follow-up with dam owners who need to make repairs or take some other major action to improve safety of their dams. In the Milwaukee River Basin, there are 67 dams. Forty-six of these dams have received an inspection. So far, these inspections led to seven repairs and 2 abandonments.
In 1990, staff were added to administer a grant program to assist municipalities in funding the cost of repair of their dams. Efforts are being made to increase the inspection staffing to meet the statutory requirement to inspect about 115 large dams each year statewide, a substantial increase above the current 50 inspected each year. Inspections are also made upon complaint that a dam is potentially unsafe.
Floodplain Zoning. Assistance is provided to communities in effectively administering their ordinances. About 25 Milwaukee River Basin municipalities have adopted ordinances that meet or exceed minimum state standards. Communities are also assisted in meeting requirements of the National Flood Insurance Program.
Wetlands Inventory. Final Wisconsin Wetland Inventory maps have been completed for the entire state and have been issued to all counties and to most cities and villages which have wetlands in the shoreland areas. Wetland maps are being updated to reflect natural and human-caused changes. With existing funding, maps can only be updated on an average of once every 20 years. Efforts are being made to secure sufficient funds to change this interval to an average of 10 years.
5-30 Milwaukee Estuary RAP

CHAPTER 5: REACHING RAP GOALS THROUGH EXISTING PROGRAMS REGULATORY INITIATIVES
Air Management Program (WDNR)
The Southeast District Air Management Monitoring Section measures actual concentrations of pollutants in the ambient air. The section monitors continuously for ozone, sulfur dioxide, nitrogen oxides, and carbon monoxide at several locations throughout the district, When an exceedance of a National Ambient Air Quality Standard (NAAQS) is measured, the Engineering section is assigned to determine responsibility for the exceedance.
The compliance units are responsible for evaluating whether the air pollution sources in the southeast district are in compliance with applicable Natural Resources Administrative Codes. The permitting unit is responsible for processing new source permits.
The Clean Air Act amendments of 1990 included regulations on hazardous air emissions. The Federal law requires the EPA to develop emission limitations for some 200 compounds over the next 10 years. The SED Air Management program will continue to carry out the hazardous air compound rules effective in October 1988 and phase in the EPA regulations as they are promulgated. By effectively implementing the Clean Air Act Amendments, the Air Management Program is doing its part in helping to achieve the goals of the RAP by ensuring industry compliance with the hazardous air emission reduction goals.
The public can call their WDNR district office and obtain prerecorded reports on the current air quality in the southeast district, The monitoring section is responsible for updating the recorded messages on a daily basis. The monitoring section has also been involved in a special study concerning the effects of Lake Michigan on localized meteorological conditions along the lake shore and the atmospheric transport of ozone precursors into and out of the district.
Milwaukee Estuary RAP 5-3 I

CHAPTER 5: REACHING RAP GOALS THROUGH EXISTING PROGRAMS REGULATORY INITIATIVES
Superfund Program (EPA)
The Superfund program, officially known as the Comprehensive Environmental Response, Compensation, and Liability Act (CERCLA) was enacted by the federal government in 1980 and amended in 1986 by the Superfund Amendments and Reauthorization Act (SARA). Under this law, th.e federal government was given broad authority and resources to respond directly to releases (or threatened releases) of hazardous substances that could endanger human health or the environment. Thc USEPA has the primary responsibility for managing the clean-up and enforcement actions under the Superfund program
Each Superfund site is unique. Hence, there is no general, all-purpose solution to Superfund site clean up. Described below is the four stage process used to develop a workable and permanent solution for clean up.
Remedial Investigation/Feasibility Studv ( RI/F S l . This first step examines the type and extent of contamination and identifies possible clean-up solutions. The Superfund program sets several requirements for this phase of remedial response.
A Record of Decision (ROD) is then determined based on the RIES. The ROD describes the remedy chosen for a site, provides background on the decision, and also provides the basis for future EPA efforts to recover Superfund monies spent on clean-up from responsible parties.
The Remedial Design IRDJ is then developed which details design plans and specifications for conducting the clean-up.
The Remedial Action (RA) follows completion and approval of the remedial design and includes actual site clean up. The RA is also known as the construction or implementation phase. Once this phase is completed, long-term monitoring to document the effectiveness of the action is conducted.
5-32 Milwaukee Estuary RAP

CHAPTER 6: CONTAMINATED SEDIMENT MANAGEMENT STRATEGY STRATEGY SUMMARY
CHAPTER 6: Contaminated Sediment Management Strategy
This chapter describes contaminated sediment, which is one of the primary sources of pollution in the Milwaukee Estuary AOC. More specifically, it describes the proposed strategy to reduce or eliminate this AOC pollution source. A lso see Appendix C, Sediment Assessment Methods.
Many contaminants adsorb to sediments which eventually settle as river bottom deposits. These deposits serve as a sink for a variety of toxicants, allowing them to collect at an elevated level. When this sediment is disturbed, these toxicants return to the waterways. If this source of toxic substances is not controlled, it may not be possible to fully restore some uses of AOC waterways even after existing pollutant sources, such as combined sewer overflows are abated. To be cost effective, it is equally important that the contaminated sediment strategy determines which areas may not require clean-up as well as those that will require removal and/or treatment.
Although the flow of toxic substances from "point sources" like wastewater treatment plants has decreased, so-called "nonpoint sources" of toxicants are proving to be important. These nonpoint sources of toxics include parking lots, highways, contaminated sediment from upstream areas, airborne pollutants, and even runoff from rural areas upstream. Plans for contaminated sediment clean up must be integrated with strategies to identify and reduce nonpoint sources of toxic substances.
While sediment remediation is an important component in meeting RAP goals, dredging, capping, and arrnoring are not the only approaches to the problem. A sediment strategy consists of a balance of pollution prevention activities and enhanced nonpoint source control in addition to clean up of strategic sediment "hot spots".
Milwaukee Estuary RAP 6-1

CHAPTER 6: CONTAMINATED SEDIMENT MANAGEMENT STRATEGY STRATEGYSUMMARY
Strategy Summary
This section briefly describes the contaminated sediment strategy. Each section is described in more detail beginning on page 6-3.
Evaluate and Control Sediment Pollution Sources This proactive step is crucial to the permanence of sediment quality restoration. Before proceeding with expensive large-scale remediation of sediments in the AOC, all significant sources of toic contamination must be eliminated or controlled. The evaluation and control of urban and rural runoff must be a priority. In addition, contaminated sediment deposits have been identified at several upstream sites. Only after these pollution sources are understood and controlled, will clean up of contaminated sediments within the AOC be truly effective and lasting.
Characterize Upstream and AOC Sediment In order to target areas and methods for sediment remediation, we must assess the location and extent of contamination. Efforts to assess contaminated sediment deposits will progress from upstream to downstream areas. This step also involves identifying cost-effective ways to characterize contaminated sediment deposits.
Guidelines such as those published by the Ontario Ministry of Environment and Energy (Guidelines for the Protection and Management of Aquatic Sediment Quality in Ontartio, August 1993) will be used as a screening tool to define areas in need of possible remediation. Site-specific sediment quality objectives will be developed by DNR's SMART team for areas identified in the screening process to assess "how clean is clean?".
Develop and Implement Remedial Options Clean up of sediment deposits will begin once an area of contamination is identified and adequately characterized, and upstream sources are controlled. Remediation will take place in an upstream to downstream manner. We anticipate that the largest deposits with the most wide-spread, low-level contamination will also be the most difficult and costly to remediate. Indeed, for these large deposits the question may be whether to remediate at all, rather than how to remediate. Plans for remediation must balance the need to meet RAP goals with the realities of prohibitive remediation costs.
Remedial treatment and disposal technologies will be evaluated by the WDNRs SMART program for cost effectiveness and applicability to specific Milwaukee Estuary AOC sediment deposits. The RAP Sediment Workgroup will facilitate implementation of the most effective remedial options for each site.
6-2 Milwaukee Estuary RAP

CHAPTER 6: CONTAMINATED SEDIMENT MANAGEMENT STRATEGY STEP 1: CONTROL SEDIMENT POLLUTION SOURCES
Evaluate and Control Sediment Pollution Sources
Before proceeding with expensive large-scale remediation of sediments in the AOC, we must eliminate or control all significant sources of toxic contamination. Urban and rural runoff must be evaluated and, if necessary, controlled. Only after pollution source contributions are understood and controlled, will clean up of contaminated sediments be truly effective and lasting. This step consists of identifying and controlling pollution sources.
Upstream sources must be addressed first to progressively eliminate recontamination. Contaminated sediment has been identified at sites like the Cedar Creek impoundments, Lincoln Creek, the Moss- American Superfund site, as well as the Thiensville, Estabrook, and North Avenue Dam impoundments.
In addition to addressing upstream contaminated sediments, pollutants entering these waterways via urban and agricultural runoff must also be controlled. An effort must be made to identify and control continuing non-point sources of pollution. Nonpoint sources of pollutants are significant problems for urban areas (Marsalek and Ng, 1989; Field and Pit, 1990). Because of the variety of urban land uses and manufacturing and industrial processes within a metropolitan area, there is an ever-growing array of toxicants entering the aquatic system. Pollution in urban runoff includes salts, deicing chemicals, litter, animal waste, pesticides, petroleum products, solvents, asphalt, and acids (McGehee Marsh, 1993). Quantities of heavy metals, polycyclic aromatic hydrocarbons (PAH), bacteria, pesticides and suspended solids in urban runoff often exceed federal water quality regulations (U.S. EPA, 1983; Bannerman, 1990.) This runoff often discharges into surface waters via storm sewers.
Routes of Sediment Contamination
Contaminated sediment is the end result of several pollutant sources. Pollutants found in Milwaukee area sediments enter the aquatic system via several routes. Storm sewers, urban and rural runoff, illegal connections, illegal dumping, upstream contaminated sediments and air emissions are several routes that are suspected to be significant.
I ---- Storm sewers
Storm sewers are suspected to be significant contributors of pollutants to area surface waters. Many of the hydrophobic organic pollutants found in storm sewers may end up in bottom sediments. Preliminary data collected from storm sewer outfalls by the City of Milwaukee indicates that storm sewer effluent may be a significant element in understanding the transport
contribution to the contamination of the environment.
RAP participants and DNR should assist the City of Milwaukee in evaluating the contribution of storm sewers. Storm water modeling done by the City of Milwaukee, although based on many assumptions, can serve as a tool to prioritize outfalls which have the highest estimated output of toxics. Storm water regulations, when developed, will reduce the toxics loading to AOC waterways, but it may bc possible to expand on the required actions to further reduce toxic loadings.
of toxics in Milwaukee's waterways. Urban runoff needs to be further assessed for its
Illeeal Dumping / Illeeal Connections
The City of Milwaukee conducted dly weather monitoring of storm sewers as part of their
Milwaukee Estuary RAP 6-3

CHAPTER 6: CONTAMINATED SEDIMENT MANAGEMENT STRATEGY STEP 1: CONTROL SEDIMENT POLLUTION SOURCES
storm water pcnnit application. noting noxious odors and x i l o r r suggests that illegal dumping ani1 iiiegal connections are contributing toxicants to the system. The City of Milwaukee is proposing to follow up on this activity by devoting a field crew and sampling equipment to the identification of illegal storm sewer connections (Luebke, 1993).
As is mentioned in Chapter 3, "do-it-yourselfers" dump an estimated 90,000 gallons o f used motor oil. This oil has thc potential to contaminate large quantities of surface water. Even a small number of illegal dumping instances can have a large impact on both water and sediment quality in the AOC.
WDNR and other RAP participants will support the City of Milwaukee's storm water and pollution prevention activities. Public education must also be an important component in abatement of these problems. Increased participation and funding for educational and pollution prevention activities is essential. RAP participants must also consider expanding hazardous waste collection activities to increase access for households and to include small businesses.
.;.y staff qualitatively characterized pollutants, in many cases colors emanating from storm sewers. This information
Air Emissions
Pollutants entering the system via air deposition is another suspected source of sediment contamination. For example, the combustion of fuels is probably the most prevalent anthropogenic source of PAHs in the environment (Helfrich, 1988). Sediment samples collected from areas adjacent to heavily traveled roadways have shown elevated levels of PAH contamination (WDNR, 1993). Clearly it makes little sense to anticipate remediation of sediments for PAH except in cases where extremely elevated levels exist if this turns out to be a major continuing source.
Urban nonpoint source controls may reduce the mass of airborne pollutants entering our waterways to some extent, but there is no real control over this source of pollutants short of major changes in transportation.
The DNR and RAP participants should work to understand the implications of continuing air emissions as it relates to contaminated sediment issues. This includes:
1) Coordinating Bureau of Air Management and RAP participant activities;
2) Funding a basic study aimed at estimating the flux of air toxins in and around Milwaukee;
3) Evaluating the significance of the estimated toxics flux in comparison to other sources.
Upstream Contaminated Sediments
6-4
A number of contaminated sediment sites exist upstream of the AOC. These far removed sites contribute toxicants to the AOC. For example, the Cedar Creek site is currently contributing between 4 and 38 kilograms per year of PCB to the Milwaukee River. Recent work by the DNR shows that in addition to PCB from Cedar Creek, an unknown PCB source exists upstream on Lincoln Creek.
Milwaukee Estuary RAP

CHAPTER 6: CONTAMINATED SEDIMENT MANAGEMENT STRATEGY STEP 1: CONTROL SEDIMENT POLLUTION SOURCES
Another such contamination site exists on the Little Menomonee River below the Moss- American Superfund site. Although the sediments contain high concentrations of PAHs, it is not known whether significant quantities of PAH are migrating to downstream areas.
It is critical that these upstream sources of pollution are assessed for their pollutant contribution to the AOC and remediated if necessary. Continued support of ongoing projects is necessary to fully assess contamination in the Basin.
Rural nonpoint sources
Although recent sediment investigations have found very little presence of common agricultural chemicals and pesticides in AOC sediments (Christensen, 1991), the levels of total Kjeldahl nitrogen and total phosphorus in sediments exceed the Ontario Ministry of Environment and Energy's guidelines for toxicity (0ntario Ministry of Environment and Energy, 1993). Therefore, to prevent degradation of benthic organisms sediment management projects must be managed to provide acceptable levels of both organic pollutants and nutrients.
While rural sources can be blamed for a large portion of the nutrient loads to the AOC, the urban storm sewers represent significant loads of nutrients as well. Comparison of loading estimates for the three large rivers (SEWRPC, 1987) to load estimates for the storm sewers (City of Milwaukee Storm water Permit Application, 1993) reveals the split between "urban" and "rural" sources: approximately 62% of total phosphorus can be attributed to "rural" sources, with the remainder from the "urban" storm sewers. Likewise, "rural" sources of total Kjeldahl nitrogen can be estimated at about 75%, with the remainder assigned to "urban" storm sewers.
Since all of the major watersheds in the Milwaukee Basin are currently designated as priority watershed projects, RAP involvement should focus on setting target reduction levels. RAP participants need to calculate and determine the reasonable and defensible target reduction goals needed to meet RAP objectives. Increased participation among landowners is necessary to reduce urban and rural nonpoint source pollution. A report card on the existing DNR nonpoint program shows "disappointing levels of participation among landowners whose property is a source of pollution" (Wisconsin Legislative Audit Bureau, 1992).
Although the issue of strengthening existing nonpoint programs will be played out at the state legislative and executive levels, RAP participants need to understand, and help policymakers understand, that water and sediment quality in the AOC will always reflect the collective health of the entire watershed. RAP goals cannot be met without a higher level of nonpoint program performance throughout the watershed.
Milwaukee Estuary RAP 6-5

CHAPTER 6: CONTAMINATED SEDIMENT MANAGEMENT STRATEGY STEP 2: CHARACTERIZE AOC SEDIMENT DEPOSITS
Characterize the Extent of Contamination in AOC Sediments
As the previous section indicates, there is much work to be done to ensure that existing sources of pollutants to the AOC are shut off. Once we are further into the task of controlling these continuing sources, we will need to address the problem of contaminated sediment in the AOC.
Existing sediment data gives us a general picture of sediment quality. Subsequent sediment sampling surveys will be designed to fill data gaps and better characterize the physical properties and location of depositional areas within the AOC. Preliminary decisions regarding need for remediation will be made using guidelines such as those published by the Ontario Ministry of Environment and Energy (Ontario Ministry of Environment and Energy, 1993). The focus of this task will to identify manageable sites that have the highest potential to contaminate surrounding or downstream sites (i.e. "hot spots").
Although sediment quality objectives may be exceeded in parts of the outer harbor, remediation of a large volume of sediment at a low level of contamination may be prohibitively expensive. The effectiveness of a reactive program involving large-scale clean-up needs to be compared to results gained through a proactive program emphasizing pollution prevention and waste minimization.
Existing Data
This section describes the sediment volume in the AOC and the data that has already been collected to characterize this sediment.
Sediment Volume in the AOC
Taylor (1990) estimated the volume of post-glacial sediment in the Milwaukee, Menomonee, Kinnickinnic Rivers and the South Menomonee Canal within the AOC to be either 0.678 or 4.5 million cubic meters based on seismic methodology and electrical resistivity measurements, respectively. The volume estimates were made for "very near surface sediments" approximately five feet thick in the Milwaukee River and six feet thick in the Menomonee and Kinnickinnic Rivers. Sediments may be as thick as 20 to more than 40 feet near the harbor entrance.
Taylor advised that multiple cores be taken to the full sediment depth to verify the seismic and electrical resistivity data before fully accepting the volumetric estimates. This coring verification exercise has not been done.
Taylor's geophysical survey covered about 86 percent of the sediment surface areas in the AOC portions of the Inner Harbor, rivers and canals but only 24 percent of the total sediment surface area in the AOC, because only the entrance channel in the Outer Harbor was surveyed.
Extent of Sediment Contamination in AOC
Limited information exists about the extent of contamination in AOC and upstream sediment. Significant studies to date include: Christensen, 1990, 1991; ACOE, 1989; MMSD, 1987; SEWRPC, 1987; Kizlauskas, 1982.
These studies, summarized in the table on page 6-7, indicate that the sediment deposits in the
6-6 Milwaukee Estuary RAP

CHAPTER 6: CONTAMINATED SEDIMENT MANAGEMENT STRATEGY STEP 2: CHARACTERIZE AOC SEDIMENT DEPOSITS
Milwaukee Estuary are contaminated by a variety of pollutants including PCBs, metals, PAHs, dioxin, conventional pollutants (e.g. organic carbon, fecal coliform) and pesticides. For a complete list of pollutants of concern in the AOC, see Appendix B .
Table 6.1: Significant AOC Sediment Studies to Date.
In general, concentrations of all parameters analyzed for, including metals, organic chemicals and conventional pollutants, such as oil and grease, kjeldahl-nitrogen, are higher than upstream reference site conditions (WDNR, 1990). Levels of contaminants present in the AOC are high enough to potentially effect the diversity and abundance of aquatic benthic communities.
Sediment Characterization
Additional sampling and monitoring is needed to better characterize the distribution and concentration of petroleum hydrocarbons, PAH compounds, and heavy metals in the sediments of the AOC. Potential sediment impact zones in, and below, discharge points (storm sewers, municipal and industrial outfalls) should be sampled and analyzed for representative contaminants to characterize the sediment quality in these areas. Increased efforts in small urban tributaries to determine their contribution of pollutants is needed. To date, these tributaries have been largely ignored, but preliminary data indicates that their combined impact may be important.
Also, collection and analysis of deep cores is essential to learn the full depth of contamination, as well as the depth of peak concentrations of toxic substances. This will be crucial in making decisions about sediment removal. It is necessary to know that removal of sediments will not expose greater concentrations of contaminants in the deeper layers that would otherwise be biologically unavailable.
Activities recommended to provide a more complete characterization of AOC sediment deposits are listed on page 6-12 and shown in Figure 6.1.
Once a contaminated deposit has been defined, information should be collected to characterize geographic location, areal extent, thickness and total sediment volume, average depths of water overlying the deposit, total organic content and the grain size of materials in the deposit. Initial mapping and physical characterizations of sediments should be performed in those areas where sampling site location maps show elevated levels of contaminants and potentially related biological effects to benthic organisms.
Sediment Sampling Density For Remediation Projects
A common problem for sediment remediation projects is the establishment of the number and
Milwaukee Estuary RAP 6-7

CHAPTER CONTAMINATED SEDIMENT MANAGEMENT STRATEGY STEP 2: CHARACTERIZE AOC SEDIMENT DEPOSITS
positioning of samples to characterize sediments for remedial design purposes. Through a comparison of previous sampling project reports the WDNRs SMART team concluded that more sampling is needed to adequately characterize AOC sediment deposits. See Appendix D, Sediment Sampling Densities Comparison.
Dutch sediment sampling practice for conventional dredging projects is to obtain sediment cores at intervals of 50 to 200 meters. This translates into one core for every 2500 m2 to 40,000 m2 of sediment (Sorensen, 1984). in the AOC results in the need for approximately 300 cores to characterize sediments for dredging purposes. The need to characterize sediments at greater depth would greatly increase the number of samples required for assessment. Therefore, the Sorensen formula must be taken as an empirical formula developed for convenience and not a formula based on the physics of sediment transport, deposition, resuspension, or chemical variability (Keillor, 1993). It is an example of various formulas that are being developed from available research projects to provide guidance on establishing sampling densities for dredging projects.
Currently the Milwaukee AOC has information available from about 50 core samples from three sources that were taken in the past five years. Where active sources of contamination exist, sediment data over two years old becomes less reliable in the decision making and remedial design process.
Since the cost of remedial dredging is about one order of magnitude higher than the cost of conventional dredging there is a need to accurately define a targeted deposit. Sediment sampling for remediation is driven by the economic need to be efficient and effective because of the high unit costs of disposal or treatment. Sampling must be compatible with the required precision of the remediation. The costs of sampling are justified by the funds saved in not removing "clean" sediments, thus maximizing the effectiveness of remediation.
A compelling argument for better remediation cost estimation based on increased sampling for characterization purposes can be made on economic grounds. For example, the $0.5 million cost of collecting samples at an additional 300 sites in the Milwaukee Estuary AOC can be recovered by locating 33,000 m3 of sediment that doesn't need to be removed. This is less than 0.4% of the estimated potential volume of contaminated sediment.
A sediment remediation project in Rotterdam recommended "very intensive" assessment sampling for future projects (Volbeda and Schrieck, 1991). More specifically, the report recommended that 10 to 30 percent of project funds, rather than the usual one percent, go toward sediment survey and sample analysis. This suggests that a sediment sample be taken for every 400 to 1300 cubic meters of sediment. Similarly, results of the Geulhaven Harbor (Van Dillen, 1991) remediation effort indicated that the costs of dredging could have been cut in half by more sampling and better separation of coarse and fine scdimcnt fractions.
Sediment Quality Objectives
Sediment quality objectives provide a ratio "contaminated" fractions. Sediment quality objectives may be either chemical-specific numerical values, or narrative descriptions implemented through biological testing criteria. Biological effects may be considered by integrating sediment toxicity/bioaccumulation, contaminant concentrations, and in situ responses of biota. Background concentrations may also be determined for comparison using "clean" reference sites.
Application of this formula for establishing sediment sampling densities
al basis for dividing sediment into "clean" and
6-8 Milwaukee Estuary RAP

CHAPTER 6: CONTAMINATED SEDIMENT MANAGEMENT STRATEGY STEP 3: SET SEDIMENT QUALITY CRITERIA
Sediment quality guidelines and criteria developed by other regulatory agencies should be used in developing screening-level clean-up objectives for the AOC. These guidelines include Ontario Sediment Quality Guidelines, NOAA Status and Trends, State of Washington Sedimcnt Standards, Netherlands Sediment Quality objectives, the EPA proposed Sediment Quality Criteria, and the Canadian Marine Sediment Quality Guidelines. Once a site is selected, site-specific, biologically- based criteria can be developed to refine sediment quality objectives.
Because of uncertainties regarding what a safe and appropriate level is for a particular contaminant in sediment, much time has passed and will continue to pass before a set of standards is published. The most appropriate response for RAP participants may be to embrace and acknowledge this uncertainty and compare sediment concentrations to a range of "acceptable" concentrations.
By comparing sediment concentrations to a range of reported effects, a cost estimate can be generated for various levels of clean-up. This allows for consideration of the economic implications of a remediation alongside the expected benefits.
For example, for a particular deposit we may estimate that for a million dollars remediation is possible down to 1 ppm PCB, but for an additional three million we can get down to 0.05 ppm PCB. Reality is that we may not be able to afford four million dollars to get to 0.05 ppm. The issue then becomes assessing whether getting down to I ppm PCB will still move us towards RAP goals.
Economics is not the only factor influencing the clean-up goals for a specific sediment deposit, the position of the deposit within the system is also a key factor. A sediment quality objective of "background makes sense when there arc no upstream or continuing sources of contaminants, other than the sediment itself. Using that as a criteria for sites further downstream within the system would be of little value.
Milwaukee Estuary RAP 6-9

CHAPTER 6: CONTAMINATED SEDIMENT MANAGEMENT STRATEGY STEP 4: DEVELOP AND IMPLEMENT REMEDIAL OPTIONS
Develop and Implement Remedial Options
When an area of contamination has been identified and adequately characterized and upstream contamination sources controlled, remedial options will be considered. Because of the unique characteristics of different sediment deposits, remediation techniques may need to be chosen on a site- specific basis. remedial technologies, and highlights some recent projects.
Limited options exist for the remediation of contaminated sediments. Since this is a relatively new field, the effectiveness of some options has yet to be verified.
Thorough work performed during sediment characterization and sampling will lend to efficient evaluation and implementation of these options. For example, knowing the approximate depth of contamination will help to avoid removing more sediment than necessary. This can greatly reduce the costs of remediation, considering the high costs of removal and treatment. The RAP Implementation Committee (RIC) will track the evaluation and application of options to restore contaminated sediment, just as it tracks RAP recommendations.
Remedial Option Selection Criteria
Remedial treatment and disposal technologies will be evaluated by DNRs SMART program for cost effectiveness and applicability to specific Milwaukee AOC sediment deposits. The criteria listed in the table below will provide guidance to the SMART team to determine the feasibility of remedial options. For each criterion, the table lists the question the SMART team should consider to apply that criterion.
The ability of technology to remediate to a desired endpoint (determined by clean-up values established for the AOC) will be another key consideration.
Table 6.2:
This section describes the criteria with which remedial options are selected, existing
Criteria for Selecting Options for Contaminated Sediment Remediation.
Criteria
Overall protection of human health and the environment
Compliance with sediment quality objectives and applicable regulations
Long-term effectiveness and permanence
Question
Will the remediation provide human health and environmental protection?
Will the remediation comply with specific sediment quality objectives?
What is the magnitude of residual risk and the adequacy of reliable control?
How much will the remediation reduce the toxicity, mobility, and volume of the hazardous material? To what degree is the treatment irreversible? What type and quantity of residuals will the treatment produce?
6-10 Milwaukee Estuary RAP

CHAPTER 6: CONTAMINATED SEDIMENT MANAGEMENT STRATEGY STEP 4: DEVELOP AND IMPLEMENT REMEDIAL OPTIONS
Criteria
Short-term effectiveness
lmplementability (administration, technical feasibility, and resources)
Community acceptance
Recent Projects
Question
What kind of effect will the remediation have on the community and the environment during implementation?
What is the availability of treatment, storage, and disposal services? What is the availability of necessary equipment, expertise, and validity of prospective technologies?
Is this the most cost effective option?
Does the remediation address concerns of the surrounding community?
Federal and state governments have been investigating the feasibility of several remedial options through a series of demonstration projects.
The EPA Great Lakes National Program Office (GLNPO) five year Assessment and Remediation of Contaminated Sediment (ARCS) project is evaluating assessment procedures to quantify aquatic effects at five selected AOCs. The project will be looking at establishing threshold concentrations for effects of contaminated sediments based on a number of different approaches. Although the AOC is not being studied in this project, the information generated will help guide remedial decisions for the Milwaukee Harbor. The following remediation processes are being demonstrated as part of the ARCS program and may have applicability to other Great Lakes AOCs:
Low temperature thermal desorption Sediment washing Bioremediation Solvent extraction
Recommendations made in ARCS Documents will be used as guidance. The ARCS documents are due to be completed by December, 1993 (USEPA, 1992).
The WDNR SMART program has provided the technical lead or assistance in guiding state, federal and private sediment clean up projects. State projects include:
- vegetative stabilization of 75,000 yards of sediments exposed by the draw down of the Milwaukee River at the North Avenue Dam, - remediation of 17,000 yards of mercury contaminated sediment in Starkweather Creek in Madison by dredging and disposal at a local landfill, - proposed clean up of 600,000 yards of PCB contaminated sediment in the Little Lake Butte des Morts portion of the Fox River, - rechannelization project on the Little Menomonee River.
Information gained from successful implementation of these projects will be applied to restore other polluted waterways.
6-1 1 Milwaukee Estuary RAP

CHAPTER I'- CONTAMINATED SEDIMENT MANAGEMENT STRATEGY STRATEGY IMPLEMENTATION
Strategy Implementation
The following activities are recommended to move toward meeting the sediment-related goals of the RAP. Figure 6.1 shows a general schedule for these activities. There are many parallel tasks: we I : .:d not wait until all the upstream sites are cleaned up to begin reducing other continuing sources of pollution. A proactive pollution prevention stance makes most sense now, while we are trying to figure out what reactive steps we should take. In the end, we may need to concede that sediment clean up only makes sense in certain select areas, while stressing the need to prevent fnture contamination of sediments.
Expand the household hazardous waste and waste oil/antifreeze collection programs. If even an extremely small fraction of Milwaukee area residents disposes of their household hazardous waste and waste automotive fluids improperly, the potential for surface water and sediment contamination is high. Only 1 percent of the households reportedly participated in clean sweep program in 1990 and 1991. The current program needs to he expanded to allow for increased participation.
Such an expansion needs to include a strong information and education component, such as public service announcements, to increase participation in the program. See recommendation I&E 7.
Create a partially-subsidized hazardous waste program for small businesses. Even a few small business owners improperly disposing their hazardous waste, can cause enormous localized damage to surface waters and sediments. Recent stromsewer monitoring conduceted suggests that improper disposal of hazardous waste is a concern. Providing small business owners with more affordable options for hazardous waste disposal is good insurance against future contamination of land, water and sediment in the AOC. RAP participants should explore state funding options to augment any local funds involved.
Label storm drains with warnings. This task involves stenciling storm drains with warnings similar to "dump no waste-drains to lake". This effort will result in increased public awareness about what the drains are connected to. See Recommendation I&E 5.
Complete Lincoln Creek Storm water Pollution Monitoring. As part of an urban runoff monitoring program, several stream ecosystems upstream from the AOC are being investigated. In an effort to determine the impacts of storm water discharges on pollutant levels in urban streams, the several watersheds within the Milwaukee Basin are being targeted. Sediment samples have been collected and analyzed for total PCBs, lindane, chlordane, DDT and metabolites, toxaphene, dieldrin, PAHs, oil and grease, phosphorus, and total organic carbon. In addition to sediment samples, fish tissue analysis, habitat analysis, macro invertebrate surveys, end-of-pipe I were conducted. The results of ti i, study will aid in assessing the significance of storm water and the targeted watersheds as SOUrce
Remediate Moss American Sup6 i u i . d Site. The Moss American site, located on the Little Menomonee River, has been designated as one of Wisconsin's Superfund sites. Remedial design is underway by the PRPs to reroute a channel around a PAH contaminated stream bed. The EPA is the lead agency in reviewing and approving the design; the DNR provides support. RAP implementors need to explore any options available to expedite the remediation process at this site.
monitoring, water chemistry analysis, and toxicity tests
s of contamination to the AOC.
Milwaukee Estuary RAP
CHAPTER 6: CONTAMINATED SEDIMENT MANAGEMENT STRATEGY STRATEGY IMPLEMENTATION
6) Remediate Cedar Creek Impoundments. A mass balance project, initiated by WDNR's Bureau of Water Resources, quantified PCBs in the Cedar Creek Impoundments and calculated their contribution of PCBs to the Milwaukee River. This study positively identified Cedar Creek as a major continuing source of PCB contamination to the Milwaukee River system. The Bureau of Water Resources has designated the remediation of the PCB contaminated upper Cedar Creek impoundments as a priority. Currently, negotiations are underway between the WDNR and the potentially responsible parties to specify necessary investigations and remedial actions. Remediation of the four impoundments is anticipated to begin in 1994.
The possibility of using state funds to supplement private funds should be explored by DNR to speed up the clean-up process at the three other impoundments.
7) Complete Milwaukee River PCB Mass Balance Study. A mass balance study for PCB in the Milwaukee River, from the Cedarburg to the North Avenue Dam, is underway. The goal of the project is to determine how PCB contamination in the Milwaukee River affects the AOC and plans for reaching the AOC's "desired future state". The project will quantify the present loading rate of PCBs to the system, quantify the mass transport of solids and PCBs to the Milwaukee Harbor and Estuary, establish the relationship between in-place sediments and the transport of PCBs, and predict the relationship between PCB transport and remediation of identified hot spots. Using congener specific analysis of PCBs, environmental planners will attempt to identify sources of PCB contamination.
Preliminary data from the project shows that PCB continues to migrate from the Cedar Creek site downstream to the AOC. This data, combined with a 1988 Milwaukee Metropolitan Sewerage District (MMSD) study, shows that Cedar Creek PCB is the source of PCB in the Milwaukee River until one reaches the Estabrook impoundment. At the Estabrook impoundment a different PCB "fingerprint" is found, a fingerprint which matches that of PCB found in Lincoln Creek by MMSD (MMSD, 1988).
Conduct additional sediment sampling of Lincoln Creek In 1988, Milwaukee Metropolitan Sewerage District found a site on Lincoln Creek with over 100 mg/Kg PCB. When MMSD staff went back later to pinpoint the site of contamination, nothing significantly over 10 mg/Kg PCB could be found. Further sampling of the creek bottom needs to be done. We need to know whether the site found in 1988 was an anomaly, perhaps nothing more than a burst transformer, or whether there is more to the story. DNR water column monitoring shows that PCB of the type found in 1988 is still reaching the Milwaukee River, and it is important to know where it is coming from. Such a sampling effort should begin with a review of past and present industrial land uses to identify likely sources.
Implement sediment remediation at North Avenue Dam impoundment DNR has hired an independent consulting firm, Woodward-Clyde Consultants, to develop options for retaining, or the partial/complete drawdown of the North Avenue Dam. Regardless of what option is finally recommended by the consultant, contaminated sediment behind the dam needs to be addressed.
Although DNR is the lead agency, funding from local public and private sources would speed up implementation. RAP implemcntors should assist DNR in obtaining funding for this
8)
9)
Milwaukee Estuary RAP 6-13

CHAPTER 6: CONTAMINATED SEDIMENT MANAGEMENT STRATEGY STRATEGY IMPLEMENTATION
project, if necessary. See recommendation DP 7 on page 7-44.
Identify soft sediment deposits in the Milwaukee River. To adequately characterize the extent of sediment contamination in the Milwaukee River upstream from the AOC, soft sediment deposits will be identified, This will be accomplished by physically probing soft sediment deposits, Upstream deposits will be assessed first with emphasis then progressing to downstream areas. Thiensville impoundment will he the first impoundment of concern to be assessed. See recommendation A&M IO.
DNR has already begun this task, with completion set for mid-summer, 1994.
Create a Computerized sediment geographic information system. To characterize the extent of sediment contamination in the AOC, a sediment geographic information system (GIS) will be created to track existing and newly collected sediment data. Existing chemical and physical sediment data, along with geographical locations will allow creation of maps to illustrate spatial distribution of contaminants within the AOC. Data from the studies listed in Table 8.1, along with any more recent studies will be included in the database. Historical data will be validated to the extent possible and qualified, as necessary, and all new sediment data will be placed in the data base for future use and reference. The GIS system will contain the chemical and physical sediment data along with the position, water, and sediment depth data gathered. Sediment maps will he produced, and soft sediment deposits identified. See recommendation A&M 9 on page 7-24. An important element will he the inclusion of screening-level sediment quality objectives. This computerized database will be accessible to anyone with the appropriate software.
Review existing sediment data. The GIS will be utilized to analyze existing data for contaminant trends, extent of contamination and data sufficiency and to illustrate areas requiring further investigation.
Evaluate and update existing waterquality database. In order to effectively focus limited resources, there is a need to assess the relative contribution of pollutants from each tributary. This task involve updating water quality data and calculating pollutant loadings from the three major tributaries to the AOC. Although initial estimates will he crude, additional monitoring will offer better estimates of pollutant loads in these three tributaries.
Evaluate existing urban storm water data and modeling. This task involves using existing City of Milwaukee and DNR data to calculate or estimate pollutant loads from urban storm sewers. The City of Milwaukee has submitted estimated loadings of certain pollutants to DNR as part of their storm water permit application. The result of this task will be a prioritized list of outfalls judged to be most detrimental to water and sediment quality in the AOC (i.e, contribute greatest masses of toxics). These identified outfalls can then be further targeted to reduce their pollution contribution.
Investigate air pollution as a continuing source. At a minimum, this task involves a thorough literature review and synthesis of current knowledge of air toxics. A minimum effort will produce crude estimates of the mass of each critical pollutant identified in the RAP that is contributed by atmospheric deposition. A higher level of effort will be to fund researched focused on obtaining more reliable estimates of atmospheric deposition of RAP pollutants. This higher level of effort will be pursued if the literature review shows this continuing source to he of significance.
IO)
11)
12)
13)
14)
15)
6-14 Milwaukee Estuary RAP

CHAPTER 6: CONTAMINATED SEDIMENT MANAGEMENT STRATEGY STRATEGY IMPLEMENTATION
Construct a crude mass balance of the results of #11-15 above. A comparison of the roughly estimated pollutant loads is needed. This task involves taking the results of the evaluations mentioned above, and accounting for all sources and sinks of the RAP pollutants in and around the AOC. This task will involve a comparision of estimated pollutant loadings, and will not require a computer generated model.
This result of this project will provide a "reality check" on the contaminated sediment strategy. It will allow RAP participants to identify significant sources of contaminants and reassess or refocus efforts. For example, if PAHs turn out to he as ubiquitous as it now appears they are, a reassessment and refocusing of sediment remediation efforts will be needed.
Augment City of Milwaukee storm water monitoring and control. As the sediment strategy progresses it may be necessary to evaluate outfalls that the City of Milwaukee will not be required to monitor as part of their storm water permit. RAP participation may be needed. If monitoring indicates a need for control (i.e. verifies initial estimated loads), RAP monies may be used to provide controls not required as part of the permit process. Since the permit has not been issued, it is difficult to define the scope of this task.
Monitor upstream sediment and water column at tributary confluences. Preliminary information suggests that certain tributaries to the Milwaukee, Kinnickinnic, and Menomonee Rivers may be continuing sources of pollutants to the AOC. This task would begin the process of focusing on the worst tributaries, drawing on previous work done by DNR, MMSD and others. This task is not designed to directly feed into a remediation process, but is will further define sources of contamination.
Further identify soft sediments in the riverine portions of the basin. The scope of this task relates to the results of #18, above. Small tributaries identified in task #18 to have significant toxic pollutant problems (i.e., water samples exceeding DNR standards or sediment samples over the Ontario sediment guidelines) will be poled for soft sediment.
Repeat #11-14 above for each small tributary identified as a problem. This task will identify whether the identified problem is caused hy contaminated sediment, urban runoff, or other sources.
Complete a remedial investigation/feasibility study for each site in #20 above. This task is designed to begin the long process of shutting down exiting sources in the upstream tributaries. Remedies will be aimed at correcting whatever the existing source problem may be, including remediation of contaminated sediments, installation of best management practices for urban nonpoint source control, or some other remedy impossible to foresee.
DNR will probably not be able to cover the costs of all of these investigations. Local entities will be expected to share some costs.
Secure funding for remediation of sites in #21 above
Remediate sites in #22 above.
Collect additional sediment data in the AOC. Once major continuing sources of pollutants have ceased, we can begin a stepped program of monitoring to update and supplement earlier studies. This task need not be done all at once, but instead should be performed in a number
Milwaukee Estuary RAP 6-15

CHAPTER 6: CONTAMINATED SEDIMENT MANAGEMENT STRATEGY STRATEGY IMPLEMENTATION
of logical steps, and at several levels of effort:
1) The first level of sampling should be planned using a "coarse" grid to obtain consistent core coverage in the AOC. The objective of this level of effort is to define potential "hot spot" areas.
Grid spacing on the sparse end of the studies referenced in this chapter should be used. The sediment GIS developed in task 11 should be used to generate an appropriate sampling grid. Expert advice from the TAC Sediment Workgroup will be used to plan for sampling. Cheaper tests such as a enzyme-based indicator for PCB should be explored to lower the overall cost of monitoring.
The second level of sampling should target grid elements for which first-round results exceeded sediment quality objectives. The objective for this level of effort is to confirm whether an area is indeed a hot spot, and if so, what the extent of contamination is. The quality of data collected here should be such that it can lead into a remedial investigation/feasibility study (RIff S). Given the data quality objectives, some thought should be put into selecting sites which, if highly contaminated, have the greatest potential to move toward meeting RAP goals (ie, proceed upstream to downstream).
Grid spacing will need to be determined based on the characteristics of the site. The studies referenced in this chapter may serve as a lower bound on the number of samples desired. Again, the TAC Sediment Workgroup can draw on their experience with the AOC to advise on the number of samples to be taken and sample placement.
2)
2 5 ) Complete a remedial investigation/feasibility study for each confirmed problem area in the AOC. This process will be similar to tasks 21-23, above.
26) Monitor for environmental trends. Use available monitoring tools to screen for sources and pollutants of concern. Track improvements in sediments. The RAP recommendation on page 7-22 details this project. Use semi-permeable membrane devices (SPMDs) at selected sites throughout the Milwaukee AOC to determine relative bioavailability of toxicants between stream segments. Use SPMDs to identify organic pollutants that are bioaccnmulative and bioavailable. Gas chromatography - mass spectrometry can be utilized to analyze for PCBs (congener specific), PAHs, other non-polar organic parameters at sites downstream from point inputs. In addition, the use of sediment traps is being considered to monitor environmental trends and track environmental improvements.
6-16 Milwaukee Estuary RAP

CONTAMINATED SEDIMENT MANAGEMENT STRATEGY STRATEGY IMPLEMENTATION
Figure 6.1: Contaminated Sediment Management Strategy Schedule.
Milwaukee Estuary RAP 6-17

CHAPTER 7: RAP RECOMMENDATIONS LIST OF RECOMMENDATIONS
CHAPTER 7: RAP Recommendations
Approximately 70 recommendations, listed in Table 7.2, were developed by various RAP workgroups. The 3 1 recommendations presented in this chapter represent projects to be targeted for implementation in the next few years. The status of these recommendations and their relation to ongoing programs is illustrated in Appendix E. As these projects are completed and programs are set in place, we will learn more about what it will take to restore and maintain the Milwaukee Estuary AOC. Subsequent recommendations will be developed to address these newly identified needs. The RAP Implementation Committee (RIC), described on page 8-1, will work to coordinate and unify all restoration efforts.
The recommendations are grouped according to activity type: Assessment and Monitoring (A&M), Demonstration Project (DP), Information and Education (I &E), and Regulations (R). Many of them are implementable in a 2 to 3 year period.
This chapter consists of the following sections:
Summary of Recommendations Recommendation Development by Work Groups Assessment and Monitoring (A&M) Recommendations Demonstration Project (DP) Recommendations Information and Education (I&E) Recommendations Regulatory (R) Recommendations
Milwaukee Estuary RAP 7- 1

Table 7.1: Summary of RAP Recommendations.
Recommendation Leaders Estimated Cost $
A&M 1: Water Quality Monitoring* WDNR; MMSD. 14,560
A&M 2: Phytoplanktou/Zooplankton MMSD; WDNR. 50,000- 100,000 Degradation Assessment* A&M 3: Macroinvertebrate Populations Analysis* A&M 4: Conduct Fish Community Evaluations* A&M 5: Conduct Fish Health Assessment* A&M 6 : Assess Fish Tissue Contamination A&M 7: Protect Wildlife from CDF Contaminants*
WDNR 11,700
WDNR 65,000
WDNR 20,000
WDNR 1 1,500a ACOE; WDNR. TBD
A&M 8: Monitor Bioaccumulative Toxicants* A&M 9: Develop a Sediment GIS* A&M 10: Identifv Soft Sediment Deposits*
10,500 (for trend monitoring only)
+l,050/sample (for site
WDNR 3,780"
WDNR 82,000 WDNR 20.000-40.000
A&M 11: Bulk Chemical and Physical Analysis of Identified/Suspected Sediment Deposits and Sediment Traps
WDNR
Milwaukee County; City of Milwaukee; nonprofit conservation organizations; river front business and industry.
A&M 12: Test Sediment Toxicity*
DP 1: Establish Permanent Household Hazardous Waste Collection Facility*
DP 2: Control Runoff from Bulk Storage Piles* DP 3: Create Vegetative Buffer Zones* (Cost reflects preliminary assessment, and not restoration activities) DP 4: Streambank Restoration
DP 5: Aerate a Section of the Menomonee
1, I I II
characterizationb)
WDNR SMART Team 1,60OSd
City/Cty Govt.; MMSD; ICC.
WDNR; City of 50,000 Milwaukee. MRRCF; Milwaukee 25,000+" County; City of Milwaukee; WDNR. MRRCF; Milwaukee 30,000 County; City of Milwaukee; WDNR.
640,000 + 300,000/yr
MMSD: Citv of 450,000 600,000 +
7-2
River*
Milwaukee Estuary RAP
Milwaukee; WDNR. 50,000 - 100,000/yr DP 6: Riverway Public Access Trail* WDNR; MRRCF;

CHAPTER 7: RAP RECOMMENDATIONS LIST OF RECOMMENDATIONS
Recommendation
DP 7: Restore Milwaukee River per North Avenue Dam Feasibility Study Recommendations
I&E 1: Household Pollution Prevention Education Program* I&E 2: Install Environmental Awareness Signs*F
I&E 3: Community Awareness Program*
I&E 4: Provide Pollution Prevention Technical Assistance
Table 7.1: Summary of RAP Recommendations.
Leaders Estimated Cost $
WDNR; City of 5,723,000 Milwaukee; Milwaukee County; Village of Shorewood; MMSD; private landowners LMF; MMSD. 300,000
Milwaukee Zoological Complete Society; UWEX, WDNR. LMF; WDNR HEC. 59,620 City of Milwaukee GMTMTF; UWEX 30,000; +100,000 Technical Assistance 250,000/yr
Education Program I&E 7: Vehicle Waste Oil and Antifreeze Disposal* I&E 8: RAP Column for Industry
Guard. GMTMTF; KGMB; Incomplete WDNR. RAP TAC: RIC.
Newsletters
I&E 9: Increase Awareness of Fish WDNR; UWEX; DHSS. 3,200 - 5,725 Consumption Advisory
I&E 10: WAVE (Water Action VoluntEers)
I&E 11: Continue Testing the Waters Program*
I&E 12: Water Quality Information Line
R1: Advance Implementation of Federal Storm water Regulations/Expand Municipal Permit Program
WDNR statewide adopt- 15,000 a-stream program; KGMB; LMF. Riveredge Nature 4,920/schooI Center; Schlitz Audubon Center; MMSD; WDNR. UWEX; WDNR 1,965/yr or
WDNR; City of 2.5 million Milwaukee; Local Municipalities
65/yr + $9/hr
Milwaukee Estuary RAP 7-3

CHAPTER 7: RAP RECOMMENDATIONS RECOMMENDATION DEVELOPMENT BY WORK GROUPS
Recommendation Development bv Work Groups
Five sub-committees of the Technical Advisory and Citizen's Advisory Committees formed as work groups, described below, to develop actions to restore beneficial uses in the Milwaukee Estuary. The recommendations included in this chapter were developed from these actions, which were evaluated
and prioritizcd for selection. Careful consideration was given to ensure that the most significant causes and sources of impaired beneficial waterway uses were addressed. Further recommended actions will be developed as more projects are implemented and more is understood about the most efficient and lasting ways to restore the Milwaukee Estuary. Table 7.2 lists recommendations that will be developed as RAP implementation progresses.
The Water Quality Work Group and the Contam inated Sed iment Work Group worked together to involve representatives from local environmental organizations, state and local agencies, universities and consulting firms. The work group members analyzed the causes and sources of water quality impairments in the AOC and developed a course of action to assess and remedy the problems associated with contaminated sediments.
The Fish. Wildlife and Habitat Work Group included biologists and ecologists from area universities, agency representatives and concerned members of local environmental organizations and fishing groups. Recommendations developed by this group were aimed at restoring habitat for fish and wildlife populations in the AOC. The group focused on site- specific restoration of physical habitat and land as well as resource management policies for fish and wildlife.
The Community Partnership Work Group consisted of local business, community and government representatives. Estuary. Recommendations came from the evaluation of potential actions that business and industry could undertake in cooperation with local governments to restore the Milwaukee Estuary.
The group reviewed existing plans to remediate the Milwaukee
The River Aonreciation Work Group consisted of environmental educators and representatives from civic and environmental organizations, This group produced recommendations aimed at public education and community involvement to prevent pollution.
7-4 Milwaukee Estuary RAP

CHAPTER 7: RAP RECOMMENDATIONS RECOMMENDATION DEVELOPMENT BY WORK GROUPS
Control/Reduce Lawn Chemical Usage
Accelerate Effective Implementation of Wastewater Discharge Limits
Table 7.2:
COMMUNlTY PARTNERSHIP
Waterfront Recycling/Trash Containment
Development of Dam and Impoundment Management Plan
Recommendations that will be Developed as RAP Implementation Progresses
I
Promote Responsible Lawn Care Practices
Develop Permits for Non-regulated Significant Discharges
Imnrovc Spill Containment and Prevention
Expand Waterfront Public Transportation
AOC Vacant Land Inventory and Environmental Assessment
Maintain Genetic Integrity of Fishery
RNER APPRECIATION
Exhibits
Guidance for Future Filling of Protected Waters
Improve Juneau Park Lagoon Water Quality
Public Access and Education Partnership with Industry
Establish a Waterfront-Development Policy
I
Call-in Complaint Procedures - Hazardous Materials
WATER QUALlTY & SEDIMENT
Accelerate Implementation of Priority Watershed Plans
Develop Best Management Practice Education Programs
Volunteer Clean-up Events
Focus on Lake Michigan
Great Lakes In My World: A K-12 Cumculum
Student Pollution Prevention Engineering Award
RAP Award Program
Water Quality Enforcement
Implement Clean Air Act Amendments
Reduce Emissions from Incineration
Monitor Combined Sewer Overflows
Review Permit Activities
Guidance Document for Riparian Land Use
Conduct Public Officials Tour
Create A River Awareness Week
Create a Video Resource Center
Milwaukee Estuary RAP 7-5

CHAPTER 7: RAP RECOMMENDATIONS ASSESSMENT AND MONITORING RECOMMENDATIONS
Assessment and Monitoring Recommendations
The following recommendations involve assessment and monitoring. Adequate monitoring will enable us to make informed, cost- and resource-effective decisions during remediation. By measuring water quality before, during and after RAP work, we can quantify our progress. Monitoring trends in the environment will continue through implementation.
Item
A&M 1: Water Qual i ty o to ng *
Estimated Cost Funding
Conduct water column monitoring to identify loadings of critical pollutants, quantify water quality variables known to influence the bioavailability or toxicity of pollutants, and detect loadings of compounds that other monitoring efforts have identified as causes for concern.
Rationale Benefits Identify relative amount of critical pollutants in the AOC. Quantify water quality variables known to influence bioavailability or toxicity of pollutants. Provide information for long-term trend analysis.
Use Impairments Addressed Restore Fish & Wildlife Consumption Fish tumors or other deformities Eutrophication or undesirable algae Degradation of benthos Restrictions on drinking water consumption
-
Sample Collection
Lab Analysis
Conventionals/nutrients: (16 samples x $300/sample)
Metals/critical pollutants: (8 samples x $1,100/sample)
Cost and Funding
$960/year Options: - GLNPO
$13,60O/year - RAP funding
Implementation Leader(s) WDNR; MMSD
7-6 Milwaukee Estuary RAP

CHAPTER 7: RAP RECOMMENDATIONS ASSESSMENT AND MONITORING RECOMMENDATIONS
Short-term Stem 1) 2)
3)
Compile all existing water quality data for the Milwaukee River Basin. Select sites for water quality monitoring to coordinate with other monitoring efforts (sediment, macroinvertebrate studies). Monitor the following aspects of water quality. a) Water quality variables; measure at 4 sites, 4 times a year:
- Dissolved oxygen - Suspended solids
- chlorophyll a - Alkalinity - Hardness
- Chlorides
Nutrients (sample with water quality variables, above)
- Total Suspended Solids - Total Organic Carbon / Dissolved Oxygen - Fecal coliform
- pH - BOD,
b) Total Phosphorus Soluble Phosphorus (ortho) Nitrogen (TKN, NH,, Nitrite, Nitrate) Soluble Silica
c) Water column metals (low level technique, total recoverable); measure at 4 sites, 2 times a year: Cd Cr and cu Zn Pb Ni AS Cn Se Ag
d) Critical pollutants PCBs and PAHs; measure at 4 sites, 2 times a year.
5 ) Coordinate sample collection with Milwaukee Metropolitan Sewerage District's (MMSD) water quality program in order to accomplish the following: a) Find the most cost-effective means of data collection. b) Establish sample collection and processing QA/QC protocol
between the WDNR and MMSD to maximize data compatibility (e.g., filter pore size). Fund collection and analysis of critical pollutants at selected stations currently being sampled by MMSD.
b)
Long-term Stem 6) 7)
Execute monitoring plan (Step 3) annually. Evaluate water quality monitoring program and modify, when appropriate, toward continuous improvement.
Milwaukee Estuary RAP 7-7

CHAPTER 7: RAP RECOMMENDATIONS ASSESSMENT AND MONITORING RECOMMENDATIONS
Progress* Step 1) Complete. Step 2) In progress: preliminary site selection complete. Step 3) Pending funding.
Related Existing Activities
See the WDNR Water Resources Management Programs on page 5-16.
5-19. - See the MMSD Surface Water Quality Monitoring Program on page
7-8 Milwaukee Estuary RAP

CHAPTER 7: RAP RECOMMENDATIONS ASSESSMENT AND MONITORING RECOMMENDATIONS
Items Estimated Cost
A&M 2: Phytoplankton/Zooplankton Degradati ‘on Assessment*
Funding
Contract with MMSD to complete phytoplankton and zooplankton sample identification and data analysis. This work will reveal the degree to which phytoplankton and zooplankton populations are degraded, signifying an impaired beneficial use of the waterway.
To date, the degradation of the phytoplankton and zooplankton population use impairment has not been adequately defined. A thorough understanding of this base of the aquatic food chain is vital to effectively managing our water resources.
MMSD has collected plankton samples from the outer harbor and near shore Lake Michigan from April through October each year since 1980. Due to budget constraints, there is a backlog of samples waiting to be processed. MMSD has existing staff experienced in plankton identification and data analysis. With funding, such work can continue.
Contract with MMSD to analyze plankton samples
$50,000 - $100,000
Rationale Benefits Provide information to establish baseline conditions of plankton and better define this impaired beneficial use. Provide more than ten years of data to facilitate AOC trend monitoring. Provide valuable information about plankton dynamics in the AOC and pollution sources. Unify efforts toward this assessment to most efficiently use funding.
Impaired Uses Addressed Degradation of phytoplankton and zooplankton populations Eutrophication or undesirable algae
Options: - RAP funding - Great Lakes funding
Cost and Funding
Implementation Leader(s) MMSD; WDNR
Short-term Stem 1) Quantify the number of backlogged samples at MMSD that need
Milwaukee Estuary RAP 7-9

CHAPTER 7: RAP RECOMMENDATIONS ASSESSMENT AND MONITORING RECOMMENDATIONS
analysis. Contract with MMSD to analyze backlog of samples as well as new samples on an on-going basis. Determine where data gaps exist in MMSD data to assess plankton degradation.
2)
3)
Long-term Steps 4) 5)
Fill data gaps by collecting necessary data. Assess the degradation of phytoplankton and zooplankton in the AOC, according to impaired use criteria.
Progress' Step 1) Complete.
Related Existing Activities
See WDNR Water Resources Management Programs on page 5-16 See MMSD's Surface Water Quality Monitoring Program on page 5-19.
7-10 Milwaukee Estuary RAP

CHAPTER 7: RAP RECOMMENDATIONS ASSESSMENT AND MONITORING RECOMMENDATIONS
Items Estimated Cost
A&M 3: Macroinvertebrate Populations Analysis
Funding
Assess benthic macroinvertebrate populations throughout the AOC during Basin assessment year. More specifically, evaluate benthic invertebrate community population structure and biomass. Delist "degradation of benthos" as a Milwaukee Estuary AOC use impairment when the benthic macroinvertebrate community structure does not significantly differ from unaffected control sites of comparable physical and chemical characteristics.
Rationale Benefits Identify long term changes in water and sediment quality. Provide criteria for delisting the AOC use impairment "degradation of benthos."
Imoaired Uses Addressed Degradation of benthos
Sample collection by $2400/week two people
Sample processing and identification $300/sample)
$7500 (25 samples @
Cost and Funding
Options: - EPA funding - RAP funding
TOTAL $11,700
Implementation Leader(s) WDNR, MMSD (for analysis of macro invertebrate communities)
Short-term Stem 1) Obtain funding. 2) Identify sampling locations. 3) Collect benthic grab samples, and deploy Hester-Dendy artificial
substrate samplers. 4) Process samples, key invertebrates to the species level.
Long-term Stem 5) Track long term trends. 6) Relate results to areawide macro invertebrate assessment performed as
part of MMSD Summary Data File Environmental Assessment, Volume 1-B. Compare sample compositions to reference site(s) or control site(s) 7)
Milwaukee Estuary RAP 7-1 1

CHAPTER 7: RAP RECOMMENDATIONS ASSESSMENT AND MONITORING RECOMMENDATIONS
conditions for delisting purposes.
Progress* Step 1 ) In progress.
Related Existing - See Chapter 6, Contaminated Sediment Management Strategy Activities
7-12 Milwaukee Estuary RAP

CHAPTER 7: RAP RECOMMENDATIONS ASSESSMENT AND MONITORING RECOMMENDATIONS
Items
A&M 4: Conduct Fish Community Evaluations"
Estimated Cost Funding
Evaluate fish community structure to identify any degradation due to contamination. Monitor species occurrence and relative abundance over time to assess the cumulative effects of factors such as habitat, and water quality conditions on fish communities.
This monitoring involves conducting an evaluation of the fish community during the Basin assessment year, with follow-up sampling in intermittent years. Two to six stations will be sampled throughout the AOC. Stations should represent important or major habitat types within the AOC. An additional objective of this monitoring effort is to initiate the development of an index of biotic integrity (IBI).
Fish Community Monitoring
Rationale Benefits Provide information to assess the number and type of fish species. Better quantify impaired fish community. Provide long-term trend monitoring data. Assess habitat improvement initiatives as they relate to fish populations. Provide information to assess the overall effect of improvements in habitat, water and sediment quality.
$65,000 Options: - EPA special project funding - Great Lakes funding
Impaired Uses Addressed Degradation of fish and wildlife populations.
Cost and Funding
Implementation Leader(s) WDNR.
Short-term Steps 1) 2) Design monitoring protocol. 3)
Obtain funding for one staff position.
Measure the following community variables of the collected fish Number of species collected Number of individuals collected (catch per unit effort)
Milwaukee Estuary RAP 7-13

CHAPTER 7: RAP RECOMMENDATIONS ASSESSMENT AND MONITORING RECOMMENDATIONS
Long-Tern Steps 4)
5 ) 6)
7) 8)
Determine community richness, diversity, and evenness from collected information, Conduct follow-up sampling in intermittent years as needed. Assess effectiveness of methods used and make necessary modifications. Continue monitoring to determine long-term fish community trends. Delist use impairments according to delisting criteria when warranted. See IJC Delisting Criteria on page 9-10.
Progress* Step 1) Step 2) In progress.
Funding request submitted to the EPA
Related Existing Activities commercial fish.
Ongoing Fisheries management monitoring of important sport &
Fish tissue contaminant monitoring on sport fish. Fish health assessment, A&M 5 .
7-14 Milwaukee Estuary RAP

CHAPTER 7: RAP RECOMMENDATIONS ASSESSMENT AND MONITORING RECOMMENDATIONS
Cost and Funding
A&M 5: Conduct Fish Health Assessment*
Items Estimated Cost Funding
SHORT TERM
Basin year fish health $20,000/yr Options: survey - EPA (GLNPO)
- WDNR Great Lakes funding - Fisheries Management RAP Funding
TOTAL $20,000
Conduct fish health assessments (FHAs) on selected species each Basin assessment year.
Rationale Benefits - Provide information where none currently exists on the general health
status of resident AOC fish to more precisely quantify use impairments. Provide insight to the causes of fish kills and poor fish health. Provide long-term trend monitoring data.
- -
Impaired Uses Addressed Degradation of fish and wildlife populations. Fish tumors or other deformities. -
Implementation Leader(s) WDNR - Fisheries Management
Short-term Steps 1) 2)
3)
4)
Develop project proposal for field staff time. Select representative species and reference sites for fish community evaluation. Catch fish for FHA; coordinate with fish tissue collections for contaminant analysis on page 7-17. Perform FHA on 30 individuals per species within the AOC as well as 30 individuals per species collected at reference sites. Measure the following:
General Variables Length; Width; Age; Sex; External and internal rating of gross visual characteristics of skin, fin, gill, operculum, pseudobranch, thymus, eye, body cavity, visceral fat, liver, spleen, gall bladder, kidney, stomach,
Milwaukee Estuary RAP 7-15

CHAPTER 7: RAP RECOMMENDATIONS ASSESSMENT AND MONITORING RECOMMENDATIONS
intestine, etc.; liver somatic index (% liver vs total visceral weight).
Blood Variables Hematocrit; Leucocrit; Serum protein.
Fish Histopathology Take tissue samples for histopathological examinations of any visually observable liver and skin lesions. Prepare slides and send to a registered histopathologist for examination.
Excise livers from a random subsample of individuals and prepare for histopathology analysis.
Analyze whole body or organs for contaminants. Coordinate with fish collection item (A&M 6) .
5 )
6)
Long-term Steps 7) If a significant incidence of tumors is noted, propose additional
surveys or studies to specifically address presence and extent of tumors. Evaluate first round of FHA and modify protocol if needed for best results. Continue long-term trend FHA and delist impaired beneficial waterway uses when appropriate. See IJC Delisting Critena on page 9-10,
8)
9)
Progress* Step 1) In progress. Step 2) In progress. Step 3) In progress.
Related Existing Activities needed basis.
DNRs fish kill investigations, which are currently performed on an as
Fish tissue contamination assessment (A&M 6).
7-16 Milwaukee Estuary RAP

CHAPTER 7: RAP RECOMMENDATIONS ASSESSMENT AND MONITORING RECOMMENDATIONS
A&M 6: A n i n ' n
Conduct an intensive fish contaminant assessment every 5 years, following the state's Basin Assessment Schedule. Coordinate this effort with health and community structure assessments. This effort will also compliment the WDNR's fish contaminant program to ensure the full utilization of limited monitoring monies.
In addition to analyzing fish tissue for contaminants, WDNR is considering expanding its monitoring to include caged fish studies. Although this analysis tool has not been incorporated into statewide monitoring plans, it is being currently reviewed by WDNR staff. Data collected from caged fish studies can be utilized to support both basin assessment (trend monitoring) and special project monitoring. This additional tool will help environmental planners track environmental trends, identify the geographical distribution of contaminants, and screen the basin for possible pollutant sources or emerging problems.
Caged fish studies will be included in routine assessment monitoring and special projects where feasible and reasonable.
Rationale Benefits Track and evaluate contaminant trends in the ecosystem. Evaluate the effectiveness of environmental programs. Track progress toward delisting "Restrictions on Fish Consumption" as an impaired beneficial waterway use. Evaluate short-term bioaccumulation potentials.
Use Impairments Addressed Restrictions on fish consumption
Milwaukee Estuary RAP 7-17

CHAPTER 7: RAP RECOMMENDATIONS ASSESSMENT AND MONITORING RECOMMENDATIONS
Items Estimated Cost Cost and Funding Funding
Sample collection
Sample collection ----I-- Sample analysis $2,500' (minimum of 2 sites 2 sites @ $1,25O/sample)
Caged fish analysis (minimum of 5 sites; 5 sites @ $1,25O/sample)
$6,250
Sample analysis $2,500 (minimum of 2 sites; 2 sites I @ $1.250/sample)
Options: - Great Lakes funding - RAP funding - EPA (GLNPO) - DNR Fisheries Management
RAP Funds - Basin Assessment Monitoring
Options: - Great Lakes funding - RAP funding - EPA (GLNPO) - DNR Fisheries Management RAP Funds - Basin Assessment Monitoring
TOTAL I $11,250 OTE: . These estimates represent a minimum number of samples. More
samples would he beneficial.
Implementation Leader(s) WDNR.
Short Term 1) 2)
3) Analyze these fish parameters:
Coordinate with the health assessment, described on page 7-15. Conduct contaminant analysis at 2 locations: riverine site and harbor site.
Fish of each resident species (i.e. small mouth bass and northern pike). Age class I+ and IV+ ( or oldest class present in significant numbers) . Whole fish for each species and fillets for sport fish species.
4) Analyze fish for the following contaminants: Hg, PCBs, DDT, chlordane, dieldrin, PAHs and lipid content.
7-18 Milwaukee Estuary RAP

CHAPTER 7: RAP RECOMMENDATIONS ASSESSMENT AND MONITORING RECOMMENDATIONS
Long Term 5 ) Conduct contaminant analysis at two locations: riverine site and harbor
site 6) Analyze fish for these parameters:
Age class I+ - Forage and sport fish species
Whole fish for each species and fillets for sport fish species - 7) 8)
Continue Analysis for the contaminants listed in Step 4. Conduct caged fish surveys at a minimum of 5 sites within the basin. Analyze for the contaminants listed in Step 4.
Progress Incorporation into statewide basin assessment monitoring is being considered
Related Existing Activities
Proposed Fish Community Structure on page 7-13. Proposed Fish Health Assessment on page 7-15. Proposed Recommendation to Increase Awareness of Fish Consumption Advisories on page 7-62. See WDNR Water Resources Management Programs on page 5-16.
Milwaukee Estuary RAP 7-19

CHAPTER 7: RAP RECOMMENDATIONS ASSESSMENT AND MONITORING RECOMMENDATIONS
Items Estimated Cost
A&M 7: Protect Wildlife from CDF Contaminants"
Funding
Determine routes of contaminant transport in dredged material from the confined disposal facility C D F on Milwaukee's lakefront and recommend ways to limit wildlife contact with these
contaminants.
Study CDF To be determined contaminant
The CDF may pose an unnecessary threat to wildlife by creating a deceivingly attractive site in an othcnvise uninhabitable area. The lakefront CDF is a one-celled structure that will not be capped until it reaches full capacity, near the end of this century. The dredged material quickly vegetates when placed in the CDF, but wildlife still have access to the contaminated sediments.
The threat to wildlife has been observed at other CDFs. For example, waterfowl, shrews, and voles using the CDF in Thunder Bay, Canada accumulated appreciable concentrations of PCBs after relatively short exposure periods of one to three months (Dobos, et al, 1991)
Options: - ACOE
Rationale Benefits Reduce wildlife accumulation of toxic substances from contaminated dredge materials. Provide information to better manage the CDF and minimize wildlife exposure to contaminants.
Limit wildlife access to CDF
Cost and Funding
- RAP funding - Great Lakes funding To be determined
Impaired Uses Addressed Degradation of fish and wildlife populations Restrictions on fish and wildlife consumptions Fish tumors or other deformities Bird or animal deformities or reproduction problems
I I
Implementation Leader(s) ACOE; WDNR
Short-term Stem 1)
2)
Design and conduct contaminant transport study at CDF using physical, chemical, and biological methods. Design methods to minimize/eliminate wildlife access to CDF
7-20 Milwaukee Estuary RAP

CHAPTER 7: RAP RECOMMENDATIONS ASSESSMENT AND MONITORING RECOMMENDATIONS
contaminants. 3) Implement Step 2
Long-term Steps 4)
5 )
Progress* Step 1)
Evaluate ACOE plans for CDF closure and expansion with regards to how they will affect plans to limit CDF threats to wildlife. Develop recommendations based on study.
ACOE is designing contaminant transport study.
Related Existing Activities
Study at Thunder Bay, Canada (Dobos, et al., 1992).
Milwaukee Estuary RAP 7-2 1

CHAPTER 7: RAP RECOMMENDATIONS ASSESSMENT AND MONITORING RECOMMENDATIONS
Items
A&M 8: Monitor Bioaccumulative Toxicants*
Estimated Cost Funding
Screen AOC and upstream river segments with semipermeable membrane devices (SPMDs) to monitor trends and availability of bioaccumulative toxicants. The data from this monitoring will help identify possible sources (i.e. tributaries, in-place pollutants) of toxicants. Perform this monitoring every 5 years, following the Milwaukee River Basin assessment schedule. More frequent monitoring may be required for specific projects.
Rationale Benefits Determine the relative bio-availability of toxicants between stream segments. Locate potential toxic sediment deposits. Monitor long term trends in contamination. Identify potential sources (secondary tributaries, in-place sediment deposits, point sources) of pollution and evaluate their relative importance.
Impaired Uses Addressed Restrictions on fish and waterfowl consumption Restrictions on dredging activities Degradation of benthos Degradation of fish populations Degradation of phytoplankton and zooplankton populations
Sample collection $480
QA/QC
Lab analysis (5 sites x $550/sample)
TOTAL
$550 Options:
$2,750 funding - Great Lakes
- USEPAGLNPO
$3,780
Implementation Leader(s) WDNR
Short-term Steps 1) Obtain funding. 2) 3) Expose and collect samples. 4) Analyze samples for the following toxicants: PCBs, total and
Select sites / locations for SPMDs (minimum of 5 sites).
congener specific; PAHs; dioxin; DDT; chlordane, toxaphene; dieldrin.
7-22 Milwaukee Estuary RAP

CHAPTER 7: RAP RECOMMENDATIONS ASSESSMENT AND MONITORING RECOMMENDATIONS
Long-term Stem 5) Evaluate sample results to study contaminant trends, both spacial and
temporal
Progress* Step 1) In progress.
Related Existing Activities 5-19.
See the Lincoln Creek Storm water and Flood Control Study on page
Milwaukee Estuary RAP 7-23

CHAPTER 7: RAP RECOMMENDATIONS ASSESSMENT AND MONITORING RECOMMENDATIONS
Items
A&M 9: Develop a Sediment GIS*
Estimated Cost Funding
Develop a data base to track historical data, as well as data generated from current and future sediment assessment projects. The data base will be used to develop sediment contour maps of the system and analyze data to determine significant depositional areas on which to focus future efforts.
Rationale Benefits
..
Display sediment data for use by decision makers and environmental planners. Utilize system as a tool to analyze existing sediment data and data generated by historic and current environmental assessment projects like the Milwaukee River Mass Balance study on page 6-13.
Purchase Hardware/Software*
Impaired Uses Addressed Restrictions of fish and wildlife consumption Restrictions on dredging activities Loss of fish habitat
20,000 WDNR
Expand GIS to include upstream studies and pollutant source information
55,000 WDNR, MMSD
I I
Continually update system
Develop system and data 7,000 WDNR entry
to be determined WDNR
For statewide use
Implementation Leader(s) WDNR.
Short-term Steps 1) Purchase computers and software. 2) Develop system 3) Enter data from several major studies into system. (See Chapter 6 for
7-24 Milwaukee Estuary RAP

CHAPTER 7: RAP RECOMMENDATIONS ASSESSMENT AND MONITORING RECOMMENDATIONS
details). Utilize data management system to analyze information to date, and identify data deficiencies.
4)
Long-term Stem 5 ) 6 ) Include several upstream studies including: Cedar Creek and
7) 8)
9)
Expand GIS beyond AOC boundary.
Milwaukee River projects, Urban Tributary monitoring results. Include pollutant source data, such as stormsewer monitoring data. Continually update system with new information from ongoing programs and assessment projects. Utilize system to assist advisory groups in furthering sediment related remedial decisions.
Progress* Step 1) Complete. Step 2) Complete. Step 3) Near completion.
Related Existing Activities
Milwaukee Estuary RAP 7-25

CHAPTER 7: RAP RECOMMENDATIONS ASSESSMENT AND MONITORING RECOMMENDATIONS
Items
A&M 10: Identify Soft Sediment Deposits"
Estimated Cost Funding
Sediment depth data collection: labor, equipment
SHORT TERM I! $20,000 - $40,000 - Section 22 Planning
Assistance Grants - Great Lakes funding
Analyze maps to identify possible contaminated sites , TOTAL
I Sediment deposit map see page 7-24 development I
Part of sediment GIS
See A&M 9
$20,000-40,000
Implementation Leader(s) WDNR
Short-term Steps 1) Obtain funding. 2) Collect field data to identify sediment depth and physical
characteristics data using survey techniques or electronic devices, Begin at upstream priority sites. Develop GIS capabilities to utilize data. 3)
7-26 Milwaukee Estuary RAP

CHAPTER 7: RAP RECOMMENDATIONS ASSESSMENT AND MONITORING RECOMMENDATIONS
4)
Long-term Stem 5)
Use location and sediment depth data to generate GIS maps.
Analyze sediment contour maps to identify and prioritize significant deposits to be further characterized.
Progress* Step 1) In progress Step 2) Near completion. WDNR initiated this study on the
Thiensville impoundment, an impoundment of the Milwaukee River near Thiensville. Deposit identification will be completed in 1994.
Step 3) Near completion. Step 4) In progress.
Related Existing - See recommendation to Develop Sediment GIS on page 7-24 Activities See Milwaukee River Mass Balance on page 6-13.
Milwaukee Estuary RAP 7-27

CHAPTER 7: RAP RECOMMENDATIONS ASSESSMENT AND MONITORING RECOMMENDATIONS
A&M 11: Ruik Chemical and Phvsical Analvsis of Identified/Suspected Sediment Deposits and Sediment Traps (for Trend Analysis)*
Items
Perform a bulk chemical analysis on identified or suspected sediment deposits to determine the extent of contamination. In addition, analyze sediment traps for pollutants of concern every three years as part of a long term trend monitoring program for AOCs state wide. Identify representative dcpositional zones in order to continually evaluate changes in sediment quality resulting from downstrcain transport and to prioritize steps for possible sediment remediation. This represents a reconnaissance-level effort. Once potential remediation site has been identified, intensive monitoring
Estimated Cost Funding
will be conductcd.
Rationale
Samule collection I _-
Cost and Funding
- WDNR
Benefits Characterizs the extent of contamination in identified sediment
Analyze sediment traps (5 sites x $1,05O/sample)
Sample analysis for suspected deposits*
deposits. Monitor long term trends in environmental conditions.
Imuaired Uses Addressed Restrictions on fish and waterfowl consumption Loss of fish habitat Restrictions on dredging activities
$5,250 Options: - Great Lakes funding
$1,05O/sample
Sample analysis - Long term trend analysis (5 sites x $l,050/sample)
$5,250
LONG TERM
Options: - EPA(GLNPO)
$10,500 (for trend monitoring only)
+$1,050/sample (for
Total
The numb&-of samples nee ed for special projects and site characterization will vary.
7-28 Milwaukee Estuary RAP

CHAPTER 7: RAP RECOMMENDATIONS ASSESSMENT AND MONITORING RECOMMENDATIONS
Implementation Leader(s) WDNR.
Short-term Stem 1) Obtain funding.
2) 3)
4)
Trend Monitoring Identify 5 sites (minimum) to deploy sediment traps. Analyze traps for pollutants of concern. Analysis of Susoected Deposits Identify contaminated sediment deposits to be characterized. Thiensville impoundment has been identified as the next deposit to be investigated. Results from this investigation will determine next area of focus.
5 ) Designate sampling locations. 6 ) Collect samples. 7) Analyze samples for pollutants of concern. Samples collected from
the Thiensville impoundment will be analyzed for PCBs.
Long-term Stem 8) Combine chemical data with biological data and sediment depth to
determine extent of contamination and prioritize sites for further analysis and remediation. Develop and utilize GIS to track and display information. 9 )
Progress* Step 1) In progress. Step 4) Step 5 ) Step 6) Step 7) Step 9) In progress.
In progress (for Thiensville impoundment). In progress (for Thiensville impoundment). In progress (for Thiensville impoundment). In progress (for Thiensville impoundment).
Related Existing Activities
See Chapter 6, Contaminated Sediment Management Strategy.
Milwaukee Estuary RAP 7-29

CHAPTER 7: RAP RECOMMENDATIONS ASSESSMENT AND MONITORING RECOMMENDATIONS
Cost and Funding
A&M 12: Test Sediment Toxicitv*
Items Estimated Cost Funding
SHORT TERM
Sample collection & $1,600 Options: analysis (@2 sites) - RAP funding
- Great Lakes funding
TOTAL $1,600
Conduct sediment toxicity assessments every 3-4 years to detect the effects of the complex interactions bctwccn chemicals in the environment and to monitor long term trends in the environment. Sediment toxicity tests arc an important assessment component because they provide direct measures of biological effects on test organisms. Site specific, or near term monitoring will he conducted to evaluate identified sediment deposits.
Rationale Benefits Allow optimal use of resources in further sampling and analysis to determine sediment hot spots. Provide the most cost effective and accurate collection of useful data.
Impaired Uses Addressed Degradation of fish populations Degradation of benthos Degradation of phytoplankton and zooplankton populations
Implementation Leader(s) WDNR Water Resources Management Bureau.
Short-term Steps I ) Obtain funding.
Long-term Trend Monitoring 2) Collect samples. 3) Conduct toxicity tests to identify these conditions: chronic exposure
with Chironomus tentans or acute exposure of Hyalella mteca. Endpoints to be evaluated include survival for bath species and in addition, biomass production and mentum deformity for C. tentans. Analyze results and integrate data with other measurements (i.e, chemical analysis).
4)
7-30 Milwaukee Estuary RAP

CHAPTER 7: RAP RECOMMENDATIONS ASSESSMENT AND MONITORING RECOMMENDATIONS
Lone-term Stem
Site-Specific Monitoring Will be determined as contaminated deposits are identified
Progress* Step 1) In progress
Milwaukee Estuary RAP 7-3 1

CHAPTER 7: RAP RECOMMENDATIONS DEMONSTRATION PROJECT RECOMMENDATIONS
Item
Demonstration Project Recommendations
Estimated Cost Funding
DP 1: Establish Permanent Household Hazardous Waste Co llection Facility*
Facility feasibility study
Provide a permanent facility, or facilities, for residents of Milwaukee and Waukesha counties and the village of Germantown to dispose of hazardous household wastes and recyclables.
$40,000 Funded by: - ICC Communities - RAP funding - MMSD
Rationale Benefits Decrease the release of toxic substances to sanitary and storm sewers, which ultimately find their way to surface and ground water. Allow residents to dispose of waste throughout the year. Increase awareness of alternative products with effective educational programs. Create jobs Cor construction and operation of the facility, as well as disposal and recycling of collected materials. Provides a way for communities to share the cost of hazardous household waste disposal.
RAP Goals and Obiectives Addressed (see Chauter 4) 2E
~
Design/siting contractor
Construction
Cost and Funding
$100,000 Options - RAP funding - ICC Communities
$500,000
Implementation
7-32
Operating costs $300,000/yr Options - ICC Communities
Leader(s) City and County governments; MMSD in cooperation with ICC
Short-term Stem
Milwaukee Estuary RAP

CHAPTER 7: RAP RECOMMENDATIONS DEMONSTRATION PROJECT RECOMMENDATIONS
1)
2)
Area communities develop commitment for a regional permanent facility(ies) through the ICC. HDR Engineering, Chicago, is conducting a feasibility study to determine requirements for site(s):
Collection alternatives Siting criteria
Facility administration Cost and funding sources
- Facility operation
3)
4) 5) 6 ) Construct facility(ies). 7) Refine ongoing education program.
Long-term Stem 8)
Communities develop proposals for incorporation into 1994-95 budgets. Hire contractors to design the facility. Obtain funds to match local cost share for construction.
Quantify effectiveness of facility(ies) to work toward continuous improvement.
Progress* Step 1) Complete. Step 2) Complete. Step 3) In progress
Related Existing - See Clean Sweep programs on page 5-12. Activities See LMF/MMSD joint Household Hazardous Waste Education Project
on page 5-10.
Milwaukee Estuary RAP 7-33

CHAPTER 7: RAP RECOMMENDATIONS DEMONSTRATION PROJECT RECOMMENDATIONS
Cost and Funding
DP 2: Control Runoff from Bulk Storage Piles*
Item Estimated Cost Funding
SHORT TERM
Demonstration project: $50,000 Options: feasibility study - RAP funding
TOTAL $50,000
Control runoff from storage piles throughout the Milwaukee Estuary AOC. This runoff may carry solids, heavy metals (e.g. arsenic, boron, copper, zinc, chromium, cadmium, nickel, mercury, and Icad), and PAHs to AOC waters.
Rationale Benefits Keep solids, heavy metals, and PAHs from running off storage piles and entering waterways. Reduce contamination of fish and aquatic food chain, thereby improving aquatic habitat. Improve aesthetics by preventing contaminants from clouding or discoloring waterways. Reduce need for dredging by decreasing sediment contamination.
RAP Goals and Objectives Addressed (see Chauter 4) 1A, D; 2D-F; 3C; 4A.
Implementation Leader(s) WDNR; City of Milwaukee Port Authority
Short-term Steps 1) Initiate demonstration site at Port of Milwaukee.
a) b) Design runoff control structure(s). c) Implement design. d) Evaluate effectiveness of demonstration.
Meet with port officials to target/ prioritize potential sites,
Long-term Steps 2)
3)
Use results from step 1) to encourage voluntary participation by local industry/ bulk pile storage owners. Establish requirements for contaminant containment, and encourage use of best management practices against runoff and atmospheric contamination. Expand NR 120 to include cost-sharing assistance for bulk storage pollution control best management practices. Require use of best management practices for future bulk storage piles.
4)
5 )
1-34 Milwaukee Estuary RAP

CHAPTER 7: RAP RECOMMENDATIONS DEMONSTRATION PROJECT RECOMMENDATIONS
6 ) Gauge effectiveness of controls, best management practices, etc. by monitoring of runoff from piles with best management practices installed.
Progress* Step la) Complete.
Related Existing Activities Program on page 5-24.
See WDNR Wastewater Management Industrial Storm water Permit
Milwaukee Estuary RAP 7-35

CHAPTER 7: RAP RECOMMENDATIONS DEMONSTRATION PROJECT RECOMMENDATIONS
Item
Create vcgetative buffer zones, expand environmental corridors to eliminate gaps, and restore isolated parcels along Milwaukee River Basin waterways in and near the AOC through acquisition, lease, zoning, or easement.
Estimated Funding Cost
Rationale Benefits Increase habitat available to wildlife. Reduce "island effect" by linking environmental corridors. Protect waterways by restoring contaminated areas adjacent to them. Increase vegetative cover along waterways. Restore urban waterways Increase public awareness of, appreciation of, and access to urban green space and waterways.
RAP Goals and Obiectives Addressed (see Chapter 4) 1F; 4F; 5A,C,F; 6C; 8F.
Cost and Funding
Inventory and assessment of eligible areas
Restoration work
TOTAL
$25,000
Project specific
Options: - Stewardship Fund: Urban Green Space Program provides matching grants to cover land acquisition. - Nonpoint Source Pollution Abatement Program provides cost share. - New tax incentives, cost share programs grant programs, and private sector incentives, like nonprofit land trusts. - Urban Rivers Program
Options: - Scenic Urban Waterways Program - Land and Water Conservation Fund Federal program
$25,000
7-36 Milwaukee Estuary RAP

CHAPTER 7: RAP RECOMMENDATIONS DEMONSTRATION PROJECT RECOMMENDATIONS
Implementation Leader(s) Milwaukee River Revitalization Council Foundation; Milwaukee County; City of Milwaukee: WDNR.
Short-term Steps 1) Identify selected priority locations and develop or solicit detailed
project proposal with specifications and cost for the demonstration
The following first priority sites were selected from SEWRPC's Inventory of Vacant or Underutilized Lands for their particular existing value or potential for improvement.
Site 16: Riverside Park Area; in an environmental corridor; ACQUIRE/EASE. Site 22H Humboldt Yards; nearly adjacent to environmental corridor; EASE/DEVELOP (work with land owner to create buffer zone). Site 66H; on Kinnickinnic River; ACQUIRE & RESTORE. Site 29: Tmstel Site; special potential in Beer Line B tract; EASE/TREAT (obtain agreement to buffer area) Lakefront Island; built by city of Milwaukee in front of festival grounds; PLANT.
-
2)
3) Implement action.
Confirm acquisition or easement/agreement for priority sites and develop scope of project proposals to support such action.
Long-term Stem 4) Evaluate demonstration and make recommendations for future actions
Progress' 2) Humbolt Yards: In progress
Related Existing Activities
City of Milwaukee's Riverwalk Guidelines (CH2M Hill, 1983). See Milwaukee River Revitalization Council's Riverway plan on page 5-14. WDNRs Stewardship Fund: Urban Green Space Program. WDNRs Streambank Easement Program. Stewardship Fund: Streambank protection prog. WDNR Priority Watershed Projects in all watersheds in the Milwaukee River Basin.
Milwaukee Estuary RAP 7-37

CHAPTER 7: RAP RECOMMENDATIONS DEMONSTRATION PROJECT RECOMMENDATIONS
Item
DP4: Streamban k Restorati 'on
Estimated Funding cost
Demonstrate restoration of streambanks along waterways in and near the AOC. Potential demonstrations could dechannelize streams, replace shore walls with vegetative stabilization structures such as proven soil bioengineering reinforcement techniques, or remove sheet piling and concrete lining.
Demonstration project: inventory and pre- design analysis
TOTAL
Rationale Benefits Improve aquatic and terrestrial wildlife habitat. Improve aesthetics. Decrease stream bank erosion and pollutant influx. Develop innovative ways to restore stream banks.
RAP Goals and Obiectives Addressed (see ChaDter 4) IF; 4F; 5A,C,F; 6C; 8F.
$30,000 Options: - RAP funding - State Great Lakes funding - Great Lakes Protection Fund - Urban Green Space Program - Nonpoint Source Pollution Abatement Program
$30,000
Cost and Funding
Implementation Leader(s) Milwaukee River Revitalization Council Foundation; Milwaukee County: City of Milwaukee; WDNR.
Short-term Steps 1)
2) 3)
Inventory stream banks and prioritize sites according to need for restoration. Select one site for demonstration. Create and send out request for proposals. Initiate demo project on selected priority location for stream bank improvement. Contract with a consultant experienced in streambank restoration methods.
Long-term Stem 4) Evaluate project and make recommendation for future projects.
7-38 Milwaukee Estuary RAP

CHAPTER 7: RAP RECOMMENDATIONS DEMONSTRATION PROJECT RECOMMENDATIONS
Progress None to date
Related Existing - See Lincoln Creek Flood Control Project on page 5-19. Activities MMSD/ Milwaukee County Hoyt Park stream bank biostabilization
project.
Milwaukee Estuary RAP 7-39

CHAPTER 7: RAP RECOMMENDATIONS DEMONSTRATION PROJECT RECOMMENDATIONS
C o s t and Funding
DP 5 : Aerate a Section of the Menomonee River*
Item Estimated Funding c o s t
r
Develop and implement a system to provide an influx of dissolved oxygen into the Menomonee River from 25th Street downstream to the confluence with the Milwaukee River. Options include sidestream elevated pool aeration, instream air pumps and diffusers and flushing tunnel construction operation.
NOTE: This project addresses the symptom of low dissolved oxygen levels in the Menomonee River. The two causes of this problem are contaminated sediment and stream pollution. These causes are the focus of MMSD's Water Pollution Abatement Program on page 5-5 and actions that address contaminated sediment (see Chapter 6, Contaminated Sediment Management Strategy).
Operation costs
Rationale Benefits Elevate the concentration of dissolved oxygen in the water column sufficient to support a diverse aquatic life community (minimum 5.0 ppm of dissolved oxygen). Improve waterway aesthetics. Potentially attract activity to the Menomonee River Corridor.
RAP Goals and Obiectives Addressed (see Chapter 4) 2A.
$50,000 - TBD
per year $100,000
$450,000 - 600,000 +50,000 - 100,000/yr
Feasibility/ design
Implementation $150,000-
7-40 Milwaukee Estuary RAP

Implementation
CHAPTER 7: RAP RECOMMENDATIONS DEMONSTRATION PROJECT RECOMMENDATIONS
Leader(s) MMSD; WDNR.
Short-term Stem 1)
2) 3)
Long-term Stem 4)
Conduct feasibility study and engineering design to select aeration alternative. Solicit funding for implementation of selected alternative. Acquire any needed property and install aeration devices.
Evaluate effectiveness by measuring the dissolved oxygen levels of the stream before and after project implementation; recommend further action.
Progress* 1) Feasibility study and design are in progress; Greely and Hansen
Engineer, Chicago, IL, are conducting the study.
Related Existing Activities 5-5.
See MMSD's Water Pollution Abatement Program (WPAP) on page
Menomonee River Trail Development.
Milwaukee Estuary RAP 7-41

CHAPTER 7: RAP RECOMMENDATIONS DEMONSTRATION PROJECT RECOMMENDATIONS
DP 6: Riverway Public Access Trail*
Link river walks to complete a continuous trail as proposed in the Rivenvay Plan by the Milwaukee River Revitalization Council in 1991. aspect of the Milwaukee River trail. This would allow/encourage activities like bicycling, hiking, skiing, rowing, canoeing, and river viewing as well as enhance business patronage along the river front.
The focus of this project would be to develop the recreational
Rationale Benefits Improve public access and appreciation of river front and lakefront resources. Expand wildlife habitats. Provide off-road routes for commuting by bicycle and recreation. Enhance marketability of river front and its businesses. Encourage and promote water activities like fishing and boating. Improve river front aesthetics.
RAP Goals and Obiectives Addressed (see Chapter 4) 5A,B,C,D; 6B,C; 7&8F.
Cost and Funding Cost will depend upon each project's needs
Funding options: - Milwaukee County - Municipal governments - Tax incentives to private landowners - Land and Water Conservation Fund ~ Scenic Urban Waterways Program - Urban Green Space Program - Aids for the Acquisition and Development of Local Parks - Town and County Road Aids - Stewardship Fund
Implementation Leader(s) WDNR; Milwaukee River Revitalization Council Foundation; Milwaukee County; City of Milwaukee and other local governments; nonprofit conservation organizations; river front business and industry.
1) 2)
3)
Implemcnt the Rivenvay Plan for waterway development. Devclop a Milwaukee River Public Access Master Plan concentrating on the Milwaukee County Main stem (See Segment 5, Riveway Plan). Promote local stewardship fund to local governments as a source of funds to assist in land acquisition and restoration efforts.
7-42 Milwaukee Estuary RAP

CHAPTER 7: RAP RECOMMENDATIONS DEMONSTRATION PROJECT RECOMMENDATIONS
4) Establish a nonprofit organization, the Milwaukee River Revitalization Council Foundation, to lead in acquiring properties or rights to properties for complete trail linkage and public access. Establish a partnership between the public, private organizations, industries and governments to acquire, develop and manage land for the described recreational activities. Evaluate safety concerns and implement safety measures like lighting and emergency phones along riverway trails.
5 )
6 )
Progress* Step 1) Ongoing. Step 4) Ongoing.
Related Existing Activities West Bend Rotary project.
Menomonee Valley Greenway Feasibility Study.
Milwaukee Estuary RAP 7-43

CHAPTER 7: RAP RECOMMENDATIONS DEMONSTRATION PROJECT RECOMMENDATIONS
DP 7: Restore Milwaukee River Der Recommendations From North Avenue Dam Feasibility Study*
The North Avenue Dam Feasibility (Woodward-Clyde Consultants, 1994) evaluated the benefits and effects of five dam and river management alternatives. These alternatives generally included different dam and river management combinations including dam retention or abandonment; with or without sediment management actions; with or without fish and wildlife habitat restoration; and other recreational use enhancements (e.g. trails). The draft final report recommended implementation of management alternative 4: Partial Dam Removal with Sediment and River Management Actions.
Rationale This alternative proposes removing an 80 foot wide center section of the dam; implementing contaminated sediment management practices; protecting infrastructure; and restoring fish and wildlife habitat. The study recognizes the following resource and public benefits:
Manage contaminated sediments in a cost effective and environmentally sound manner Create 45-acres of floodplain wildlife habitat, including wetlands Eliminate the navigation and fish migration barrier for resident and anadromous fish Restore fish and aquatic life physical habitat Create a recreational sport fishery unique to southeastern Wisconsin Increase dissolved oxygen concentrations within the former impoundment and upper estuary reach Enhance public access and recreational use opportunities along the environmental corridor including trails, scenic overlooks, fishing and boating access.
Use Impairments Addressed All
7-44 Milwaukee Estuary RAP

Cost and Funding
CHAPTER 7: RAP RECOMMENDATIONS DEMONSTRATION PROJECT RECOMMENDATIONS
Item
'Phase 1 (short-term): Design and plan specifications
(costs included in capital cost estimates detailed below) Capital Costs: - Infrastructure
(year 1)
protection, abandonment or modification, channel protection (years 2&3)
- Sediment flat and river bank erosion control Fish habitat restoration (year 3 &4)
Phase 2 (long-term): Sediment removal/consolidation (timeline to be determined as upstream contaminated sediment sources are abated) Park and recreation plan amenities (optional)
- Wildlife habitat restoration, including wetlands (upon completion of final sediment management action)
TOTAL:
Estimated cost
$ 806,000
$2,165,000
$ 152,000
$1,348,000
$1,118,000
$ 134,000
$5,723,000
Funding
Options: -Great Lakes Harbors & Bays
Sec.3 19 Funding
Stewardship Funds
restoration Funds
Local sources
Sport fish
Implementation Leaders and Cooperators
The draft final report recommends the following roles for implementing this project: WDNR (lead); city of Milwaukee (lead); MMSD (lead); Milwaukee County (cooperator); village of Shorewood (cooperator); private landowners (cooperators).
Milwaukee Estuary RAP 7-45

CHAPTER 7: RAP RECOMMENDATIONS DEMONSTRATION PROJECT RECOMMENDATIONS
Short-term Stem 1) Complete Technical Memorandum 2) 3) Conduct two informational meetings 4)
5) Complete final report 6) Implement recommended management actions
SCHEDULE: Phase 1 a. b. C.
d.
e.
Phase 2 f.
g. h.
Progress*
1) Complete. 2) Complete. 3) Scheduled for May, 1994. 4) Scheduled for May, 1994. 5) In progress
Prepare report and recommend the selected management alternative
Conduct project briefings for affected units of government and other agencies
Design and plan specifications (year 1) Infrastructure protection or abandonment (year 2&3) Channel and river bank protection (years 2&3) Sediment flat erosion control (completed, or as additional disturbances arise) Fish habitat restoration (years 3&4)
Sediment channel and flat erosion control (to be determined as upstream contaminated sediment sources are abated) Park and recreation plan (upland park amenities optional) Wildlife habitat restoration, including wetlands (upon completion of final sediment management action)
7-46 Milwaukee Estuary RAP

CHAPTER 7: RAP RECOMMENDATIONS INFORMATION AND EDUCATION RECOMMENDATIONS
Item Estimated Cost
Information and Education Recommendations
Funding
I&E 1: Household Pollution Prevention Education Program*
Initial 2 years (Steps $150,000 1-8)
Expand current Lake Michigan Federation (LMF)/ MMSD program to continue citizen education regarding pollution prevention in the home. Increase distribution of information for reducing the use of toxic materials in the home and for disposal of previously purchased hazardous products or waste.
MMSD: $75,000 LMF raised $75,000
Rationale Benefits Decrease discharges of toxic and hazardous substances to sanitary sewers, storm sewers or the ground, thus reducing the amount of hazardous substances currently entering the AOC. Assist MMSD in maintaining compliance with effluent and sludge regulations by decreasing toxic inputs to the sanitary sewer system Encourage/establish stewardship among area residents.
RAP Goals and Obiectives Addressed (see Chauter 41 1A, 2E, 8A.
Expand program $1 50,000
Cost and Funding
Options: - RAP/ Great Lakes funding - LMF
TOTAL
Implementation Leader(s) LMF; MMSD.
$300,000
Short-term Stem 1) Create and distribute flyers about household pollution prevention.
Recipe book of alternative household cleaners. Six brochures about topics like lawn care, garden care, and smart shopping. Refrigerator poster illustrating the impact of home pollutants on the lake.
Milwaukee Estuary RAP 7-47

CHAPTER 7: RAP RECOMMENDATIONS INFORMATION AND EDUCATION RECOMMENDATIONS
2 ) 3)
4) 5 ) 6 )
7) 8)
Develop and offer household product audits in pilot neighborhoods. Broaden involvement of neighborhood associations, scout troops, store owners, and recycling groups. Hold community workshops in pilot neighborhoods. Package and distribute school curriculum on pollution prevention. Provide pollution prevention information through radio and television public service announcements and three television commercials. Create and distribute educational videos and slide shows. Team up with businesses to educate their customers about non toxic alternative products/services.
Long-term Steps 9)
10)
Expand program by making materials available to all Milwaukee area communities. Translate, print, and distribute all materials into Spanish and Hmong Communities.
Progress* Steps 1)-8) Complete.
Related Existing Activities 5-2.
See Wisconsin's Pollution Prevention Management Groups on page
See GMTMTF Toxicant Reduction Strategy on page 5-8.
7-48 Milwaukee Estuary RAP

CHAPTER 7: RAP RECOMMENDATIONS INFORMATION AND EDUCATION RECOMMENDATIONS
I&E 2: Install Environmental Awareness S igns*’
Develop and install environmental action and awareness signs at locations where they are accessible to citizens and AOC waterway users. There are three sign locations: 1) the railings of four to six Milwaukee River bridges, 2) a kiosk along the Milwaukee River Walk, and 3) on five Milwaukee River bridges at the water level. Sign topics will include toxicants in the Great Lakes; food chains and fish advisories; citizen pollution prevention techniques; and waterfront planning.
Rationale Benefits Educate the public about coastal issues. Promote wise use of the Great Lakes coastal environment. Increase citizen involvement in decisions affecting the Great Lakes. Improve implementation and enforcement of laws regulating the Great Lakes.
RAP Goals and Obiectives Addressed (see Chauter 42 1G; 7/8 A,B,C,E,F.
This program is completely funded through a Coastal Zone Management grant and in-kind support from the Milwaukee Zoological Society, City of Milwaukee, WDNR, and the River Appreciation Group.
F Cost and Funding
Implementation Leader(s) Milwaukee Zoological Society; UW-Cooperative Extension; WDNR.
Short-term Steps 1) Identify target audiences: a) citizens who are not reached through
formal education and b) waterfront amenities users. 2) Designate posting locations for signs. 3) Develop written material. 4) Hold written material review session with RAP River Appreciation
Work Group. 5) Hire graphic artist, have artist design signs. 6) Hire contractor to construct sign. 7) Install signs. 8) Notify public of signs.
Long-term Steps 9) Maintain signs
Milwaukee Estuary RAP 7-49

Progress* Step 1) Step 2) Step 3) Step 4) Step 5) Stcp 6) Step 7) Step 8)
CHAPTER 7: RAP RECOMMENDATIONS INFORMATION AND EDUCATION RECOMMENDATIONS
Complete. Complete. Complete. Complete. In progress. Targeted for August. September for bridge signs; October for kiosk. Targeted for October.
Related Existing Activities Watershed Programs.
Educational component of WDNR Southeast District's Priority
7-50 Milwaukee Estuary RAP

CHAPTER 7: RAP RECOMMENDATIONS INFORMATION AND EDUCATION RECOMMENDATIONS
Item
I&E 3: Community Awareness Program*
Estimated Funding cost
Provide the public with a comprehensive program that will build awareness about the links between degradation of the Great Lakes and public health in the context of the Milwaukee River Basin.
Project director and assistant
Rationale Benefits Increase awareness among Milwaukee River Basin citizens of pollution causes and effects on human health. Gain public support for RAP activities.
RAP Goals and Objectives Addressed (see Chapter 4) 7&8, all objectives.
$17,1 20 Options: - Great Lakes funding
Cost and Funding
Model & video development & distribution
TOTAL
Implementation
$21,000 Options: - RAP/ Great Lakes funding - Great Lakes Protection Fund - U.S. Dept of Health and Human Services Assistance Grants
$59,620+
Educational curriculum $13,000 - $4000 from LMF, HEC (in and materials kind)
Exhibit development $8500 & construction kind)
- $3300 from LMF, HEC (in
Leader(s) LMF; WDNR; HEC.
Short-term Steps 1)
2) 3)
Form a steering committee to develop educational written materials and audio visual aids. HEC staff incorporates materials from step 1) in their programs. LMF, HEC, WDNR work to develop an interactive traveling exhibit and accompanying handouts.
Milwaukee Estuary RAP 7-5 1

CHAPTER 7: RAP RECOMMENDATIONS INFORMATION AND EDUCATION RECOMMENDATIONS
4) Bring exhibit to community special events.
Long-term Stem 5 ) Evaluate program and make recommendations for future activities.
Progress* 1) In progress.
Related Existing Activities
See UW Extension Solid and Hazardous Waste Education Center (SHWEC) activities on page 5-3. GMTMTF Toxicants Reduction Strategy on page 5-8.
1-52 Milwaukee' Estuary RAP

CHAPTER 7: RAP RECOMMENDATIONS INFORMATION AND EDUCATION RECOMMENDATIONS
Item
I&E 4: Provide Pollution Prevention Technical Assistance
Estimated Funding cost
Provide toxicant reduction/pollution prevention technical assistance to industry and commercial businesses. Technical assistance teams will share information through facility evaluations, waste audits, and technology transfer.
Rationale Benefits Educate unregulated industries and businesses about the impact of improper waste treatment and disposal methods for waste reduction. Reduce the amount of waste that industries and businesses release into the Milwaukee River Basin waterways and the sewerage system
RAP Goals and Obiectives Addressed (see Chauter 4) 1B; 2E; 4A; 8A.
Cost and Funding
Research, Material development, Publicity
Sm. businesses pollution prevention video
TOTAL
$100,000 - $250,000 annually'
$30,000
Options: - waste reduction and recycling demonstration grants - GREAT LAKES Protection Fund - RAP funding - MMSD Cooperative grants - Consortium: industry sponsors, environmental groups, trade unions and universities. - Program fees for operating costs once initial development is complete.
- GMTMTF will provide $10,000 in kind. - EPA GLNPO has agreed to nrovide $20,000.
$30,000; + $100,000-250,000/yr
35,000 provided by U.S. EPA
Implementation Leader(s) Greater Milwaukee Toxics Minimization Task Force (GMTMTF); UW-Extension; Solid & Hazardous Waste Education Center. Lake Michigan Federation (LMF);
Milwaukee Estuary RAP 7-53

CHAPTER 7: RAP RECOMMENDATIONS INFORMATION AND EDUCATION RECOMMENDATIONS
Federation of Environmental Technologists (FET)
Short-term Steos 1) Tailor a technical assistance program especially for small businesses
by interviewing several to learn about their needs. Form ad hoc committee to formulate strategy to cooperate efforts with related existing programs. Prioritize list of industries to determine which to contact. Form several industly-specific technical assistance teams, comprised of interested Task Force individuals. Survey business and industry specialists to develop educational pamphlets and a pollution prevention video. Work with chemical suppliers, trade associations, and academic institutions to identify and promote waste reduction opportnnities. Produce a directoly of alternative industrial and commercial supplies and processes for targeted industries. Deploy technical assistance teams to provide facility evaluations, waste audits and technology transfer. Present educational information and promote technical assistance services at trade shows. Request toxicant minimization reports from participating industries and businesses for project tracking purposes. Create a pollution prevention database that allows area businesses to share information.
Long-term StepsNone to date.
Progress Step 1) In progress. Step 4) In progress. Step 5 ) Complete. Step 6) In progress. Step 7) In progress. Step 8) In progress. Step 9) In progress. Step 10) In progress. Step 11) In progress.
Related Existing Activities
See Wisconsin's Pollution Prevention Groups on page 5-2. See UW Extension Solid and Hazardous Waste Education Center (SHWEC) activities on page 5-3 . See GMTMTF Toxicants Reduction Strategy on page 5-8.
7-54 Milwaukee Estuary RAP

CHAPTER 7: RAP RECOMMENDATIONS INFORMATION AND EDUCATION RECOMMENDATIONS
Item
I&E 5: Shorekeepers Program
Estimated Funding cos t
Develop a network of volunteers to monitor and care for the Southeastern Wisconsin shores of Lake Michigan. Volunteer activities will include storm sewer stenciling and beach clean-ups.
Storm sewer stenciling coordination
Rationale Benefits Educate public about the storm water sources of pollution (antifreeze, used motor oil, paint, fertilizer, pesticides, pet wastes, etc) to Lake Michigan.
medical wastes, tires, ete.). Improve shoreline aesthetics. Promote stewardship ethic among participants.
RAP Goals and Objectives Addressed (see Chauter 4) 1G; 2E; 6A; 7&8, all objectives.
- Protect wildlife and human health by reducing litter (plastics, glass,
in-kind - UW-Extension, LMF (in kind)
Cost and Funding
Kits: paint, buckets, stencils, brushes, door hangers
Workshop development & coordination
Newsletter; outreach activities.
$15,000 - RAP/ Great Lakes funding - Private sponsor
in-kind - WDNR, LMF (in kind)
$20,000 - Great Lakes funding
Beach sweep coordination in-kind - Milwaukee Public Schools (in kind) - LMF (in kind)
Beach sweep equipment: signs, bags, gloves, etc.
TOTAL
Implementation Leader(s) LMF; UWEX; KGMB.
$10,000 - RAP/ Great Lakes funding - private sponsor
$45,000 + in kind services
Milwaukee Estuary RAP 7-55

CHAPTER 7: RAP RECOMMENDATIONS INFORMATION AND EDUCATION RECOMMENDATIONS
Short-term Steps 1) Identify prospective Shore Keepers. 2)
3)
4)
5 ) 6 ) 7)
8) 9) Publish evaluation.
Conduct Shore Keeper training workshop # l ; identify sewer stenciling volunteers. Shore Keepers begin monitoring; identify and expand number of volunteers for beach sweep. Conduct Shore Keeper training workshop #2; distribute sewer stenciling kits. Hold spring beach sweep; initiate sewer stenciling for summer. Publish/distribute Shore Keepers' newsletter #1. Conduct Shore Keeper training workshop #3; identify volunteers for fall beach sweep. Hold fall beach sweep; publish/distribute Shore Keepers' newsletter #2.
Long-term Steps 10) Make plans to expand program
Progress NA
Related Existing Activities Muskegon, MI.
Well-established LMF Shorekeeper's Programs in Chicago and
Statewide Water Action Volunteers. KGMB "Sack-it-to-me" Saturday beach/park clean-ups. LMF's Beach Sweeps.
7-56 Milwaukee Estuary RAP

CHAPTER 7: RAP RECOMMENDATIONS INFORMATION AND EDUCATION RECOMMENDATIONS
Professional booklet: $5,000 - $10,000 preparation and printing
I&E 6: Marina Refueling/ Operato r Educati‘on Program
Options: - RAP funding - Great Lakes funding - US Coast Guard - UW Sea Grant
Create an educational booklet to promote use of methods among marina operators to prevent and capture fuel spilled at boat refueling stations among marina operators.
TOTAL
Rationale Benefits Improve water/environment quality and aesthetics near marina refueling stations by reducing influx of gas, diesel, and oil from spills. Provides a mechanism to monitor AOC marina fueling operators in lieu of regulations or licensing, which are currently non-existent.
RAP Goals and Obiectives Addressed (see Chanter 4) 2E; 6A; 7&8A,B,E.
$5,000 - 10,000
Cost and Funding
Implementation Leadeds) RAP TAC: U.S. Coast Guard
Short-term Steps 1) Obtain support from RAP TAC to prepare the educational booklet. 2)
3) Print booklet. 4)
Create bobklet based upon information from U.S. Coast Guard refueling-operators training manual.
Solicit involvement from marina owners and operators with booklet distribution at refueling stations.
Long-term Stem 5 )
Progress None to date.
Evaluatc response and make plans for revisions.
Related Existing Activities
See the U.S. Coast Guard refueling operators training manual.
Milwaukee Estuary RAP 7-57

CHAPTER 7: RAP RECOMMENDATIONS INFORMATION AND EDUCATION RECOMMENDATIONS
Item Estimated cost
I&E 7: Vehicle Waste Oil and Antifreeze Disposal*
Funding
Provide informational materials and technical assistance to disposers of vehicle oil and antifreeze. Disposal of such waste into landfills and storm sewers contaminates ground water and streams. Project focus is to educate disposers about improper disposal effects, proper disposal methods, and recycling options. While oil disposal into landfills has been banned since 1991, antifreeze disposal has not.
Educational fact $1000 - sheet (Step 2) $1500
Recycling _ _ facilities (Step 4)
Rationale Benefits Reduce discharge of vehicle oil and antifreeze into storm and sanitary sewers or landfills, which contaminates ground water and streams and sewage sludge.
Options: - RAP/Great Lakes funding
RAP Goals and Obiectives Addressed (see Chauter 4) 2D, C; 6A.
Recycle oil and antifreeze (Step 5)
Cost and Funding
--
Implementation Leader(s) GMTMTF; KGMB; WDNR; City of Milwaukee
Short-term Steps 1) Identify target audiences, e.g: do-it-yourselfers; auto repair shops;
auto and truck dealerships; farm implement dealers and manufacturers; technical school students. Prepare and distribute a fact sheet to target audiences about improper disposal effects and proper disposal methods. Create an incentive for auto repair shops to collect and/or recycle of oil and antifreeze. Provide adequate, accessible facilities for residents to recycle their waste oil and antifreeze. Distribute a list of facilities. Contract with a firm to recycle oil and antifreeze. Encourage garages to buy recycling equipment. Develop radio PSAs to encourage oil and antifreeze recycling. Include a list of recycling centers and garages that recycle to area residents.
2)
3)
4)
5)
6)
Milwaukee Estuary RAP 7-58

CHAPTER 7: RAP RECOMMENDATIONS INFORMATION AND EDUCATION RECOMMENDATIONS
Long-term Steps 8) Evaluate efforts and recommend future actions.
Progress* Step 1 ) Complete. Step 3) Forty-three area auto repair shops currently collect waste oil
and antifreeze.
Related Existing - Many local municipalities and auto repair shops already provide Activities disposal and recycling facilities, as detailed in Progress above.
MMSD/ICC Household Hazardous Waste Disposal Facility.
Milwaukee Estuary RAP 7-59

CHAPTER 7: RAP RECOMMENDATIONS INFORMATION AND EDUCATION RECOMMENDATIONS
I&E 8: RAP Column for Industry News letters
Obtain space in various industry newsletters for a column about industry-related RAP activities
Rationale
Cost and Funding
Implementation
Related Existing Activities
Benefits Develop an appreciation by industry for RAP goals and activities. Update local industry on environmental regulations as they develop. Provide a forum for feedback and discussion regarding industry's concerns about RAP activities and environmental regulations.
RAP Goals and Obiectives Addressed (see Chapter 4) 1(all objectives).
Project coordination and article writing will be contributed in kind by RAP TAC members and others.
Lcader(s) RAP Technical Advisory Committee; WDNR; Metropolitan Milwaukee Association of Commerce; Industrial Council; Federation of Environmental Technologists; Greater Milwaukee Toxics Minimization Task Force.
Short-term Stem 1) 2) 3)
4)
5) Designate a column editor. 6)
Select several industry newsletters for pilot projects. Have a Technical Advisory Committee member write a column. Contact newsletter editors to request and obtain inclusion of column in newsletter. Evaluate prototype project by obtaining feedback from author as well as newsletter editors and readers.
Designate a rotation of authors for future columns from the RAP Technical Advisory Committee. These authors will research articles, soliciting industry input, and write according to column editor requirements.
Long-term Steps 7) Solicit feed? ock from newsletter readers and evaluate its effectiveness.
Use evaluation information to improve the column
Progress NA
Many trade newsletters exist.
7-60 Milwaukee Estuary RAP

CHAPTER 7: RAP RECOMMENDATIONS INFORMATION AND EDUCATION RECOMMENDATIONS
Item Estimated cos t
I&E 9: Increase Awareness of Fish Consumption Advisory
Funding
Increase awareness of fish consumption advisories by 1) translating information for foreign-speaking anglers, 2) increasing distribution of the advisory, and 3) posting the advisory in strategic locations.
Set-up costs $500
Print 1500 info $1000 packets
Mail 1500 packets $1500 ($4125 (+ map) to target including groups map)
Workshops $200 each
Rationale Benefits Increase knowledge among fish eaters of fish contaminants and water quality. Reduce the risk of health problems due to consuming contaminated fish by teaching anglers proper fish preparation techniques, and non- appropriate/appropriate fish for consumption.
Options: - Great Lakes Protection Fund - US Dept of Health and Social Services Grants
funding - Local funding
RAP Goals and Objectives Addressed (see Chapter 41 4A.
TOTAL
Cost and Funding
$3,200 - $5,725
Implementation Leader(s) WDNR; UWEX; DHSS
Short-term Steps 1) Identify target audiences. 2) Translate advisory as necessary. 3)
4)
Post signs and provide advisory in locations accessible to target audience. Conduct public workshops to publicize and demonstrate the best methods to clean and prepare fish to decrease the risk of exposure to contamination.
Milwaukee Estuary RAP 7-6 1

CHAPTER 7: RAP RECOMMENDATIONS INFORMATION AND EDUCATION RECOMMENDATIONS
Long-term Steps 5) Evaluate project and make recommendations for future actions and
expansion.
Progress None to date.
Related Existing Activities
The WDNR has initiated a project in Sheboygan that targets Hmong anglers
7-62 Milwaukee Estuary RAP

CHAPTER 7: RAP RECOMMENDATIONS INFORMATION AND EDUCATION RECOMMENDATIONS
Item
I&E 10: WAVE Water Action VoluntEers
Estimated Funding cos t
Encourage local community groups, like schools and businesses, to adopt a segment of river or tributary. Interested groups research the segment, establish a parent group, and set long and short term goals for their segment. Group activities to reach these goals may include holding an annual stream clean-up, a stream walk survey, making recommendations to legislative bodies, or promoting awareness among land users of their impact upon the segment.
Develop and distribute $15,000 Milwaukee River specific guidebook (Includes staff time)
Rationale Benefits Promote community stewardship. Encourages an educated constituency to help set public policy. Promote awareness among land users of their impact upon stream quality. Remove sources of pollution. Improve the quality of surface water and the ambient wildlife habitat.
Options: - 604b from WI (DNR) - Natural Resources Foundation of WDNR - Milwaukee River Revitalization Council
RAP Goals and Obiectives Addressed (see Chapter 4) 6A; 7&8A,B,C,E,F.
TOTAL $15,000
Implementation Leader(s) Milwaukee River Revitalization Council ?Carolyn Johnson thinks WDNR because its statewide
Short-term Steps 1) 2)
Select target groups and suggested activities for a pilot project. Create and distribute a step-by-step guide, specific to the Milwaukee River, for the pilot project. Guide should include contact names and numbers for technical advice as well as a pilot project evaluation form. Create a system to track the groups who request the packet. Monitor progress of pilot project groups.
3) 4)
Milwaukee Estuary RAP 7-63

CHAPTER 7: RAP RECOMMENDATIONS INFORMATION AND EDUCATION RECOMMENDATIONS
Long-term Steps 5) 6)
Once enough feedback has come in, evaluate the pilot project. Establish a larger scope, more formal adopt-a-stream program.
Progress* Step 1) Complete. Step 2) Complete. Step 3) Complete. Step 4) In progress
Related Existing Activities
Proposed statewide Adopt-a-Stream Program. See Milwaukee Testing the Waters Program on pages 5-12, 7-66, 7-68. KGMB's "Sack it to Me Saturday." See the annual Kiwanis Milwaukee River Clean-up on page 5-14. See the Shorekeepers program on page 7-55.
1-64 Milwaukee Estuary RAP

CHAPTER 7: RAP RECOMMENDATIONS INFORMATION AND EDUCATION RECOMMENDATIONS
Item
I&E 11: Testing the Waters Program*
Estimated Cost Funding
Expand and enhance the public/private consortium under the title of "Testing the Waters: Linking Students and the Water Through Technology." Program will include these components:
1)
2) 3) 4) 5 )
Annual two-day fall training workshop to teach students and teachers about riverine system ecology, issues, intervention strategies, and data collection of nine water quality parameters. Computer network to support communication between schools of water quality parameters. Spring student congress to report results and share water quality ideas. Resource guide for middle and high school students providing water quality information. Advanced testing program called the "Lake Project."
Pilot project $30001 school
Rationale Benefits Increase teacher and high school student awareness, knowledge, and skills about water quality issues. Demonstrate effect of rural, urban, and suburban areas upon water quality. Increased awareness .of nonpoint source pollution problems and solutions. Increased awareness among students of environmental careers. Strengthen Stewardship
RAP Goals and Objectives Addressed (see Chapter 4) 7&8, all objectives.
- Riveredge Nature Ctr - Schlitz Audubon Ctr - Wehr Nature Ctr - WDNR - MMSD
Cost and Funding
Workshop $1201 school
Computer network
Monitoring bus fee $140/ school
Student congress $140/7 people
TOTAL continuation fee $7001 school
Lake Project, including $700/school+ boat rental boat rental fees
$120/
Options: - Riveredge Nature Ctr - Schlitz Audubon Ctr - Wehr Nature Ctr - WDNR - MMSD
Milwaukee Estuary RAP 7-65

CHAPTER 7: RAP RECOMMENDATIONS INFORMATION AND EDUCATION RECOMMENDATIONS
Implementation Lcader(s) Riveredge Nature Center; Schlitz Audubon Center; MMSD; WDNR
Short-term Stem 1) Select 32 schools from rural, urban, and suburban areas. 2) 3) 4)
Obtain funding and sponsors for pilot program (steps 3-5). Develop fall training workshop and spring student congress. Develop computer network of 32 schools monitoring Milwaukee, Menomonee, and Kinnickinnic rivers for nine water quality parameters, which will support communication of water quality testing results.
Distribute household pollution prevention information to participants. 5) Develop resource guide. 6)
Long-term Steps 7) 8)
9)
Reinstate funding for project continuation. Continue workshop, computer network, monitoring bus services, and student congress. Develop an expanded Lake Project for students who have been involved in river testing to perform advanced testing in the Milwaukee Estuary and near shore Lake Michigan.
Progress* Step 1) Complete. Step 2) Complete. Step 3) Complete. Step 4) Complete. Step 5) Complete. Step 8) In progress. Step 9) In progress.
Related Existing Activities
See Shorekeepers Program on page 7-55. See Adopt-a-Stream Program (Water Watchers) on page 7-64
7-66 Milwaukee Estuary RAP

CHAPTER 7: RAP RECOMMENDATIONS INFORMATION AND EDUCATION RECOMMENDATIONS
Item Estimated Cost
I&E 12: Wate r Quality Information Line
Funding
Develop an informational line (either a 1-800 number, or an Ameritech touch-4) that can be accessed by the public. This line will provide general information on the status of local water quality, and water-related projects. The line will also include pollution prevention activities that can have a direct impact on local surface waters. In addition, the line could function as a community calendar for local environmental activities, thus encouraging participation and stewardship.
800 service
Develop monthly message
Rationale
Goals & Objectives
Cost and Funding
Implementation
Increase environmental awareness Increase participation in and support for local environmental activities Develop/strengthen stewardship
7&8; all objectives
Leaders UWEX. WDNR
Short-term Step 1) Establish Ameritech touch four, 1-800 number access line, or utilize
UWEXs Infosource line
2)
Progress None-to-date
Establish key persons at DNR and UWEX to write scripts.
Milwaukee Estuary RAP 7-61

CHAPTER 7: RAP RECOMMENDATIONS INFORMATION AND EDUCATION RECOMMENDATIONS
Regulatory Recommendations
This recommendation involves supporting and expanding current federal regulations.
R1: Advance Implementation of Federal Storm water Regulations/Expand Municipal Permit Program.
Item Estimated Cost
Support the implementation of Federal regulations requiring permits for certain categories of storm water discharges. In addition, support the expansion of WPDES municipal storm water permit program to all communities in the Milwaukee Estuary drainage basin. This should apply to communities, villages or governmental entities over 1,000 in population.
Rationale Benefits Reduce loadings of toxic contaminants and sediment to surface waters from urban runoff.
Funding
Issuing permits, monitoring costs, development and implementation of best management practices
SHORT TERM I! $2.5 million
Implementation Leader(s) WDNR, City of Milwaukee, Local Municipalities
Short-term Steps 1) Support issuance of City of Milwaukee permit.
2) Adopt state s torm water WPDES program to include all municipalities in Priority Watersheds and AOC Watersheds.
3 ) Require notice of intent and permit applications from these communities.
4) Support development of storm water pollution prevention plans.
7-68 Milwaukee Estuary RAP

Q CHAPTER 7: RAP RECOMMENDATIONS INFORMATION AND EDUCATION RECOMMENDATIONS
5 ) Monitor and implement best management practices to control contaminants in urban runoff.
Progress 1 . Ongoing 4. Ongoing
DP:2 Control Runoff from Bulk Storage Piles. Related Existing Activities
Milwaukee Estuary RAP 7-69

CHAPTER 8: IMPLEMENTATION STRATEGY OVERVIEW
CHAPTER 8: Implementation Strategy
The restoration of the Milwaukee River Basin requires long-term commitment. Results must develop one step at a time. This plan offers a solution by defining a strategy for coordinating these step-by- step efforts.
Monetary support alone, although important, will not restore the area. Restoring and protecting the area will depend on the efforts of all the Milwaukee River Basin's citizens, as well as governments and businesses, working together to prevent pollution and clean up contamination from the past. Successful implementation of this plan will depend on the willingness of the Basin's citizens to voluntarily change the way we lead our lives.
The first section of this chapter gives an overview of the implementation strategy. It describes the implementation committee structure, the RAP'S ecosystem approach, and the importance of public information and education.
Following is a description of the implementation strategy. Because the RAP process is dynamic, this plan cannot address all long term restoration needs. Rather, this section outlines a strategy and lists options for financing the highest priority, short term actions, which are listed in Chapter 7, RAP Recommendations. As knowledge of the Basin ecosystem increases, we can even more effectively focus our limited resources toward restoration.
Overview Implementation Strategy
Overview
RAP Implementation Committee (RIC)
Solving complex ecological problems is beyond the scope of any one agency or organization. Although WDNR has the responsibility for overseeing RAP implementation (developing plan updates, tracking progress), restoration of the AOC will require cooperation from all Milwaukee area stakeholders.
The driving farces behind RAP recommendations will be CAC and TAC members as well as government units. These RAP stakeholders will be responsible for setting priorities and formulating recommendations.
As the RAP moves into an implementation phase, the CAC will set up a RAP Implementation Committee (RIC). Like the current advisory committee the RIC should represent these groups:
County and municipal government (including representatives from the entire basin) Municipal and industrial dischargers Environmental and conservation groups Recreational groups Agriculture State legislature
Milwaukee Estuary RAP 8-1

CHAPTER 8: IMPLEMENTATION STRATEGY OVERVIEW
Resource management agencies Universities Media lnterested citizens
The RIC and the RAP Coordinators will work to promote a unified approach toward AOC restoration. More specifically, the RIC and the RAP Coordinators will perform the following tasks.
1) Identify additional restoration needs in the Milwaukee River Basin and propose additional recommendations to address them.
Transform existing recommendations into actions by obtaining sponsors and funding
Prioritize RAP recommendations and coordinate implementation to avoid overlap and rework.
Distribute an annual report describing RAP progress to Milwaukee River Basin stakeholders, general public representatives, and government officials.
2)
3)
4)
Future options to facilitate RAP implementation include the involvement of not-for-profit organizations and the creation of a Basin-wide authority. In other states, RAP implementation committees have established not-for-profit organizations to assist in efforts to secure funding from foundations, state and federal grant programs, corporations, and individuals. Such organizations assist the RAP by managing funds for RAP programs; coordinating participation among communities; and encouraging public awareness and appreciation of RAP efforts(Apogee Research, 1993). Using existing non-profit organizations, such as the Milwaukee River Revitalization Foundation, to manage RAP finances, or forming a Basin- wide authority for Milwaukee River Basin cleanups will need to be further investigated.
8-2 Milwaukee Estuary RAP
CHAPTER 8: IMPLEMENTATION STRATEGY OVERVIEW
Ecosystem Appoach
The RAP's" ecosystem approach" to environmental cleanup recognizes the interrelationships between organisms, including humans, and all the interacting elements of the water, air, and land in the Milwaukee River Basin. The ecosystem approach is applied to generate permanent and complete solutions to the area's environmental problems, rather than merely solving one environmental problem at the expense of creating another. The ecosystem approach attempts to integrate environmental programs to attain a common goal. The RAP represents a first opportunity on a broad and practical scale to implement the ecosystem approach to environmental restoration, and is a unique experiment in institutional cooperation.
The ecosystem approach, like pollution, does not recognize political boundaries. Therefore, the financial strategy for the RAP should extend the RAP's funding base beyond political boundaries to reflect the AOC's watershed. For example, upstream sources of pollution contribute significant amounts of pollutants to the AOC. Therefore, successful environmental cleanup must he a Basin wide effort.
Public Information and Education
To reach RAP goals, an effective public outreach and participation program must be an integral part of RAP implementation. The Finance and Implementation Advisory Committee identified public information and education programs as a means to this end. For detailed information about information and education programs already underway, see Chapter 6, Reaching R A P Goals Through Existing Programs, and Chapter 7, RAP Recommendations.
Providing the public with information about clean-up benefits is necessary to generate DO litical for the RAP. This "political will" is necessary at the federal, state, and local levels to
secure funding in support of restoration activities. The benefits of AOC restoration need to be quantified, or described in terms that the public can relate to, in order to obtain maximum support. Changes that can be seen or measured, such as positive changes in fish and wildlife populations, or reductions in beach closings, will have the most success in generating public support.
Just as citizens need to support programs and actions to restore the AOC, citizens must learn how their personal choices and lifestyles affect their environment. Information and education programs should inform citizens of environmentally sound choices, and motivate them to take action. Decisions about what products to purchase, how to tend lawns, and how they get to work, have effects that can only change if citizen choices and lifestyles change. Therefore, the most important outreach efforts for the long-term future success of the RAP may well be those directed at children (Eiger, 1992).
Pollution prevention methods should be the focus of a comprehensive information and education program. Pollution prevention should be highlighted as a necessary and cost effective way to reduce environmental degradation.
A successful public outreach strategy for the RAP requires a multi-media approach. A survey done for the Green Bay RAP showed that newspapers are more effective than public meetings, brochures, fact sheets, or videos as tools for reaching a large number of people (Glassner, 1991). Television and radio advertisements reach the largest audience, but the costs involved may be constraining.
Milwaukee Estuary RAP 8-3
CHAPTER 8: RAP IMPLEMENTATION IMPLEMENTATION STRATEGY
Implementing Recommendations
Facilitating the implementation of RAP recommendations will be one of the primary functions of the RAP Implementation Committee (RIC). Once an idea materializes as a recommendation, RIC then takes action to transform the recommendation into a project. More specifically, the RIC designates a project sponsor or sponsors. RIC then provides assistance as sponsors develop project objectives and budgets, and go on to implement the recommendations.
Sponsors may be RAP stakeholders, area businesses, or WDNR. Determining who will pay for environmental clean-up is described below.
Who Will Pay for Environmental Clean-up?
Who will pay for environmental cleanup projects? There are four primary funding options: 1) polluter pays, 2) beneficiary pays, or 3) general population (from general revenues) pays, or 4) combinations of the above.
These options arc considered in the order presented here. Funding options that link the sources of pollution to the remedial action funding are preferable because responsible parties pay cleanup costs. This option also has disadvantages. Large sums of money have been expended in gathering evidence, going through litigation/negotiation and long term intervals may be involved.
If a polluter can not be identified, an attempt will be made to identify a beneficiary of the remedial work. In the case that neither a polluter or beneficiary can be identified, general revenues must be considered.
Thcrc is not always a clear distinction between polluter or general public. For example, boatcrs are both polluters and beneficiaries; they contribute to surface water pollution, and benefit from cleanup efforts. A funding option that imposes a fee on boatcrs combines these options, drawing funding from
the polluter and beneficiary. In some cases, it may also be necessary to investigate the contribution of historical polluters in the Basin.
8 -4 Milwaukee Estuary RAP

CHAPTER 8: RAP IMPLEMENTATION IMPLEMENTATION STRATEGY
Funding Sources
Because the RAP will evolve over the course of years, it is not possible to develop a financial strategy that will serve as the "final solution" to all the RAP's financial needs. This section provides guidelines to develop financing to implement each RAP recommendation. To develop such a strategy, project planners must identify these items: 1) principle sources of funding at local, state and federal levels of government, 2) potential new funding sources, and 3) ongoing or existing clean-up programs.
There are activities without existing funding. For instance, the Corps of Engineers' participation in removal of contaminated sediments has been authorized, hut no money has been appropriated. Similarly, other RAP activities will need to be funded through ad-hoc funding at the federal, state and local levels. Further analysis of the size of the overall funding gap and identification of unfunded activities will he possible once priority actions have been identified, cost estimates developed, and responsibilities assigned.
Funding strategy information is described in these sections:
Federal Funding State Funding Local Funding Existing Clean-up Programs Funding Evaluation Criteria
Federal Funding
Since 1972, the U.S. federal government has had a major role in supporting water quality programs, helping many state and local programs achieve national clean water goals. The United States Environmental Protection Agency (USEPA), U.S. Army Corps of Engineers (ACOE), U.S Geological Survey (USGS), US Fish and Wildlife Service (USFWS) and the U.S. Department of Agriculture's (USDA) Soil Conservation Service are federal governmental agencies that are potential sources for RAP implementation funding. Despite recent declines in these federal water quality programs, they are still a good place to begin searching for AOC cleanup funds. The following table lists some of these federal programs and the types of projects that are eligible candidates for funding.
Milwaukee Estuary RAP 8-5

CHAPTER 8: RAP IMPLEMENTATION IMPLEMENTATION STRATEGY
Table 8.1 : Federal and State Programs That Support Water Quality Remediation.
Program
State Revolving Loan Funds (SRFs); $8.4 billion authorized 1989-1994*
EPA State Enforcement Grants (Section 106)*
Non-Point Source Pollution control Grants (Section 319)* Great Lakes National Program Office (GLNPO)'
EPA Water Quality Management Planning Grants'
EPA Research Grants'
Comprehensive Environmental Response, Compensation and Liability Act (CERCLA)
USDA Agricultural Stabilization and Conservation Service cost-share
Progams
Water Resources Development Act; authorized $3 million to the Army Corns of Engineers Costal Zone Management Act (CZMA) grants Urban Forestry grants
Land and Water Conservation Fund
Great Lakes Protection Fund
Great Lakes Commission
Great Lakes Harbors and Bays
SMART
Eligible Projects
Nonpoint source pollution abatement.
Clean Water Act discharge permit development, issuance. monitoring. enforcement. Approved nonpoint source pollution projects.
Feasibility demonstrations, contaminated sediments, habitat restoration and protection and pollution prevention.
Pollution extent, source, and treatment assessment.
Pollution prevention.
Clean-up through SUPERFUND.
Fanners installing best management practices (BMPs).
RAP development and implementation
Costal resource protection and management projects.
50% cost sharing to cities, towns,villages for technical assistance for urban forestry development.
50% matching funds to state, local governments for land acquisition for recreation and preservation.
Plan, study and implement selected projects in the Great Lakes Basin.
Clean up or restoration activities approved in RAPs.
Statutory authority for WDNR to demonstrate contaminated sediment management,
8-6
* Authorized by the U.S. Clean Water Act
Milwaukee Estuary RAP

CHAPTER 8: RAP IMPLEMENTATION IMPLEMENTATION STRATEGY
State Funding
The State of Wisconsin has taken important steps toward funding RAP activities by making RAP-related activities a funding priority. Examples include the establishment and funding of Priority Watershed programs and the Clean Harbors and Bays legislation.
Below are descriptions of several state-level funding options.
State general revenues
User fees and dedicated taxes
Debt financing
Wisconsin Clean Water Fund
State general revenues are appropriate for funding those WDNR activities for which there are no obvious direct funding sources available. Such activities include planning and program development activities, legislative and rule making efforts, research projects for which grant funding is not available, and on-going educational programs. Examples of related funds and accounts include the Priority Watershed and Lakes Fund, the Environmental Repair Fund, and the Stewardship Fund. Although these revenues can play a major role in getting programs started, they are subject to fluctuations in state revenues, and thus may not provide a consistent long-term source of funding.
This option can provide a more reliable source of state funding for specific programs. These revenues are collected from a designated source and separated from general revenue through placement in different accounts. Examples include: administrative fees (certification/licensing, application processing), recreational fee surcharges (hunting and fishing license, stamp fees), vehicle title and transfer fees, sewer use fees, automobile title transfer fees supporting the Nonpoint Source program, stationary source permit fees and mobile source and inspection fees. User fees are often the preferred source of funding for new programs because they establish a link between demand for services and the cost to provide them. Also, this funding source is not subject to fluctuations in annual appropriations. For specific information concerning revenue potential from sources within the Milwaukee River Basin consult the Milwaukee Estuary Area of Concern Preliminary Financial Plan, developed by Apogee Research, Inc. in 1993 for the EPA's Great Lakes National Program Office.
Debt financing, such as general obligation bonds and revenue bonds, is a way to raise up-front capital to support the construction of facilities, toxic hot-spot cleanups, and other facilities and projects which cannot be funded with existing sources.
This fund i s a state revolving loan fund to finance sewage treatment plant upgrades, correction of failing septic systems, control of urban storm water and rural nonpoint source pollution controls. To date rules have not been developed to allow for funding of nonpoint source, urban storm water projects. During the 1991-93 biennium $568,400,000 in revenue bonding authority was made available.
Milwaukee Estuary RAP 8-7

CHAPTER 8: RAP IMPLEMENTATION IMPLEMENTATION STRATEGY
Wisconsin's Stewardship Fund
This fund provides up to 50% matching grants to counties, towns, villages, state agencies, tribal units of governments and nonprofit conservation organizations for habitat protection, stream bank and wetland restoration and land acquisition for development of outdoor recreation. Created by the 1989 Wisconsin legislature, the Stewardship Program provides a 10 year, $250 million fund to enhance Wisconsin's outdoor recreational resources. The Stewardship Program is funded through general obligation borrowing and provides funding for a variety of purposes.
Table 8.2: Wisconsin stewardship programs that may fund RAP activities.
Program Funding/year
Trails $1,000,000
General land acquisition
Natural areas
Habitat restoration areas I $l,500.000
6,700,000
1,000,000
Streambank protection
Recreational development
1,000,000
3,500,000
Local uark aids I 2.250.000
Urban green space
Natural area heritage match
750,000
$500,000
Urban rivers
Waste Reduction and Recycling demonstration grants
Grants for pilot projects are available to counties, municipalities, public entities, businesses and nonprofit organizations to accelerate the demonstration of innovative waste reduction and recycling ideas. The maximum amount awarded will be $150,000, or 50% of total cost of eligible project, whichever is less.
Recycling grants are available to provide financial assistance to local units of government to establish and operate effective recycling programs.
Recycling grants
Local Funding
Local funding has a strong potential to support RAP cleanup efforts because of the close link
$1,900,000
8-8 Milwaukee Estuary RAP

CHAPTER 8: RAP IMPLEMENTATION IMPLEMENTATION STRATEGY
between the funding source and the AOC itself. Citizens are more likely to support tax or fee increases if the funds will enhance their environment.
Many local governments are increasing their budgets for environmental programs. However, the resources required to implement RAP recommendations are beyond the scope of local efforts. To succeed in funding RAP programs, it may therefore be necessary to shift some of the cost from the local level back to the state and federal governments (Glassner, 1991).
Another alternative to local funding is storm water utility fees, which require landowners to take financial responsibility for contaminated water runoff from their land parcels. The fees may be based on the size of a parcel, the amount of impervious surfaces on the lot or other factors that reflect the property's contribution to storm water runoff. Storm water utility fees are based on the "polluter pays" principle theory and act as an incentive to reduce runoff from individual parcels.
Existing Clean-uu Programs
The greatest short-term progress is achieved when the effectiveness and coordination of existing state and federal pollution control programs is improved (Munton, 1988). The RAP will work toward this end by changing spending priorities and improving the efficiency of existing programs. This may include setting priorities for remedial programs in order to determine what an area "can afford to do." Assuring the cost-effectiveness of the cleanup strategy can also help stretch limited dollars. Funding low-cost pollution prevention programs early on, for example, can help assure that expensive cleanups for polluted areas will not need to be repeated. For more information about existing programs, see Chapter 5, Reaching R A P Goals Through Existing Programs.
Funding Evaluation Criteria
Once recommendations have been developed and possible funding sources have been identified, individual revenue options can be evaluated against established evaluation criteria. As a general rule, a financing option is well suited to an activity or use if no other alternative would raise revenues at less cost; if the recipients of the benefits or polluters whose actions necessitate the activity pay a fair share of program costs; and if there are no overriding legal, institutional, or practical impediments standing in the way of its use (USEPA, 1988).
Determining the most appropriate and feasible financing options for a RAP activity requires consideration of a number of specific factors. These criteria can be used to shape RAP funding strategies that are politically, economically, administratively and legally sound. following funding criteria were recommended by the USEPA (1989). RAP implementers should assess the relative importance of these factors before pursuing a funding option. These factors will bc asscsscd as to their relative importance before a decision is reached as to which funding mechanisms should be pursued further.
The
Milwaukee Estuary RAP 8 -9

CHAPTER 8: RAP IMPLEMENTATION IMPLEMENTATION STRATEGY
Table 8.3: U.S. EPA RAP Funding Criteria (U.S. EPA, 1989)
Criteria
Revenue Potential
Equity
Administrative Burden
Legal Feasibility
Political Feasibility
Flexibility
Impact
Definition
A measure of the amount of money that can potentially he raised by a particular option.
How closely the funding burden matches either a polluter's contribution to pollution or the cost of providing a benefit to an affected party.
The relative effort needed to implement an option, including the costs and potential difficulties of setting up new institutions.
Relating to the legal authority to implement an option, such as a new tax or fee.
Reflecting the likelihood of public acceptance of a funding option, including the willingness of those subject to a new charge to pay and the legislative disposition towards various kinds of options.
The ability to use revenues from particular funding mechanisms for various purposes.
Relating to whether a financing mechanism creates incentives for desirable behavior or places undue financial burden on particular individuals.
8-10 Milwaukee Estuary RAP

CHAPTER 9: MONITORING STRATEGY RECOMMENDED APPROACH
CHAPTER 9: Monitoring Strategy
The Milwaukee River Basin monitoring strategy provides a framework for evaluating the biological, chemical and physical characteristics of these waterways with respect to ecosystem integrity and designated beneficial uses. Several monitoring activities are detailed in Chapter 7. For a list of R A P monitoring recommendations, see the table on page 7-2.
The goal of this plan is to lay the foundation for monitoring efforts that have been identified as high priority, given the available data to date. Data collected via this monitoring strategy will help us achieve these objectives:
1)
2)
3)
More precisely delineate impaired beneficial uses of Milwaukee River Basin waterways.
Document trends and status of waterways, lending to a proactive approach to pollution control.
Evaluate the effectiveness of RAP work.
This monitoring strategy will move us toward achieving RAP goals (Chapter 4). It will also enable us, to gain knowledge that may transfer to other RAPs in Wisconsin or other states.
This chapter describes the monitoring strategy in these sections:
Recommended Approach Monitoring and RAP Goals Monitoring Strategy
Milwaukee Estuary RAP 9-1

CHAPTER 9: MONITORING STRATEGY RECOMMENDED APPROACH
Recommended Approach
As the knowledge of the complexities of the Milwaukee River Basin waterways has evolved, so has the challenge to manage them in a way that balances environmental protection with human uses. This section discusses how the monitoring strategy approach has evolved to better address this challenge. It also describes the schedule and method for data collection as well as the importance of reference sites. Finally, delisting impaired beneficial watenvay uses, the ultimate goal of RAP monitoring, is discussed.
Strategy Evolution
The monitoring strategy approach has evolved from a reactive, site-focused approach to a proactive one that encompasses ecosystem considerations. This shift will enable scientists to move from a qualitative to a quantitative assessment of watenvay pollution.
An integrated approach ensures that environmental data will be collected and managed for multiple uses. Additionally, more precise assessments will facilitate a more efficient use of resources for remedial work. Scientists can determine, for example, areas that do not require treatment.
The strategy must remain flexible, responding to new situations, advances in knowledge, and new technologies.
Data Collection
Schedule Wisconsin's Water Quality Management Plans are updated every 5 years. The RAP, an amendment to the state's Water Quality Management Plans, will also follow a five-year interval for intensive monitoring. 1993 was the Milwaukee basin's assessment year, 1998 will be the next year of focus for the Milwaukee basin.
Reference Sites Generally, a reference site is a site relatively unimpacted from inputs of toxic contaminants, with features similar to the study area, from which we can gauge the effectiveness of future pollution management practices. The use of reference sites for sediment assessment is described on page C-6.
Upstream reaches above the AOC, as well as streams and harbors from other river basins, will be monitored to represent the range of habitat types found in the AOCs. Sites will be selected such that they provide information for more than one AOC if possible. The Milwaukee Estuary and Sheboygan River AOCs could probably share reference sites on the East and North Branch of the Milwaukee River, the Sheboygan River, and Kewaunee River and harbor. The Kewaunee estuary is proposed as a reference site because it may represent a less polluted major harbor. While it may not represent the desired end point for the RAPs, it could provide a comparison to a harbor system that has ongoing urban effects, but minimal synthetic pollutants e.g. PCBs and PAHs. An additional consideration will bc to compare AOC data to all other AOCs as clean-up actions proceed. This will enable a relative comparison of how the systems respond to different implementation projects. To date, RAP participants have not
9-2 Milwaukee Estuary RAP

CHAPTER 9: MONITORING STRATEGY RECOMMENDED APPROACH
reached a consensus on a particular reference site to use for the Milwaukee AOC
Delisting lmpaired Waterway Uses
Long term trend monitoring activities will continue through implementation to measure progress, and insure that beneficial uses are restored.
The delisting criteria for the identified impaired uses is contained in Table 9.1. For delisting many of the biota-associated impairments, comparisons are made with biota from a suitable control or reference site. The triad assessment approach will be used to quantify condition in remediated areas by comparing to reference site conditions. It must be recognized that conditions created by human modifications may never be completely removed or reversed to achieve environmental conditions found at an unimpacted reference site. Professional judgements will be made to determine conditions that represent the optimum biodiversity that can be restored in the urbanized AOC.
Milwaukee Estuary RAP 9-3

CHAPTER 9: MONITORING STRATEGY MONITORING AND RAP GOALS
Monitoring and RAP Goals
The monitoring strategy described in the next section will produce data that supports AOC water quality restoration and maintenance activities. More specifically, monitoring supports the ultimate RAP goal of delisting impaired beneficial AOC waterway uses. This section describes the role that monitoring plays in each of the following restoration steps.
1) Define Data Needs 2) Prioritize Data Needs 3) Fill Data Gaps 4) 5) Delist Use Impairments 6) Maintain Unimpaired Waterway Uses
Propose and Track RAP Recommendations and Existing Programs
,
9-4 Milwaukee Estuary RAP

CHAPTER 9: MONITORING STRATEGY MONITORING AND RAP GOALS
Define Data Needs
The following section outlines the data needed to quantify, or further define, each of the impaired beneficial uses of the Milwaukee Estuary AOC. In some cases adequate information defining impairments already exists.
The most efficient use of monitoring funding in the Milwaukee River Basin is to coordinate data collection efforts of all involved agencies, such as the USGS, the WDNR, MMSD, SEWRPC and the EPA. See Chapter 5, Reaching RAP Goals Through Existing Programs, for a description of ongoing Basin-wide monitoring activities. The process has begun to assemble and analyze this data to identify additional monitoring needs. Cooperation among all data collectors and users is essential.
Restrictions on Fish and Wildlife Consumption: There is an established protocol to evaluate the necessity for consumption advisories. The AOC is regularly monitored for tissue contaminant analysis of migratory species (e.g. salmon and trout). An assessment of resident sport fish and forage is recommended during Basin assessment years to track tissue contaminant levels.
Degraded Fish and Wildlife Populations:
Fish community populations and species composition. The river systems in the AOC have been disturbed since some historic baseline condition. The Milwaukee, Menomonee and Kinnickinnic Rivers are probably not equal in their ability to recover from disturbance and restore impaired uses. The density and distribution of representative species will differ from one system to another (Mike Coshun, 1992). A yearly fish community assessment is recommended to track trends in community structure over time.
An important factor in developing a fisheries plan for these systems will be an understanding of the potential recolonization processes in each river. It will be necessary to identify refugia for important fish species in the Milwaukee River Basin or a similar system if none exist. Furthermore, their ability to recolonize remediated areas needs to be studied (i.e. identify barriers).
Fish health assessment. An assessment of the general health status of one or two species needs to be conducted. Representative resident species common to riverine habitat and estuarine habitat need to be chosen to reflect the difference in these habitat types. These species will be analyzed for each habitat type to represent different trophic levels or ecological niches.
Degraded Wildlife Populations: A Basin-wide survey of existing wildlife populations and available habitat should be conducted to identify the wildlife within the AOC and areas outside the AOC from where recolonization can occur. Besides habitat restrictions, toxic contaminants can degrade wildlife populations. The extent to which this may occur has not been determined in the Milwaukee Estuary AOC.
Milwaukee Estuary RAP 9-5

CHAPTER 9: MONITORING STRATEGY MONITORING AND RAP GOALS
Fish Tumors or Other Deformities:
To date, no contaminant related fish tumors have been documented within the Milwaukee Estuary AOC. However, Banmann et. al. (1991) found a relationship between elevated concentrations of PAHs in sediment, (comparable to those found in the AOC) and the incidence of fish tumors in other areas.
A tumor survey is a component of the fish health assessment and would be part of that study. Reference sites will be studied to establish natural incidence rates of fish tumors in representative resident species.
Bird or Animal Deformities or Reproductive Problems:
Wildlife tumors: To date, no studies have documented contaminant related wildlife tumors in the AOCs.
CDF Study: The Confined Disposal Facility (CDF) provides aquatic and upland habitats suitable for many species of wildlife. However, a study by Dobos et.al. (1991) found a bioaccumulation of contaminants in aquatic organisms from a CDF at Thunder Bay, Ontario. Therefore, a study is required to investigate ways of minimizing contaminants in the CDF from re-entering the ecosystem through various routes, including the biota. Assuming similar sediment quality in the CDF and the Milwaukee Estuary, fish in the CDF may provide a representative group for study.
Loss of Fish and Wildlife Habitat: Use a habitat evaluation procedure to evaluate fish and wildlife habitat. A complete habitat assessment is needed to determine the ability of the study area to sustain a diverse wildlife community appropriate for an urban area. Efforts should be directed to identifying potential habitat enhancement and restoration projects and ways to develop the habitat.
Degradation of Benthos: Benthic invertebrates have been shown to be good indicators of pollutant stress on aquatic systems. They are relatively sessile, have specific habitat and food requirements and have been shown to be sensitive to a wide range of water borne and sediment pollutants including PCBs. Invertebrate community assessment data will be used as a primary indicator of sediment quality and for tracking the effectiveness and progress of remediation techniques.
Eutrophication or Undesirable Algae: Eutrophication is caused by excessive phosphorus and nitrogen loading and increased temperatures. Nutrient loadings from non-point and point sources will be monitored.
Degradation of Phytoplankton and Zooplankton Populations: Phytoplankton and zooplankton communities provide considerable insight into water quality and readily reflect changes that arc difficult to discern from chemical monitoring only. MMSD collects plankton samples from several outer harbor locations and near shore Lake Michigan. Sample analysis completion is addressed by the recommendation on page 7-9.
Milwaukee Estuary RAP

CHAPTER 9: MONITORING STRATEGY MONITORING AND RAP GOALS
Restrictions on Drinking Water consumution and Odor Problems: The recent outbreak of cryptosporidiosis in Milwaukee has elevated concern over waterborne illness, and general safety of water supplies and surface water contact. Cryptosporidiosis is caused by Cryptosuoridinm. a protozoan. Another protozoan, Giardia, causes similar problems.
In an effort to learn more about these types of organisms to enable us to develop management activities to reduce the threat of exposure a statewide monitoring plan is being established by the WDNR. Data collected will be used to identify background concentrations associated with different land uses, seasons, stream flow conditions and habitats. It will also serve to better assess Cryptosuoridium and Giardia concentrations in surface waters, and raw and finished water at drinking water systems having surface water sources.
In addition to the statewide effort, the City of Milwaukee and the Department of Health and Social Services has initiated an intensive monitoring program within the City of Milwaukee.
Beach Closings and Recreational Restrictions: City of Milwaukee Health Department samples water from Bradford, McKinley, and South Shore beaches from late spring to early autumn for coliform bacteria analysis. Furthermore, numerous stream sites, inner and outer harbor, and near shore Lake Michigan are sampled for fecal coliform bacteria by MMSD during their water quality sampling season. The current monitoring is adequate to assess this impaired use.
Restrictions on Dredging Activities: Dredging restrictions exist in the Milwaukee Harbor. Some harbor sediments were found to be "highly polluted" and must be disposed of in a CDF, according to EPA guidelines. See Chapter 6, Contaminated Sediment Management Strategy, f o r specific information on sediment monitoring activities.
Degraded Aesthetics: Through the implementation of remedial activities aesthetics will improve. For example, as overall water quality improves, nuisance algal blooms and the subsequent degradation of aesthetics will cease to occur. Changes in aesthetics will be documented as ancillary data during other monitoring activities and will not require any additional monitoring.
Milwaukee Estuary RAP 9-1

CHAPTER 9: MONITORING STRATEGY MONITORING AND RAP GOALS
Prioritize Data Needs
Given our present knowledge of the Milwaukee River/Estuary, monitoring efforts should focus on the following priority areas.
Assemble sediment data to identify, prioritize and remediate contaminated sediment deposits, and identification of sources.
Understanding of the algal, nutrient and dissolved oxygen dynamics within the AOC and the significance of upstream loadings.
Evaluate various locations to be used as control and reference sites for the AOC and specific estuary tributary segments.
Develop appropriate criteria for delisting impaired beneficial uses
As technology changes and our knowledge of the Milwaukee River system increases monitoring priorities will evolve.
Milwaukee Estuary RAP

CHAPTER 9: MONITORING STRATEGY MONITORING AND RAP GOALS
Fill Data Gaps
Once data deficiencies have been identified through monitoring, needed data should be collected according to priority. Data collectors will conduct a literature survey and use cost-effective methods such as the Triad Approach, described on page C-2.
Pmpose and Track RAP Recommendations and Existing Programs
When proposing remedial actions, data from past remedial projects reveals which remedial methods arc most successful and most efficient. In reviewing such data, we can learn from past actions, giving future projects a better chance for success.
As remedial work progresses, monitoring serves as a continuous, flexible nature of RAP work. Tracking data may reveal that the chosen remedial method is not working, or that remediation is no longer needed because restoration is complete. In any case, monitoring helps project coordinators identify the most appropriate remedial method(s).
tool. Such tracking lends to the
Delist Use Jmpairments
When is restoration complete? impaired beneficial uses.
The table below is a guide to measuring and attaining restoration progress. It lists each use impairment and the corresponding IJC delisting guidelines and RAP delisting criteria. It also lists monitoring requirements with which to delist use impairments. These criteria may be quantitative and/or qualitative. Many criteria are quantitative, giving an accepted numerical level for a contaminant; qualitative criteria, like best professional judgement, are prevalent as well.
Restoring the quality of a waterway means delisting all of its
Milwaukee Estuary RAP 9-9

CHAPTER 9: MONITORING STRATEGY MONITORING AND RAP GOALS
Table 9.1: Delisting Criteria and Monitoring Needs.
Use Impairment
Restrictions on fish and wildlife consumption
Degradation of fish and wildlife populations
Fish tumors or other leformities
IJC Delisting Guideline
When contaminant levels in fish and wildlife populations do not exceed current standards, objectives or guidelines, and public health advisories are not in effect for human consumption of fish or wildlife.
When environmental conditions support healthy, self-sustaining communities of desired fish and wildlife at predetermined levels of abundance that would he expected from the amount and quality of suitable physical, chemical and biological habitat present. In the absence of community structure data, this use will be considered restored when fish and wildlife bioassays confirm no significant toxicity from water column or sediment contaminants.
When the incidence rates of fish tumors or Other deformities do not exceed rates at unaffected control sites and when survey iata confirm the absence of neoplastic or ?re-neoplastic liver tumors in bullheads or ;uckers.
RAP Delisting Criteria
Same as the IJC delisting guideline.
Toxics: When sediment assessment by the sediment quality triad at a sample site does not statistically differ from reference site@) conditions. Ecosystem : When environmental conditions support healthy, self- sustaining communities of desired fish and wildlife at levels of abundance that would be expected from the amount and quality of suitable physical, chemical and bioloeical habitat oresent.
Toxics: Same as IJC delisting guidelines. Ecosystem: When sediment assessment by the sediment quality triad at a sample site does not statistically differ from reference site(s) conditions.
Monitoring Requirements
Fish collections for contaminant analysis, including fillets and whole fish (see A&M 6).
-Conduct fish community assessment (A&M 4) -Conduct fish health assessment (A&M 5) -Test sediment toxicity (A&M 12) - Protect wildlife from CDF contaminants (A&M 7)
~~
-Conduct fish health assessment (A&M 5) -Test sediment toxicity (A&M 12)
9-10 Milwaukee Estuary RAP

CHAPTER 9: MONITORING STRATEGY MONITORING AND RAP GOALS
or reproductive problems
Degradation of benthos
activities
Eutrophication or undesirable algae
Milwaukee Estuary RAP
IJC Delisting Guideline
When the incidence rates of deformities or reproductive problems in sentinel wildlife species do not exceed background levels in inland control populations.
When the benthic macroinvertebrate community structure does not significantly diverge from unaffected control sites of comparable physical and chemical characteristics. Further, in the absence of community structure data, this use will be considered restored when toxicity of sediment-associated contaminants is not significantly higher than controls.
When contaminants in sediment do not exceed standards, criteria or guidelines such that they are restrictions on dredging or disposal activities.
When there are no persistent water quality problems (e.g. dissolved oxygen depletion of bottom waters, nuisance algal blooms or accumulation, decreased water clarity, etc.) attributed to cultural eutrophication.
RAP Delisting Criteria
Toxics: When sediment assessment by the sediment quality triad at a sample site does not statistically differ from reference site(s) conditions. Ecosystem: Same as IJC delisting guidelines.
Toxics: When contaminant levels in macroinvertebrates are not significantly different from unaffected control sites. Ecosystem: When environmental conditions support healthy communities of desired macroinvertebrates at levels of abundance that would be expectedd from the amouont and quality of suitable habitat present.
Same as IJC delisting guideline.
Same as the IJC delisting guideline.
Monitoring Requirements
-Monitor wildlife for toxicants (A&M 8) -Test sediment toxicity (A&M 12)
-Test sediment toxicity (A&M 12) -Conduct macroinvertebrate population analysis (A&M 3)
Collect sediment quality data via bulk chemistry testing. Test for critical pollutants (PCBs and PAHs) and metals (A&M 11).
Collect water quality data consisting of: water
temperature, dissolved oxygen, turbidity, conductivity, hardness, nutrients, Chlorophyll a and solids (A&M 1).
9-1 1

CHAPTER 9: MONITORING STRATEGY MONITORING AND RAP GOALS
Same as the IJC delisting guideline.
Use Impairment
Beach closings/ recreational restrictions
Degraded aesthetics
Degradation of phytoplankton and zooplankton populations
Loss of fish and wildlife
-Collect samples for fecal coliform and streptococcus bacteria (A&M 1).
IJC Delisting Guideline
When waters, which are commonly used for total-body contact or partial-body contact recreation, do not exceed standards, objectives, or guidelines for such use.
When the waters are devoid of any substance which produces a persistent objectionable deposit, unnatural color or turbidity, or unnatural odor (e.g. oil slick, surface scum).
When phytoplankton and zooplankton community structure does not significantly diverge from unaffected control sites of comparable physical and chemical characteristics. Further, in the absence of community structure data, this use will be considered restored when phytoplankton and zooplankton bioassays confirm no significant toxicity in ambient waters.
bioassays confirm no significant toxicity in ambient waters.
When the amount and quality of physical, chemical, and biological habitat required to meet fish and wildlife management goals have been achieved and protected.
RAP Delisting Criteria Monitoring Requirements
Same as the IJC delisting guideline. -Collect water quality data consisting of: water temperature, dissolved oxygen, conductivity, hardness, nutrients, solids and bacteria (A&M 1).
9-12 Milwaukee Estuary RAP

CHAPTER 9: MONITORING STRATEGY MONITORING AND RAP GOALS
Maintain Unimpaired Watcnvay Uses
Once AOC waterway quality is restored, monitoring will facilitate maintenance of that quality. Regular monitoring, as described in the monitoring strategy below, will reveal future waterway degradation in a timely manner. This will allow for proactive actions and minimal remedial action, once again, saving time and money.
Milwaukee Estuary RAP 9-13

CHAPTER 9: MONITORING STRATEGY MONITORING STRATEGY
Monitoring Strategy
The strategy described below is a plan for thoroughly monitoring AOC waterways to support water quality restoration and maintenance. will contribute to, or furnish, the data necessary to establish baseline and/or pre-remediation conditions. Some revisions and adjustment can be made along the way; however, a complete re-evaluation (using existing data) of the components should be done every 5 years to determine its continued inclusion in the surveillance and monitoring effort. This strategy recommends monitoring the following components.
Many of the efforts outlined when completed for the first time
Water Quality Ambient Water Toxicity Sediment Fish Community Fish Tissue Contamination Wildlife Community Plankton Community Structure
Water Quality
Water column monitoring efforts will be undertaken primarily to identify (not necessarily quantify) loadings of critical pollutants, water quality variables known to influence the bioavailability or toxicity of pollutants, and detect loadings of compounds that other efforts have identified as causes for concern. Four fixed station sites will be monitored in the AOC yearly, as described in the RAP recommendation on page 7-6.
Coordination with existing data collection activities will provide the necessary data with minimal additional effort. For example, MMSD collects water samples for all variables except critical pollutants at numerous stations within and upstream of the AOC and into Lake Michigan. Therefore, incorporation of critical pollutant analysis into MMSD's monitoring activities is the most cost effective means of data collection
Ambient Water Toxicity
Chronic water toxicity will be evaluated annually to assess the additive, synergistic and antagonistic effects of naturally occurring chemicals, point source inputs and chemicals released from sediment
deposits. Tcsting will include Ceriodaphnia dubia and fathead minnows (Pimephales promelas) and should include both low and high flow periods. Provisions to attempt identification of toxicants accounting for observed chronic toxicity arc to be included. If chronic toxicity is observed, the EPA's chronic toxicity evaluation procedures will be employed to begin determination of causative compounds.
One potential source for ambient water toxicity data is the current WPDES biomonitoring program. Each discharger that is required to conduct chronic toxicity testing on their discharge must include a receiving. water control exposure. This data is easily assembled and could be substituted where sufficient data exists.
9-14 Milwaukee Estuary RAP

CHAPTER 9: MONITORING STRATEGY MONITORING STRATEGY
Sediment
Sediment toxicity assessments will be conducted every 3 years for purposes of detecting the effects of the complex interactions between chemicals present and chemicals not typically analyzed. A test battery includes chronic exposure with Chironomus tentans and an acute exposure of Hyalella azteca. Endpoints to be evaluated include survival for both species with biomass production and mentum deformity for C. tenfans. See the R A P recommendation on page 7-30 for details.
Benthic invertebrate populations will be assessed throughout the AOC during the Basin assessment year. Benthic invertebrate community population structure and biomass are to be evaluated. If species from the Chironomus genus are present, incidence of mentum deformities will be assessed as part of the species identification process. Invertebrate samples will include benthic grabs collected using standardized procedures. In addition, Hester-Dendy artificial substrate samplers will be deployed at each site for characterization of the epi-benthic community. Also see the R A P recommendation on page 7-1 I .
Depositional zones will be identified in order to continually evaluate changes in sediment quality resulting from downstream transport. Sediment traps will be analyzed for critical pollutants and particle size every 3 years. More frequent analyses may he appropriate immediately prior to and following remediation of contaminated sediment sites. For additional information, see Chapter 6, Contaminated Sediment Management Strategy and the R A P recommendations on pages 7-24 and 7-28.
Milwaukee Estuary RAP 9-15

CHAPTER 9: MONITORING STRATEGY MONITORING STRATEGY
Fish Community Evaluation
Degraded fish populations and fish consumption advisories are identified use impairments in the AOC. The first evidence of identifiable contaminant associated stress in fish populations are often exhibited in changes in fish community structure (composition and populations) and the overall health of specific populations or individuals. Recognizing the significance and importance of the fish community in each AOC, the following activities provide the necessary data to continually assess the status of the fish community and adjust activities in response to observed changes. Also see the R A P recommendation on page 7-1.
Community Structure An evaluation of the fish Community will be conducted in each AOC during the Basin assessment year with follow-up sampling the subsequent year. Stations will represent important or major habitat types within the AOC. From this information, basic measures of community richness, diversity, and evenness will be determined and be assessed for changes over time using appropriate techniques.
Fish Health Assessment A Fish Health Assessment (FHA) will be conducted on the selected resident species during each Basin assessment year. FHA is a standardized procedure to assess the general health of a population using a necropsy procedure on live caught fish. The general health of one or two representative resident species will be examined in the Milwaukee Estuary AOC. Also see the HAP recommendation on page 7-15.
Fish Tissue Contamination
This monitoring effort will provide these items:
Data to evaluate the short-term bioavailabilty of bioaccumulating toxic substances
Data to evaluate contaminant levels in respect to the fish consumption advisory and potential food chain magnification
Identification of substances present in fish tissue that have not previously been identified
Data helpful in identifying potential sources of Contamination (congener specific PCBs)
Two levels of effort for tissue contaminant analysis will be undertaken at two stations in the AOC. The first of these will be coordinated with the health assessment conducted during the Basin assessment year. The analysis will be conducted on both whole fish for each species and fillets for the designated sport fish species. See the R A P recommendation on page 7-1 7 for further detail.
9-16 Milwaukee Estuary RAP

CHAPTER 9: MONITORING STRATEGY MONITORING STRATEGY
Wildlife Community Evaluation
The Milwaukee Estuary AOC is a highly urbanized area with many fragmented habitats. Diverse wildlife exists in a substantial number of isolated environmental comdors located throughout the county park system. A R A P recommendation to link these "island" com'dors is on page 7-36.
The Confined Disposal Facility (CDF) located on Milwaukee's Lakefront has a diverse wildlife population. This CDF contains contaminated sediment that are known to affect wildlife (Dobos, et al, 1991). A R A P recommendation that addresses CDF concerns begins on page 7-20. Future wildlife monitoring efforts will include habitat assessments and wildlife inventories throughout the AOC.
Plankton Community Structure
This monitoring effort is to focus on assembling data on the integrated effects of water quality and subsequent changes at the foundation of the food chain. During each Basin assessment year, phyto and zooplankton will be collected during the winter, early spring and mid-late summer at each of 10 sites within the AOC. Phytoplankton and zooplankton will be identified to the lowest taxonomic level appropriate and individual species populations estimated. The MMSD has more than ten years of samples collected that provides information about phytoplankton and zooplankton population community structure in the outer harbor and near shore Lake Michigan area. A R A P recommendation to unify sampling efforts by MMSD and others begins on page 7-9.
Milwaukee Estuary RAP 9-17


GLOSSARY
G LOSS ARY
This glossary defines technical terms and describes concepts and organizations named in this document. Also see the List of Acronyms.
Abatement
Aerosol contamination
Action Lcvcl
Acute Toxicity
Addivity
Advanced Wastewater TEatment
Agricultud Conservation Program (ACP)
Air Pollution
Algae (aka Phytoplanldon)
Ammonia
Actions which will capture and retain, or treat the pollutant at or near the point of origin, prohibiting its downstream transport. It also includes all actions which capture, treat, or otherwise control the contaminant after it has been introduced into the sewers, drainage- ways, waterways, or sediments.
Contaminants dispersed in a suspension of fine particles or droplets such as can result from the spraying of pesticides or paints etc.
Concentration of a contaminant in fish or wildlife which would trigger issuance of a Fish or Wildlife Consumption Advisory.
Any poisonous effect produced by a single, short-term exposure to a chemical that results in a rapid onset of severe symptoms.
The characteristic property of a mixture of toxicants that exhibit a cumulative toxic effect equal to the arithmetic sum of the individual toxicants.
The highest level of wastewater treatment for municipal treatment systems. It requires removal of all but 10 parts per million of suspended solids and biological oxygen demand and/or 50% of the total nitrogen. Advanced wastewater treatment is also known as tertiary treatment."
A federal cost-sharing program to help landowners install measures to conserve soil and water resources. ACP is administered by the Agricultural Stabilization and Conservation Service of the U.S. Department of Agriculture through the Agricultural Conservation Program.
Contamination of the atmosphere by human activities
A group of microscopic, photosynthetic water plants. Algae give off oxygen during the day as a product of photosynthesis and consume oxygen during the night as a result of respiration. Nutrient-enriched water increases algae growth.
A form of nitrogen (NH,) is unionized ammonia found in human and animal wastes. Ammonia is toxic to aquatic life depending upon pH, temperature and ionic strength of the water. Ammonium (NH,) is ionized ammonia found in human and animal waste.
Milwaukee Estuary RAP GL-1

GLOSSARY
Anaerohic
An ti deg radati o n
Area of Concern
Areawide Water Quality Management Plans (208 Plans)
Amclor
Assimilative Capacity
Arsenic
Atmospheric Deposition
Availability
Bacteria
Balanced Community
Basin
Basin Plan
Without oxygen
A policy which states that water quality will not be lowered below background levels unless justified by economic and social development considerations.
Areas o f the Great Lakes identified by the International Joint Commission (IJC) as having serious water pollution problems
A plan to document water quality conditions in a drainage Basin and make recommendations to protect and improve Basin water quality. Each Basin in Wisconsin must have a plan according to section 208 of the Clean Water Act.
A Monsanto Chemical Company trade name for various types of PCBs. Presented as a four digit number with the first two digits listing the number of carbons in the biphenyl molecule, while the last two digits represent the weight percentage of chlorine atoms.
The ability of a water body to purify itself of pollutants without detriment to fish and aquatic life or other beneficial uses of the water body.
A highly poisonous heavy metal having three allotropic forms. Use of arsenic and its compounds includes insecticides, weed killers and alloys.
Pollutants/contaminants associated with particulate deposition resulting from air emissions and long distance atmospheric transport that either settles directly onto the surface water or indirectly onto land surfaces and then transported to the water body with storm water runoff.
The degree to which toxic substances or other pollutants that are present in sediments or elsewhere in the ecosystem arc available to affect or be taken up by organisms. Some pollutants may be "bound up" or unavailable because they are attached to clay particles or are buried by sediment. The amount of oxygen, pH, temperature, and other water conditions my affect availability.
Single-cell, microscopic organisms. Some can cause disease, and some are important in the stabilization of organic wastes.
A community that supports an abundant and usually diverse population of forage fish, game fish, and other aquatic biota (zooplankton, phytoplankton, macroinvertebrates).
See Drainage Basin.
GL-2
See Areawide Water Quality Management Plan
Milwaukee Estuary RAP

GLOSSARY
An investigation to measure the depths of water or sediment in water bodies (i.e. rivers, lakes and oceans).
Uses that maintain the chemical, physical and biological integrity of an ecosystem.
The organisms living in or on the bottom of a lake or stream.
Bathymetric survey
Beneficial Uses
Benthic Organisms (Benthos)
Best Available Technology (BAT)
Best Management Practice (BMP)
Best Practicable Control Technology ( B W
Bioaccumulation
Bioassay
Bioavailability
Biochemical Oxygen Demand (BOD)
Bioconcentration
Biodegradable
Effluent limitations guidelines and standards that represent the best existing performance in an industrial category,
The most effective, practical measures to control nonpoint sources of pollutants that run off from land surfaces.
Effluent limitations guidelines and standards that are based on the average of the best existing performance by facilities within an industrial category.
The uptake and retention of substances by an organism from its surrounding medium and from its food. Chemicals move through the food chain and tend to end up at higher concentrations in organisms at the upper end of the food chain such as predator fish, or in people or birds that eat these fish.
A test for pollutant toxicity. Tanks of fish or other organisms are exposed to varying doses of wastewater effluent; lethal doses of pollutants in the effluent are thus determined.
The degree to which toxic substances or other pollutants that are prcscnt in sediments or elsewhere in the ecosystem are available to affect or be taken up by organisms. Some pollutants may be "bound up" or unavailable because they are attached to clay particles or are buried by sediment. The amount of oxygen, pH, temperature and other conditions in the water can affect availability
A measure of the amount of oxygen consumed in the biological processes that break down organic matter in water. BOD, is the biochemical oxygen demand measured in a five day test. Carbonaceous BOD is the result of the same test conducted in a shorter time period. The greater the degree of pollution by organic matter the higher the BOD.
The process by which there is a net accumulation of a chemical directly from water into aquatic organisms resulting from simultaneous uptake (e.g. by gill or epithelial tissue) and elimination (contrast with bioaccnmulation which is a function of the food chain).
Waste which can be broken down by bacteria into basic elements Most organic wastes such as food remains and paper arc biodcgradable.
Milwaukee Estuary RAP GL-3

GLOSSARY
Bioturbation
Biota
Buffer Strips
Bulkhead Lines
Carcinogenic
Categorical Limits
Chlorination
Chloroganic Compounds (Chloroqanics)
Chlorophyll-a
Chronic Toxicity
Circle of Poison Legislation
Clem Sweep Programs
Clean Water Act
The movement and metabolism of benthic invertebrates in sediments which can affect the flux of nutrients/contaminants to the water column.
All living organisms that exist in an area
Strips of grass or other erosion-resisting vegetation between disturbed areas and a stream or lake.
Legally established lines which indicate how far into a stream or lake an adjacent property owner has the right to fill. Many of these lines were established many years ago and allow substantial filling of the bed of a river or bay. Other environmental laws may limit filling to some degree.
The ability of a chemical to cause cancer.
The basic level of treatment required for all point source discharges. For municipal wastewater treatment plants this is secondary treatment (30 mg/l effluent limits for SS and BOD). For industry the level is dependent on the type of industry and the level of production. Effluent limits more stringent than categorical may he required if necessary to meet water quality standards.
The application of chlorine to wastewater to kill bacteria and other organisms.
A class of chemicals which contain chlorine, carbon and hydrogen Generally refers to pesticides and herbicides that can he toxic. Examples include PCB's and pesticides such as DDT and dieldrin.
A green pigment in plants used as an indicator of plant and algae productivity.
Injurious or debilitating effects of long-term exposure of nonlethal toxic chemicals to organisms. An example of the effect of chronic toxicity could be reduced reproductive success.
Federal legislation proposed to eliminate or reduce the export of pesticides banned in the U.S. in order to prevent their return in or on goods imported to this country.
Local community efforts to collect old or unwanted household products which are toxic or contain contaminants (i.e. pesticides, fertilizers, paint, oil, gasoline, etc.). Toxic products, once collected, are taken to an appropriate facility for proper disposal.
See Public Law 92-500.
GL-4 Milwaukee Estuary RAP

GLOSSARY
A wastewater collection system that carries both sanitary sewage and storm water runoff. During dry weather, combined sewers cany only sanitary sewage to the treatment plant.
During heavy rainfall, combined sewers become swollen with storm water and sewage. If the treatment plant cannot process the added flow, untreated sewage is discharged to surface waters via a treatment plant bypass known as a combined sewer overflow.
A Wastewater Program that identifies actions municipal treatment facilities should take to ensure they continue to meet existing and future effluent limits.
Combined Sewers
Combined Sewer Overflow (CSO)
Compliance Maintenance
Confined Disposal Facility (CDF)
Congeners
Conservation Tillage
Contaminant
A structure built for the containment and disposal of contaminated dredged material.
Chemical compounds that have the same molecular composition, but have different molecular structures and formula. For example, the congeners of PCB have chlorine located at different spots on the molecule. These differences can cause differences in the properties and toxicity of the congeners.
Planting row crops while disturbing the soil only slightly. Therefore, a protective layer of plant residue stays in the surface and erosion is decreased.
Some substance that has been added to water that is not normally present. This is different from a pollutant, as a pollutant suggests that there is too much of the substance present.
Consumption Advisory A health warning issued by a public agency that recommends people limit the fish they eat from some rivers and lakes based on levels of toxic substances found in the fish.
Refers to suspended solids, fecal coliform, biochemical oxygen demand, and pH as opposed to toxic pollutants.
Conventional Pollutant
Criteria See Water Quality Criteria.
A chlorinated hydrocarbon insecticide that has been banned because of its persistence in the environment.
Designated Management Agencies
Any agency designated by an Areawide Water Quality Management Plan to implementing specific plan recommendations. This may be done through direct activities of the designated management agency or through delegation to other agencies or units of government.
Holding ponds for temporary storage of storm water where sediments are allowed to settle out before discharge into receiving waters -- usually used in association with construction sites or areas of land disturbance.
Detention Basins
Milwaukee Estuary RAP GL-5

GLOSSARY
Dioxin (2,3,7,8- tetr;\chlomdihcnzo-p- dioxin)
A chlorinated organic chemical which is highly toxic.
Disinfection A chemical or physical process that kills organisms which cause disease, Chlorine is often used to disinfect wastewater.
Dissolved Oxygen (DO)
Oxygen dissolved in water. Low levels of dissolved oxygen cause bad smelling water and threaten fish survival. Low levels of dissolved oxygen are often due to inadequate wastewater treatment. The Wisconsin Department of Natural Resources considers 5 ppm DO necessary to support a balanced community of fish and aquatic life.
Drainage Basin
Dredging . Ecosystem
Effluent
Effluent Limits
Emission
Endangered Resource
Endangered Species
Environmental Corridor
The area of land from which water drains into a major water body. E.g. Milwaukee River Basin, Great Lakes Basin, Lake Michigan Basin.
Removal of sediment from the bottom of water bodies.
The interacting system of a biological community and its nonliving surroundings.
Solid, liquid or gas wastes (byproducts) which are disposed on land, in water or in air. As used in the RAP generally means wastewater dischargcs.
These establish the maximum amount of a pollutant that can be discharged to a receiving stream. Limits depend on the pollutants involved, the water quality standards that apply for the receiving waters, and the characteristics of the receiving water.
A direct (smokestack particles) or indirect (busy shipping center parking lot) release of any contaminant into the air.
A natural resource, usually plant or animal, whose population has been sufficiently depleted to consider it in danger of extinction. Such resources should be closely monitored and protected by state environmental agencies.
A species on the Wisconsin Endangered Species list is any whose continued existence as a viable component of the state's wild animals or wild plants is designated by the WDNR to be in danger of extinction on the basis of scientific evidence.
Environmentally sensitive areas within sewer service areas which are not eligible for sewer development. Environmental corridors may include wetlands, shorelands, floodway and floodplains, groundwater recharge areas, and other sensitive areas.
GL-6 Milwaukee Estuary RAP

GLOSSARY
The federal agency responsible for enforcing federal environmental regulations. The Environmental Protection Agency delegates some of its responsibilities for water, air and solid waste pollution control to state agencies.
A fund established by the Wisconsin Legislature to deal with abandoned landfills and other sites (e.g. dry cleaning facilities, chrome-plating shops, etc.) that have caused soil and groundwater contamination. Funding is only used when there i s not a cooperative Party.
The study of diseases as they affect populations rather than individuals. Factors evaluated include the distribution and incidence of a disease, mortality and morbidity rates, and the relationship of climate, age, sex, race, and other factors EPA uses such data to establish national air quality standards.
An area where the river's mouth meets a larger water body and the currents mix.
Environmental Protection Agency @PA)
Environmental Repair Fund (ERF)
Epidemiology
Estuary
Eutrophic
Eutrophication
Facility Plan
Fecal Coliform
Fluomthene
Fly Ash
Food Chain
F u m (2,3,7,8-tctta- chloro-dibenzofum)
Groundw ater
Refers to a nutrient-rich lake or stream. Large amounts of algae and aquatic plants characterize a eutrophic water body. See also Oligotrophic and Mesotrophic.
The process of nutrient enrichment of a water body. Eutrophication can be accelerated by human activity such as agriculture and improper waste disposal.
A preliminary planning and engineering document that identifies alternative solutions to a community's wastewater treatment problems.
A group of bacteria used to indicate the presence of other bacteria that cause disease. The nunibcr of coliform i s particularly important when water i s used for drinking and swimming.
A specific polyaromatic hydrocarbon (PAH) with toxic properties.
Particulates cmitted from coal burning and other combustion, such as wood burning, and exited into the air from stacks, or more likely, collectcd by electrostatic precipitators.
A sequence of organisms in which each uses the next as a food source.
A chlorinated organic compound which i s highly toxic,
Underground watcr-bearing areas generally within the boundaries of a watershed, which fill internal passageways of porus geologic formations (aquifers) with water which flows in response to gravity and pressure. Often used as the source of water for communities and industries.
Milwaukee Estuary RAP GL-7

GLOSSARY
Groundwater Standards Numerical standards for substances of health or welfare concern which consist of an enforcement standard and a preventive action limit (PAL)
the PAL being a percentage of the enforcement standard which indicates a problem may be developing.
Habitat The place or type of site where a plant or animal naturally lives and grows.
Heavy Metals A group of metals which may be present in municipal and industrial wastes that pose long-term environmental hazards if not properly disposed. Heavy metals can contaminate ground and surface waters, fish and food. The metals of highest concern are: arsenic, cadmium, chromium, copper, lead, mercury, selenium and zinc.
Herbicide
Hydraulic fractionation
Hydrocarbons
Hypereutrophic
Illegal/Unauthonzed Discharges
Incineration
Influent
In-place Pollution
International Joint Commission (IJC)
Isoropylbiphenyl
A type of pesticide that is specifically designed to kill plants and can also be toxic to other organisms.
A process used in sediment remediation where the fine fraction containing most of the contaminants is separated out in order to reduce the volume of material to treated or disposed (ie. hydrocyclone separators).
Any of a large class of chemicals containing carbon and hydrogen in a virtually infinite number of combinations.
Refers to a lake with excessive fertility. Extreme algae blooms and low dissolved oxygen are characteristics.
Contributions of pollutants/contaminants to the AOC as a result of intentional and/or unlawful discharge or dumping.
Reduction of waste materials through combustion. When used by the water quality subcommittee, the t e r m implies the inclusion of environmentally sound air quality controls and ash disposal for each incineration facility.
Influent for an industry would be the river water that the plant intakes for its use in processing. Influent to a municipal treatment plant is untreated wastewater.
As used in the RAP refers to pollution from contaminated sediments. These sediments are polluted from past discharges from municipal and industrial sources.
An agency formed by the United States and Canada to guide management of the Great Lakes and resolve border issues, particularly water quality issues.
A chemical compound used as a substitute for PCB
GL-8 Milwaukee Estuary RAP

GLOSSARY
Landfill
Lesion
Littoral
Load
Macroinvertebrates
Macrophyte
Marginal Use
Mass Balance
Mesotmphic
Mitigation
Mixing Zone
A conventional sanitary landfill is "a land disposal site employing an engineered method of disposing of solid wastes on land in a manner that minimizes environmental hazards by spreading solid wastes in thin layers, compacting the wastes to the smallest practical volume, and applying cover materials at the end of each operating day."
Lethal concentration for 50 percent of the test population exposed to a toxic substance.
Lethal dose for 50 percent of the test population exposed to a toxic substance.
The contaminated liquid which seeps through a landfill or other material and contains water, dissolved and decomposing solids. Leachate may enter the groundwater and contaminate drinking water supplies.
An injury or any structural abnormality resulting from injury
Zone of a lake from the shoreline to the lakeward limit of rooted aquatic growths.
The total amount of materials or pollutants reaching a given water body.
Animals without a vertebral column and which are visible to the unaided eye.
A rooted aquatic plant
A use that cannot support a fishery or a balanced community of aquatic organisms because of natural conditions (physical, chemical, biological or human activities).
A study that examines all parts of the ecosystem to determine the amount of toxic or other pollutants present, their sources, and the processes by which the pollutant moves through the ecosystem.
Refers to a moderately fertile nutrient level of a lake between the oligotrophic and eutrophic levels. See also Eutrophic and Oligotrophic.
The effort to lessen the damages caused, by modifying a project, providing alternatives, compensating for losses, or replacing lost values.
The portion of a stream or lake in which effluent is allowed to mix with the receiving water. The size of the area depends on the volume and flow of the discharge and receiving watcr. For streams, the mixing zone is one-third of the lowest flow that occurs once every 10 years for a seven day period.
Milwaukee Estuary RAP GL-9

GLOSSARY
Programs to monitor or quantify the existence, transport, effect, and remediation of pollutant/contaminants.
An MMSD skimming boat that collects debris from the surface waters in Milwaukee area rivers for disposal at a landfill.
A federal permit system to monitor and control the point source dischargers of wastewater. Dischargers are required to have a discharge permit and meet the conditions it specifics.
Sources of pollutantsicontaminants that are widely distributed throughout the natural environment and are a result of or are caused by natural processes or phenomena. The contribution of these pollutants/contaminants can be made worse by human activities.
A material source of wealth, such as air, water, land, or their amenities, that occurs in a natural state.
NO,, a form of nitrogen used by algae. Excessive concentrations result in eutrophication and algal blooms.
NO,, a form of nitrogen toxic to aquatic life which rapidly oxidizes to nitrates.
Pollution whose sources cannot be traced to a single point such as a municipal or industrial wastewater treatment plant discharge pipe. Nonpoint sources include eroding farmland and construction sites, urban streets, and barnyards. Pollutants from these sources reach water bodies in runoff, which can best be controlled by proper land managcment
Includes all spatially dispersed sources of pollutants/contaminats including water from rain, snow melt, or irrigation that flows over the ground surface and returns to the surface water. Storm water discharge points included in this category.
Refers to an unproductive and nutrient-poor lake. Such lakes typically have very clear water. See also Eutrophic and Mesotrophic.
The month of a sewer, drain or pipe where wastewater effuent is discharged.
A measure of acidity or alkalinity, measured on a scale of 0 to 14 with 7 being neutral, 0 being most acid, and 14 being most alkaline (basic).
A virus, bacteria or other infective agent capable of producing disease.
Refers to the open water portion of a lake
Any chemical agent used for control of specific organisms, such as insecticides, herbicides, fungicides, etc.
Monitoring
MMSD Skimmer Operation
National Pollutant Discharge Elimination System (NPDES)
Naturally Occurring
Natural Resource
Nitrate
Nitrite
Nonpoint Source Pollution (NPS)
Non-Point Sources
Oligotrophic
Outfall
Pathogen
Pelagic
Pesticide
GL-10 Milwaukee Estuary RAP

GLOSSARY
Organic compounds that are byproducts of petroleum refining, textile, dye, and resin manufacturing. High concentrations can cause taste and odor problems is in fish. Higher concentrations can be toxic to fish and aquatic life.
A nutrient that in excess amounts in lakes and streams can lead to over fertile (eutrophic) conditions and algae blooms.
Refers to chemicals/contaminants (such as PAH's) which increase in toxicity to aquatic organisms when exposed to light.
See A lgae
Tiny plants (phytoplankton or algae) and animals (Zooplankton) that live in water.
Sources of pollution that have discrete dischargcs, usually from a pipe or outfall. These sources include, but arc not limited to, all spatially concentrated sources of pollutants/contaminants, including all present and historically pennitted WPDES wastewater discharge points.
The presence of materials or energy whose nature, location, or quantity produces undesired cnvironmcntal cffccts.
Changes in processes or raw materials that reduce or eliminate the use or production of hazardous substances, toxic pollutants and hazardous waste. This does not include incineration, changes in the manner of release of a hazardous substance, recycling of a substance outside of the process or treatment of that substance after the completion of the proccss.
A group of 209 compounds, PCBs have been manufactured since 1929 for such common uses as electrical insulation and heating/cooling equipment, because they resist wear and chemical breakdown. Although banned in 1979 because of their persistence in the environmcnt, they have been detected in air, soil and water, and recent surveys have found PCBs in every section of the country, even those remote from PCB manufacturers.
PAHs are the result of incomplete combustion or organic compounds due to insufficient oxygen and are associated with oils and greases and other components derived from petroleum products which may end up in sediments and be nieasurcd as a cornponcnt of oil and grease. Exarnplcs of compounds in the PAH group include benzo(a) anthracene, bcnzo(b) fluoranthene, benzo(a) pyrene, chrysene, phenanthrcnc, and pyrene.
Partial wastewater treatment rcquircd from some industries. Pretreatment removes some types of industrial pollutants before the wastewater is discharged to a municipal wastewater treatment plant.
Phenols
Phosphorus
Phototoxicity
Phytoplankton
Plankton
Point Sources
Pollution
Pollution Prevention
Polychlorinated Biphenyls (PCBs)
Polycyclic Aromatic Hydrocarbons (PAH)
Pretreatment
Milwaukee Estuary RAP GL-11

GLOSSARY
Priority Pollutant Toxic chemicals identified by the federal government because of their potential impact on the environment and/or human health. Major discharges are required to monitor for all or some of these chemicals when their WPDES permits are reissued (referred to as a 2C screening).
Priority Watenhed
Productivity
Public Law 92-500 (Cleam Water Act)
Publicly Owned Treatment Works (POTW)
Recycling
Remedial Action Plan (RAP)
Remedial Investigation/ Feasibility Study (RI/FS)
Resource Conservation and Recovery Act of 1976 (RCRA)
Retention Basins
Riprap
A drainage area selected to receive Wisconsin fund money to help pay the cost of controlling nonpoint sources of pollution through implementation of Best Management Practices (BMPs). Because money is limited, the watersheds selected for funding are those where problems are critical, control is practical, and cooperation is likely.
A measure of the amount of living matter which is supported by an environment over a specific period of time. Often described in terms of algae production for a lake.
The federal law that set national policy for improving and protecting the quality of the nation's waters. The law set a timetable for the cleanup of the nation's waters and stated that they are to be fishable and swimmable. This also required all pollutant dischargers to obtain a permit and meet the conditions of the permit. To accomplish this pollution cleanup billions of dollars have been made available to help communities pay the cost of building sewage treatment facilities. Amendments to the Clean Water Act were made in 1977, 1981 and 1987.
A wastewater treatment plan owned by a city, village or other unit of govcmment.
The process by which waste materials are transformed into new products.
A plan designed to restore all beneficial uses to a Great Lakes Area of Concern.
An investigation of problems and assessment of management options conducted as part of a superfund project.
This federal law amends the Solid Waste Disposal Act of 1965 and expands on the Resource Recovery Act of 1970 to provide a program which regulates hazardous wastes to eliminate open dumping and to promote solid waste management programs.
Holding ponds where water is not discharged except by means of evaporation, infiltration, or emergency bypass.
Broken rock, cobbles, or boulders placed on the bank of a stream to protect it against erosion by hydraulic forces.
GL-12 Milwaukee Estuary RAP

GLOSSARY
Runoff
Sanitary District
Sanitary Sewer oveflows (SSOs)
Secondary Treatment
Sediment
Sediment Oxygen Demand (SOD)
Seiches
Septic System
Sessile
Sewer Service Area
Sludge
Solid Waste
Water from rain, snow melt or imgation that flows over the ground surface and returns to streams. Runoff can collect pollutants from air or land and carry them to receiving waters.
A special-purpose uni t of govcrnmcnt providing sanitary service in its jurisdictional area. A town sanitary district is created by order of either the town board or the Dept. of Natural Resources. The sanitary district is a designated management agency for wastewatcr collcction and treatment systems. Each district has three commissioners who plan, constrnct and maintain a system of water supply, solid waste collcction, and disposal of sewage including drainage improvcmcnts, sanitary sewers, surface sewers or stonn watcr sewers. The commissioner performs a special assessment which i s funded by residents of the sanitary district.
Overflows of sewer systems that cany sanitary sewage. Overflows occur when sewers cannot handle the flow and relief valves allow discharges to surface waters. Such overflows result from storm events.
Two-stage wastewater treatment that allows the coarse particles to settle out, as in primary treatment, followed by biological breakdowns of the remaining impurties. Sccondary trcatnicnt commonly removes 90% of the impurities. Sometimes "secondaly treatment" rcfcrs simply to the biological part of the treatment proccss.
Soil particles suspended in and carried by water as a result of erosion. Particles are deposited in areas where the watcr flow is slowed (e.g. harbors, wetlands, lakes).
A measure of the amount of dissolved oxygen demand by sediment reactions. The SOD can have a significant influence on the amount of dissolved oxygen available in the water column.
Changes in watcr levels due to the tipping of watcr in an elongated lake basin whcrcby watcr is raised in one end of the basin and lowcrcd in the other as a result of hcing pusbcd by strong winds. Also known as "wind tide."
Sewage treatment and disposal for homes not conncctcd to sewer lines. Usually the system includes a tank and drain field. Solids settle to the bottom of the tank; liquid percolates through the drain field.
Describing an organism that is not motile.
An area presently served and anticipated to bc served by a sewage collcction system
A byproduct of wastewatcr treatment; waste solids suspended in water.
Unwanted or discharged material with insufficient liquid to be free flowing.
Milwaukee Estuaq RAP GL-13

GLOSSARY
S pi1 I s Contributions of pollutantsicontaminants to the AOC as a result of accidental spillage, or improper transport and handling practices and procedures.
Standard Industrial Classification (SIC)
The United States SIC (Standard Industrial Classification) numbering system was developed to classify all firms by type of activity to facilitate compilation and presentation of data for uniformity and comparability. The 4-digit number defines the specific Industry within a Sub-Group. The first three digits represent the Sub- Group within a Major Group. The first two digits indicate the Major Group.
Example: SIC-35 is the Major Group Number for Machinery
353 Except Electrical. is the Sub-Group Number for Construction, Mining and Materials Handling and Equipment. is the Industry Number for industrial trucks, tractors, trailers and stackers
3537
Standards
Stakeholder
Storm Sewers
Superfund
Suspended Solids (SS)
Synergism
Taxa
Tertiary Treatment
Threatened
Total Maximum Daily Loads (TMDLs)
See Water Quality Standards.
A stakeholder of an area of concern is an individual or a public or private group that makes use of, has an impact on, or is affected by the area of concern.
A system of sewers that collect and transport rain and snow runoff. See Com bined Sewers.
A federal program administered by the EPA which provides for cleanup of major hazardous waste landfills and land disposal areas
Small particles of solid matter suspended in water. Cloudy or turbid water is due to the presence of suspended solids in the form of silt or clay particles. These particles may cany pollutants adsorbed to the particle surfaces.
The characteristic property of a mixture of toxic substances that exhibits a greater-that-additive cumulative toxic effect.
Groups of classified organisms
See Advanced Wastewater Treatment.
A species on the Wisconsin Threatened Species list i s one which appears likely, within the foreseeable future, on the basis of scientific evidence, to become endangered.
The maximum amount of a pollutant that can be discharged into a stream without causing a violation of water quality standards.
GL-I4 Milwaukee Estuary RAP

GLOSSARY
One of several chemical parameters used to measure the enrichment of sediment with organic materials. TOC levels can effect the bioavailability of organic contaminants.
The process used in the Areawide Water Quality Management Plans which may affect water quality or treatment plant performance and provide management recommendations for the control for these substances.
A substance which can cause death, disease, behavioral abnormalities, cancer, genetic mutations, physiological or reproductive malfunctions or physical deformities in any organism or its offspring or a substance which can become poisonous after concentration in the food chain or in combination with other substances.
The dcgrcc of danger posed by a toxic substance to animal or plant life. Also see acute toxicity, chronic toxicity and additivity.
For a discharger, it is required that causes of toxicity in an effluent be determined and that measures he taken to eliminate the toxicity. The measures may be treatment, product substitution, chemical use reduction or other actions achieving the desired result.
The Greater Milwaukee Toxics Minimization Task Force, an independent advisory body sponsored by MMSD and made up of local representatives of industry, labor unions, state and local agencies, environmental groups and engineering and law firms; were brought together to produce a Toxics Reduction Strategy. The strategy contains recommended activities and programs to minimize the discharge of toxic substances into the sewerage system, surface and groundwater, air and land.
See wastewater treatment plant.
The level of growth or productivity of a lake as measured by phosphorus concentration, algal biomass and depth of light penetration. The major categories of trophic status are oligotrophic, mesotrophic, eutrophic, and hypcreutrophic.
Turbidity is the lack of water clarity usually closely related to the amount of suspended solids in water.
Provide services such as highway, sewers, sidewalks, lighting and water for fire protection to towns, villages, and 3rd and 4th class cities who may establish a utility district. The funding is provided by district property taxes or sewer service charges. The utility district could be a designated management agency for their collection systems and treatment plants.
Total Organic Carbon (TOC)
Toxic Screening
Toxic Substance
Toxicity
Toxicity Reduction Evaluation
Toxics Minimization Task Force (TMTF)
Treatment Plant
Trophic Status
Turbidity
Utility District
Milwaukee Estuary RAP GL-15

GLOSSARY
Government permission for a delay or exception in the application of a given law, ordinance or regulation. Also, see water quality standard variance.
Valiance
Volatile
Wasteload Allocation
Wastewater
Wastewater Treatment Plant
Water Quality Agreement
Water Quality Limited Segment
Water Quality Criteria
Water Column:
Water Quality Standard valiance
Water Quality Standards
Watershed
Any substance that evaporates at a low temperature.
Division of the amount of waste a stream can assimilate among the various dischargers to the stream. This results in a limit on the amount (in pounds) of a chemical or biological constituent discharged from a wastewater treatment plant to a water body. A water quality model may be used to calculate allowable loadings, which vary seasonally due to flow. See Assimilative Capacity.
Water that has become contaminated as a byproduct of some human activity. Wastewater includes sewage, washwater and the waterborne wastes of industrial processes.
A facility for purifying wastewater. Modern wastewater treatment plants may be capable of removing 95% of organic pollutants.
The Great Lakes Water Quality agreement was initially signed by Canada and the United States in 1972 and was subsequently revised in 1978 and 1987. It proves guidance for the management of water quality, specifically phosphorus and toxicants in the Great Lakes.
A section of river where water quality standards will not be met if only categorical effluent limits arc met.
Measures of the physical, chemical or biological characteristics of a water body necessary to protect and maintain different water uses (fish and aquatic life, swimming, etc.).
The entire span of a waterbody, from teh surface to where it interacts with the sediment, sometimes broken into numerous vertical layers for the purpose of sampling and study.
When natural conditions of a water body preclude meeting all conditions necessary to maintain full fish and aquatic life and swimming a variance may be granted.
The legal basis and determination of the use or potential uses of a water body and the water quality criteria, physical, chemical, or biological characteristics of a water body, that must be maintained to keep it suitable for the specified use.
The land area that drains into a lake or river.
GL-16 Milwaukee Estuary RAP

APPENDIX A: BIOLOGICAL USES OF STREAMS IN THE MILWAUKEE RIVER BASIN
APPENDIX A: Biological Uses of Streams in the Milwaukee River Basin
The table below lists the current and potential uses aquatic life has for all perennial streams in the Milwaukee River Basin. It also lists factors that impair any potential biological uses of these streams. Use the key below to read the table.
KEY
GL
COLD
WWSF
LFF
LAL
Great Lakes communities This subcategory includes Lake Superior, Lake Michigan, and Green Bay including all bays, arms and inlets thereof. This also includes those tributaries which serve as a spawning area of anadromous fish species.
Cold Water communities This subcategory includes surface waters, except those in GL, capable of supporting a community of cold water fish and other aquatic life, or of serving as a spawning are for cold water fish species. This subcategory includes, but is not restricted to, surface waters identified as trout water by the WDNR.
Warm Water Sport Fish communities This subcategory includes surface waters capable of supporting a community of warm water sport fish or serving as a spawning area for warm water sport fish.
Limited Forage Fish communities (intermediate surface waters) This subcategory includes surface waters of limited capacity and naturally poor water quality or habitat. These surface waters are capable of supporting only a limited community of forage fish and other aquatic life.
Limited Aquatic Life (marginal surface waters) This subcategory includes surface waters of severely limited capacity and naturally poor water quality or habitat. These surface waters are capable of supporting only a limited community of aquatic life.
Milwaukee Estuary RAP A-1

APPENDIX A BIOLOGICAL USES OF STREAMS IN THE MILWAUKEE RIVER BASIN
Table A.1: Biological Uses of Streams in the Milwaukee River Basin. (Source: Water Resource Appraisals and Water Quality Standard Review for the Milwaukee River South Watershed, WDNR, 1992)
Watelbody Name Length Cunent Potential Potential Uses Problems or Threats to (location) (miles) Use Use (full/part/not) Potential Uses
Pollutants or Limiting Factols Causing Problems or Threats
Streams of the Milwaukee Ri
Nichols Creek COLD COLD (ORW)
W S F WWSF Milwaukee River N. Branch
FULL -Headwaters development -Barnyard runoff -Streambank pasturing
PART -Hydrologic modification
Lake Ellen Outlet
Milwaukee R. N. Branch (Cascade swamp to confluence with Milw. R. Main Stem)
Milwaukee R. N. Branch (Washington County)
WWSF
WWSF
WWSF
WWFF Mink Creek (Headwaters to Beechwood L. subwatershed)
WWSF FULL NONE
WWSF PART -Hydrologic modification
WWSF PART -Unspecified nonpoint sources of pollution
COLD PART -Hydrologic modification -Barnyard runoff
Mink Creek (Beechwood Lake to confluence with N. Br. Milwaukee River)
COLD Chambers Creek (Sheboygan County)
COLD PART
:r North I
4.4
4.6
0.5
13.4
4.9
4.8
8.4
1.7
COLD COLD PART -Stream bank pasturing
-Stream bank pasturing
-Wetland filling or drainage -Ammonia toxicity -Sedimentation
-Stream flow fluctuations -Wetland filling or drainage
NONE
-Turbidity -Unbalanced fish populations -Sedimentation
-Turbidity -Unbalanced fish populations -Sedimentation
-Channelization -Excess nutrients -Bacterial contamination
-Sedimentation
-Sedimentation -Temperature fluctuations -Bacteria contamination
A-2 Milwaukee Estuary RAP

Water & body Name Length Cumnt Potential (location) (miles) Use Use
Adell Tributarv 5.1 LFF WWSF (Sheboygan County)
Potential Uses Problems or Threats to Pollutants or Limiting Facton (full/part/not) Potential Uses Causing Problems or Threats
NOT -Hydrologic modification -Channelization
Melius Creek 13.0 COLD COLD PART -Naturally occurring -Drainage or filling of - - -
4.1 Batavia Creek (Sheboygan County)
WWFF WWSF PART -Hydrologic modification -Unspecified nonpoint source uollution
-Channelization -Excess nutrients -Excessive aauatic ulants
Gooseville Creek (Headwaters of N. Br. GC to confl. of S. Br. GC)
Gooseville Creek
0.8 WWFF WWFF PART -Hydrologic modification -Channelization
1 .o WWFF WWFF FULL NONE NONE
-Channelization Gooseville Creek ( N / S Br. confluence to milluond)
0.7 COLD COLD PART -Stream bank pasturing
Silver Creek 1.2 LFF LFF FULL-- -Hydrologic modification (Headwaters to Hwy 57) -Barnyard/cropland runoff
Silver Creek 9.3 WWSF WWSF PART -Unspecified nonpoint source -Sedimentation ( H v 57 to N. Br. Mil. R) uollution -Bacterial contamination
NONE
Random Lake Outlet
Spring Lake Outlet (Sheboygan/Ozaukee Co.)
Stony Creek (Headwaters to Haack L.)
Stony Creek (Haack L. to Moraine Dr.)
Milwaukee Estuary RAP
0.6 WWSF WWSF FULL NONE NONE
0.7 WWSF WWSF FULL NONE NONE
3.1 WWFF WWFF FULL -Unspecified nonpoint sources -Excess nutrient loading -Hydrologic modification -Channelization
2.6 COLD COLD PART -Hydrologic modification -Channelization -Excessive aquatic plants -Sedimentation -Temperature fluctuations
A-3

Water & body Name (location)
Current Potential Potential Uses Use Use (full/part/not)
WWSF WWSF PART
WWSF COLD NOT
Stony Creek (Moraine Dr. to confluence with N. Br. Milwaukee River)
Problems or Threats to Potential Uses
Pollutants or Limiting Factors Causing Problems or Threats
-Hydrologic modification -Channelization -Sedimentation -Turbidity
-Stream bank pasturing -Sedimentation Wallace Creek
Length (miles)
7.9
9.5
A-4 Milwaukee Estuary RAP

Watehody Name Length Current Potential Potential Uses Pmblems o r Threats to (location) (miles) Use Use (full/part/not) Potential Uses
Streams of the Milwaukee R
Watercress Creek Seg. 1 (T14N R20E S6 SW)
Pollutants o r Limiting Facton Causing Pmblems or Threats
watershed
COLD (II)
r East-W
1.8
t Branch
COLD (11)
PART -Limited Habitat -Low flow -Insufficient cover -Parent soils
Watercress Creek Seg. 2 (T14N R19E SI2 SE)
3.0 WWSF WWSF PART -Limited habitat -Parent soils
Parnell Creek (Headwaters to Butler Lake Road)
Parnell Creek (Butler Lake Road to confluence with Milw. R. East Branch)
WWFF
WWSF
WWSF
WWSF
WWSF
WWFF
WWSF
PART -Low flow -Limited habitat
-Channelization/wetland modification
-Habitat modification -Bacterial contamination
-Channelization/wetland modification -Anim alidom estic waste
PART
Milwaukee R. East Branch (Long Lake outlet to New Fane Millpond)
Milwaukee R. West Branch (T14N R17E S24) to (T13N R18E S6)
11.3
4.0
10.3
WWSF
WWSF
WWSF
PART
PART
PART
-Fish migration barrier -Bacterial contamination
-Channel modification -Animal/domestic waste
-Bacterial contamination -Low D.O. -Habitat modification -Limited habitat -Hydraulic scour -Turbidity
-Bacterial contamination
-Sedimentation -Fish migration barrier -Limited habitat -Hydraulic scour
-LOW D.O.
-Animal/domestic waste -Wetland drainage -Excessive aquatic plantdalgae -Channelization -Low flow -NPS runoff
-Animal/domestic waste -Excessive nutrients -Wetland drainage -Uplandhank erosion -Dam or culvert -Low flow -Urban runoff
Milwaukee R. West Branch
Milwaukee Estuary RAP A-5

APPENDIX A: BIOLOGICAL USES OF STREAMS IN THE MILWAUKEE RIVER BASIN
(location) Wate&odsName 1 Length -
(miles)
Milwaukee R. West Branch (from L. Bernice to confluence with Milw. R. Mainstem)
Milwaukee R. Main Stem (T14N RISE SI3 SENE) to (T13N R19E S6 NE NW)
Milwaukee R. Main Stem (T13N R19E S6 NE NW)
Auburn Lake Creek (T14N R19E S26) to (T13N R19E S22)
Virgin Creek (T13N R19E S4) to (T13N R19E S10)
8.4
3.0
3.4
3.4
Cumnt Use
WWSF
WWSF
WWSF
COLD
WWSF
Potential Use
WWSF
WWSF
WWSF
COLD
WWSF
~~ ~
Potential Uses ( fUl l /DaI thOt)
PART
PART
PART
PART
PART
Problems o r Threats to Potential Uses
-Bacterial contamination -Low D.O. -Sedimentation -Limited habitat -Hydraulic scour
-Bacterial contamination -Excessive plants/algae -Low D.O. -Habitat modification -Sedimentation -Limited habitat -Hydraulic scour
-Bacterial contamination -Excessive plantdalgae -Low D.O. -Sedimentation -Limited habitat -Hydraulic scour
-Aquatic plants/algae -Low D.O. -Habitat modification -Limited habitat -Hydraulic scour
-Low D.O. -Habitat modification -Limited habitat -Hydraulic scour
Pollutants o r Limiting Factors Causing Problems o r Threats
-Animal/dornestic waste -Excessive nutrients -Wetland drainage -Uplandhank erosion -Low flow -Urban runoff
-Animal/domestic waste -Excessive nutrients -Wetland drainage/plant resp. -Channelization -Uplandhank erosion -Low flow/insuff. cover -Unspecified NPS runoff
-Animal/domestic waste -Excessive nutrients -Wetland drainage/plant resp. -Uplandhank erosion -Low flow/insuff. cover -Urban runoff
-Excessive nutrients -Wetland drainage/plant resp. -Channelization -Low f l o w h u f f . cover -Urban runoff
-Wetland drainage/plant resp. -Channelization -Low flow/poor cover -Urban runoff
A-6 Milwaukee Estuary RAP

APPENDIX A: BIOLOGICAL USES OF STREAMS IN THE MILWAUKEE RIVER BASIN
Length (miles)
8.3
Cumnt Use
WWSF
Watehody Name (location)
Potential Use
Potential Uses (full/Dart/not)
Problems or Threats to Potential Uses
Pollutants or Limiting Factols Causing Problems or Threats
WWSF PART -Bacterial contamination -Aquatic plants/algae -Low D.O. -Sedimentation -Limited habitat
-Animal/domestic waste -Excessive nutrients -Wetland drainage/plant resp. -Uplandhank erosion -Low flow/poor cover
Milwaukee R. Main Stem (T13N R19E S18 NE NW) to (T12N R19E S4 NW NE)
Milwaukee R. Main Stem (T12N R19E S4 SENE) to (T12N R19E S15 NW SE)
WWSF WWSF PART -Bacterial contamination -Aquatic plants
-Animal/domestic waste -Excessive nutrients
Kewaskum Creek (Tl lN R19E S5 SW SE) to (T12N R19E S9 SE SE)
WWFF WWFF PART -Unstable banks -Habitat modification -Sedimentation
-Livestock access/poor veg. -Channelization/wetland mod. -Uplandhank erosion
Milwaukee R. East Branch (New Fane to confl. with Milwaukee R. Main Stem)
6.4 WWSF WWSF PART -Bacterial contamination -Sedimentation -Fish mieration barrier
-Animal/domestic waste -Uplandhank erosion -Dam or culvert
Milwaukee R. Main Stem (Kewaskum to Young America)
4.7 WWSF WWSF PART -Bacterial contamination -Sedimentation -Fish migration barrier
-Animal/domestic waste -Uplandhank erosion -Dam or culvert
Milwaukee R. Main Stem (T12N R19E S35 SW NW) to (T l lN R21E S7 SW NW)
16.3 WWSF WWSF PART -Bacterial contamination -Aquatic plantdalgae
-Sedimentation -Limited habitat -Turbiditv
-LOW D.O.
.Animal/domestic waste
.Excessive nutrients -Wetland drainage/plant resp Uplandhank erosion .Low flow/insuff. cover .NPS runoff
Myra Creek :T11N R20E SI5 SW SW)
2.6 WWFF NWFF ?ART -Habitat modification -Sedimentation -Fish migration barrier
Channelizatiodwetland mod .Uplandhank erosion .Dam/culvert
Milwaukee Estuary RAP A-7

APPENDIX A: BIOLOGICAL USES OF STREAMS IN THE MILWAUKEE RIVER BASIN
Problems o r Threats to Potential Uses
Pollutants or Limiting Factors Causing Problems or Threats
I 4.5 I WWFF Silver Creek (TIIN R19E S I 1 NW SE)
Watelbody Name (location)
l l
Length Cunent (miles) Use
Engmon Creek (TIIN R19E S I 5 SW SE) to (TIIN R19E S I 4 NE NW)
Quas Creek (N. Br. & S. Br. to Hwy G)
Quas Creek (Hwy G to confluence with Milwaukee River)
1.5 WWFF
4.0 COLD
2.0 WWFF
Potential Use
~ ~~
Milwaukee R. Main Stem (T11N R21E S7 SW NW) to fT12N R21E S30 NW SE)
WWFF
WWFF
~~
6.2 WWSF
COLD
WWFF
WWSF
Potential Uses (ful l lpdnot)
PART
PART
PART
PART
PART
-Habitat modification -Unstable banks -Sedimentation -Toxicants -Turbidity
-Unstable banks -Habitat modification -Sedimentation -Toxicants -Turbid&
-Channelization/wetland mod. -Livestock access/poor veg. -Uplandbank erosion -Contaminated sediment -NPS runoff
-Livestock access/poor veg. -Channelization/wetland mod. -Uplandhank erosion -Contaminated sediment -NPS runoff
-Unstable banks -Habitat modification -Sedimentation
-Bacterial contamination -Aquatic plants/algae -Unstable banks -Habitat modification -Sedimentation
-Livestock access/poor veg. -Channelization/wetland mod. -Uplandbank erosion
-Animal/domestic waste -Excess nutrients -Livestock access/poor veg. -Channelization/wetland mod. -Uplandhank erosion
-Bacterial contamination -Aquatic plants/algae -Sedimentation
-Animal/domestic waste -Excess nutrients -Uplandhank erosion
A-8 Milwaukee Estuary RAP

Wate&ody Name Length Current Potential Potential Uses Problems or Threats to (location) (miles) Use Use (full/part/not) Potential Uses
Streams of the Milwaukee Ri
Milwaukee River (T12N R21E S30 NW SE) to (TIIN R21E S I 4 SENE)
Pollutants or Limiting Factors Causing Pmblems or Threats
Fredonia Creek (T12N R21E S34 NW NE)
8.2 WWSF WWSF
Mole Creek (TION R21E S3 NE NE)
PART
Milwaukee River (TION R21E S3 NE NE) to (TION R21E S36 NW NE)
Milwaukee River (TIlN R21E S I 4 SENE)
(TlON R21E S3 NE NE)
4.2 1 LFF 1 WWFF 1 NOT
-Loss of fish and invertebrate habitat -Low D.O. -Toxicity (potential)
-Loss of fish and invert. habitat -Wetland draining and channelization
-Loss of fish, wildlife and invert. habitat
-Toxicants (potential) -Thermal stress
-Loss of fish and invert. habitat
-Low D.O. -Fish consumDtion advisorv
-Loss of fish and invert. habitat -Low D.O. -Toxicants, fish tissue tainting (potential) and instream odors (verified) -Toxicants (potential)
-Sediment -Aquatic plant respiration -Ammonia (unionized)
-Sediment -Hydraulic Scour -Agricultural and urban land use -Low flow
-Sediment -Livestock access to stream and bank -Wetland channelization and filling -Metals and non-metals -Excessive water temperatures
-Sediment -Fish migration barriers -Aquatic plant resp. -PCBs
-Sediment
-Aquatic plant resp. -Organics, unknown compounds
-Ammonia (unionized)
Milwaukee Estuary RAP A-9

APPENDIX A: BIOLOGICAL USES OF STREAMS IN THE MILWAUKEE RIVER BASIN
~~ ~
Pollutants or Limiting Factors Causine Problems or Tb~a t s
Potential Use
Potential Uses (fulllpartrnot)
Problems or Thmts to Potential Uses
Cunent Use
LFF -
WWSF
Length (miles)
6.8
8.6
Wate&ody Name
Pigeon Creek (T9N R21E S23 SW SW)
~~ ~
-Loss of fish and invert habitat
-Sediment -Channelization (including concrete and enclosure) -Livestock access to stream and banks -Fish migration barriers -Low flow
WWFF NOT
Ulao Creek (T9N R21E S12 NW NW) I-
~
WWSF PART -Loss of fish And invert habitat
-Sediment -Wetland channelization and draining -Livestock access to stream -Low flow -Ammonia (unionized)
Ulao Creek (T9N R21E S12 NW NW)
-Toxicants (potential)
-Loss of fish and invert. habitat
~~
-Sediment -Hydraulic scour -Channelization -Fish migration barriers -Organics and heavy metals -Toxic materials -PCBs
-Organic pollution -Aquatic plant respiration
1.3 LFF WWSF NOT Lincoln Creek (Segment 1: Milwaukee R. upstream to Teutonia Avenue
-Toxicants
-Fish kills -Fish consumption advisory -Low D.O.
0.6 LAL LAL PART -Complete loss of fish and invertebrate habitat
-Toxicants
-Concrete channelization
.Organics and heavy metals
Lincoln Creek (Segment 2: Teutonia Ave. upstream to 32nd Street T8N R21E S36 NE SE)
Milwaukee Estuary RAP A-10

APPENDIX A: BIOLOGICAL USES OF STREAMS iN THE MILWAUKEE RIVER BASIN
LFF NOT
Pollutants or Limiting Factors Causine Problems or Thlpats
Pmhlems or Thmats to Potential Uses (location)
-Sediment -Hydraulic scour -Channelization -Fish migration barriers
-0rganicskeavy metals
-PCBs
2s I L-4L
-Loss of fish and invert habitat
Lincoln Cree!, (Segments 3-5: iZnd St upstream to Hampton A\-enue T l N R21E SI NW NE)
-Toxicants
-Fish consumption advisoly
-Low D.O. - Oreanic oollution
-Concrete channelization -0rganicsiheavy metals
LAL PART -Complete loss of fish and invert. habitat -Toxicants
Lincoln Creek (Segment 6: Hampton Ave. upstream to steel drop structure near Silver Spring Drive)
LFF NOT -Loss of fish and invert habitat
-Sediment -Channelization -Fish migration barriers -0rganicskeavy metals
Lincoln Creek (Segments 7-8: Silver Spring Dr. to ponds at Brynwood Country Club)
Lincoln Creek (Segment 9: Concrete n e a 76th Street)
-Toxicants
Complete loss of fish and invert. habitat
-Concrete channelization -Fish migration barriers -0rganicskeavy metals
LAL PART
.Toxicants
LAL PART .Loss o f fish and invert. iabitat
.Toxicants (potential)
-Concrete channelization or enclosure -Metals/organics
Beaver Creek (concrete channel reaches T8N R21E S2 NW SE)
Milwaukee Estuary RAP A-1 1

APPENDIX A: BIOLOGICAL USES OF STREAMS IN THE MILWAUKEE RIVER BASIN
Watehody Name Length (location) (miles)
Beaver Creek 0.4 (earthen channel reaches)
Southbranch Creek 1.3 (concrete channel segments)
Cunent Use
WWSF
LAL
~~
WWSF
LAL
LFF
WWFF
LAL
PART -Loss of fish and invert. habitat
-Toxicants (potential)
-Loss of fish and invert. habitat
-Toxicants (potential)
PART
PART (same as above)
PART -Loss of fish and invert. habitat
-Toxicants
-Fish kills
-Loss of fish and invert. PART LAL
Southbranch Creek (earthen channel segments)
Brown Deer Creek (T8N R22E S7 NW SW)
LFF
0.2 LFF
2.5 WWFF
Indian Creek (concrete channel upstream of 1-43 including tributaries TXN R22E S8 NW SE)
Indian Creek (natural channel downstream 1-43 TXN R22E S18 NW NE)
I I
1.3
1.3
Potential I Potential Uses I Problems or Threats to Use (fullloart/not) Potential Uses
WWSF NOT -Loss of fish and invert.
habitat
Intermittent A (TXN R22E S7 SE SE)
0.7 LAL
habitat
-Low D.O. (potential)
-Loss of fish and invert. habitat
Pollutants o r Limiting Faclon Causing Problems or Threats
-Channelization
-Metals
-Channelization
-Metals/organics
(same as above)
-Channelization -Sediment
-Metals/organics -Spills -Miscellaneous toxic materials
-Concrete Channelization
-Channelization -Sediment -Hydraulic scour
-Filamentous algae/nutrients
-Channelization -Wetland drainage -Low flow
A-12 Milwaukee Estuary RAP

APPENDIX A: BIOLOGICAL USES OF STREAMS IN THE MILWAUKEE RIVER BASIN
Watehody Name (location)
Intermittent B (T8N R22E S 7 SE SE)
Lincoln Creek Segment 1 Milwaukee River upstream to Teutonia Ave. (T8N R22E S31 NE SE)
Milwaukee River (TSN R21E SI NE NW) to (T9N R22E S29 NE SW)
~~
Milwaukee River Teutonia Ave. upstream to 32nd St. iT8N R21E S36 NE SE)
Milwaukee River Silver Spring Dr. to ponds at Brynwood Country Club
Len@ (miles)
1.4
1.3
6.0
0.6
2.8
Cnmnt Use
LFF
LFF
WWSF
LAL
LAL
Potential Use
LFF
WWSF
WWSF
LAL
LFF
Potential Uses (full/partlnot)
PART
NOT
PART
PART
NOT
- Problems or Threats to
Potential Uses
-Loss of fish and invert. habitat
- -Loss of fish and invert. habitat -Toxics -Fish kills -Fish consumption advisoq -Low D.O.
~
-Loss of fish and invert habitat
-LOW D.O.
-Fish consumption advisory
-Toxicants
~~~
-Total loss of fish and invert habitat -Toxics
~
-Loss of fish and invert. habitat -Toxics
Pollutants or Limiting Factols Causing Problems or Threats
-Channelization -Wetland drainage -Low flow
-Sediment -Hydraulic scour -Channelization -Fish migration barriers -0rganicsiheavy metals -Toxics -PCB's or bioaccumulation -Organic pollution -Aquatic plant respiration
-Sediment -Lack of suitable cover -Fish migration banier
-Aquatic plant resp
-PCBs
-metals/oreanics ~ ~~
-Channelization (concrete) -0rganicsheavy metals
-Sediment -Channelization -Fish migration barriers -0rganicsheavy metals
Milwaukee Estuary RAP A-13

APPENDIX A: BIOLOGICAL USES OF STREAMS IN THE MILWAUKEE RIVER BASIN
Waterbody Name Length (location) (miles)
Milwaukee River .5 Concrete invert near 76th
~~~~
Current Potential Potential Uses Problems or Threats to Pollutants or Limiting Facton Use Use (fulllpdnot) Potential Uses Causing Problems or Threats
LAL LAL PART -Complete loss of fish -Concrete channelization -Toxics -0rganicsheavy metals
St.
Milwaukee River Hampton Ave. upstream to steel drop structure near Silver Spring Dr.
1.3 LAL LAL PART -Complete loss of fish and invert. habitat -Toxics
Lehner Creek TlON R19E S22 NWSE
Little Cedar Creek TlON R20E S30 SENE
1.7 WWSF
COLD
COLD
WWSF
WWSF
PART -Limited habitat -Sedimentation -Stream size
NOT -Limited habitat -Sedimentation -Water quality -Algae -Bacteria
PART -Loss of habitat
-Sedimentation -Water quality -Bacteria (potential)
Lehner Creek (Seg. 2) TlON R19E S14 NESE
2.0 WWFF
-Channelization (concrete) -0rganicsheavy metals
Frieden's Creek rlON R20E SI6 SWNE
-Channelization -Low flow -elevated water temperature from loss of cover -Barnyard runoff/ livestock access
-Low flow -Sediment- non point source
3.8 WWSF
-Low flow -Sediment- non point source -Elevated temp- loss of cover -Nutrients- barnyard runoff -Barnyard runoff
-Channelization -Low flow -Loss of overhead cover -Nonpoint sources -Barnyard runoff
A-I4 Milwaukee Estuary RAP

APPENDIX A: BIOLOGICAL USES OF STREAMS IN THE MILWAUKEE RIVER BASIN
Watelbody Name (location)
Cedar Creek
Length Cumnt Potential Potential Uses (miles) Use Use (fulllpdnot)
4.0 WWSF WWSF PART
Jackson Tributaly
Kressin Creek
Problems or Thleats to Potential Uses
1.3 LFF WWFF NOT
1.8 WWSF WWSF PART
-Sedimentation -Excessive algaeiplants -Bacteria
-Loss of habitat
-Algae -Water quality-elevated temp. -Sedimentation -Bacteria
-Loss of habitat
-Sedimentation -Bacteria
-Loss of habitat
-Water quality-elevated temp. -Sedimentation -Algae
-Loss of habitat
-Sedimentation -Water quality-elevated temp. & turbidity -Bacteria
Pollutants or Limiting Factors Causing Problems or Thleats
-Upland and bank erosion -Agriculhual runoff -Barnyard runoff
-Channelization -Fish migration barrier (dam) -Barnyard runoffhonpoint -Loss of cover -Upland erosion -Barnyard runoff
-Channelization -Low flow -Nonpoint source sediment -Sewer leaks/ bvuasses
-Channelization -Low flow -Loss of cover -Nonpoint source sediments -Nonpoint source nutrients
-Channelization -Low flow -Nonpoint source sediments -Loss of cover -Rough fish -Barnyard runoff/ livestock access
Milwaukee Estuary RAP A-15

APPENDIX A: BIOLOGICAL USES OF STREAMS IN THE MILWAUKEE RIVER BASIN
Wate&ody Name (location)
~
Evergreen Creek (EVO13) TlON R20E S16
Evergreen Creek (EV003) T l l N R20E S32 SWSW
Cedar Creek (CX022) TlON R2OE S12 SENW
Cedarburg Creek (CXO16) T 1 ON R20E S 15 NENE
North Branch Cedar Creek (CNOOS) TlON R20E S1 NENE
Length Current Potential Potential Uses (miles) I Use I Use I (full/plut/not)
5.2 I WWFF I WWSF I NOT
~~ ~
Problems or Threats to Potential Uses
-Habitat loss
-Fish migration barrier
-Water quality-elevated temp. -Sedimentation -Aquatic vegetation -Bacteria
-Habitat loss
-Fish migration barrier
-Water quality-elevated temp. -Sedimentation -Aquatic vegetation -Bacteria
-Loss of habitat
-Sedimentation -Water quality-elevated temp. -Bacteria
-Loss of habitat
-Nuisance vegetation -Water quality-elevated temp. -Bacteria (potential)
-Loss of habitat
.Sedimentation
.Water quality-low D.0
.Bacteria
Pollutants or Limiting Factors Causine Problems or Threats
-Channelization -Low flow -Diffuse wetland flow - D m -Loss of cover -Uplandbank erosion -Nonpoint source nutrients -Animal waste runoff
-Channelization -Low flow -Diffuse wetland flow -Dm -Loss of cover -Uplandhank erosion -Nonpoint source nutrients -Animal waste runoff
-Channelization -Low flow -Upland erosion sediments -Loss of cover -Animal waste runoff
-Channelization -Low flow -Nonpoint source nutrients -Loss of cover -Animal waste runoff
-Low flow (natural) -Channelization -Upland erosion -Natural -Bamvard runoff
A-16 Milwaukee Estuary RAP

APPENDIX A: BIOLOGICAL USES OF STREAMS IN THE MILWAUKEE RIVER BASIN
Potential Uses (fulI/pdnot)
Length (miles)
0.8
Problems or Threats to Potential Uses
Cunent Use
WWSF PART -Limited habitat -Sedimentation -Water oualitv- low D.O.
Pollutants or Limiting Facton Causing Problems or Threats
PART
I
A-17
-Limited habitat -Sedimentation -Algae -Bacteria
Watehody Name (location)
PART
Potential Use
-Limited habitat -Water quality-elevated temp. -Algae
-Sedimentation -Bacteria
Unnamed Intermittent Stream (CN003) T l l N R21E SI9 NWNW
PART
WWSF
-Limited habitat -Sedimentation
-Aquatic vegetation -Bacteria
PART
-Low flow (natural) -Upland erosion -Natural
-Limited habitat -Sedimentation -Algae -Water quality-elevated temp. -Bacteria botential)
Unnamed Intermittent Stream (CN006) T l l N R21E S19 NESW
North Branch Cedar Creek (TR006) TlON R20E SI2 SENW
0.5
2.0
LFF
WWSF
LFF PART 1 -Limited habitat -Sedimentation
-Low flow (natural) -Upland erosion -Natural
-Low flow (natural) -Nonpoint source sediments -Barnyard and nonpoint runoff -Barnyard runoffflivestock access
-Water quality-low D.O. I
WWSF
Unnamed Creek (TR004) TlON R20E S1 NENE
1 .o WWFF WWFF -Low flow (natural) -Loss of cover -Barnyard/agricultural runoff nutrients -Nonpoint source sediments -Barnyard runoff
Cedar Creek (HC018) TlON R21E S9 SESE
5.9 WWSF WWSF -Low flow -Parent materialhonpoint source runoff -Nonpoint source nutrients -Barnyard runoffflivestock access
Unnamed Intermittent Stream (HC005 rlON R21E S7 SWSW
3.0 WWSF WWSF -Low flow -Nonpoint source sediments -Nonpoint source nutrients -Loss of cover -Barnyard runoffflivestock access
Milwaukee Estuary RAP

Watelbody Name Length Cunent Potentid Potential Uses Problems o r Threats to (location) (miles) Use Use (fulllpdnot) Potential Uses
Pollutants o r Limiting Factors Causing Problems or Threats
WWSF ~~ ~
-PCB's -Bacteria -Nutrient enrichment -Toxics -Habitat loss -Fish migration interference -Sedimentation
PCB's -Bacteria -Nutrient enrichment -Habitat loss
-PCB's -Bacteria -Toxics -Metals -Nutrient enrichment
WWFF
-Urban storm water runoff -Municipal point sources -Industrial point sources -Streambank erosion
-Urban storm water runoff -Industrial and municipal point sources -Channelization
-Sedimentation -Urban storm water runoff -Municipal point source -Hydrologic modification
WWSF
Streams of the Menomonee
Stream segment 1 (downstream of Honey Cr. to state Hwy 41)
Stream Segment 2
to 1-94) (State Hwy 41, downstream
Stream Segment 3 (1-94 to confluence with Milwaukee R.)
South Menomonee Canal (13th St. to 3rd St. confluence with Menomonee R.)
River Watc
1.6
1 .O
3.6
0.8 LFF
A-18
-Habitat loss
LFF PART -Toxicity -Sedimentation -Temperature and D.O. flucuation -Industrial point source -Organic chemical toxicity or bioaccumulation -Metals -Habitat loss
-Urban storm water runoff
-Hydrologic modification
Milwaukee E s t u q RAP

APPENDIX A: BIOLOGICAL USES OF STREAMS IN THE MILWAUKEE RIVER BASIN
Watemody Name (location)
Length (miles)
Stream Segment 1 Concrete channel 75 feet upstream of Fountain Drive Bridge
0.05
Potential Use
Pollutants or Limiting Facton Causing Problems or Threats
Problems or Threats to Potential Uses
Potential Uses (full/part/not)
PART
Cunent Use
LFF LFF -Temperature fluctuation
-Metals -Sedimentation -Toxicity -Organic chemical toxicity or bioaccumualtion
-D.O. extremes -Industrial point source -Urban storm water runoff -Hydrologic modification
St.)
Wood Creek 1 1.0 LFF LFF PART -Stream flow fluctuations -Habitat loss
-Hydrologic modifications -Channelization
Goldenthal Creek (GD005-007) (T9N R20E Sec. 16.17.2 1.22)
WWFF WWFF PART -Sedimentation -Stream flow fluctuations -Nutrient enrichment -Habitat loss
-Channelization -Streambank erosion -Pasturing
2.6
FULL -Sedimentation -Nutrient enrichment -Habitat loss
-Cropland erosion -Channelization
Willow Creek (T9N R20E Sec.29-32)
Nor-X-Way Channel (TSN R20E Sec.11)
WWFF
WWFF
WWFF
WWFF ~ ~
-Nutrient enrichment -Sedimentation
~~~
.Industrial point source
.Urban storm water runoff -Channelization
PART
LFF LFF FULL -Habitat loss -Streamflow fluctuations -Sedimentation
Channelization .Streambank erosion
Milwaukee Estuary RAP A-I9

APPENDIX A: BIOLOGICAL USES OF STREAMS ~l\r I rlE MILWAUKEE RIVER BASIN
(location)
Lilly Creek Segment 1 Headwaters to Lilly Rd.
Lilly Creek Segment 2 Lilly Rd. to confluence with Menomonee Rivcr
Butler Ditch T8N R20E Sec 36 NENW
Little Menomonee Creek from confluence with Little Menomonee River to approximately . I mile north of Mequon Rd.
/I
I)
Length (miles)
1.6 -
1.7
3.3
1.2
Cumnt Use
LFF
WWFF
LFF
WWFF
Potential Use
LFF
WWFF
LFF
WWFF
~ ~ ~~
Potential Uses (fulllpadnot)
PART
PART
PART
PART
Problems or Threats to Potential Uses
-Organic chemical toxicity or bioaccumulation -Chlorine toxicity -Nutrient toxicity -Bacteria -Sedimentation -Nutrient enrichment -Habitat loss
-Nutrient enrichment -Bacteria -Sedimentation -Chlorine toxicity
-Sedimentation -Nutrient enrichment -Habitat loss
-Bacteria -Nutrient enrichment -Sedimentation -Metals -Toxicity
Pollutants or Limiting Factols Causine Problems or Threats
-Streambank erosion -Failing septic system
-Failing septic/sanitary sewer storage -Urban storm water runoff -Streambank erosion
-Cropland erosion -Landfill
Cropland erosion -Barnyard runoff -Streambank erosion .Roadside erosion .Woodlot pasturing .Landfill
* INT-D was crossed out and INT-C was inserted.
A-20 Milwaukee Estuary RAP

Waterbody Name Length Cumnt Potential Potential Uses (location) (miles) Use Use (full/part/not)
Streams of the Kinnickinnic
Kinnickinnic River Headwaters downstream to 6th St. Bridge
Problems or Threats to Potential Uses
Pollutants or Limiting Factors Causing Problems or Thmsts
Kinnickinnic River 6th Street Bridge downstream to confluence with Milwaukee River
Wilson Park Creek
Cherokee Creek
ver Wate
5 .o
3.0
6.0
1.5
Bacteria
-Sedimentation
-Toxicity -Habitat loss
1 -Nutrient enrichment
' -Metals
-Bacteria -Nutrient enrichment -Sedimentation -Metals -Toxicity
-Bacteria -Nutrient enrichment -Sedimentation -Metals -Toxicity
-Habitat loss -Sedimentation -Toxicity -Nutrient enrichment
~ ~~
-Channelization -Streambank erosion -Urban nonpoint source runoff -Sanitary sewer bypasses -Spills -Industrial point sources -Contaminated sediments
-Streamhank erosion -Urban nonpoint source runoff -Sanitary sewer bypasses -Spills -Contaminated sediments -Industrial point sources
-Urban nonpoint source runoff -Sanitary sewer bypasses -Spills -Contaminated sediments -Airport runoff -Industrial point sources
-Urban nonpoint source runoff -Channelization -Streambank erosion -Industrial point sources
Milwaukee Estuary RAP A-21

APPENDIX A: BIOLOGICAL USES OF STREAMS IN THE MILWAUKEE RIVER BASIN
Cunent Potential Potential Uses Problems or Threats to Use Use ( f U l I / D d n O t ) Potential Uses
Waterbody Name (location)
Pollutants or Limiting Factols Cansine Problems or Threats
- ~
Holmes Avenue Creek LAL
LAL Villa Mann Creek
LAL PART -Bacteria Sedimentation -Nutrient enrichment -Toxicity
LAL PART -Bacteria -Sedimentation -Nutrient enrichment
South 43rd Street Ditch ,
LAL LAL
Lyons Park Creek
PART -Bacteria -Sedimentation -Nutrient enrichment
Length (miles)
1.1
1.2
1.1
1.5
I I -Toxicity I
I I -Toxicity I -Bacteria -Toxicity -Nutrient enrichment
-Urban nonpoint source runoff -Channelization -Sanitary sewer bypasses -Spills -Industrial point sources
-Urban nonpoint source runoff -Channelization -Sanitary sewer bypasses -Spills -Industrial point sources
-Urban nonpoint source runoff -Channelization -Sanitary sewer bypasses -Spills -Industrial point sources
-Urban nonpoint source runoff -Channelization -Sanitary sewer bypasses
A-22 Milwaukee Estuary RAP

APPENDIX B: POLLUTANTS OF CONCERN
APPENDIX B: Pollutants of Concern
The table below lists the highest priority pollutants from these groups: metals, pesticides and other organics, polycyclic aromatic hydrocarbons, volatiles. The Water Quality Technical Advisory Subcommittee compiled and prioritized these pollutants of concern for the Milwaukee Estuary RAP based on the following criteria:
Exceeds FDA (Food and Drug Administration) guidelines for fish flesh Correlates with fish tumors according to the FWS (Fish and Wildlife Service) Exceeds EPA/DNR sediment classification Found in Sediment Priority Pollutant Scans (1987, 1989) Listed in the Great Lakes Water Quality Agreement Found in Water Quality Priority Pollutant Analysis (1980) Exceeds water quality criteria in water column Exceeds water quality criteria in storm water Found in MMSD influents priority pollutant scans (1986-1990) Found in MMSD effluents priority pollutant scans (1986-1990) Found in MMSD WPDES (Wisconsin Pollutant Discharge Elimination System) permit or milorganite concern
Milwaukee Estuary RAP B-I

APPENDIX B: POLLUTANTS OF CONCERN
Table H.1: First Priority Pollutants of Concern for the Milwaukee Estuary RAP.
B-2 Milwaukee EFtuary RAP

MMSD Influents Effluents
Flesh with Fish Sediment Pollutant Water Priority Criteria in Criteria Priority Priority
Exceeds FWS Exceeds Sediment Great Water Exceeds Exceeds MMSD FDA Fish Correlation EPNDNR Priority Lakes Quality WQ WQ I=- Variables
InMMSD WPDES
Permit or
Dervlene
X X X X X X X
~
I I I I I I
I X I I X I I I I X I X I I POLYCYCLIC AROMATIC 1M)KOCAEtBONS
I I I I I I I 1 I I
VOJATES I I I Y I I X I I I X I I I I I I I I I I I
.~ _ _ .- I I 11
* Bioaurumnlative compounds, SOURCE NR 207, Wisconsin Administrative Code Substances known to exceed FDA consumptive guidelines for fish in the AOC. Substances demonstrated to cause tumors or deformities in fish (US Fish and Wildlife Service). Based upon review of recent historical sediment data from AOC. Detectable quantities reported from sediment cores (16) collected in the Outer Harbor (MMSD, 1987) or from sediment cores (25) collected in the Inner
HarboriEstnaj (ACOE, 1989). Persistent toxic substances identified for "virtual elimination" in the Great Lakes Basin (Canadian - United States Great Lakes Water Quality Agreement). ' Detectable quantities reported from samples collected at several Milwaukee Metropolitan area public water intakes (5 ) (MMSD, 1980). ' Exceeds either acute or chronic Water Quality Criteria (NR 105, Wisconsin Administrative Code) in the water column (MMSD water quality data, 1979-1983). ' Exceeds either acute or chronic water quality criteria (NR 105) in storm water (DNR, 1990).
Detectable quantities reported from priority pollutant scans on either Jones Island or South Shore wastewater treatment facilities' influent (MMSD, 1986-1990). lo Detectable quantities reported from priority pollutant scans on either Jones Island or South Shore wastewater treatment facilities' effluent (MMSD, 1986-1990).
Milwaukee Estuary RAP B-3

APPENDIX C: SEDIMENT ASSESSMENT METHODS THE SITE-SPECIFIC TRIAD APPROACH
APPENDIX C: Sediment Assessment Methods
Sediment quality assessment provides a means of answering many questions related to making contaminated sediment management decisions. The sediment assessment methods discussed in this appendix can be used to identify problem areas, establish clean-up goals, develop discharge and disposal permit criteria, and determine monitoring requirements. The ability to assess sediment quality in a technically reliable and legally defensible manner is crucial to the effective management of contaminated sediments.
A number of approaches are available for use in assessing the seventy of sediment contamination. Many older sediment assessment methods were based on comparing chemical concentrations in contaminated areas to those in reference areas without any direct consideration of biological effects Recent approaches, on the other band, focus on the relationship between sediment contaminant concentrations and adverse biological effects.
Making sediment management decisions requires relating observed conditions, biological or chemical, to objectives. Typically, objectives for sediment quality are expressed as a desired biological or chemical state, i.e., "protection of 95 percent of the species associated with the aquatic system." This appendix describes two types of approaches to sediment assessment:
The Site-Specific Triad Approach Contaminant-Specific Approaches
Site-soecific aooroaches involve evaluating the chemical and/or biological characteristics of a study area in order to understand the current conditions and to develop site-related benchmarks to support sediment management decisions. For example, if the sediments of a tributary creek increase in toxicity downstream of the headwaters, remediation would be recommended for all sediments significantly more toxic than the headwater sediments. Using contaminant-soecific auoroaches, the desired biological or chemical state is associated with contaminant-specific criteria developed for broad geographic areas.
Milwaukee Estuary RAP

APPENDIX C: SEDIMENT ASSESSMENT METHODS THE SITE-SPECIFIC TRIAD APPROACH
The Site-Soecific Triad Aoproach
The WDNR has selected the Triad Approach as its preferred method for assessment of site-specific sediment data. The approach offers these advantages: 1)
2) 3) 4)
5 ) 6 )
Provides a comprehensive approach to assessing the potential interactions of chemical mixtures (both measured and unmeasured) in sediments and biota associate with the aquatic system. Provides empirical evidence of sediment quality (hased on observations, not theory). Allows for ecological interpretations of physical, chemical, and biological properties. Can be used to develop sediment quality values (including criteria) for any measured contaminant or combination of contaminants. Can be used on any sediment type. The triad approach is extremely cost-effective when compared to potential environmental damage due to contaminated sediment and the cost of remediation.
Data Collected for Analysis
The sediment quality triad approach combines data from chemisw, bioassay, and in situ studies to derive quantitative criteria for representative chemical contaminants (Chapman, 1986). Described below are practices to collect these three measures of sediment quality.
Bulk Sediment Chemistry Tests
These tests are based on field-collected sediments. They include analysis of site-specific contaminant concentrations along with the sediment's chemical and physical characteristics such as particle size distribution, organic carbon content, and redox potential.
Sediment Bioassays
Sediment bioassays are based on field-collected sediments. They include a battery of both acute and chronic effects tests and bioaccumulation tests.
With any sediment toxicity testing, IJC (1988) recommends the following: Perform toxicity tests with sensitive indigenous species where possible, so that results can be directly related to infauna, or comparable surrogate species. Focus on sublethal effects with emphasis given to reproductive impairment.
- Examining the effects on multiple trophic levels.
Whatever assay tests are selected, they should be consistently and uniformly applied in all contaminated sediment areas under study with appropriate quality assurance and control procedurcs being used. It may be useful to investigate the application of toxicant, mutagen, or microbiological screening tests that are relatively inexpensive and easy to use to help identify potential contamination sites. Based on the results of these screening tests, more detailed toxicity tests would be conducted to definitively identify the specific contaminant and relationship to organisms and ecological effects.
c-2 Milwaukee Estuary RAP

APPENDIX C: SEDIMENT ASSESSMENT METHODS THE SITE-SPECIFIC TRIAD APPROACH
Toxicity tests conducted for the purpose of supporting sediment management decisions may include laboratory toxicityhioaccumulation testing of whole sediments, pore water and overlying water using standard test organisms (e.g. DaDhnia magna. Hvallela azteca, Chironomus tentans and CenodaDhnia dubia). Several tests are described below.
ing. In the bulk sediment toxicity approach, test organisms are exposed in the laboratory to sediments that were collected in the field. A specific biological endpoint is used to assess the response of the organisms to the sediments (i.e., to measure sediment toxicity). The bulk sediment toxicity approach is a descriptive method and cannot be used by itself to generate sediment quality criteria. One of the current uses of this approach is to indicate spatial distribution of toxicity in contaminated areas, relative degree of toxicity, and changes in toxicity along a gradient of pollution or with respect to distance from pollutant sources. Another use is to reveal "hot spots" of contaminated sediment for further investigation.
SDiked-Sediment Toxicitv Testing. The toxicity testing approach to generating contaminant-specific sediment quality criteria uses concentration-response data from sediments spiked in the laboratory with known concentrations of contaminants to establish cause-and-effect relationships between chemicals and adverse biological responses ( e g , mortality, reductions in growth or reproduction, physiological changes). Individual chemicals or other potentially toxic substances can be tested alone or in combination to determine toxic concentrations of contaminants in sediment. This approach can be used to generate sediment quality criteria or to validate sediment quality criteria generated by other approaches. Where LC50 values (lethal concentration at which 50 percent of the test organisms die) and chronic effects data are available for chemicals in sediments they can be used to identify concentrations of chemicals in sediment that are not harmful to aquatic life.
Interstitial Wate r Toxicitv Testing. The interstitial water toxicity approach is a multi- phase procedure for assessing sediment toxicity using interstitial (Le., pore) water. The use o f pore water for sediment toxicity assessment is based on the strong correlations between contaminant concentrations in pore water and toxicity (andor bioaccumulation) of sediment-associated contaminants by benthic macroinvertebrates. The approach combines the quantification of pore water toxicity with toxicity identification evaluation (TIE) procedures to identify and quantify chemical components responsible for sediment toxicity. TIE involves techniques for the identification of toxic compounds in aqueous samples containing mixtures of chemicals.
In the interstitial water method, TIE procedures are implemented in three phases to characterize pore water toxicity, identify the suspected toxicant, and confirm toxicant identification. The use of pore water as a fraction to assess sediment toxicity, in conjunction with associated TIE procedures, can provide data concerning specific toxicants responsible for acute toxicity in contaminated sediments. These data could be critical to the success of remediation of toxic sediments.
Milwaukee Estuary RAP c-3

APPENDIX C: SEDIMENT ASSESSMENT METHODS THE SITE-SPECIFIC TRIAD APPROACH
In-Situ Studies
In-situ studies may include, but arc not limited to, measures of resident organism histopathology, benthic community structure, and bioaccumulation metabolism (Chapman, 1986)
These techniques and methods have been applied to relate observed in-field biological effects to contaminants present in sediments. In-field studies can be used both to validate the toxicity test results from the laboratory and to determine functional and structural effects to aquatic organisms and communities beyond what can be tested for in the laboratory. In-field studies may involve evaluation of benthic community structure and function, caged or feral fish bioaccumulation, feral fish tumor and abnormalities, and water bird and wildlife reproduction effects. The temporal and spatial changes to benthic communities under uncontaminated conditions are becoming better understood. This is important in order to compare these changes to those that may be taking place under contaminated sediment conditions.
c-4 Milwaukee Estuary RAP

APPENDIX C: SEDIMENT ASSESSMENT METHODS THE SITE-SPECIFIC TRIAD APPROACH
Method for Assessment
The sediment quality measures described above are evaluated independently and the results (following normalization to reference site conditions) are integrated to assess the role of toxic sediment pollution in observed degradation. The standard approach for integrating these three measures is to develop a triad diagram, shown in Figure C.1. Then the ratio-to-reference (RTR) for each measure is plotted along axes arranged 120 degrees from one another with the origin of each axis at the center of the diagram. The RTR is the affected site data divided by the reference site data.
In study areas where measurements of one of the triad components cannot be made or where measurement results are not useable (e.g., oxygen depletion, recent dredging, or boat scour causing severe loss of benthic invertebrates), the other two triad components (e& sediment chemistry and toxicity) can provide important information associating contamination and effects that may not be available from conventional univariate approaches.
Application
The triad approach has been described and applied in a number of studies (see US. EPA Sediment Classification Methods Compendium, September 1992). This approach provides a
toxicity biological
22% RTR i 2.0 3.0
Figure C.l: Sediment Quality Triad Diagram. (Source: Chapman et al. 1992)
comprehensive study of in-place pollutant control as it allows for assessment of all potential interactions between chemical mixtures and the environment. It includes measurements of multiple chemicals as well as potential toxic effects of both measured and unmeasured chemicals. The difference between the reference triangle and the triangle developed for a given study site indicates the degree and type of pollution induced degradation at the study site. Table C.l below presents the interpretations of the eight generic patterns for study sites relative to reference sites.
The triad approach facilitates these sediment analysis activities:
Identify problem areas of sediment contamination where contamination-induced degradation is occurring.
Rank degraded areas as to the level of contamination/toxicity
Predict where degradation will occur based on levels of contamination/toxicity
Develop numerical sediment quality criteria
The triad components, in addition to determining typeldegree of Contamination at a site, may also be used to generate chemical-specific sediment quality criteria. Lead, PAH, and PCB criteria have been generated by the triad for the Puget Sound (Chapman, 1986 and Chapman et a1 1987). Given the absence of national and state sediment quality criteria, this ability to support development of site- specific criteria is another advantage of the triad approach.
Milwaukee Estuary RAP c-5

APPENDIX C: SEDIMENT ASSESSMENT METHODS THE SITE-SPECIFIC TRIAD APPROACH
~~
Biological Contaminant Toxicity Alteration
RTR RTR RTR Triad Intelpretation
>1 >I >I Contaminant-Induced Degradation
I
Table C.l: Eight Generic Sediment Quality Triad Results and Their Intelpretation.
-1
-1
>1 -1 Non-Target contaminant Associated Toxicity without Field Observed Effects
-1 >1 Non-Target Contaminant Associated Alteration without Observed Toxicity (Alteration Related to Non-Toxic Stress)
Contaminant-Induced Toxicity without Field I Observed Effects. Svstem is stressed. -1 I I >I
-I
>1 1 - 1
-1 -1 Strong evidence for absence of pollution-inducted degradation.
Possible Contaminant-Induced Alteration without Observed Toxicity. Contaminants are not bioavailable.
No Degradation Observed -- Below Effect Level for Target Contaminant
>1 Non-Target Contaminant Associated Degradation (Toxic Related)
I
Project Costs
The triad approach can be a valuable aid in prioritization of contaminant source studies and remedial actions. To minimize costs, the triad should be implemented in such a way as to minimize the number of contamination, toxicity, and biological alteration indicators used to adequately characterize the extent of contamination and relate the extent of contamination to actual or potential biological effects in problem areas.
Reference Site Cornpison
As in the triad approach, this assessment method identifies and uses, "clean," usually upstream reference sites for comparison to polluted sites. Once evaluated, reference, or background, site contamination levels provide a benchmark that can be used to establish the relative degree of
C -6 Milwaukee Estuary RAP

APPENDIX C: SEDIMENT ASSESSMENT METHODS THE SITE-SPECIFIC TRIAD APPROACH
enrichment of these contaminants in the sediments within the study arca (see ratio RTR values in Triad discussion above).
Reference site selection should attempt lo match the physical and hydrodynamic characteristics of the study area habitats. Characteristics that should he similar include watcr depths, currents, sediment particle size, and sediment total organic carbon content. Chemical analysis on the total sediment and the silticlay fraction cstablishes grain siLe rclationships which may lead to better site-to-site comparisons of chemical concentrations. Rcferencc sitc establishment of metals and organic concentrations should be based on levels in surficial sediment samples and concentrations associated with dating of sediment corc sections. Sediment core segments can he dated by measuring radionuclides or by the presence of pollen time markers. Reference sitcs may also be subjected to biological characterization (e.g. benthic community structure and diversity) and toxicity testing.
Milwaukee Estuary RAP c-7

APPENDIX C: SEDIMENT ASSESSMENT METHODS CONTAMINANT-SPECIFIC APPROACHES
Contaminant-Specific Approach@
As an alternative to the site-specific development of criteria for use in sediment management decisions, contaminant-specific criteria developed for a broad geographic area can be used a bcnchmarks for evaluation of observed contamination levels. These sediment quality criteria, which relate contaminant concentrations to biological effects, can be generated from theoretical or empirical relationships.
At present the State of Wisconsin does not have sediment quality standards. However, other regulatory agency criteria, guidelines or objectives can be evaluated while developing cleanup objectives for a site. Available criteridguidelines include Ontario Sediment Quality Guidelines, NOAA Status and Trends, State of Washington Sediment Standards, Netherlands Sediment Quality objectives, the EPA-proposed Sediment Quality Criteria and the Canadian Marine Sediment Quality Guidelines.
DNRs long-term goal is to develop meaningful sediment quality criteria by evaluating numerous laboratory or field measurements and the physical, chemical, and biological relationships between contamination and effects. These criteria should establish a level of contaminant concentration in sediment to protect, with an adequate margin of safety, the most sensitive aquatic organisms, human health, waterfowl and wildlife, and the ecological integrity of the waterbody. When developed, these criteria are unlikely to eliminate the need for the site-specific approaches discussed in Section 2 because of the mixtures of contaminants commonly found in sediments and the variable physical, chemical, and biological characteristics of sediments.
Listed below are the four contaminant-specific approaches for the development of sediment quality criteria that are discusses in this section.
Equilibrium Partitioning Approach Tissue Residue Approach Apparent Effects Threshold Approach Screening Level Concentration Approach
C-8 Milwaukee Estuary RAP

APPENDIX C: SEDIMENT ASSESSMENT METHODS CONTAMINANT-SPECIFIC APPROACHES
Equilibrium Partitioning Approach
The equilibrium partitioning (EQP) approach focuses on predicting the chemical interaction among sediments, interstitial water, and contaminants, based on the predicted contaminant concentrations. Chemically contaminated sediments are expected to cause adverse biological effects if the predicted interstitial water concentrations for a given contaminant exceeds the chronic water quality criterion for the contaminant.
The approach is presently most applicable for nonpolar organic compounds like PAHs and chlorinated pesticides. Interstitial water concentrations appear to be better predictors of biological effects than do bulk sediment concentrations.
In tiered applications, concentrations of sediment contaminants that exceed sediment quality criteria would be considered as causing unacceptable affects. Although sediment criteria developed using the EQP approach are similar in many ways to existing water quality criteria, their applications may differ substantially. In most cases, contaminants in the water column need only be controlled at the source to eliminate unacceptable adverse impacts. In contrast, contaminated sediments often have been in place for quite some time, and controlling the source of that pollution (if the source still exists) will not be sufficient to alleviate the problem. Safe removal, treatment, or disposal of contaminated sediments can also be difficult and expensive. For this reason, it is anticipated that the EQP-based sediment criteria will rarely be used as mandatoly clean-up levels. Rather, they will be used to predict or identify the degree and spatial extent of problems associated with contaminated areas, and thereby facilitate regulatory decisions.
Tissue Residue Approach
In the tissue residue approach, sediment chemical concentrations that will result in the lowest acceptable residues in exposed biotic tissues are determined. Concentrations of unacceptable tissue residues may be derived from toxicity tests performed during generation of chronic water quality criteria, from bioconcentration factors derived from the literature or generated by experimentation, or by comparison with human health risk criteria associated with consumption of contaminated aquatic organisms. The tissue residue approach generates numerical criteria and is most applicable for non- polar organic and organometallic compounds.
Tissue residues of chemical contaminants in aquatic organisms, particularly fish, are frequently used as measures of water quality. The tendency of organisms to bioaccumulate chemicals from water and food is one of the factors used in establishing national water quality criteria for the protection o f aquatic life, Non-polar organic chemicals, which may bioaccumulate to levels that are toxic to organisms or render the organism unfit for human food, generally will also be found as sediment contaminants.
Milwaukee Estuary RAP c-9

APPENDIX C: SEDIMENT ASSESSMENT METHODS CONTAMINANT-SPECIFIC APPROACHES
Apparent Effects Threshold
In the Apparent Effects Threshold (AET) approach, empirical data are used to identify concentrations of specific chemicals above which specific biological effects would always be expected. AET values for a particular geographic area, can he used to predict whether statistically significant biological effects are expected at a station with known concentrations of toxic chemicals. Programs using the AET approach involve an element of direct biological testing in conjunction with the use of AET values, in recognition of the fact that no approach to chemical sediment quality values is 100 percent reliable in predicting adverse biological effects.
Screening Level ConcenMon
The Screening Level Concentration Approach (SLC) approach is a field-based approach that estimates the highest concentration of a particular contaminant in sediment that can be tolerated by 95% of benthic species. SLC is derived from data on chemical concentrations and the presence or absence of benthic species.
c-10 Milwaukee Estuaty RAP

APPENDIX D: SEDIMENT SAMPLING DENSITIES COMPARISON
APPENDIX D: Sediment Sampling Densities Comparison
Rotterdam Harbor (20) (Netherlands)
Geulhaven test site (19) (Netherlands)
Zierikme, Netherlands, test site (13)
Table D.l: A Cornpatison of Sampling Densities at Vdous Sediment Remediation Sites (Keillor, 1993)
260,000 13,000 Volbeda & Schrieck 1991 200,000 10,000
5,000 263 Van Dillen 1991
1,000 77 Van Dillen 1991
Site Remediatian Sample Souree (# of Corn) A m (water Density
m a in m') m'lcole
Milwaukee Estuary AOC (12), 6,800,000 550,000 Christensen 1990
Zeebrugee, Belgium test site (10)
Gent-Terneuzen Canal, Beleium (3)
1 m deep I Milwaukee Estuary AOC' (20) I 730,000 36,500 ACOE 1989
1,500 150 Belgian Contractor 1992
5,000 1,667 Belgian Contractor 1992
11 Hamilton Harbor. whole harbor. I 21.500.000 I 391.000 I Hamilton RAP. 1991 11
Brussels Canal, Belgium (30)
Randal Reef, Hamilton Harbor sediment "hot svot" (81)
.~ (55) 1 m deep II
300,000 10,000 Belgian Contractor 1992
222,500 2,747 Hamilton RAP, 1991 and Murvhv et al 1991
I various 1 2,50040,000 I Sorensen 1984 I vroiects Dutch dredging, 1 m deep
Little Lake Butte de Morts (71) 174,000 2,450 Keillor, 1993
Milwaukee Estuary RAP D-l

BIBLIOGRAPHY
BI BLlO
G RAP HY
Aartila, Tom. 1993. Personal Communication. WDNR Southeast District Water Resources Management, Milwaukee, W1.
Apogee Research, Inc. 1993. Milwaukee Estuary Area of Concern Preliminary Financial Plan. Final Report to the Great Lakes National Program Office United States Environmental Protection Agency.
Army Corps Of Engineers-Detroit District. 1989. Milwaukee Harbor Sediment Characterization Study.
Avertt, Daniel; B. Perry; E. Torrey. 1990. Review of Removal, Containment and Treatment Technologies for Remediation of Contaminated Sediment in the Great Lakes. U.S Department of the Army. Paper EL-90-25.
Bannerman, Wisconsin Department of Natural Resources, United States Geological Survey, Southeastern Wisconsin Regional Planning Commission, 1983. Evaluation of Nonuoint Source Pollution Management in Milwaukee Counh.. Wisconsin.
Bannerman, Roger, 1990. Problem Pollutants in Wisconsin Storm water. Wisconsin Department of Natural Resources, unpublished report.
Bannerman, Roger, Baun, K., Bohn, M., Huges, P.E. and Graczyk, S.A. 1983. Evaluation of Urban Nonpoint Source Pollution Management in Milwaukee County Wisconsin, Vol. I. EPA, Water Planning Division.
Baumann, Paul C., Michael J. Mac, Stephen B. Smith, and John C. Harshbarger. 1991. Tumor Frequencies in Walleye (Stizosfedion vitreum) and Brown Bullhead (Ictalums nebulosus) and Sediment Contaminants in Tributaries of the Laurentian Great Lakes. Can. J. Fish. Aquat. Sci., Vol. 48: 1804-1810.
Brooks, A S . and J.L. Kaster. 1992. Final Report. Collection and identification of benthic organisms in the Milwaukee Harbor Estuary. Center for Great Lake Studies Special Report No. 41.
Burton, G.A. 1992. Sediment Toxicity Assessment. Lewis Publishers, Inc.
Burzynski, Tom, 1994. Personal communication
CH2M Hill, 1983. The Milwaukee Rivenvalk Guidelines, Milwaukee WI.
Chapman, P.M. 1986. Sediment quality criteria from the sediment quality triad: an example Environ. Toxicol. Chem. 5:957-964.
Chapman, P.M., Power, E.A., and Burton, G.A. 1992. Integrative Assessments in aquatic ecosystems. Sediment Toxicitv Assessment G.A. Burton, ed. Lewis Publishers. pp 3 13-340.
Chapman, P.M., R.C. Barrick, J.M. Neff and R.C. Swartz. 1987. Four independent approaches to dcveloping sediment quality criteria yield similar values for metal contaminants. Environ. Toxicol Chem. 6:723-725.
Milwaukee Estuary RAP BIB-I

BIBLIOGRAPHY
Chazin, Julian. 1992. Personal Communication.
Cherkhauer. 1992. Personal Communication
Christensen, E.R., M.F. Gin. 1990, 1991. Toxic Organic Contaminants in the Sediments of Milwaukee Harbor Estuary: Task Order 906.
City of Milwaukee Stom water Pennit Application, 1993.
Coshun, Mike. 1992. Personal Communication.
Dobos, R.Z., D.S. Painter and A. Murdoch. 1991. Contaminants in wildlife utilizing confined disposal facilities. Internat. J. Environment and Pollution, 1(1/2):73-86.
Eiger N. and P. McAvoy. 1992. Empowering the public: Lessons and ideas for communicating in the Great Lakcs' Areas of Concern. The Center for Great Lakes, Chicago, Illinois.
Financing marine and estuarine programs: a guide to resources. U.S. EPA, Apogee Research, September 1988.
Gannon, John E. 1983. Zooplankton Community Composition in Nearshore Waters of Southern Lake Michigan. United States Environmental Protection Agency, Region V. Report #905 13-821001.
Glassner, Kathy; Eiger, N.; Ray, D.; Botts, P. 1991. Making RAPS Happen - Financing and Managing Cleanups at Great Lakes Areas of Concern. Prepared for The Center for the Great Lakes.
Hamilton Harbour Remedial Action Plan. Draft. December 1991. The Remedial Action Plan for the Hamilton Harbour. Burlington and Hamilton, Ontario.
Holey, M.E. 1984. Milwaukee Harbor Estuary Fish Survey and Toxic Substance Evaluation, 1983 WDNR internal report. 71 pp.
Howmiller, R.P. and M.A. Scott. 1977. An environmental index based on relative abundance of oligochaete species. Journal WPCF. 49:809-815.
International Joint Commission (IJC). 1991a. RAP (Remedial Action Plan) Program 1991, Review and Evaluation o f the Great Lakes. 47pp. Publication: ISBN 1-895085-25-X.
International Joint Commission (IJC). 1991b. Persistent Toxic Substances Virtually Eliminating inputs to the Great Lakes. A summary prepared by the Virtual Elimination Task Force. 23pp.
International Joint Commission. 1987. Guidance on assessment and remediation of contaminated sediment problems in the Great Lakes. Windsor, Ontario, Canada.
International Joint Commission. 1987a. Report on Great Lakes water quality. Windsor, Ontario, Canada.
International Joint Commission. 1988. Procedures for the assessment of contaminated sediment problems in the Great Lakes. Report to the Great Lakes Water Quality Board. 140 pp.
Keillor, Philip. April 1993. The Challenge of Describing a Contaminated Sediment Site. Managing
BIB-2 Milwaukee Estuary RAP

BIBLIOGRAPHY
Contaminated Sediments Short Course. April 13-15, 1993. Department of Engineering Professional Development. UW-Madison.
King, K.A. and A.J. Krynitsky. 1986. Population trends, reproductive success and organochlorine chemical contamination in waterbirds nesting in Galveston Bay, Texas. Arch. Environ. Contam. Toxicol. 15:367-376.
Kizlauskas, A.G. and T.M. Rea. 1982. "Report on an Investigation of Sediment Contamination, the Milwaukee Estuary, Wisconsin, Sampled July 29-31, 1980", Remedial Programs StaK, Great Lakes National Program Office, U.S. Environmental Protection Agency, October 1982.
Lindholm, C. 1993. Personal Communication, City of Milwaukee Recycling Office.
Luebke, Paul. 1993. Personal Communication
Marsalek J. Ng Hyf. 1989. Evaluation of pollutant loadings from urban NPS; Methodology and applications. J. Great Lakes Res 15(3):444-45 1.
McCehee Marsh, Jennifer. 1993. Assessment of Nonpoint Source Pollution in Storm water Runoff in Louisville, (Jefferson County) Kentucky, USA.
Miller, T.J. and D.J. Jude. 1984. Organochlorine Pesticides, Pbbs and Mercury in Round Whitefish Fillets from Saginaw Bay Lake Huron. Journal of Great Lakes Research; 10(2):215-220.
Milwaukee County Health Department. 1992
Milwaukee Metropolitan Sewerage District. 1987. Milwaukee Outer Harbor Sediment Priority Pollutant Analysis.
Milwaukee Metropolitan Sewerage District. 1992. Water Quality Monitoring Data, 1979-1992.
Milwaukee River Revitalization Council. 1991. The Rivenvay Plan
Munton, D. 1988. Toward a More Accountable Process: The Royal Society - national Research Council Report. Perspectives on Ecosystem Management for the Great Lakes, L.K. Caldwell (ed.) pp 299-317. State University of New York Press. Albany, New York.
Murphy, T.P., H. Brouwer, M.E. Fox and E. Nagy. 1991. Spectrophotometric Measurement of Polynuclear Aromatic Hydrocarbons in Hamilton Harbour Sediments Water Poll. Res. J. Canada. 26 (l), p.1-16.00
National Wildlife Federation and the Canadian Institute for Environmental Law and Policy. 1991. A Prescription for Healthy Great Lakes. Report of the Program for Zero Discharge. 65pp.
Nowakowski, T. 1992. Personal Communication
Ontario Ministry of Environment and Energy. 1993. Guidelines for the Protection and Management of Aquatic Sediment Quality in Ontario.
Rawson, D.S., 1956, Algal Indicators of TroDhic Lake Tvues, Limnol. Oceanoa. 1:18-25
Milwaukee Estuary RAP B1B-3
BIBLIOGRAPHY
Scheuhammer, A.M. 1987. The chronic toxicity of aluminum, cadmium, mercury and lead in birds: A review. Environmental Pollution. 46:263-295.
Sonzogni, W.C. and W.R. Swain. 1984. Perspectives on Human Health Concerns from Great Lakes Contaminants. In: Nriagu, J.O.; Simmons M.O. Toxic Contaminants in the Great Lakes. Vol. 14.
Sorensen, A. 1984. Soil Analysis and Dredging. In: Dredging and Dredged Material Disposal. Ed. R.L. Montgomery and J.W. Leach.
Southeastern Wisconsin Regional Planning Commission. 1987. A Water Resources Management Plan for the Milwaukee Harbor Estuary. Volume One Inventory Findings M.arch 1987 and Volume Two Alternative and Recommended Plans, December 1987. Planning Report No. 37.
Stoermer, E.F. and E. Theriot. 1985. Phytoplankton Distribution in Saainaw Bay. J. Great Lakes Res. 11(2): 132-142.
Stocrmer, E.F., T. Nelson A. 1980. Characteristics of Benthic Algal Communities in the Upper Great Lakes. University of Michigan - Ann Arbor. Great Lakes Research Division, Environmental Research Laboratory. PB81-L44461.
Taylor, R.W. 1990. Progress Report #2 to MMSD.
United States Environmental Protection Agency. 1983. Results of the Nationwide Urban Runoff Program, Volume 1: Final Report. Water Planning Division, NTIS Publication #84-1855552.
United States Environmental Protection Agency. 1988. Financing Marine and Estuarine Programs: A Guide to Resources.
United States Environmental Protection Agency. 1989. Alternative Financing Mechanisms for State Programs.
United States Environmental Protection Agency. 1990. Feasibility Study: Detailed Analysis of Remedial Action Alternatives.
United States Environmental Protection Agency Great Lakes National Program Office. 1992. Assessment and Rcmediation of Contaminated Sediments (ARCS) 1992 Workplan.
United States Fish and Wildlife Service, 1980. Division of Ecological Services, Dept. of the Interior, Washington D.C.
Van Dillen, M. and W. Bruggeman. 1991. Sediment Quality Standards From the Third National Policy Document on Water Management. Appendix I. Institute for Inland Water Management and Waste Water Treatment. The Netherlands.
Volbeda, J.H. and G.L.M. Van der Schriek. 1991. Cleaning the Heavily Contaminated Geulhaven at Rotterdam. In Proceedings of the Congress on Characterization and Treatment of Sludge, February 26-March 1, 1991, Ghent, Belgium. Sponsored by the European Federation of Chemical Engineers,
Wawrzyn W. and R. Wakeman. 1986. Distribution of Polychlorinated Biphenyls in Cedar Creek Sediments at Ccdarburg, Ozaukee County, Wisconsin. Wisconsin Department of Natural Resources.
B I B 4 Milwaukee Estuary RAP

BIBLIOGRAPHY
Welling, M.I. 1985. An Overview of Phvlodankton Populations and Related Phvsical and Chemical Trends in the Milwaukee Harbor and Nearshore Waters. Milwaukee Metropolitan Sewerage District, unpublished data presented at the VI1 Annual Diatom Symposium.
Westenbroek, Steve. 1993. Cedar Creek PCB Mass Balance, Part 1- Data Summary and Analysis Wisconsin Department of Natural Resources. Final Draft.
Wetzel, R.G., 1975. LimnoloPy. W.B. Saunders Company.
Wisconsin Department of Natural Resources. 1989a. A Nonpoint Source Control Plan for the East and West Branches of the Milwaukee River Priority Watershed Project. Publ. WR-255-90.
Wisconsin Department of Natural Resources. 1989b. A Nonpoint Source Control Plan for the North Branch Milwaukee River Priority Watershed Project. Publ. WR-253-90.
Wisconsin Department of Natural Resources. 1990. Southeast Region Air Quality Annual Report Bureau of Air Management. Publ. #AM-057-91.
Wisconsin Department of Natural Resources. 1991. A Nonpoint Source Control Plan for the Milwaukee River South Priority Watershed Project. Publ. WR-245-91.
Wisconsin Department of Natural Resources. 1992. Wisconsin Water Quality Assessment Report to Congress.
Wisconsin Department of Natural Resources. 1992a. Wisconsin Water Quality Assessment Report to Congress, Madison, WI. Puhl-WR254-92-REV.
Wisconsin Department of Natural Resources. 1992b. Estimated Loadings of Toxic Substances to the Milwaukee River Basin from Industrial and Municipal Point Sources. Bureau of Waste Water Management, Madison, WI.
Wisconsin Department of Natural Resources. 1 9 9 2 ~ . A Nonpoint Source Control Plan for the Menomonee River Priority Watershed Project. Publ. WR-244-92.
Wisconsin Department of Natural Resources and Wisconsin Division of Health. October 1993. Health Guide for People Who Eat Sport Fish from Wisconsin Waters. Pub-IE-019. 10/92 REV.
Wisconsin Department of Natural Resources, in publication. A Noupoint Source Control Plan for the Cedar Creek Priority Watershed Project.
Wisconsin Department of Natural Resources, in publication. A Nonpoint Source Control Plan for the Cedar Creek Priority Watershed Project.
Wisconsin Department of Natural Resources. 1985. Bureau of Fisheries Management Files
Wisconsin Department of Natural Resources. 1993. Unpublished Data.
Wisconsin Legislative Audit Bureau. 1992. Audit Summary: Nonpoint Source Water Pollution Abatement Program.
Milwaukee Estuary RAP BIB-5