December 2017 Remedial Action Plan Update for …...Remedial Action Plan Update for the Milwaukee...
84
REMEDIAL ACTION PLAN UPDATE for the MILWAUKEE ESTUARY AREA OF CONCERN December 2017 Wisconsin Department of Natural Resources Office of the Great Waters
Transcript of December 2017 Remedial Action Plan Update for …...Remedial Action Plan Update for the Milwaukee...
REMEDIAL ACTION PLAN UPDATE
for the
MILWAUKEE ESTUARY AREA OF CONCERN
December 2017
Wisconsin Department of Natural Resources
Office of the Great Waters

Remedial Action Plan Update
for the
Milwaukee Estuary Area of Concern
December 2017
Compiled by Stacy Hron, WDNR Milwaukee Estuary Area of Concern Coordinator With Input and Contributions From: Milwaukee Estuary Fish and Wildlife Technical Advisory Committee (Tech Team) Coordinated by Stacy Hron Aaron Zeleske, Milwaukee River Greenway Coalition, River Revitalization Foundation Andrew Struck, Ozaukee County Angie Tornes, NPS Brian Russart, Milwaukee County Parks Cheryl Nenn, Milwaukee Riverkeeper Craig Helker, WDNR – Water Quality Daniel Sullivan, USGS Dianne Robinson, WDNR – Wildlife Management Faith Fitzpatrick, USGS Gary Casper, UWM Field Station Heather Williams, USEPA – GLNPO John Janssen, UWM John Masterson, WDNR – OGW
Julia Robson, Milwaukee County Parks Kim Forbeck, Urban Ecology Center Kristina Betzold, WDNR – Env. Analysis Leah Medley, USEPA – GLNPO Marsha Burzynski, WDNR – R&R Matt Magruder, MMSD Patrick Elliott, MMSD Rick Fox, OBG Todd Polacek, Applied Ecological Services Tom Burzynski, WDNR – Fisheries Management Tom Sear, water resources engineer, citizen Tom Slawski, Southeast WI Regional Planning Commission Vic Pappas, WDNR – OGW Will Wawrzyn, Citizen
Milwaukee Estuary Community Advisory Committee Aaron Zeleske, Milwaukee River Greenway Coalition, River Revitalization Foundation Andrew Struck, Ozaukee County* Bob Paulson, WE Energies Chris Litzau, Citizen* (Chairperson) Cheryl Nenn, Milwaukee Riverkeeper* Elizabeth Hittman, City of Milwaukee
Janee Pederson, GZA* Joan Herriges, Southeast WI Watersheds Trust John Hacker, Citizen* Lilith Fowler, Harbor District Inc. Linda Reid, Southeast WI Watersheds Trust Lindsay Frost, Harbor District Inc.* Rick Fox, NRT
*Denotes Leadership Team Member Disclaimer The Great Lakes Water Quality Agreement is a non-regulatory agreement between the U.S. and Canada, and criteria developed under its auspices are non-regulatory. The actions identified in this document as needed to meet beneficial use impairment (BUI) delisting targets are not subject to enforcement or regulatory actions. The actions identified in this Remedial Action Plan Update do not constitute a list of preapproved projects, nor is it a list of projects simply related to BUIs or generally to improve the environment. Actions identified in this document are directly related to removing a BUI and are needed to delist the Area of Concern.
Remedial Action Plan Update for the Milwaukee Estuary Area of Concern December 2017
i
TABLE OF CONTENTS
PURPOSE STATEMENT .............................................................................................................................. 1
2017 PROGRESS SUMMARY ..................................................................................................................... 3
BENEFICIAL USE IMPAIRMENT UPDATES ............................................................................................ 11
FISH TUMORS OR OTHER DEFORMITIES .......................................................................................... 11
BIRD OR ANIMAL DEFORMITIES OR REPRODUCTION PROBLEMS (POTENTIALLY IMPAIRED) . 13
RESTRICTIONS ON FISH AND WILDLIFE CONSUMPTION................................................................ 15
RESTRICTIONS ON DREDGING ACTIVITIES ...................................................................................... 17
DEGRADATION OF BENTHOS .............................................................................................................. 18
DEGRADATION OF PHYTOPLANKTON AND ZOOPLANKTON POPULATIONS ............................... 20
LOSS OF FISH AND WILDLIFE HABITAT ............................................................................................. 21
DEGRADATION OF FISH AND WILDLIFE POPULATIONS .................................................................. 23
BEACH CLOSINGS ................................................................................................................................. 25
EUTROPHICATION OR UNDESIRABLE ALGAE .................................................................................. 27
DEGRADATION OF AESTHETICS ........................................................................................................ 28
REFERENCES ............................................................................................................................................ 29
APPENDICES ............................................................................................................................................. 31
List of Figures
Figure 1. The Boundaries of the Milwaukee Estuary Area of Concern .............................................. 2
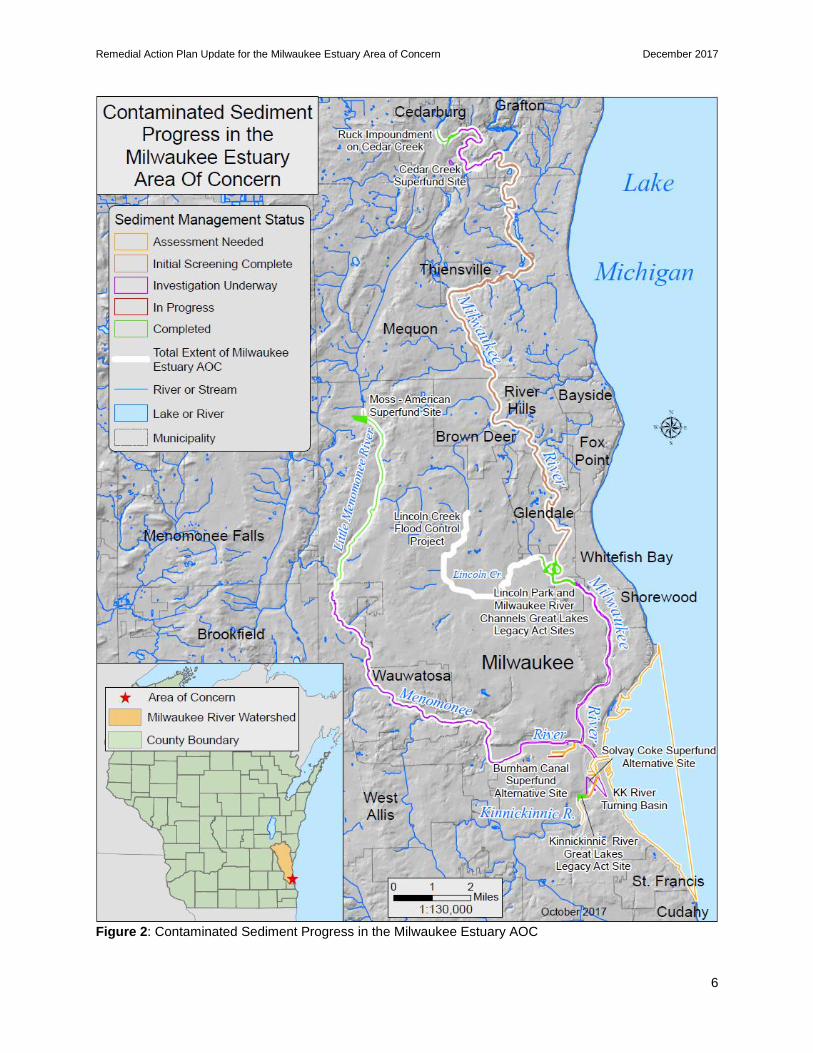
Figure 2: Contaminated Sediment Progress in the Milwaukee Estuary AOC .................................... 6
List of Tables
Table 1. Current Status of Beneficial Use Impairments in the Milwaukee Estuary AOC ................ 10
List of Appendices
Appendix A Acronyms
Appendix B Definitions
Appendix C BUI Tracking Matrix
Appendix D Milwaukee River Floodplains Frequently Asked Questions
Appendix E USGS Tree Swallow Publications
Remedial Action Plan Update for the Milwaukee Estuary Area of Concern December 2017
1
PURPOSE STATEMENT
This Remedial Action Plan (RAP), which updates the 2016 RAP, documents and communicates progress
made in the AOC in the last year and shares the path forward with our partners and stakeholders. The
RAP includes a concise summary of beneficial use impairment status and tracks progress on specific
actions that are important for reaching the delisting targets. These “actions” may include on-the-ground
restoration projects, monitoring and assessment projects, and stakeholder engagement processes. As
the primary agency with the responsibility to develop and implement the RAP, the Wisconsin Department
of Natural Resources and the Office of Great Waters is committed to making progress in remediating and
restoring Wisconsin’s Areas of Concern. In order to be lasting and effective, the AOC program must
continuously improve, evaluating its course as new information and technology become available.
Subsequent RAP updates will be produced as needed to incorporate new information.
Remedial Action Plans are required by Annex 1 of the Great Lakes Water Quality Protocol of 2012 (which
replaced the 1987 Protocol amending the Revised Great Lakes Water Quality Agreement of 1978). The
2012 Protocol indicates that Remedial Action Plans must include the following elements:
1. Identification of beneficial use impairments (BUIs) and causes;
2. Criteria for the restoration of beneficial uses that take into account local conditions and
established in consultation with the local community;
3. Remedial measures to be taken, including identification of entities responsible for implementing
these measures;
4. A summary of the implementation of remedial measures taken and the status of the beneficial
use; and
5. A description of surveillance and monitoring processes to track the effectiveness of remedial
measures and confirm restoration of beneficial uses.
Remedial Action Plan Update for the Milwaukee Estuary Area of Concern December 2017
2
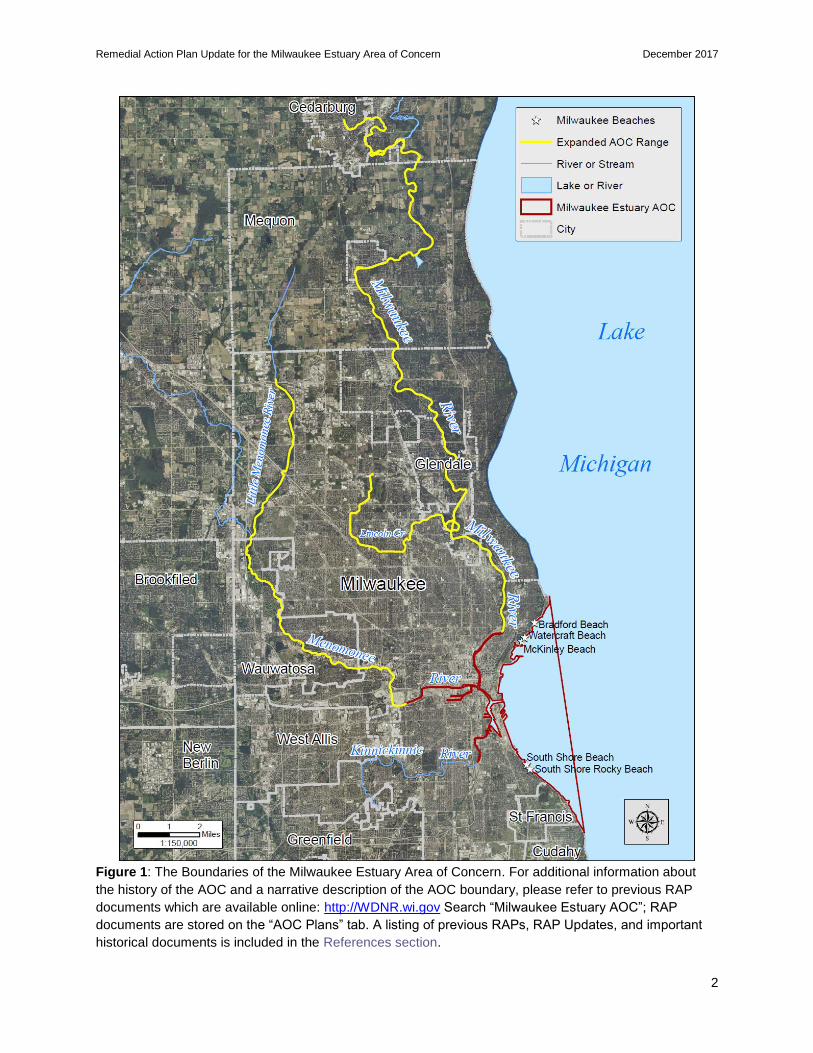
Figure 1: The Boundaries of the Milwaukee Estuary Area of Concern. For additional information about
the history of the AOC and a narrative description of the AOC boundary, please refer to previous RAP
documents which are available online: http://WDNR.wi.gov Search “Milwaukee Estuary AOC”; RAP
documents are stored on the “AOC Plans” tab. A listing of previous RAPs, RAP Updates, and important
historical documents is included in the References section.
Remedial Action Plan Update for the Milwaukee Estuary Area of Concern December 2017
3
2017 PROGRESS SUMMARY
The Wisconsin Department of Natural Resources (WDNR) and partners are working to improve
conditions in the Milwaukee Estuary Area of Concern (AOC; Figure 1). During the past year progress has
been made on moving sediment remediation forward, completing assessments to gather information on
Beneficial Use Impairment (BUI) status and support decision making, and continuing to make progress on
habitat restoration management actions. Details about projects in the AOC are included in Appendix C. A
summary of progress on each of the types of projects carried out through the AOC program are detailed
below. Information of the status of each BUI is included in the chapters following.
Sediment
Contaminated sediments contribute to the majority of BUIs in the Milwaukee Estuary AOC. Therefore,
remediating contaminated sediment sites is necessary in making progress in addressing this impairment.
A map illustrating contaminated sediment progress in the AOC is included in Figure 2. Since the last
Remedial Action Plan (RAP) Update, the following dredging related actions occurred:
• Work to characterize sediments throughout the AOC continued via the Great Lakes Legacy Act
Program. Through this program the state requests U.S. Environmental Protection Agency
(USEPA) to investigate and characterize the extent of sediment contamination in the AOC, which
can position these areas for future cleanups. This work is completed by USEPA contractors at full
federal expense, and is dependent on funding levels. This year, work continued on the Milwaukee
River Downstream Characterization Project, which covers the area between Estabrook Dam and
the confluence with the Menomonee River and was started in Fall 2016. In March, a public
meeting was held to inform the public of preliminary data for the floodplain areas. Landowners in
this area were also notified of the results. Preliminary data indicates that although the
polychlorinated biphenyl (PCB) levels in the floodplain soils/sediments are higher than they
should be, they are low enough that no illness to the public is expected. The Wisconsin
Department of Health Services (DHS) is working with local health organizations to provide
information and help people make wise decisions that minimize exposure to PCBs and other
chemicals in the sediment. DHS recommends avoiding exposure to PCBs when possible
because PCBs can build up in the human body over time. Common sense steps include not
touching soil that could contain PCBs; removing shoes upon entering the home; washing hands
with soap and water and cleaning pets, bikes and tools after visiting the Milwaukee River
floodplain. Consuming fish that contain PCBs is often the primary route of exposure. Anglers are
encouraged to continue following posted fish consumption advisories, which can be found by
visiting dnr.wi.gov and searching “fish consumption.” An FAQ document with more information on
this project is in Appendix D. Signs are also being posted along the corridor to inform users of the
conditions along the river. As this project progresses and final data is analyzed, USEPA is
working with Wisconsin DNR and Milwaukee County Parks to determine the appropriate next
steps for the floodplains.
• No new Legacy Act Characterization projects were started in 2017. However, a request was
submitted, as in 2016, for additional characterization work in the selected areas in the
Kinnickinnic River, nearshore waters, inner and outer harbors of the AOC. This request
encompassed all known characterization needs in the AOC.
• WE Energies entered into a project agreement with USEPA Great Lakes National Program Office
(GLNPO) for a Great Lakes Legacy Act betterment project in portions of the Milwaukee and
Menomonee Rivers. The project includes a focused remedial investigation and feasibility study for
portions of the Menomonee River and Milwaukee River for addressing sediments adjacent to two
Remedial Action Plan Update for the Milwaukee Estuary Area of Concern December 2017
4
former coal gasification facilities (West Side MGP and Third Ward MGP). WE Energies, as part of
an in-kind contribution, hired a contractor to conduct sampling on the Milwaukee River portion of
the project area, which was completed in May. GLNPO hired a consultant to prepare the
feasibility study for the entire project area to determine options for remediation of the sediments.
Additional sampling was completed by this consultant in late October and early November. After
data analysis is complete and clean up goals are set, a draft feasibility study report will be
prepared.
• Miller Compressing has continued planning for remediation at the Burnham Canal Superfund site.
The review and approval of design plans by the regulatory agencies is complete. Miller
Compressing is working towards implementing their sediment management project in 2018.
• Dredging continued at the Cedar Creek Superfund Alternative site by contractors for Mercury
Marine throughout 2017 to address PCB contamination. Remediation of sediments from the Wire
and Nail Pond and Columbia Pond will be completed by the end of the year. Including the work in
late 2016 in Ruck Raceway, about 73,000 cubic yards of contaminated sediment was
mechanically removed and disposed of in landfills. Additionally, about 6,000 cubic yards of soil
from adjacent floodplains was removed. Mercury Marine’s contractors are working on an
investigation of the remainder of the Superfund site downstream of Wire and Nail Pond to
determine what actions may be necessary in this stretch of Cedar Creek.
• WDNR and U.S. Geological Survey (USGS), along with partner Milwaukee Metropolitan
Sewerage District (MMSD), worked to develop a project proposal to assess non-point source
polycyclic aromatic hydrocarbon (PAH) loading to the Milwaukee Estuary in 2016. This
information would be valuable for AOC related sediment management action planning. The
proposal was submitted to USEPA for Great Lakes Restoration Initiative (GLRI) funding by
USGS. It was funded and preparation has begun for the mass balance based assessment to be
piloted in the Kinnickinnic River portion of the AOC.
Assessments
This year, there are many assessment projects wrapping up and publishing reports. These include
several projects which WDNR received GLRI funding to carry out in previous years. An interpretive report
for the 2014 plankton and benthos sampling is in draft awaiting publication. Milwaukee Riverkeeper has
submitted all the citizen based aesthetics monitoring information from 2017 and the data entry and
analysis by WDNR staff is underway. USGS completed additional sampling in Milwaukee and published
some results from their tree swallow studies in WI AOCs (Appendix E). These reports are being used to
determine status and/or next steps that are needed for the following BUIs, respectively: degradation of
benthos, degraded phytoplankton and zooplankton populations, degradation of aesthetics, and bird or
animal deformities or reproductive problems. In addition, several assessments related to the degradation
of fish and wildlife populations BUI are wrapping up. These are to assist in determining management
actions and metrics for the impairment. Most were scheduled to be completed by the end of September
2017, but have had delays in reporting. Final reports are expected by the end of 2017 or early 2018.
Following completion of the work and dissemination of the results, the Fish and Wildlife Technical
Advisory Committee (Tech Team) will begin management action and BUI removal metric setting. The
assessments in progress include the following:
• Staff from the University of Wisconsin-Milwaukee (UWM) Field Station and Milwaukee County
Dept. of Parks, Recreation & Culture are completing comprehensive wildlife surveys throughout
the AOC. WDNR received GLRI funding for assessments. This work will include mapping and
identify potential opportunities and metrics for AOC habitat projects and BUI removal.

Remedial Action Plan Update for the Milwaukee Estuary Area of Concern December 2017
5
• Ozaukee County Planning & Parks Dept. and WDNR Fisheries Bureau are collecting and
assessing data for the wadeable portions of the AOC. This will include a compilation of existing
and new data along with modeling to assist with habitat project planning. Additional mapping will
be produced by WDNR Office of Great Waters staff.
• USGS completed the third and final year of field work in fall 2016 for a non-wadeable fisheries
assessment. This project reproduces much of a study completed by WDNR in the early 1980s,
and will be used to compare current and past conditions. The information will also be used for
habitat management action planning and BUI metric setting.
• UWM School of Freshwater Sciences received funding from Fund for Lake Michigan and WDNR
for an assessment of habitat in the Milwaukee harbor. They will be completing their field work in
2017.
Remedial Action Plan Update for the Milwaukee Estuary Area of Concern December 2017
6
Figure 2: Contaminated Sediment Progress in the Milwaukee Estuary AOC
Remedial Action Plan Update for the Milwaukee Estuary Area of Concern December 2017
7
Habitat Restoration and Management Action Implementation
Throughout the year, the AOC coordinator worked with partners to continue to make progress on
planning and implementing projects identified as management actions. Most these were habitat
restoration projects and one was a beach remediation. The AOC Coordinator and members of the Fish
and Wildlife Technical Advisory Committee have been providing technical support for these efforts.
In addition, partners made great strides in implementing some projects. With activities undertaken in
2017, there is a lot of progress being made on implementing all the identified remaining management
actions for the “Loss of Fish and Wildlife Habitat” impairment.
• Bay View/ Grand Trunk Wetland Restoration – Work to complete an engineering feasibility study
for the wetland restoration continued in cooperation with the Redevelopment Authority of the City
of Milwaukee. This builds upon a Master Plan for the site both of which were funded by a grant
from Fund for Lake Michigan. WDNR applied for and received GLRI funding for the City to begin
final design and permitting for the project in 2017. In September, a design consultant team was
selected and a kickoff meeting was held in October. Surveys and other necessary data gathering
tasks are being complete in late 2017. Work on the preliminary and final design for the wetland
restoration will continue through September 2018.
• Kinnickinnic River Corridor Habitat Rehabilitation – In 2017, MMSD has undertaken a 2-pronged
effort in cooperation with WDNR to move forward on the next steps for the Kinnickinnic River
Corridor Habitat Rehabilitation. After completion of the feasibility study, which looked at what can
be done to improve aquatic habitat between Beecher Street and I-94, it was clear that more work
was needed to look at flooding issues before a large-scale restoration could be undertaken in this
stretch. However, there were some aspects of the project that could be moved further, including
1) some limited habitat restoration work and 2) collecting information to assist in making sound
decisions regarding aeration solutions for the river. MMSD hired a consultant team to continue
this work, with concept designs for the restoration work expected in early 2018, and construction
in the summer. Also, the first test of a pilot aeration system was conducted during an
unseasonably warm spell in September. This work is funded by GLRI funds that WDNR received
in late 2016 and will continue through September 2018.
• Burnham Canal Wetland Restoration – Another fish and wildlife habitat restoration project WDNR
is cooperating with MMSD to complete is a wetland restoration in the Burnham Canal. The canal
is also the location of a Superfund site. As mentioned in the sediment summary above, the
responsible party for this site, Miller Compressing, is working to implement their remedial action in
2018. With these developments, planning for the wetland restoration was revived. The Army
Corps of Engineers completed engineered plans and specifications for the wetland restoration
and associated fill material that will be the base of the wetland. WDNR is working with MMSD to
hire a contractor to complete a bid package based on these plans that can be used for
construction.
• Estabrook Dam Fish Passage – Fish passage at Estabrook Dam has been identified as a
management actions for the “Loss of Fish and Wildlife Habitat” impairment. After consulting with
MMSD, the dam owner, WDNR applied for and received funding to implement fish passage. In
this case, MMSD chose dam removal to accomplish the fish passage. Project plans and
specification were prepared by MMSD’s consultant team this year and bid for construction in the
fall. A contract for construction was awarded in early December, with deconstruction activities
expected in early 2018.
Remedial Action Plan Update for the Milwaukee Estuary Area of Concern December 2017
8
• Kletzsch Dam Fish Passage – Fish passage at Kletzsch Dam was also identified as a
management action for the “Loss of Fish and Wildlife Habitat” impairment. After consulting with
Milwaukee County, the dam owner, WDNR applied for and received funding to implement fish
passage along with other improvements that Milwaukee County was pursuing in the park. At this
dam, Milwaukee County chose construction of a fish passage structure to provide aquatic
connectivity. The structure will be a passive rock ramp fishway. The County hired a design
consultant team in fall 2017 and a kickoff meeting was held in October. The concept designs are
expected in early 2018, with construction to follow in summer 2018.
• Little Menomonee Corridor Restoration – The majority owner of this project area is Milwaukee
County Parks, Recreation and Culture. WDNR has been working on smaller efforts within this
corridor for several years, but in 2017, planning began for restoration throughout the entire
corridor. This planning is funded through GLRI funds that the WDNR applied for and received,
which were then sub-awarded to the County. The first steps involved detailed data collection on
the existing plant communities within the corridor. The next step will be putting together a natural
areas management plan for the entire 6.5-mile-long corridor, with specific habitat restoration
actions. Throughout this planning effort, the USEPA Superfund program and other technical
stakeholders involved in the cleanup of the Moss-American site will be consulted. The plan will be
completed by September 2018. The plan will then be used to guide the restoration efforts that will
follow.
• South Shore Beach Rehabilitation – WDNR working with Milwaukee County Dept. of Parks,
Recreation & Culture, applied for and received funding to continue work on remediating South
Shore Beach. This builds upon a recent master plan that was completed for part of the park as
well as improvements, including green infrastructure installation, aimed at reducing bacterial
loading that are underway. The funds received in late 2017 were used to hire a design contractor
that will complete additional monitoring, modeling and concept design production. After input from
stakeholders, a preferred design will be selected and design plans and specifications will be
produced.
Next Year
In the next year the AOC Coordinator and WDNR staff will continue to make progress on many fronts in
the Milwaukee Estuary AOC. The following activities are planned for 2018:
• Continue to work with the Fish and Wildlife Technical Advisory Committee to review and
synthesize data for the degradation of fish and wildlife populations impairment. This will be
followed by working on developing metrics and management actions for the impairment.
• Continue to work on project planning, design and construction for Bay View/Grand Trunk Wetland
Restoration, Kinnickinnic River Corridor Habitat Rehabilitation, Burnham Canal Wetland
Restoration, Estabrook Dam Fish Passage, Little Menomonee Corridor Restoration and South
Shore Beach Rehabilitation. Assist partners with community outreach and public meeting
activities.
• Work with the Community Advisory Committee on the degradation of aesthetics impairment and
determine next steps.
• Review the results of the plankton and benthos assessments completed by USGS and determine
next steps for the degradation of benthos and degradation of phytoplankton and zooplankton
populations impairments. Also, existing benthos data from throughout the AOC will be compiled
and analyzed to assist in assessing the degradation of benthos BUIs.

Remedial Action Plan Update for the Milwaukee Estuary Area of Concern December 2017
9
• Review Total Maximum Daily Load (TMDL) and bacteria source tracking outputs and consider
next steps for the eutrophication or undesirable algae and beach closings/recreational restrictions
impairments. Prepare to for management action planning, likely in 2019.
• Continue sediment characterization and evaluate data to determine where additional cleanups
might be necessary.
• Work with new and ongoing sediment cleanup projects to assure AOC goals and targets are met.
Remedial Action Plan Update for the Milwaukee Estuary Area of Concern December 2017
10
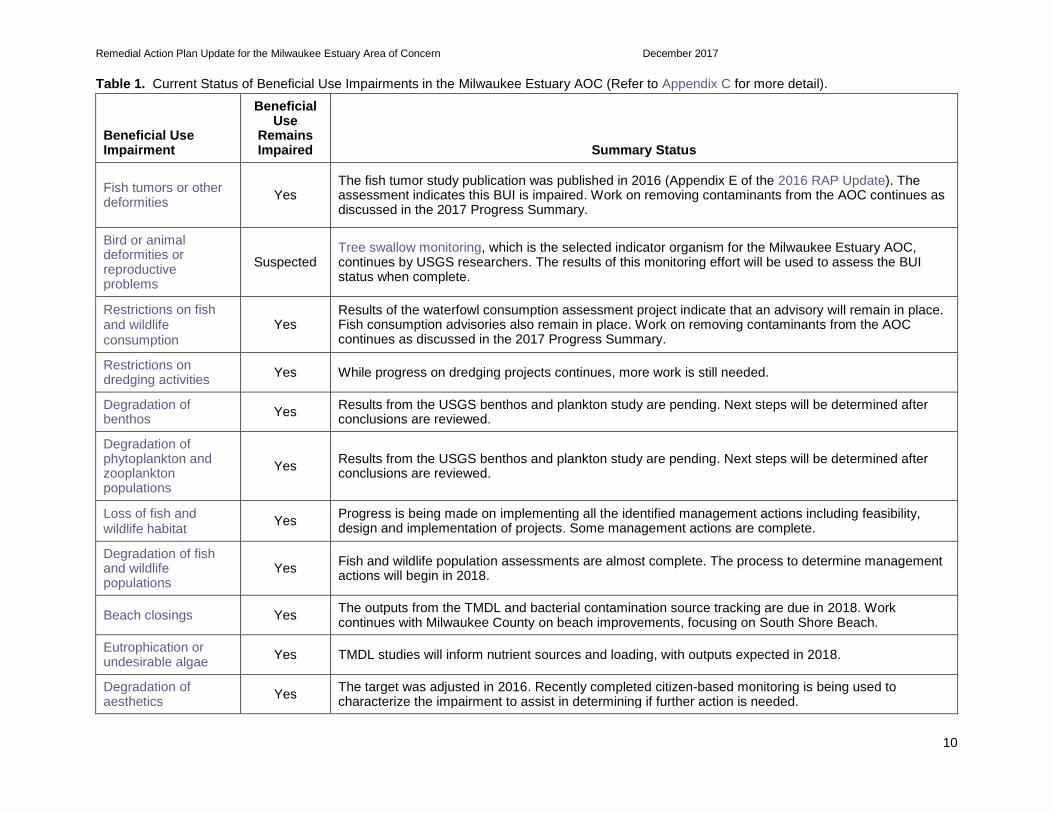
Table 1. Current Status of Beneficial Use Impairments in the Milwaukee Estuary AOC (Refer to Appendix C for more detail).
Beneficial Use Impairment
Beneficial Use
Remains Impaired Summary Status
Fish tumors or other deformities
Yes The fish tumor study publication was published in 2016 (Appendix E of the 2016 RAP Update). The assessment indicates this BUI is impaired. Work on removing contaminants from the AOC continues as discussed in the 2017 Progress Summary.
Bird or animal deformities or reproductive problems
Suspected Tree swallow monitoring, which is the selected indicator organism for the Milwaukee Estuary AOC, continues by USGS researchers. The results of this monitoring effort will be used to assess the BUI status when complete.
Restrictions on fish and wildlife consumption
Yes Results of the waterfowl consumption assessment project indicate that an advisory will remain in place. Fish consumption advisories also remain in place. Work on removing contaminants from the AOC continues as discussed in the 2017 Progress Summary.
Restrictions on dredging activities
Yes While progress on dredging projects continues, more work is still needed.
Degradation of benthos
Yes Results from the USGS benthos and plankton study are pending. Next steps will be determined after conclusions are reviewed.
Degradation of phytoplankton and zooplankton populations
Yes Results from the USGS benthos and plankton study are pending. Next steps will be determined after conclusions are reviewed.
Loss of fish and wildlife habitat
Yes Progress is being made on implementing all the identified management actions including feasibility, design and implementation of projects. Some management actions are complete.
Degradation of fish and wildlife populations
Yes Fish and wildlife population assessments are almost complete. The process to determine management actions will begin in 2018.
Beach closings Yes The outputs from the TMDL and bacterial contamination source tracking are due in 2018. Work continues with Milwaukee County on beach improvements, focusing on South Shore Beach.
Eutrophication or undesirable algae
Yes TMDL studies will inform nutrient sources and loading, with outputs expected in 2018.
Degradation of aesthetics
Yes The target was adjusted in 2016. Recently completed citizen-based monitoring is being used to characterize the impairment to assist in determining if further action is needed.
Remedial Action Plan Update for the Milwaukee Estuary Area of Concern December 2017
11
BENEFICIAL USE IMPAIRMENT UPDATES
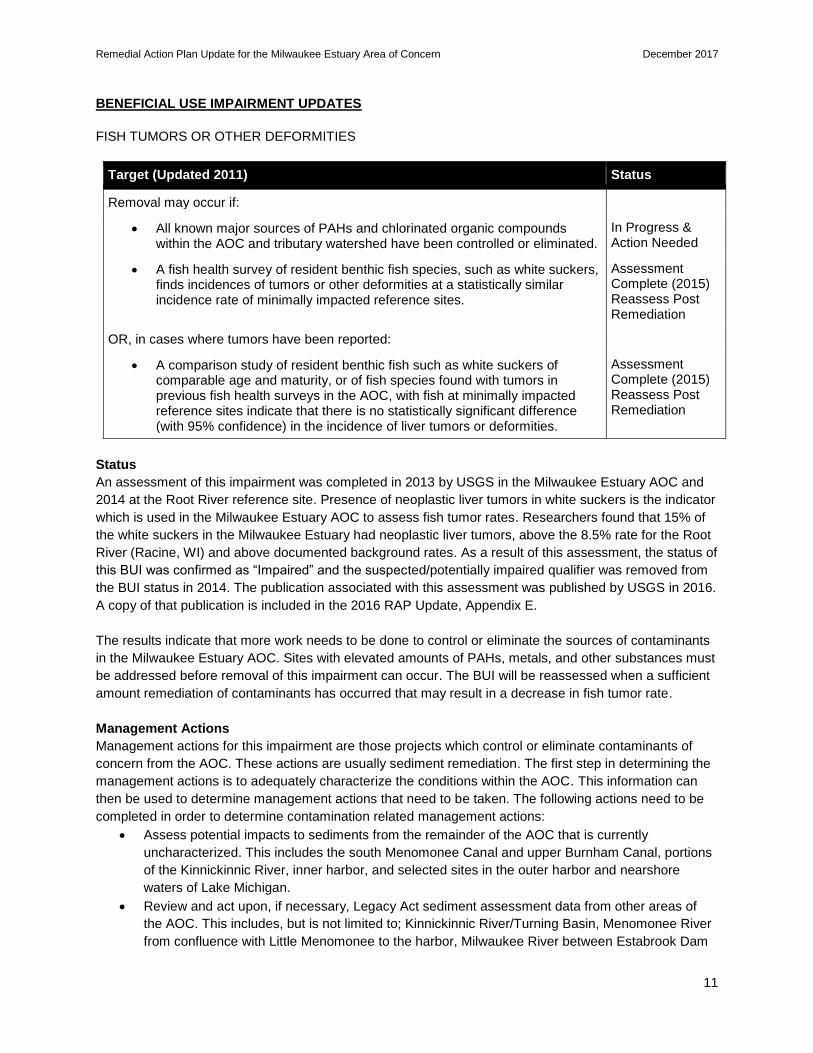
FISH TUMORS OR OTHER DEFORMITIES
Target (Updated 2011) Status
Removal may occur if:
• All known major sources of PAHs and chlorinated organic compounds within the AOC and tributary watershed have been controlled or eliminated.
In Progress & Action Needed
• A fish health survey of resident benthic fish species, such as white suckers, finds incidences of tumors or other deformities at a statistically similar incidence rate of minimally impacted reference sites.
Assessment Complete (2015) Reassess Post Remediation
OR, in cases where tumors have been reported:
• A comparison study of resident benthic fish such as white suckers of comparable age and maturity, or of fish species found with tumors in previous fish health surveys in the AOC, with fish at minimally impacted reference sites indicate that there is no statistically significant difference (with 95% confidence) in the incidence of liver tumors or deformities.
Assessment Complete (2015) Reassess Post Remediation
Status
An assessment of this impairment was completed in 2013 by USGS in the Milwaukee Estuary AOC and
2014 at the Root River reference site. Presence of neoplastic liver tumors in white suckers is the indicator
which is used in the Milwaukee Estuary AOC to assess fish tumor rates. Researchers found that 15% of
the white suckers in the Milwaukee Estuary had neoplastic liver tumors, above the 8.5% rate for the Root
River (Racine, WI) and above documented background rates. As a result of this assessment, the status of
this BUI was confirmed as “Impaired” and the suspected/potentially impaired qualifier was removed from
the BUI status in 2014. The publication associated with this assessment was published by USGS in 2016.
A copy of that publication is included in the 2016 RAP Update, Appendix E.
The results indicate that more work needs to be done to control or eliminate the sources of contaminants
in the Milwaukee Estuary AOC. Sites with elevated amounts of PAHs, metals, and other substances must
be addressed before removal of this impairment can occur. The BUI will be reassessed when a sufficient
amount remediation of contaminants has occurred that may result in a decrease in fish tumor rate.
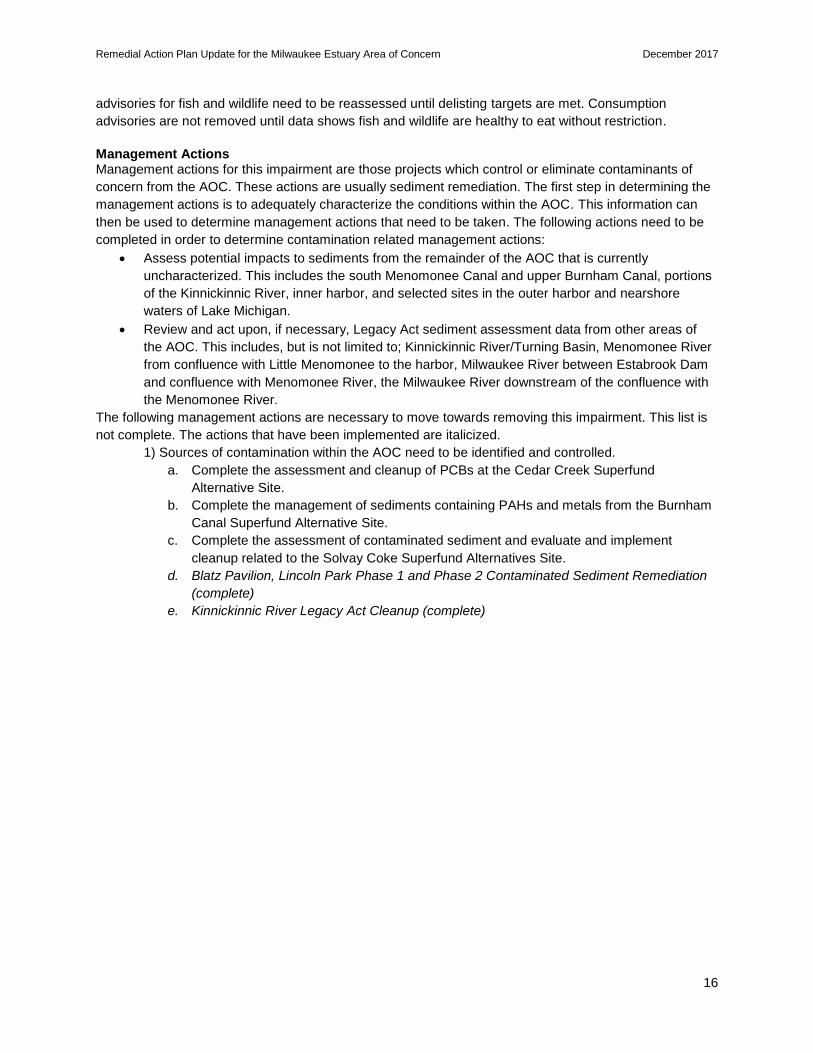
Management Actions
Management actions for this impairment are those projects which control or eliminate contaminants of
concern from the AOC. These actions are usually sediment remediation. The first step in determining the
management actions is to adequately characterize the conditions within the AOC. This information can
then be used to determine management actions that need to be taken. The following actions need to be
completed in order to determine contamination related management actions:
• Assess potential impacts to sediments from the remainder of the AOC that is currently
uncharacterized. This includes the south Menomonee Canal and upper Burnham Canal, portions
of the Kinnickinnic River, inner harbor, and selected sites in the outer harbor and nearshore
waters of Lake Michigan.
• Review and act upon, if necessary, Legacy Act sediment assessment data from other areas of
the AOC. This includes, but is not limited to; Kinnickinnic River/Turning Basin, Menomonee River
from confluence with Little Menomonee to the harbor, Milwaukee River between Estabrook Dam
Remedial Action Plan Update for the Milwaukee Estuary Area of Concern December 2017
12
and confluence with Menomonee River, the Milwaukee River downstream of the confluence with
the Menomonee River.
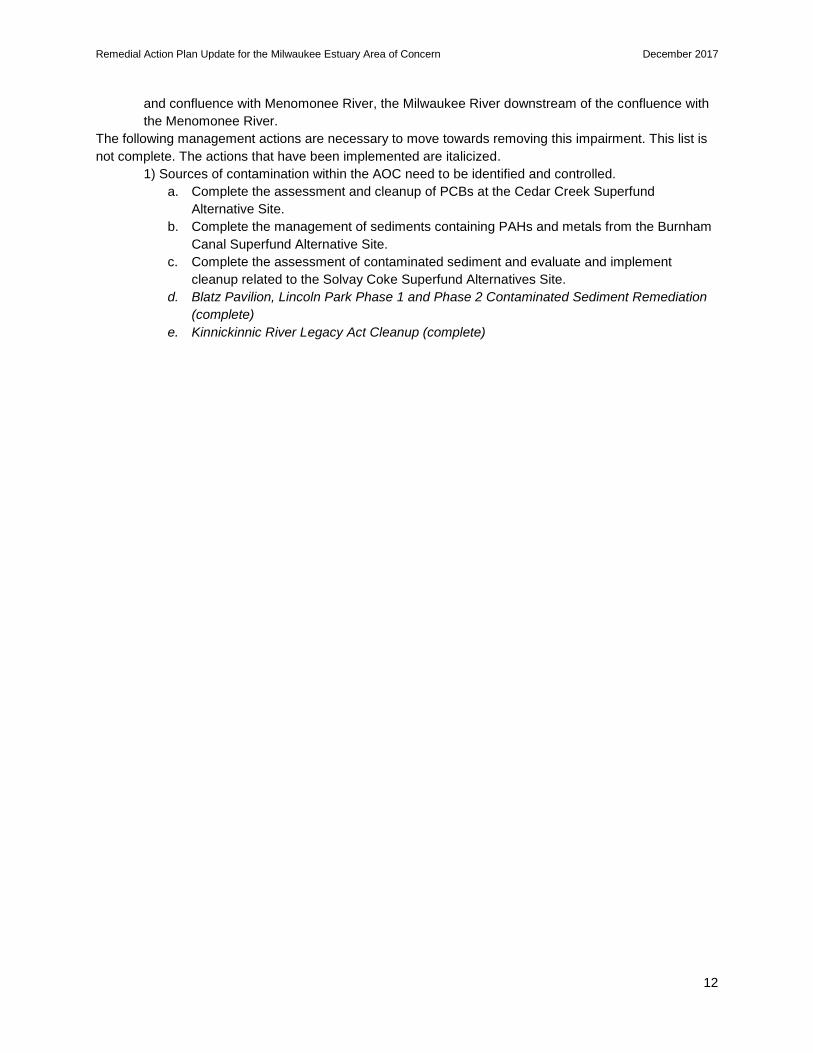
The following management actions are necessary to move towards removing this impairment. This list is
not complete. The actions that have been implemented are italicized.
1) Sources of contamination within the AOC need to be identified and controlled.
a. Complete the assessment and cleanup of PCBs at the Cedar Creek Superfund
Alternative Site.
b. Complete the management of sediments containing PAHs and metals from the Burnham
Canal Superfund Alternative Site.
c. Complete the assessment of contaminated sediment and evaluate and implement
cleanup related to the Solvay Coke Superfund Alternatives Site.
d. Blatz Pavilion, Lincoln Park Phase 1 and Phase 2 Contaminated Sediment Remediation
(complete)
e. Kinnickinnic River Legacy Act Cleanup (complete)
Remedial Action Plan Update for the Milwaukee Estuary Area of Concern December 2017
13
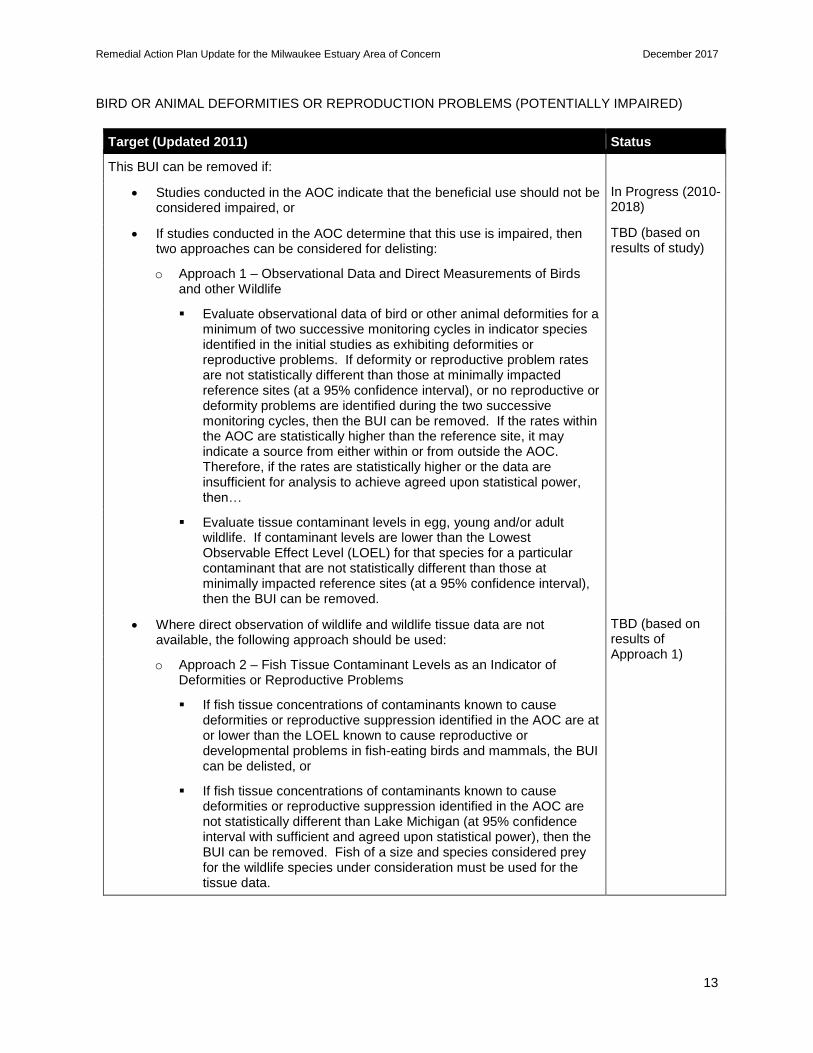
BIRD OR ANIMAL DEFORMITIES OR REPRODUCTION PROBLEMS (POTENTIALLY IMPAIRED)
Target (Updated 2011) Status
This BUI can be removed if:
• Studies conducted in the AOC indicate that the beneficial use should not be considered impaired, or
In Progress (2010-2018)
• If studies conducted in the AOC determine that this use is impaired, then two approaches can be considered for delisting:
TBD (based on results of study)
o Approach 1 – Observational Data and Direct Measurements of Birds and other Wildlife
▪ Evaluate observational data of bird or other animal deformities for a minimum of two successive monitoring cycles in indicator species identified in the initial studies as exhibiting deformities or reproductive problems. If deformity or reproductive problem rates are not statistically different than those at minimally impacted reference sites (at a 95% confidence interval), or no reproductive or deformity problems are identified during the two successive monitoring cycles, then the BUI can be removed. If the rates within the AOC are statistically higher than the reference site, it may indicate a source from either within or from outside the AOC. Therefore, if the rates are statistically higher or the data are insufficient for analysis to achieve agreed upon statistical power, then…
▪ Evaluate tissue contaminant levels in egg, young and/or adult wildlife. If contaminant levels are lower than the Lowest Observable Effect Level (LOEL) for that species for a particular contaminant that are not statistically different than those at minimally impacted reference sites (at a 95% confidence interval), then the BUI can be removed.
• Where direct observation of wildlife and wildlife tissue data are not available, the following approach should be used:
TBD (based on results of Approach 1)
o Approach 2 – Fish Tissue Contaminant Levels as an Indicator of Deformities or Reproductive Problems
▪ If fish tissue concentrations of contaminants known to cause deformities or reproductive suppression identified in the AOC are at or lower than the LOEL known to cause reproductive or developmental problems in fish-eating birds and mammals, the BUI can be delisted, or
▪ If fish tissue concentrations of contaminants known to cause deformities or reproductive suppression identified in the AOC are not statistically different than Lake Michigan (at 95% confidence interval with sufficient and agreed upon statistical power), then the BUI can be removed. Fish of a size and species considered prey for the wildlife species under consideration must be used for the tissue data.
Remedial Action Plan Update for the Milwaukee Estuary Area of Concern December 2017
14
Status
This BUI is listed as potentially impaired, as sufficient data does not exist to definitively list it as impaired
or unimpaired. Due to the presence of contaminants such as PCBs and metals in sediments in the AOC,
which have the potential to impair the reproduction and development of wildlife, this BUI is considered
impaired.
USGS researchers have been using tree swallows as indicators of environmental contamination in areas
across the Great Lakes and United States. The tree swallow is the organism that is being used to assess
this BUI in the Milwaukee Estuary AOC. Since 2010 researchers have sampled five sites in the
Milwaukee Estuary including Cedar Creek, Lincoln Park, Three Bridges Park, Lakeshore State Park and
Baran Park. This represents one site each on Cedar Creek, Milwaukee River, Menomonee River,
Kinnickinnic River and in the Estuary. This sampling will provide data robust enough to determine if this
beneficial use is impaired. However, as this is a Great Lakes wide project, there has not been funding to
sample the Milwaukee Estuary at each site, in each year. As such, it has taken more time to compile the
necessary data set for the AOC to assess the impairment.
Sampling continued in 2017, including at Lakeshore State Park, which had high levels of PAHs in
previous years. Also, work on several analyses and associated publications was completed. Appendix E
includes the results reported to date for the Milwaukee Estuary as well as other AOCs. Work will continue
in 2018 to analyze an adequate amount of data to use in determining the status of this impairment. A list
of publications associated with this work is as follows:
Custer C.M., Custer T.W., Dummer P.M., Goldberg D., Franson J.C. 2016. Concentrations and spatial
patterns of organic contaminants in tree swallow (Tachycineta bicolor) eggs at United States and
Binational Great Lakes Areas of concern, 2010-1015. Environmental Toxicology and Chemistry 35:3071-
3092. doi:10.1002/etc.3496 (see Appendix E)
Custer, C.M., T.W. Custer, M.A. Etterson, P.M. Dummer, D. Goldberg, and J. C. Franson. 2017c.
Reproductive success and contaminant associations in tree swallows (Tachycineta bicolor) nesting in
U.S. and Binational Great Lakes’ Areas of Concern. Submitted to Ecotoxicology.
Custer T.W., Custer C.M., Dummer P.M., Goldberg D., Franson J.C., Erickson R.A. 2017a. Organic
contamination in tree swallow (Tachycineta bicolor) nestlings at United States and binational Great Lakes
Areas of Concern. Environmental Toxicology and Chemistry 36:735-748, doi:10.1002/etc.3598 (see
Appendix E)
Custer T.W., C. M. Custer, P.M. Dummer, E. Bigorgne, E. M. Oziolor, N. Karouna-Renier, S. Schultz, R.
A. Erickson, K. Aagaard, and C. W. Matson. 2017b. EROD activity, chromosomal damage, and oxidative
stress in response to contaminants exposure in tree swallow (Tachycineta bicolor) nestlings from Great
Lakes Areas of Concern (In Press).
Management Actions
Management actions have not been defined for this impairment. Management actions will be determined
if studies indicate the BUI is impaired. If management actions are defined, they would likely be very
similar to sediment management actions defined for other BUIs.
Remedial Action Plan Update for the Milwaukee Estuary Area of Concern December 2017
15
RESTRICTIONS ON FISH AND WILDLIFE CONSUMPTION
Target (Updated 2011) Status
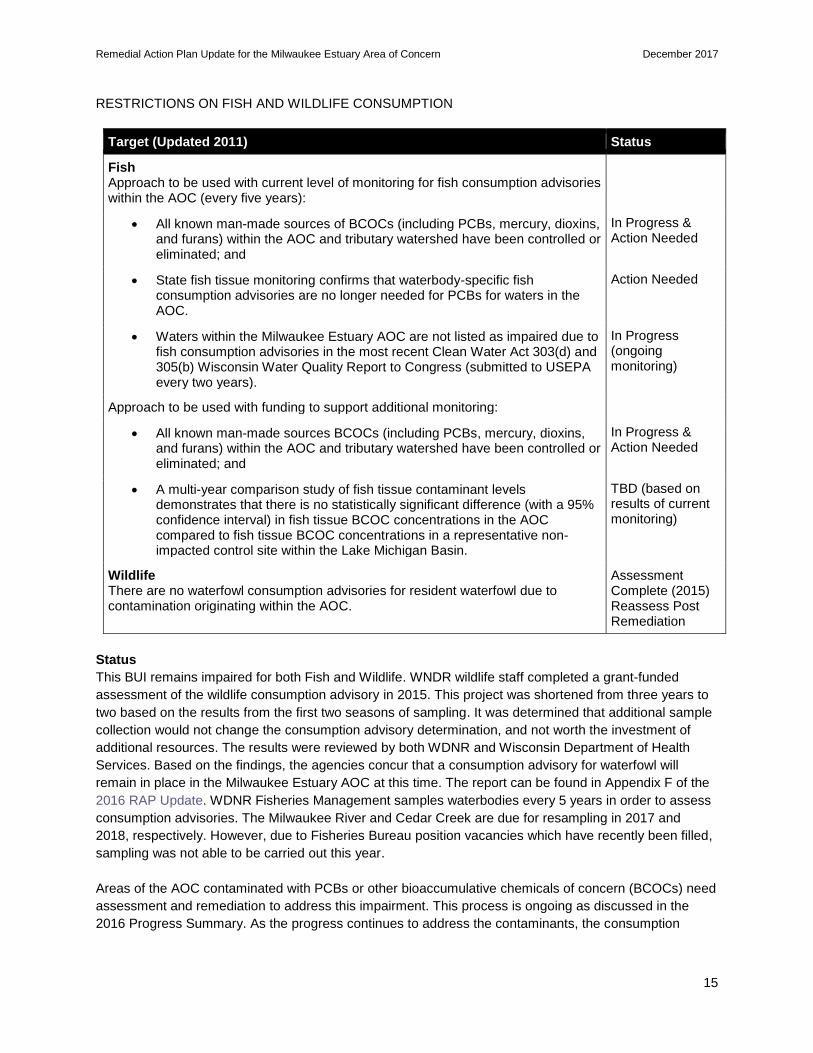
Fish Approach to be used with current level of monitoring for fish consumption advisories within the AOC (every five years):
• All known man-made sources of BCOCs (including PCBs, mercury, dioxins, and furans) within the AOC and tributary watershed have been controlled or eliminated; and
In Progress & Action Needed
• State fish tissue monitoring confirms that waterbody-specific fish consumption advisories are no longer needed for PCBs for waters in the AOC.
Action Needed
• Waters within the Milwaukee Estuary AOC are not listed as impaired due to fish consumption advisories in the most recent Clean Water Act 303(d) and 305(b) Wisconsin Water Quality Report to Congress (submitted to USEPA every two years).
In Progress (ongoing monitoring)
Approach to be used with funding to support additional monitoring:
• All known man-made sources BCOCs (including PCBs, mercury, dioxins, and furans) within the AOC and tributary watershed have been controlled or eliminated; and
In Progress & Action Needed
• A multi-year comparison study of fish tissue contaminant levels demonstrates that there is no statistically significant difference (with a 95% confidence interval) in fish tissue BCOC concentrations in the AOC compared to fish tissue BCOC concentrations in a representative non-impacted control site within the Lake Michigan Basin.
TBD (based on results of current monitoring)
Wildlife There are no waterfowl consumption advisories for resident waterfowl due to contamination originating within the AOC.
Assessment Complete (2015) Reassess Post Remediation
Status
This BUI remains impaired for both Fish and Wildlife. WNDR wildlife staff completed a grant-funded
assessment of the wildlife consumption advisory in 2015. This project was shortened from three years to
two based on the results from the first two seasons of sampling. It was determined that additional sample
collection would not change the consumption advisory determination, and not worth the investment of
additional resources. The results were reviewed by both WDNR and Wisconsin Department of Health
Services. Based on the findings, the agencies concur that a consumption advisory for waterfowl will
remain in place in the Milwaukee Estuary AOC at this time. The report can be found in Appendix F of the
2016 RAP Update. WDNR Fisheries Management samples waterbodies every 5 years in order to assess
consumption advisories. The Milwaukee River and Cedar Creek are due for resampling in 2017 and
2018, respectively. However, due to Fisheries Bureau position vacancies which have recently been filled,
sampling was not able to be carried out this year.
Areas of the AOC contaminated with PCBs or other bioaccumulative chemicals of concern (BCOCs) need
assessment and remediation to address this impairment. This process is ongoing as discussed in the
2016 Progress Summary. As the progress continues to address the contaminants, the consumption
Remedial Action Plan Update for the Milwaukee Estuary Area of Concern December 2017
16
advisories for fish and wildlife need to be reassessed until delisting targets are met. Consumption
advisories are not removed until data shows fish and wildlife are healthy to eat without restriction.
Management Actions Management actions for this impairment are those projects which control or eliminate contaminants of
concern from the AOC. These actions are usually sediment remediation. The first step in determining the
management actions is to adequately characterize the conditions within the AOC. This information can
then be used to determine management actions that need to be taken. The following actions need to be
completed in order to determine contamination related management actions:
• Assess potential impacts to sediments from the remainder of the AOC that is currently
uncharacterized. This includes the south Menomonee Canal and upper Burnham Canal, portions
of the Kinnickinnic River, inner harbor, and selected sites in the outer harbor and nearshore
waters of Lake Michigan.
• Review and act upon, if necessary, Legacy Act sediment assessment data from other areas of
the AOC. This includes, but is not limited to; Kinnickinnic River/Turning Basin, Menomonee River
from confluence with Little Menomonee to the harbor, Milwaukee River between Estabrook Dam
and confluence with Menomonee River, the Milwaukee River downstream of the confluence with
the Menomonee River.
The following management actions are necessary to move towards removing this impairment. This list is
not complete. The actions that have been implemented are italicized.
1) Sources of contamination within the AOC need to be identified and controlled.
a. Complete the assessment and cleanup of PCBs at the Cedar Creek Superfund
Alternative Site.
b. Complete the management of sediments containing PAHs and metals from the Burnham
Canal Superfund Alternative Site.
c. Complete the assessment of contaminated sediment and evaluate and implement
cleanup related to the Solvay Coke Superfund Alternatives Site.
d. Blatz Pavilion, Lincoln Park Phase 1 and Phase 2 Contaminated Sediment Remediation
(complete)
e. Kinnickinnic River Legacy Act Cleanup (complete)
Remedial Action Plan Update for the Milwaukee Estuary Area of Concern December 2017
17
RESTRICTIONS ON DREDGING ACTIVITIES
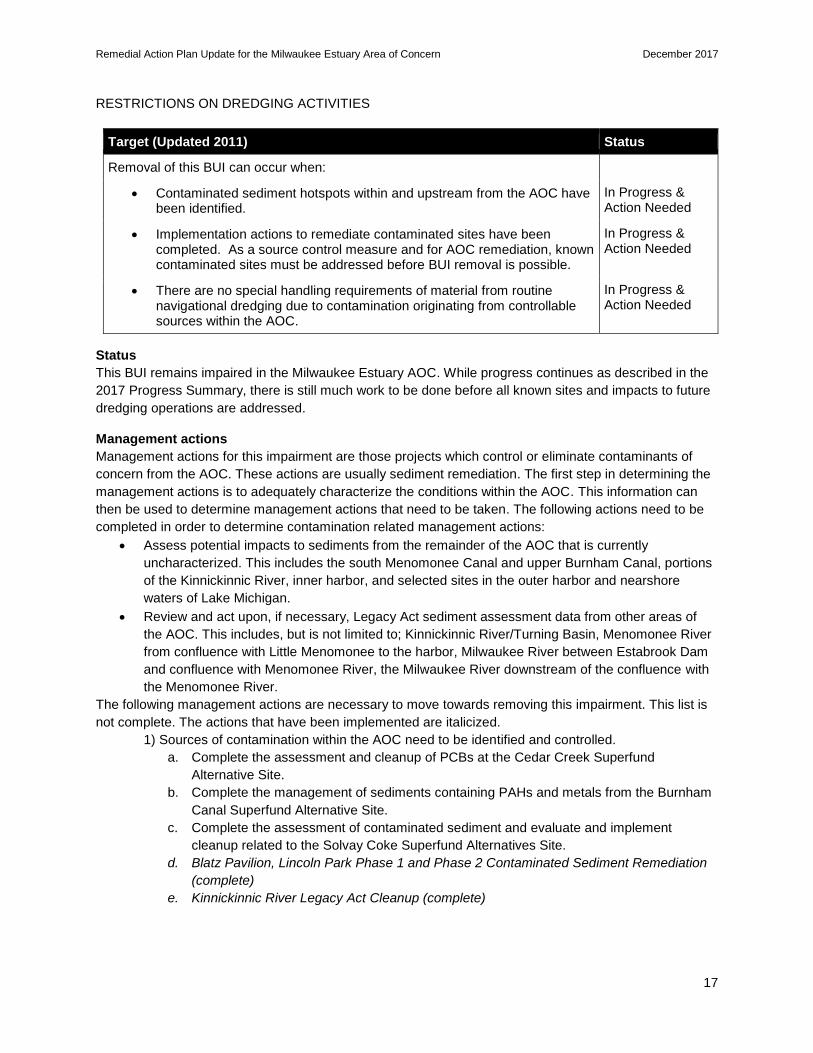
Target (Updated 2011) Status
Removal of this BUI can occur when:
• Contaminated sediment hotspots within and upstream from the AOC have been identified.
In Progress & Action Needed
• Implementation actions to remediate contaminated sites have been completed. As a source control measure and for AOC remediation, known contaminated sites must be addressed before BUI removal is possible.
In Progress & Action Needed
• There are no special handling requirements of material from routine navigational dredging due to contamination originating from controllable sources within the AOC.
In Progress & Action Needed
Status
This BUI remains impaired in the Milwaukee Estuary AOC. While progress continues as described in the
2017 Progress Summary, there is still much work to be done before all known sites and impacts to future
dredging operations are addressed.
Management actions
Management actions for this impairment are those projects which control or eliminate contaminants of
concern from the AOC. These actions are usually sediment remediation. The first step in determining the
management actions is to adequately characterize the conditions within the AOC. This information can
then be used to determine management actions that need to be taken. The following actions need to be
completed in order to determine contamination related management actions:
• Assess potential impacts to sediments from the remainder of the AOC that is currently
uncharacterized. This includes the south Menomonee Canal and upper Burnham Canal, portions
of the Kinnickinnic River, inner harbor, and selected sites in the outer harbor and nearshore
waters of Lake Michigan.
• Review and act upon, if necessary, Legacy Act sediment assessment data from other areas of
the AOC. This includes, but is not limited to; Kinnickinnic River/Turning Basin, Menomonee River
from confluence with Little Menomonee to the harbor, Milwaukee River between Estabrook Dam
and confluence with Menomonee River, the Milwaukee River downstream of the confluence with
the Menomonee River.
The following management actions are necessary to move towards removing this impairment. This list is
not complete. The actions that have been implemented are italicized.
1) Sources of contamination within the AOC need to be identified and controlled.
a. Complete the assessment and cleanup of PCBs at the Cedar Creek Superfund
Alternative Site.
b. Complete the management of sediments containing PAHs and metals from the Burnham
Canal Superfund Alternative Site.
c. Complete the assessment of contaminated sediment and evaluate and implement
cleanup related to the Solvay Coke Superfund Alternatives Site.
d. Blatz Pavilion, Lincoln Park Phase 1 and Phase 2 Contaminated Sediment Remediation
(complete)
e. Kinnickinnic River Legacy Act Cleanup (complete)
Remedial Action Plan Update for the Milwaukee Estuary Area of Concern December 2017
18
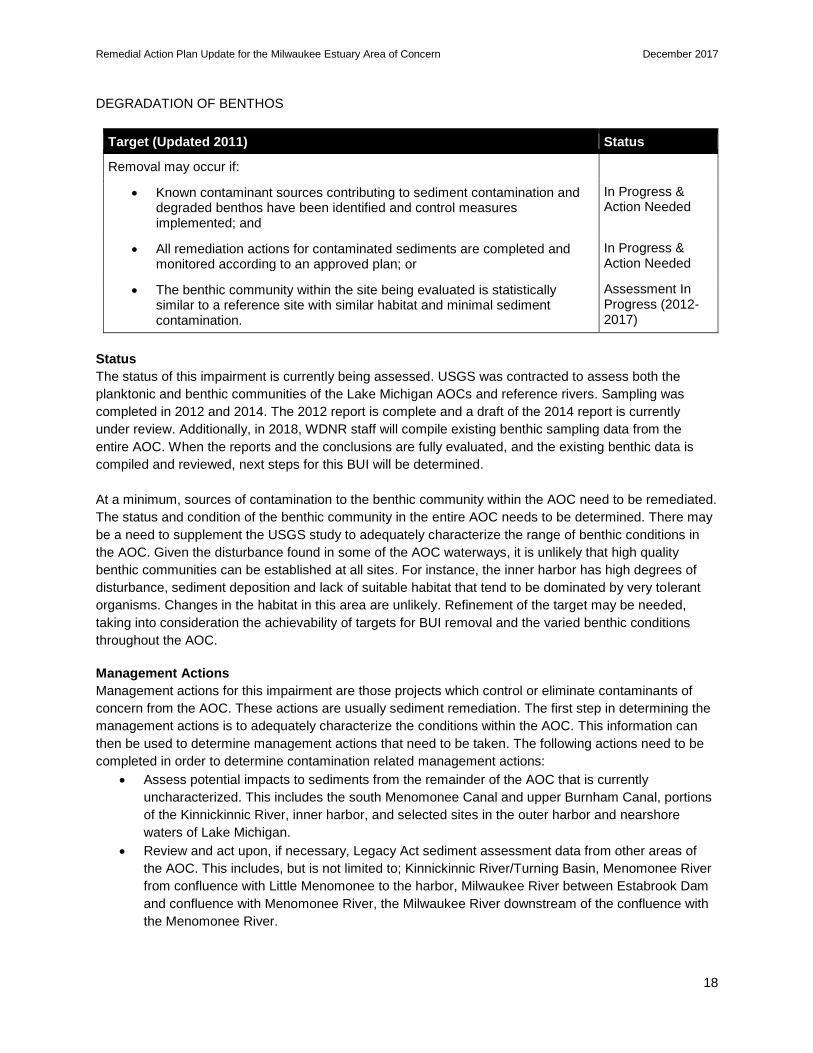
DEGRADATION OF BENTHOS
Target (Updated 2011) Status
Removal may occur if:
• Known contaminant sources contributing to sediment contamination and degraded benthos have been identified and control measures implemented; and
In Progress & Action Needed
• All remediation actions for contaminated sediments are completed and monitored according to an approved plan; or
In Progress & Action Needed
• The benthic community within the site being evaluated is statistically similar to a reference site with similar habitat and minimal sediment contamination.
Assessment In Progress (2012-2017)
Status
The status of this impairment is currently being assessed. USGS was contracted to assess both the
planktonic and benthic communities of the Lake Michigan AOCs and reference rivers. Sampling was
completed in 2012 and 2014. The 2012 report is complete and a draft of the 2014 report is currently
under review. Additionally, in 2018, WDNR staff will compile existing benthic sampling data from the
entire AOC. When the reports and the conclusions are fully evaluated, and the existing benthic data is
compiled and reviewed, next steps for this BUI will be determined.
At a minimum, sources of contamination to the benthic community within the AOC need to be remediated.
The status and condition of the benthic community in the entire AOC needs to be determined. There may
be a need to supplement the USGS study to adequately characterize the range of benthic conditions in
the AOC. Given the disturbance found in some of the AOC waterways, it is unlikely that high quality
benthic communities can be established at all sites. For instance, the inner harbor has high degrees of
disturbance, sediment deposition and lack of suitable habitat that tend to be dominated by very tolerant
organisms. Changes in the habitat in this area are unlikely. Refinement of the target may be needed,
taking into consideration the achievability of targets for BUI removal and the varied benthic conditions
throughout the AOC.
Management Actions
Management actions for this impairment are those projects which control or eliminate contaminants of
concern from the AOC. These actions are usually sediment remediation. The first step in determining the
management actions is to adequately characterize the conditions within the AOC. This information can
then be used to determine management actions that need to be taken. The following actions need to be
completed in order to determine contamination related management actions:
• Assess potential impacts to sediments from the remainder of the AOC that is currently
uncharacterized. This includes the south Menomonee Canal and upper Burnham Canal, portions
of the Kinnickinnic River, inner harbor, and selected sites in the outer harbor and nearshore
waters of Lake Michigan.
• Review and act upon, if necessary, Legacy Act sediment assessment data from other areas of
the AOC. This includes, but is not limited to; Kinnickinnic River/Turning Basin, Menomonee River
from confluence with Little Menomonee to the harbor, Milwaukee River between Estabrook Dam
and confluence with Menomonee River, the Milwaukee River downstream of the confluence with
the Menomonee River.
Remedial Action Plan Update for the Milwaukee Estuary Area of Concern December 2017
19
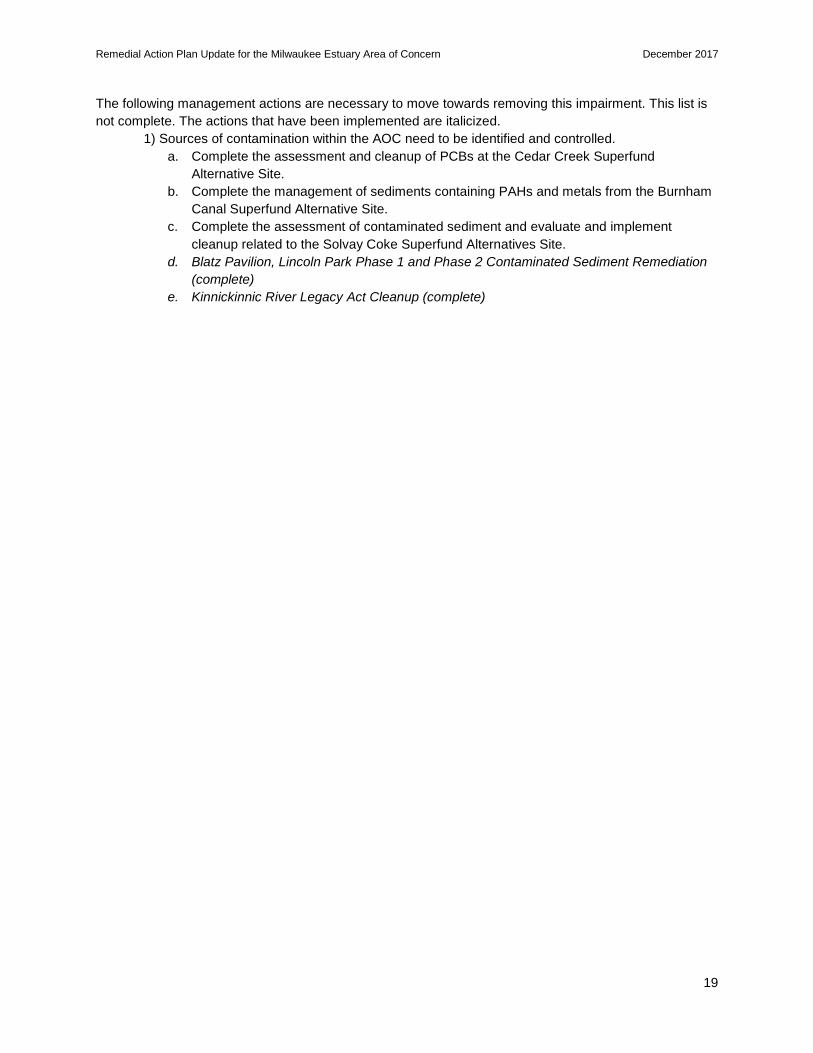
The following management actions are necessary to move towards removing this impairment. This list is
not complete. The actions that have been implemented are italicized.
1) Sources of contamination within the AOC need to be identified and controlled.
a. Complete the assessment and cleanup of PCBs at the Cedar Creek Superfund
Alternative Site.
b. Complete the management of sediments containing PAHs and metals from the Burnham
Canal Superfund Alternative Site.
c. Complete the assessment of contaminated sediment and evaluate and implement
cleanup related to the Solvay Coke Superfund Alternatives Site.
d. Blatz Pavilion, Lincoln Park Phase 1 and Phase 2 Contaminated Sediment Remediation
(complete)
e. Kinnickinnic River Legacy Act Cleanup (complete)
Remedial Action Plan Update for the Milwaukee Estuary Area of Concern December 2017
20
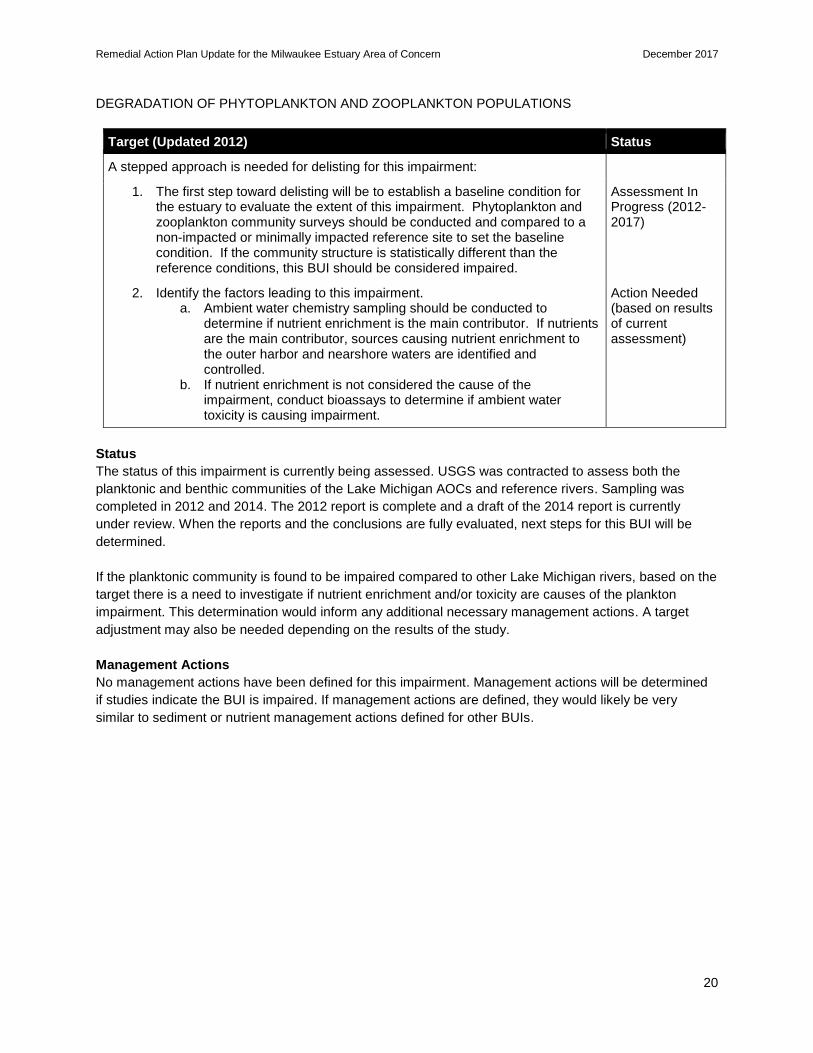
DEGRADATION OF PHYTOPLANKTON AND ZOOPLANKTON POPULATIONS
Target (Updated 2012) Status
A stepped approach is needed for delisting for this impairment:
1. The first step toward delisting will be to establish a baseline condition for the estuary to evaluate the extent of this impairment. Phytoplankton and zooplankton community surveys should be conducted and compared to a non-impacted or minimally impacted reference site to set the baseline condition. If the community structure is statistically different than the reference conditions, this BUI should be considered impaired.
Assessment In Progress (2012-2017)
2. Identify the factors leading to this impairment. a. Ambient water chemistry sampling should be conducted to
determine if nutrient enrichment is the main contributor. If nutrients are the main contributor, sources causing nutrient enrichment to the outer harbor and nearshore waters are identified and controlled.
b. If nutrient enrichment is not considered the cause of the impairment, conduct bioassays to determine if ambient water toxicity is causing impairment.
Action Needed (based on results of current assessment)
Status
The status of this impairment is currently being assessed. USGS was contracted to assess both the
planktonic and benthic communities of the Lake Michigan AOCs and reference rivers. Sampling was
completed in 2012 and 2014. The 2012 report is complete and a draft of the 2014 report is currently
under review. When the reports and the conclusions are fully evaluated, next steps for this BUI will be
determined.
If the planktonic community is found to be impaired compared to other Lake Michigan rivers, based on the
target there is a need to investigate if nutrient enrichment and/or toxicity are causes of the plankton
impairment. This determination would inform any additional necessary management actions. A target
adjustment may also be needed depending on the results of the study.
Management Actions
No management actions have been defined for this impairment. Management actions will be determined
if studies indicate the BUI is impaired. If management actions are defined, they would likely be very
similar to sediment or nutrient management actions defined for other BUIs.

Remedial Action Plan Update for the Milwaukee Estuary Area of Concern December 2017
21
LOSS OF FISH AND WILDLIFE HABITAT
Target (Updated 2011) Status
This BUI will be considered to be eligible for removal when the following have occurred:
• All contaminated sediment hotspots within the AOC have been identified, and implementation actions to remediate contaminated sites have been completed.
In Progress & Action Needed
• A local fish and wildlife management and rehabilitation plan has been compiled for the estuary that: o Defines the causes of all habitat impairments within the AOC o Establishes site-specific habitat and population targets for native
indicator fish and wildlife species within the AOC o Identifies all fish and wildlife habitat rehabilitation programs/activities
within the AOC and establishes a mechanism to assure coordination among all these programs/activities, including identification of lead agencies
o Establishes a time table, funding mechanism, and lead agency or organization responsibility for all fish and wildlife habitat rehabilitation activities needed within the AOC.
In Progress
• The programs and actions necessary to accomplish the recommendations of the fish and wildlife habitat plan are implemented, and modified as need to ensure continual improvement.
In Progress
Status
Significant progress has been made on this BUI in the past several years. A management action list of
habitat projects was finalized and all projects are in some phase of implementation (planning, design or
construction) or complete. Progress on these habitat projects as well as the sediment remediation actions
are discussed in the Progress Update section.
WDNR applied for and received grant funding to move implementation forward for several habitat
management action projects including: Kletzsch Dam Fish Passage, Bay View Wetland Restoration, Little
Menomonee Corridor Restoration, Estabrook Dam Fish Passage, Burnham Canal Wetland Restoration,
and the Kinnickinnic River Habitat Rehabilitation. In the coming year, WDNR will work with partners to
continue making progress on these and other management actions. It is expected that the fish passage
projects at Kletzsch and Estabrook Dams will be complete by the end of 2018.
Management Actions
The first set of management actions for this impairment are habitat restoration projects that address one
or more of the physical or biological habitat goals, as determined in consultation with the Fish and Wildlife
Technical Advisory Committee. Details on these management actions, and the related items listed above
in the target are in the Draft Fish and Wildlife Plan for the Milwaukee Estuary Area of Concern and the
2015 RAP Update. Another draft of the plan will be completed when the process for selecting
management actions for the “Degradation of Fish and Wildlife Populations” BUI is almost complete.
The second set of management actions for this impairment are those projects which control or eliminate
contaminants of concern from the AOC. These actions are usually sediment remediation. The first step in
determining the management actions is to adequately characterize the conditions within the AOC. This

Remedial Action Plan Update for the Milwaukee Estuary Area of Concern December 2017
22
information can then be used to determine management actions that need to be taken. The following
actions need to be completed in order to determine contamination related management actions:
• Assess potential impacts to sediments from the remainder of the AOC that is currently
uncharacterized. This includes the south Menomonee Canal and upper Burnham Canal, portions
of the Kinnickinnic River, inner harbor, and selected sites in the outer harbor and nearshore
waters of Lake Michigan.
• Review and act upon, if necessary, Legacy Act sediment assessment data from other areas of
the AOC. This includes, but is not limited to; Kinnickinnic River/Turning Basin, Menomonee River
from confluence with Little Menomonee to the harbor, Milwaukee River between Estabrook Dam
and confluence with Menomonee River, the Milwaukee River downstream of the confluence with
the Menomonee River.
The following management actions are necessary to move towards removing this impairment. This list is
not complete as all sediment projects have not been identified and defined. The actions that have been
implemented are italicized.
1) Implement habitat restoration projects defined in the fish and wildlife management and
rehabilitation plan.
a. Little Menomonee Grassland Restoration (complete)
b. Milwaukee River Fish Habitat Enhancement and Expansion (complete)
c. Wheelhouse Gateway Riparian Restoration (complete)
d. Menomonee River Concrete Removal (complete)
e. Five Low Flow Barriers Removal (complete)
f. Kinnickinnic River Habitat Rehabilitation (part of project in design & implementation
phases)
g. Burnham Canal Wetland Restoration (in design and bidding phase)
h. Little Menomonee Corridor Restoration (in planning phase)
i. Bay View Wetland Restoration (in design phase)
j. Estabrook Park Dam Fish Passage (in implementation phase)
k. Kletzsch Park Dam Fish Passage (in design & implementation phase)
2) Sources of contamination within the AOC need to be identified and controlled.
a. Complete the assessment and cleanup of PCBs at the Cedar Creek Superfund
Alternative Site.
b. Complete the management of sediments containing PAHs and metals from the Burnham
Canal Superfund Alternative Site.
c. Complete the assessment of contaminated sediment and evaluate and implement
cleanup related to the Solvay Coke Superfund Alternatives Site.
d. Blatz Pavilion, Lincoln Park Phase 1 and Phase 2 Contaminated Sediment Remediation
(complete)
e. Kinnickinnic River Legacy Act Cleanup (complete)
Remedial Action Plan Update for the Milwaukee Estuary Area of Concern December 2017
23
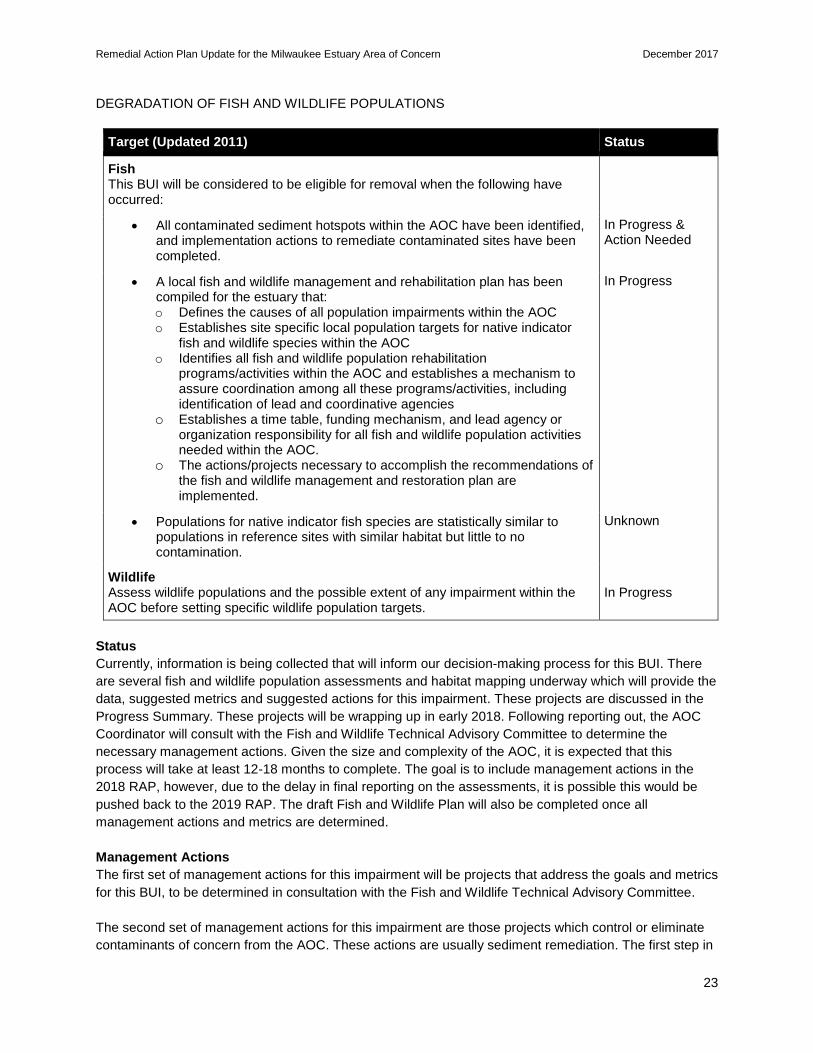
DEGRADATION OF FISH AND WILDLIFE POPULATIONS
Target (Updated 2011) Status
Fish This BUI will be considered to be eligible for removal when the following have occurred:
• All contaminated sediment hotspots within the AOC have been identified, and implementation actions to remediate contaminated sites have been completed.
In Progress & Action Needed
• A local fish and wildlife management and rehabilitation plan has been compiled for the estuary that: o Defines the causes of all population impairments within the AOC o Establishes site specific local population targets for native indicator
fish and wildlife species within the AOC o Identifies all fish and wildlife population rehabilitation
programs/activities within the AOC and establishes a mechanism to assure coordination among all these programs/activities, including identification of lead and coordinative agencies
o Establishes a time table, funding mechanism, and lead agency or organization responsibility for all fish and wildlife population activities needed within the AOC.
o The actions/projects necessary to accomplish the recommendations of the fish and wildlife management and restoration plan are implemented.
In Progress
• Populations for native indicator fish species are statistically similar to populations in reference sites with similar habitat but little to no contamination.
Unknown
Wildlife Assess wildlife populations and the possible extent of any impairment within the AOC before setting specific wildlife population targets.
In Progress
Status
Currently, information is being collected that will inform our decision-making process for this BUI. There
are several fish and wildlife population assessments and habitat mapping underway which will provide the
data, suggested metrics and suggested actions for this impairment. These projects are discussed in the
Progress Summary. These projects will be wrapping up in early 2018. Following reporting out, the AOC
Coordinator will consult with the Fish and Wildlife Technical Advisory Committee to determine the
necessary management actions. Given the size and complexity of the AOC, it is expected that this
process will take at least 12-18 months to complete. The goal is to include management actions in the
2018 RAP, however, due to the delay in final reporting on the assessments, it is possible this would be
pushed back to the 2019 RAP. The draft Fish and Wildlife Plan will also be completed once all
management actions and metrics are determined.
Management Actions
The first set of management actions for this impairment will be projects that address the goals and metrics
for this BUI, to be determined in consultation with the Fish and Wildlife Technical Advisory Committee.
The second set of management actions for this impairment are those projects which control or eliminate
contaminants of concern from the AOC. These actions are usually sediment remediation. The first step in

Remedial Action Plan Update for the Milwaukee Estuary Area of Concern December 2017
24
determining the management actions is to adequately characterize the conditions within the AOC. This
information can then be used to determine management actions that need to be taken. The following
actions need to be completed in order to determine contamination related management actions:
• Assess potential impacts to sediments from the remainder of the AOC that is currently
uncharacterized. This includes the south Menomonee Canal and upper Burnham Canal, portions
of the Kinnickinnic River, inner harbor, and selected sites in the outer harbor and nearshore
waters of Lake Michigan.
• Review and act upon, if necessary, Legacy Act sediment assessment data from other areas of
the AOC. This includes, but is not limited to; Kinnickinnic River/Turning Basin, Menomonee River
from confluence with Little Menomonee to the harbor, Milwaukee River between Estabrook Dam
and confluence with Menomonee River, the Milwaukee River downstream of the confluence with
the Menomonee River.
The following management actions are necessary to move towards removing this impairment. This list is
not complete. The actions that have been implemented are italicized.
1) Sources of contamination within the AOC need to be identified and controlled.
a. Complete the assessment and cleanup of PCBs at the Cedar Creek Superfund
Alternative Site.
b. Complete the management of sediments containing PAHs and metals from the Burnham
Canal Superfund Alternative Site.
c. Complete the assessment of contaminated sediment and evaluate and implement
cleanup related to the Solvay Coke Superfund Alternatives Site.
d. Blatz Pavilion, Lincoln Park Phase 1 and Phase 2 Contaminated Sediment Remediation
(complete)
e. Kinnickinnic River Legacy Act Cleanup (complete)
Remedial Action Plan Update for the Milwaukee Estuary Area of Concern December 2017
25
BEACH CLOSINGS
Target (Updated 2011 & 2012) Status
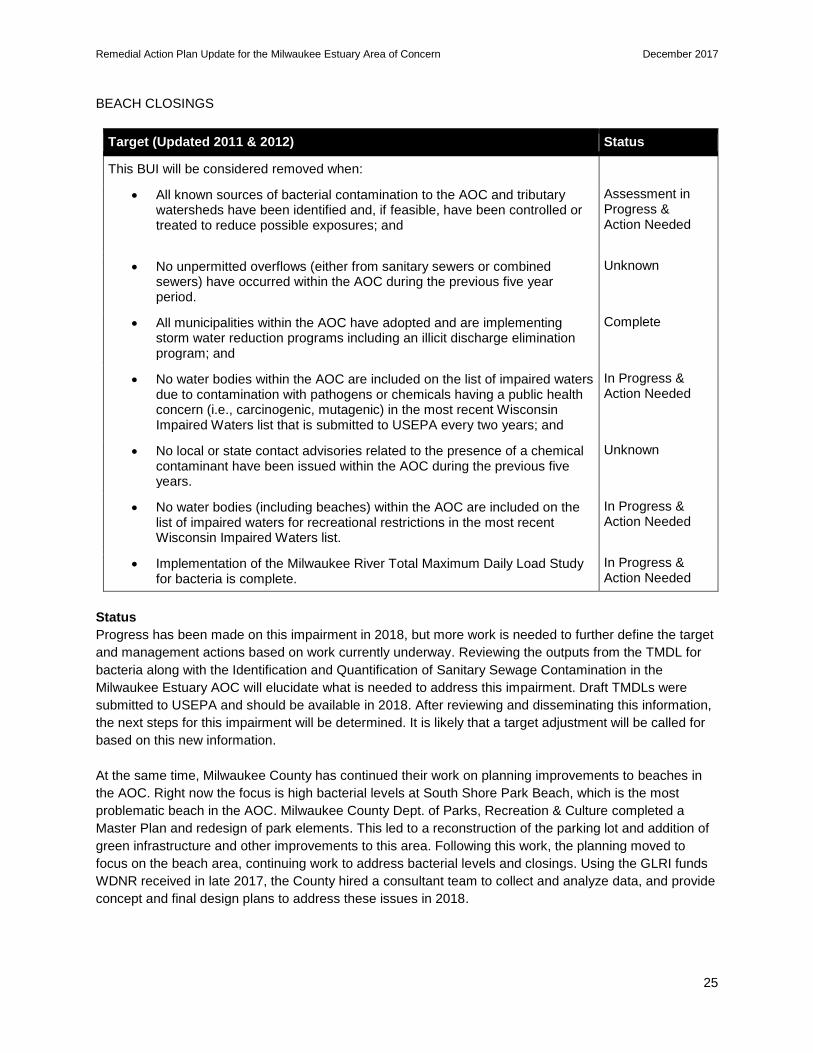
This BUI will be considered removed when:
• All known sources of bacterial contamination to the AOC and tributary watersheds have been identified and, if feasible, have been controlled or treated to reduce possible exposures; and
Assessment in Progress & Action Needed
• No unpermitted overflows (either from sanitary sewers or combined sewers) have occurred within the AOC during the previous five year period.
Unknown
• All municipalities within the AOC have adopted and are implementing storm water reduction programs including an illicit discharge elimination program; and
Complete
• No water bodies within the AOC are included on the list of impaired waters due to contamination with pathogens or chemicals having a public health concern (i.e., carcinogenic, mutagenic) in the most recent Wisconsin Impaired Waters list that is submitted to USEPA every two years; and
In Progress & Action Needed
• No local or state contact advisories related to the presence of a chemical contaminant have been issued within the AOC during the previous five years.
Unknown
• No water bodies (including beaches) within the AOC are included on the list of impaired waters for recreational restrictions in the most recent Wisconsin Impaired Waters list.
In Progress & Action Needed
• Implementation of the Milwaukee River Total Maximum Daily Load Study for bacteria is complete.
In Progress & Action Needed
Status
Progress has been made on this impairment in 2018, but more work is needed to further define the target
and management actions based on work currently underway. Reviewing the outputs from the TMDL for
bacteria along with the Identification and Quantification of Sanitary Sewage Contamination in the
Milwaukee Estuary AOC will elucidate what is needed to address this impairment. Draft TMDLs were
submitted to USEPA and should be available in 2018. After reviewing and disseminating this information,
the next steps for this impairment will be determined. It is likely that a target adjustment will be called for
based on this new information.
At the same time, Milwaukee County has continued their work on planning improvements to beaches in
the AOC. Right now the focus is high bacterial levels at South Shore Park Beach, which is the most
problematic beach in the AOC. Milwaukee County Dept. of Parks, Recreation & Culture completed a
Master Plan and redesign of park elements. This led to a reconstruction of the parking lot and addition of
green infrastructure and other improvements to this area. Following this work, the planning moved to
focus on the beach area, continuing work to address bacterial levels and closings. Using the GLRI funds
WDNR received in late 2017, the County hired a consultant team to collect and analyze data, and provide
concept and final design plans to address these issues in 2018.

Remedial Action Plan Update for the Milwaukee Estuary Area of Concern December 2017
26
Management Actions
The following management actions are necessary to move towards removing this impairment. This list is
not complete as not all of the management actions have not been defined for this impairment. Additional
management actions will be determined after review of pertinent information and in consultation with
stakeholders.
1) Implement beach rehabilitation projects that address the beach closings and recreational
restrictions.
a. South Shore Beach Rehabilitation
Remedial Action Plan Update for the Milwaukee Estuary Area of Concern December 2017
27
EUTROPHICATION OR UNDESIRABLE ALGAE
Target Status
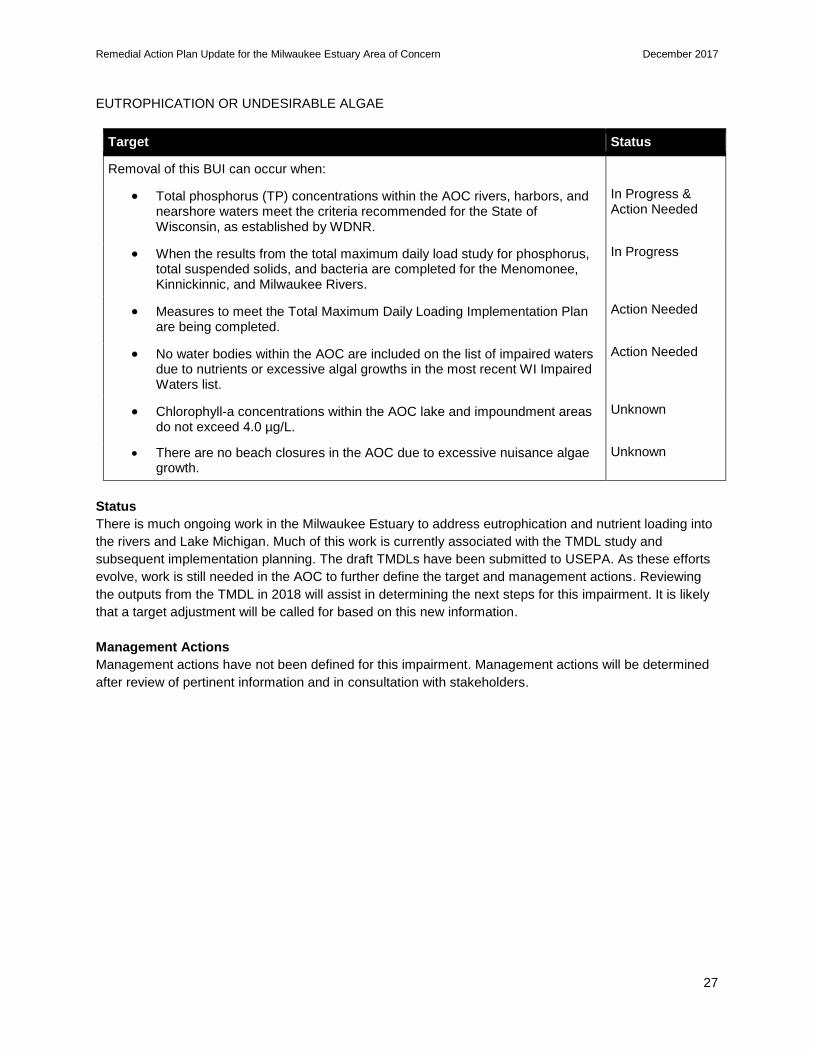
Removal of this BUI can occur when:
• Total phosphorus (TP) concentrations within the AOC rivers, harbors, and nearshore waters meet the criteria recommended for the State of Wisconsin, as established by WDNR.
In Progress & Action Needed
• When the results from the total maximum daily load study for phosphorus, total suspended solids, and bacteria are completed for the Menomonee, Kinnickinnic, and Milwaukee Rivers.
In Progress
• Measures to meet the Total Maximum Daily Loading Implementation Plan are being completed.
Action Needed
• No water bodies within the AOC are included on the list of impaired waters due to nutrients or excessive algal growths in the most recent WI Impaired Waters list.
Action Needed
• Chlorophyll-a concentrations within the AOC lake and impoundment areas do not exceed 4.0 µg/L.
Unknown
• There are no beach closures in the AOC due to excessive nuisance algae growth.
Unknown
Status
There is much ongoing work in the Milwaukee Estuary to address eutrophication and nutrient loading into
the rivers and Lake Michigan. Much of this work is currently associated with the TMDL study and
subsequent implementation planning. The draft TMDLs have been submitted to USEPA. As these efforts
evolve, work is still needed in the AOC to further define the target and management actions. Reviewing
the outputs from the TMDL in 2018 will assist in determining the next steps for this impairment. It is likely
that a target adjustment will be called for based on this new information.
Management Actions
Management actions have not been defined for this impairment. Management actions will be determined
after review of pertinent information and in consultation with stakeholders.
Remedial Action Plan Update for the Milwaukee Estuary Area of Concern December 2017
28
DEGRADATION OF AESTHETICS
Target (Updated 2016) Status
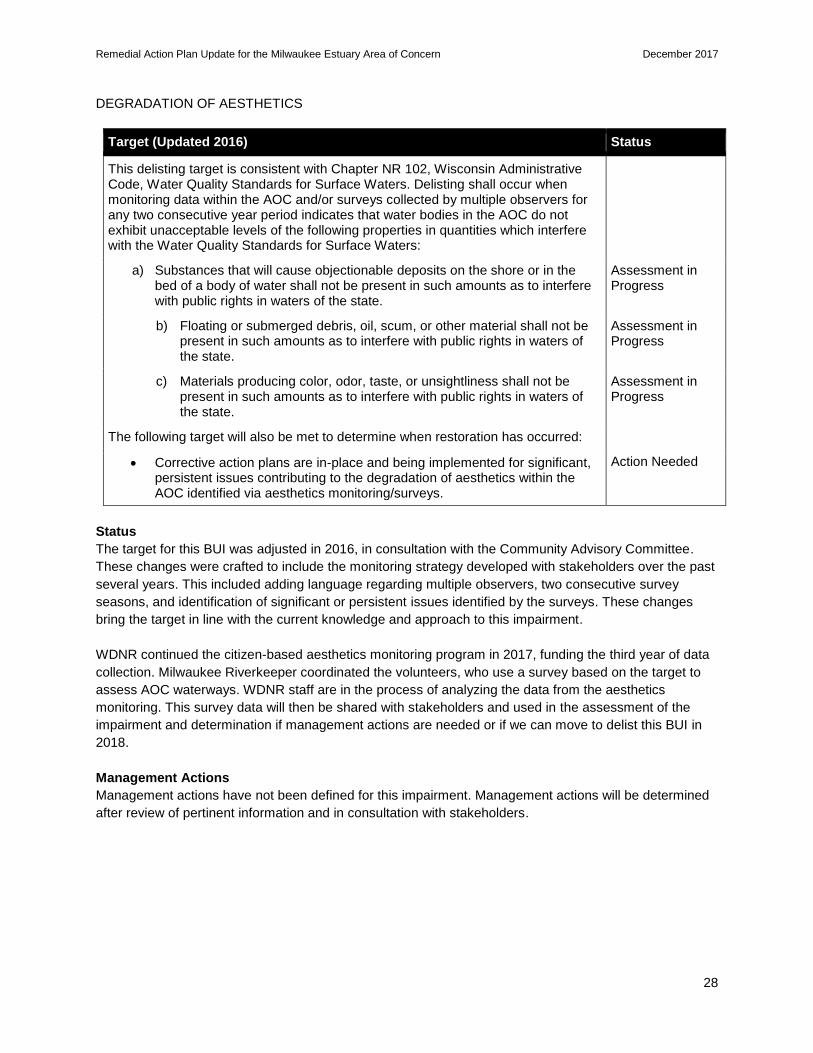
This delisting target is consistent with Chapter NR 102, Wisconsin Administrative Code, Water Quality Standards for Surface Waters. Delisting shall occur when monitoring data within the AOC and/or surveys collected by multiple observers for any two consecutive year period indicates that water bodies in the AOC do not exhibit unacceptable levels of the following properties in quantities which interfere with the Water Quality Standards for Surface Waters:
a) Substances that will cause objectionable deposits on the shore or in the bed of a body of water shall not be present in such amounts as to interfere with public rights in waters of the state.
Assessment in Progress
b) Floating or submerged debris, oil, scum, or other material shall not be present in such amounts as to interfere with public rights in waters of the state.
Assessment in Progress
c) Materials producing color, odor, taste, or unsightliness shall not be present in such amounts as to interfere with public rights in waters of the state.
Assessment in Progress
The following target will also be met to determine when restoration has occurred:
• Corrective action plans are in-place and being implemented for significant, persistent issues contributing to the degradation of aesthetics within the AOC identified via aesthetics monitoring/surveys.
Action Needed
Status
The target for this BUI was adjusted in 2016, in consultation with the Community Advisory Committee.
These changes were crafted to include the monitoring strategy developed with stakeholders over the past
several years. This included adding language regarding multiple observers, two consecutive survey
seasons, and identification of significant or persistent issues identified by the surveys. These changes
bring the target in line with the current knowledge and approach to this impairment.
WDNR continued the citizen-based aesthetics monitoring program in 2017, funding the third year of data
collection. Milwaukee Riverkeeper coordinated the volunteers, who use a survey based on the target to
assess AOC waterways. WDNR staff are in the process of analyzing the data from the aesthetics
monitoring. This survey data will then be shared with stakeholders and used in the assessment of the
impairment and determination if management actions are needed or if we can move to delist this BUI in
2018.
Management Actions
Management actions have not been defined for this impairment. Management actions will be determined
after review of pertinent information and in consultation with stakeholders.

Remedial Action Plan Update for the Milwaukee Estuary Area of Concern December 2017
29
REFERENCES
Galarneau, S., J. Harschlip, M. Jones, R. Sternkopf and R. Cors. 1994. Milwaukee Estuary Remedial Action Plan: progress through January 1994: A Plan to Clean Up Milwaukee’s Rivers and Harbors. Wisconsin Department of Natural Resources. Janish, T., D. Kaemmerer, A. O’Brien, T. Sheffy and A. Stenstrup. 1991. Milwaukee Estuary Remedial Action Plan: A Plan to Clean Up Milwaukee’s Rivers and Harbor. Wisconsin Department of Natural Resources. Publication PUBL-WR-276-91 Wisconsin Department of Natural Resources. 1999. Milwaukee Estuary Remedial Action Plan Progress Update. Wisconsin Department of Natural Resources. O’Shea, M. 2011. Stage 2 Remedial Action Plan for the Milwaukee Estuary Area of Concern. Wisconsin Department of Natural Resources. O’Shea, M. 2012. Remedial Action Plan Update for the Milwaukee Estuary Area of Concern. Wisconsin Department of Natural Resources O’Shea, M. 2013. Remedial Action Plan Update for the Milwaukee Estuary Area of Concern. Wisconsin
Department of Natural Resources
Hron, S. 2014. Remedial Action Plan Update for the Milwaukee Estuary Area of Concern. Wisconsin
Department of Natural Resources
Hron, S. 2015. Remedial Action Plan Update for the Milwaukee Estuary Area of Concern. Wisconsin
Department of Natural Resources
Hron, S. 2016. Remedial Action Plan Update for the Milwaukee Estuary Area of Concern. Wisconsin
Department of Natural Resources
Other Resources:
Cedar Creek Superfund:
https://cumulis.epa.gov/supercpad/cursites/csitinfo.cfm?id=0506429
https://cumulis.epa.gov/supercpad/SiteProfiles/index.cfm?fuseaction=second.scs&id=0506429&doc=Y&c
olid=30181&requestTimeout=480
https://cumulis.epa.gov/supercpad/SiteProfiles/index.cfm?fuseaction=second.ars&id=0506429&doc=Y&c
olid=5044&requestTimeout=480
Moss-American Superfund:
https://cumulis.epa.gov/supercpad/cursites/csitinfo.cfm?id=0505024
https://cumulis.epa.gov/supercpad/SiteProfiles/index.cfm?fuseaction=second.scs&id=0505024&doc=Y&c
olid=30328&requestTimeout=480
Burnham Canal Superfund:
https://cumulis.epa.gov/supercpad/cursites/csitinfo.cfm?id=0510222
https://cumulis.epa.gov/supercpad/SiteProfiles/index.cfm?fuseaction=second.ars&id=0510222&doc=Y&c
olid=62088&requestTimeout=480
https://cumulis.epa.gov/supercpad/SiteProfiles/index.cfm?fuseaction=second.scs&id=0510222&doc=Y&c
olid=30273&requestTimeout=480
Remedial Action Plan Update for the Milwaukee Estuary Area of Concern December 2017
30
Blatz/Lincoln Park Legacy Clean-up: http://dnr.wi.gov/topic/greatlakes/lincolnpark.html
Kinnickinnic River Legacy Clean-up: http://dnr.wi.gov/topic/greatlakes/KKRiver.html
Turning Basin Characterization Report:
http://dnr.wi.gov/topic/greatlakes/documents/TurningBasinSiteCharacterizationReport.pdf
Menomonee River Characterization Report:
http://dnr.wi.gov/topic/greatlakes/documents/MenomoneeMilwaukeeSiteCharacterizationReport.pdf
Wildlife Consumption Advisory: http://dnr.wi.gov/files/PDF/pubs/wm/WM0010.pdf
USGS Tree Swallow Study: https://www.umesc.usgs.gov/wildlife_toxicology_team.html
Benthos and Plankton Study:
https://pubs.er.usgs.gov/publication/ds824
https://pubs.er.usgs.gov/publication/sir20165090
https://pubs.er.usgs.gov/publication/ds1000
Fish Consumption:
http://dnr.wi.gov/topic/fishing/documents/consumption/MilwaukeeAreaFishConsumptionAdvisories2016.p
df
http://dnr.wi.gov/topic/fishing/consumption/
TMDL: http://dnr.wi.gov/topic/TMDLs/Milwaukee/
Built on Water Documentary:
http://www.wiseye.org/Programming/A-City-Built-On-Water
https://www.youtube.com/watch?v=VuD6IA3_X3I&feature=youtu.be
South Shore Beach Planning: http://county.milwaukee.gov/SouthShoreParkSchematicDesignProject
Bay View/Grand Trunk Wetland Restoration: www.city.milwaukee.gov/GrandTrunk
http://dnr.wi.gov/topic/fishing/documents/consumption/MilwaukeeAreaFishConsumptionAdvisories2016.pdf

Remedial Action Plan Update for the Milwaukee Estuary Area of Concern December 2017
31
APPENDICES
Appendix A Acronyms
Appendix B Definitions
Appendix C BUI Tracking Matrix
Appendix D Milwaukee River Floodplains Frequently Asked Questions
Appendix E USGS Tree Swallow Publications

Remedial Action Plan Update for the Milwaukee Estuary Area of Concern December 2017
(page left intentionally blank)

Remedial Action Plan Update for the Milwaukee Estuary Area of Concern December 2017
Appendix A
List of Acronyms
AOC Area of Concern
BUI Beneficial Use Impairment
DHS Wisconsin Department of Health Services
GLNPO Great Lakes National Program Office
GLRI Great Lakes Restoration Initiative
µg/L Micrograms per liter
mg/L Milligrams per liter
MMSD Milwaukee Metropolitan Sewerage District
PAH Polycyclic aromatic hydrocarbon
PCB Polychlorinated biphenyl
ppm Part per million
RAP Remedial Action Plan
TMDL Total Maximum Daily Load
TP Total phosphorus
USEPA U.S. Environmental Protection Agency
USGS U.S. Geological Survey
UWM University of Wisconsin – Milwaukee
WDNR Wisconsin Department of Natural Resources
Remedial Action Plan Update for the Milwaukee Estuary Area of Concern December 2017
Appendix B
Definitions
Area of Concern (AOC)
Defined by Annex 2 of the 2012 U.S.-Canada Great Lakes Water Quality Agreement (GLWQA) as a
“geographic area designated by the Parties where significant impairment of beneficial uses has occurred
as a result of human activities at the local level.” These areas are, or were, the “most contaminated” areas
of the Great Lakes, and the purpose of the AOC program is to bring these areas to a point at which they
are not environmentally degraded more than other comparable areas of the Great Lakes. When that point
has been reached, the AOC can be removed from the list of AOCs, or “delisted.” The 2012 GLWQA can
be found at https://binational.net/2012/09/05/2012-glwqa-aqegl/.
Beneficial Use Impairment (BUI)
Defined by the 2012 GLWQA as a reduction in the chemical, physical, or biological integrity of the Waters
of the Great Lakes sufficient to cause impairment to a designated use. A "beneficial use" is any way that a
water body can improve the quality of life for humans or for fish and wildlife (for example, providing fish
that are safe to eat). If the beneficial use is unavailable due to environmental problems (for example if it is
unsafe to eat the fish because of contamination) then that use is impaired. The 1987 Great Lakes Water
Quality Agreement amendment established the list of 14 possible beneficial use impairments; these 14
BUIs were reaffirmed in the 2012 GLWQA.
Delisting Target
Specific goals and objectives established for beneficial use impairments, with measurable indicators to
track progress and determine when BUI removal can occur.
Remedial Action Plan (RAP)
The 2012 Great Lakes Water Quality Agreement requires Remedial Action Plans to be “developed,
periodically updated, and implemented for each AOC.” RAPs identify the status of BUIs and their sources,
document delisting targets, and list actions needed to reach those targets.
Total Maximum Daily Load (TMDL)
A TMDL is the amount of a pollutant a waterbody can receive and still meet water quality standards. It
can be thought of as a pollution "budget" for a water body or watershed that establishes the pollutant
reduction needed from each pollutant source to meet water quality goals.

Remedial Action Plan Update for the Milwaukee Estuary Area of Concern December 2017
Appendix C
BUI Tracking Matrix
Appendix C
Note that projects listed in the table below are the next clearly delineated action steps that have been
identified by WDNR in collaboration with AOC partners and stakeholders to make progress toward
delisting the AOC. This list does not necessarily reflect all actions that will ultimately be needed to remove
impairments, and will be updated as more information is collected and as actions are completed.

Remedial Action Plan Update for the Milwaukee Estuary Area of Concern December 2017
(page left intentionally blank)
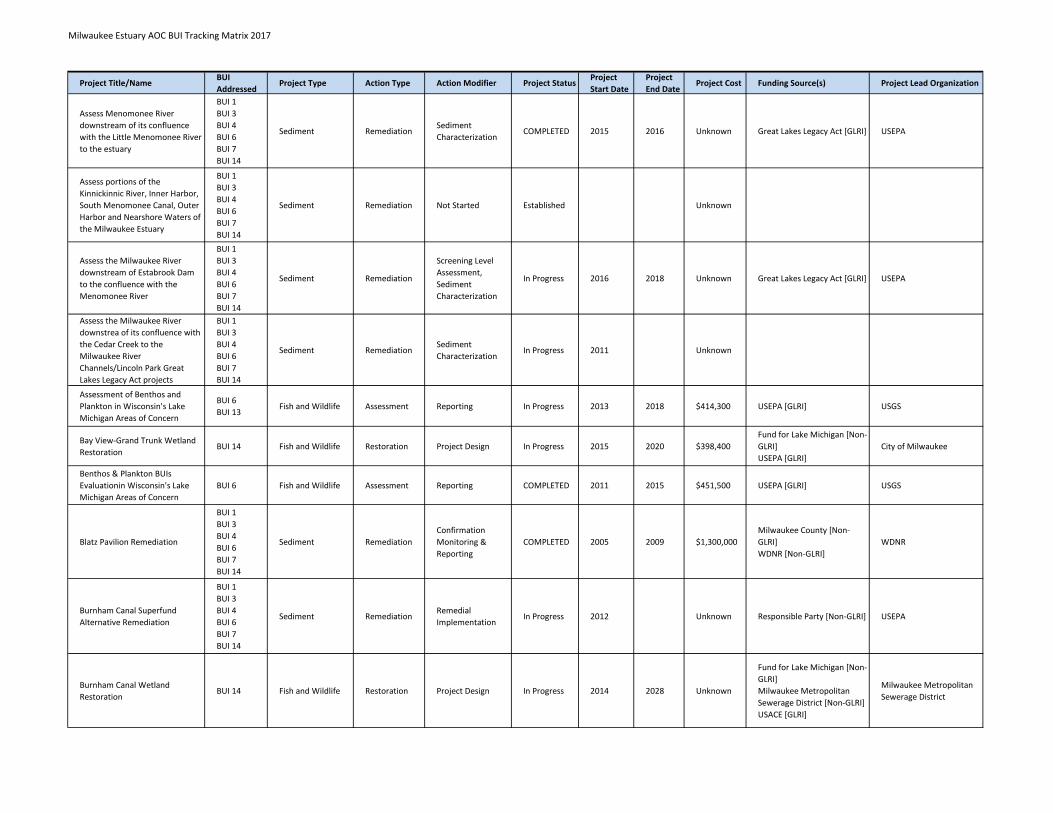
Milwaukee Estuary AOC BUI Tracking Matrix 2017
Project Title/NameBUI
AddressedProject Type Action Type Action Modifier Project Status
Project
Start Date
Project
End DateProject Cost Funding Source(s) Project Lead Organization
Assess Menomonee River
downstream of its confluence
with the Little Menomonee River
to the estuary
BUI 1
BUI 3
BUI 4
BUI 6
BUI 7
BUI 14
Sediment RemediationSediment
CharacterizationCOMPLETED 2015 2016 Unknown Great Lakes Legacy Act [GLRI] USEPA
Assess portions of the
Kinnickinnic River, Inner Harbor,
South Menomonee Canal, Outer
Harbor and Nearshore Waters of
the Milwaukee Estuary
BUI 1
BUI 3
BUI 4
BUI 6
BUI 7
BUI 14
Sediment Remediation Not Started Established Unknown
Assess the Milwaukee River
downstream of Estabrook Dam
to the confluence with the
Menomonee River
BUI 1
BUI 3
BUI 4
BUI 6
BUI 7
BUI 14
Sediment Remediation
Screening Level
Assessment,
Sediment
Characterization
In Progress 2016 2018 Unknown Great Lakes Legacy Act [GLRI] USEPA
Assess the Milwaukee River
downstrea of its confluence with
the Cedar Creek to the
Milwaukee River
Channels/Lincoln Park Great
Lakes Legacy Act projects
BUI 1
BUI 3
BUI 4
BUI 6
BUI 7
BUI 14
Sediment RemediationSediment
CharacterizationIn Progress 2011 Unknown
Assessment of Benthos and
Plankton in Wisconsin's Lake
Michigan Areas of Concern
BUI 6
BUI 13Fish and Wildlife Assessment Reporting In Progress 2013 2018 $414,300 USEPA [GLRI] USGS
Bay View-Grand Trunk Wetland
RestorationBUI 14 Fish and Wildlife Restoration Project Design In Progress 2015 2020 $398,400
Fund for Lake Michigan [Non-
GLRI]
USEPA [GLRI]
City of Milwaukee
Benthos & Plankton BUIs
Evaluationin Wisconsin's Lake
Michigan Areas of Concern
BUI 6 Fish and Wildlife Assessment Reporting COMPLETED 2011 2015 $451,500 USEPA [GLRI] USGS
Blatz Pavilion Remediation
BUI 1
BUI 3
BUI 4
BUI 6
BUI 7
BUI 14
Sediment Remediation
Confirmation
Monitoring &
Reporting
COMPLETED 2005 2009 $1,300,000
Milwaukee County [Non-
GLRI]
WDNR [Non-GLRI]
WDNR
Burnham Canal Superfund
Alternative Remediation
BUI 1
BUI 3
BUI 4
BUI 6
BUI 7
BUI 14
Sediment RemediationRemedial
ImplementationIn Progress 2012 Unknown Responsible Party [Non-GLRI] USEPA
Burnham Canal Wetland
RestorationBUI 14 Fish and Wildlife Restoration Project Design In Progress 2014 2028 Unknown
Fund for Lake Michigan [Non-
GLRI]
Milwaukee Metropolitan
Sewerage District [Non-GLRI]
USACE [GLRI]
Milwaukee Metropolitan
Sewerage District
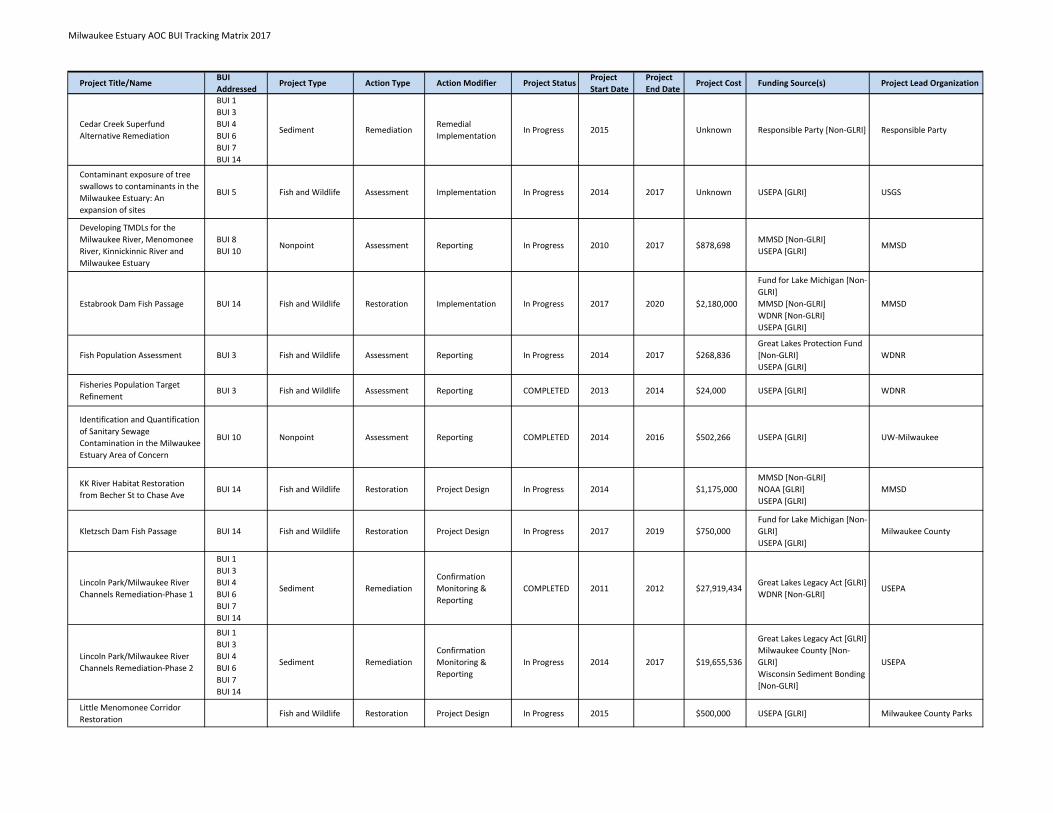
Milwaukee Estuary AOC BUI Tracking Matrix 2017
Project Title/NameBUI
AddressedProject Type Action Type Action Modifier Project Status
Project
Start Date
Project
End DateProject Cost Funding Source(s) Project Lead Organization
Cedar Creek Superfund
Alternative Remediation
BUI 1
BUI 3
BUI 4
BUI 6
BUI 7
BUI 14
Sediment RemediationRemedial
ImplementationIn Progress 2015 Unknown Responsible Party [Non-GLRI] Responsible Party
Contaminant exposure of tree
swallows to contaminants in the
Milwaukee Estuary: An
expansion of sites
BUI 5 Fish and Wildlife Assessment Implementation In Progress 2014 2017 Unknown USEPA [GLRI] USGS
Developing TMDLs for the
Milwaukee River, Menomonee
River, Kinnickinnic River and
Milwaukee Estuary
BUI 8
BUI 10Nonpoint Assessment Reporting In Progress 2010 2017 $878,698
MMSD [Non-GLRI]
USEPA [GLRI]MMSD
Estabrook Dam Fish Passage BUI 14 Fish and Wildlife Restoration Implementation In Progress 2017 2020 $2,180,000
Fund for Lake Michigan [Non-
GLRI]
MMSD [Non-GLRI]
WDNR [Non-GLRI]
USEPA [GLRI]
MMSD
Fish Population Assessment BUI 3 Fish and Wildlife Assessment Reporting In Progress 2014 2017 $268,836
Great Lakes Protection Fund
[Non-GLRI]
USEPA [GLRI]
WDNR
Fisheries Population Target
RefinementBUI 3 Fish and Wildlife Assessment Reporting COMPLETED 2013 2014 $24,000 USEPA [GLRI] WDNR
Identification and Quantification
of Sanitary Sewage
Contamination in the Milwaukee
Estuary Area of Concern
BUI 10 Nonpoint Assessment Reporting COMPLETED 2014 2016 $502,266 USEPA [GLRI] UW-Milwaukee
KK River Habitat Restoration
from Becher St to Chase AveBUI 14 Fish and Wildlife Restoration Project Design In Progress 2014 $1,175,000
MMSD [Non-GLRI]
NOAA [GLRI]
USEPA [GLRI]
MMSD
Kletzsch Dam Fish Passage BUI 14 Fish and Wildlife Restoration Project Design In Progress 2017 2019 $750,000
Fund for Lake Michigan [Non-
GLRI]
USEPA [GLRI]
Milwaukee County
Lincoln Park/Milwaukee River
Channels Remediation-Phase 1
BUI 1
BUI 3
BUI 4
BUI 6
BUI 7
BUI 14
Sediment Remediation
Confirmation
Monitoring &
Reporting
COMPLETED 2011 2012 $27,919,434Great Lakes Legacy Act [GLRI]
WDNR [Non-GLRI]USEPA
Lincoln Park/Milwaukee River
Channels Remediation-Phase 2
BUI 1
BUI 3
BUI 4
BUI 6
BUI 7
BUI 14
Sediment Remediation
Confirmation
Monitoring &
Reporting
In Progress 2014 2017 $19,655,536
Great Lakes Legacy Act [GLRI]
Milwaukee County [Non-
GLRI]
Wisconsin Sediment Bonding
[Non-GLRI]
USEPA
Little Menomonee Corridor
RestorationFish and Wildlife Restoration Project Design In Progress 2015 $500,000 USEPA [GLRI] Milwaukee County Parks
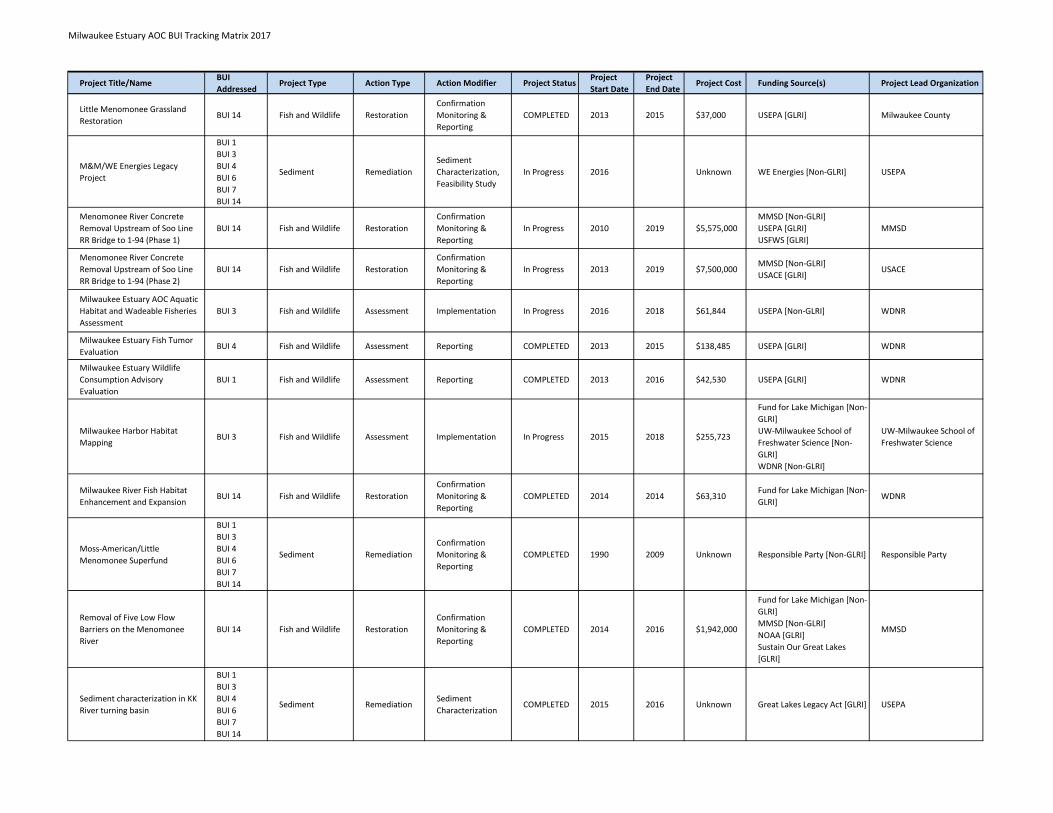
Milwaukee Estuary AOC BUI Tracking Matrix 2017
Project Title/NameBUI
AddressedProject Type Action Type Action Modifier Project Status
Project
Start Date
Project
End DateProject Cost Funding Source(s) Project Lead Organization
Little Menomonee Grassland
RestorationBUI 14 Fish and Wildlife Restoration
Confirmation
Monitoring &
Reporting
COMPLETED 2013 2015 $37,000 USEPA [GLRI] Milwaukee County
M&M/WE Energies Legacy
Project
BUI 1
BUI 3
BUI 4
BUI 6
BUI 7
BUI 14
Sediment Remediation
Sediment
Characterization,
Feasibility Study
In Progress 2016 Unknown WE Energies [Non-GLRI] USEPA
Menomonee River Concrete
Removal Upstream of Soo Line
RR Bridge to 1-94 (Phase 1)
BUI 14 Fish and Wildlife Restoration
Confirmation
Monitoring &
Reporting
In Progress 2010 2019 $5,575,000
MMSD [Non-GLRI]
USEPA [GLRI]
USFWS [GLRI]
MMSD
Menomonee River Concrete
Removal Upstream of Soo Line
RR Bridge to 1-94 (Phase 2)
BUI 14 Fish and Wildlife Restoration
Confirmation
Monitoring &
Reporting
In Progress 2013 2019 $7,500,000MMSD [Non-GLRI]
USACE [GLRI]USACE
Milwaukee Estuary AOC Aquatic
Habitat and Wadeable Fisheries
Assessment
BUI 3 Fish and Wildlife Assessment Implementation In Progress 2016 2018 $61,844 USEPA [Non-GLRI] WDNR
Milwaukee Estuary Fish Tumor
EvaluationBUI 4 Fish and Wildlife Assessment Reporting COMPLETED 2013 2015 $138,485 USEPA [GLRI] WDNR
Milwaukee Estuary Wildlife
Consumption Advisory
Evaluation
BUI 1 Fish and Wildlife Assessment Reporting COMPLETED 2013 2016 $42,530 USEPA [GLRI] WDNR
Milwaukee Harbor Habitat
MappingBUI 3 Fish and Wildlife Assessment Implementation In Progress 2015 2018 $255,723
Fund for Lake Michigan [Non-
GLRI]
UW-Milwaukee School of
Freshwater Science [Non-
GLRI]
WDNR [Non-GLRI]
UW-Milwaukee School of
Freshwater Science
Milwaukee River Fish Habitat
Enhancement and ExpansionBUI 14 Fish and Wildlife Restoration
Confirmation
Monitoring &
Reporting
COMPLETED 2014 2014 $63,310Fund for Lake Michigan [Non-
GLRI]WDNR
Moss-American/Little
Menomonee Superfund
BUI 1
BUI 3
BUI 4
BUI 6
BUI 7
BUI 14
Sediment Remediation
Confirmation
Monitoring &
Reporting
COMPLETED 1990 2009 Unknown Responsible Party [Non-GLRI] Responsible Party
Removal of Five Low Flow
Barriers on the Menomonee
River
BUI 14 Fish and Wildlife Restoration
Confirmation
Monitoring &
Reporting
COMPLETED 2014 2016 $1,942,000
Fund for Lake Michigan [Non-
GLRI]
MMSD [Non-GLRI]
NOAA [GLRI]
Sustain Our Great Lakes
[GLRI]
MMSD
Sediment characterization in KK
River turning basin
BUI 1
BUI 3
BUI 4
BUI 6
BUI 7
BUI 14
Sediment RemediationSediment
CharacterizationCOMPLETED 2015 2016 Unknown Great Lakes Legacy Act [GLRI] USEPA
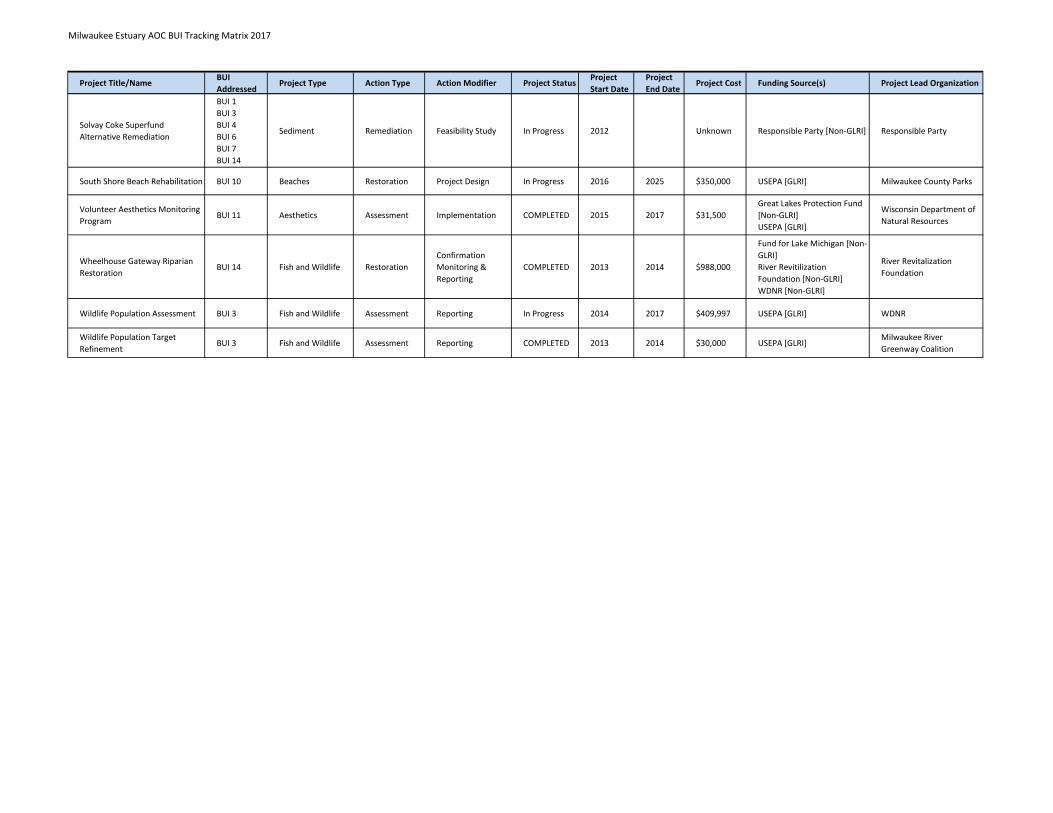
Milwaukee Estuary AOC BUI Tracking Matrix 2017
Project Title/NameBUI
AddressedProject Type Action Type Action Modifier Project Status
Project
Start Date
Project
End DateProject Cost Funding Source(s) Project Lead Organization
Solvay Coke Superfund
Alternative Remediation
BUI 1
BUI 3
BUI 4
BUI 6
BUI 7
BUI 14
Sediment Remediation Feasibility Study In Progress 2012 Unknown Responsible Party [Non-GLRI] Responsible Party
South Shore Beach Rehabilitation BUI 10 Beaches Restoration Project Design In Progress 2016 2025 $350,000 USEPA [GLRI] Milwaukee County Parks
Volunteer Aesthetics Monitoring
ProgramBUI 11 Aesthetics Assessment Implementation COMPLETED 2015 2017 $31,500
Great Lakes Protection Fund
[Non-GLRI]
USEPA [GLRI]
Wisconsin Department of
Natural Resources
Wheelhouse Gateway Riparian
RestorationBUI 14 Fish and Wildlife Restoration
Confirmation
Monitoring &
Reporting
COMPLETED 2013 2014 $988,000
Fund for Lake Michigan [Non-
GLRI]
River Revitilization
Foundation [Non-GLRI]
WDNR [Non-GLRI]
River Revitalization
Foundation
Wildlife Population Assessment BUI 3 Fish and Wildlife Assessment Reporting In Progress 2014 2017 $409,997 USEPA [GLRI] WDNR
Wildlife Population Target
RefinementBUI 3 Fish and Wildlife Assessment Reporting COMPLETED 2013 2014 $30,000 USEPA [GLRI]
Milwaukee River
Greenway Coalition
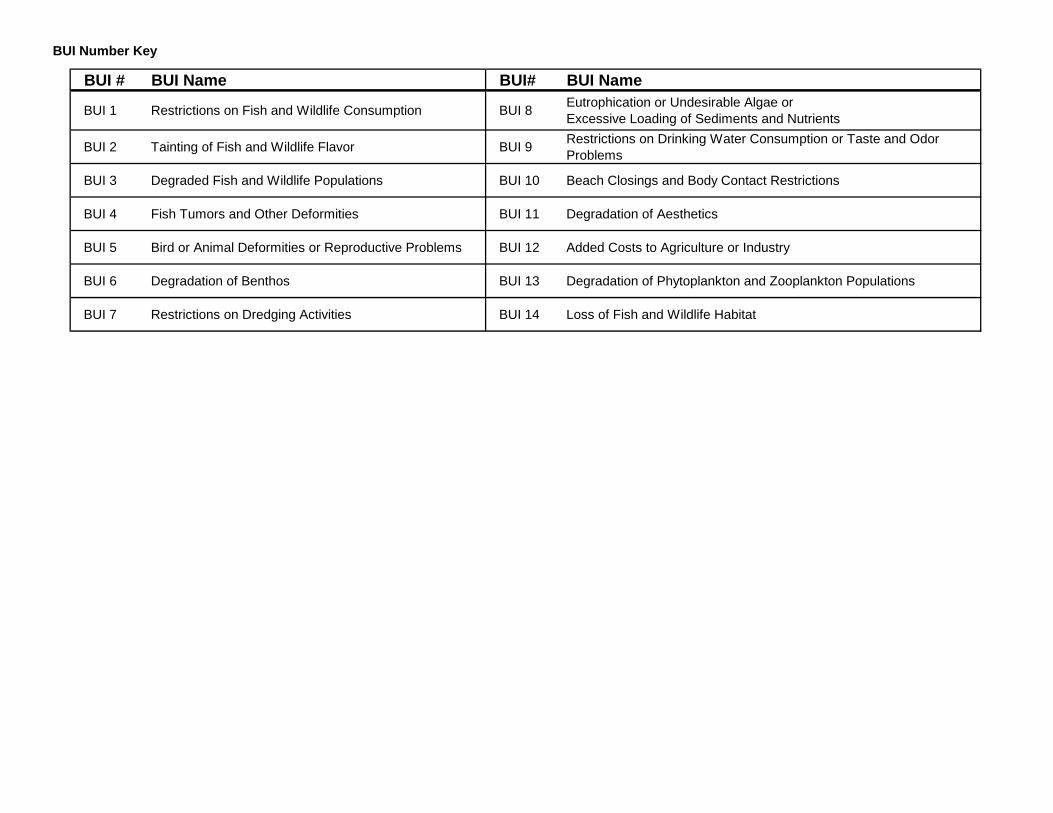
BUI Number Key
BUI # BUI Name BUI# BUI Name
BUI 1 Restrictions on Fish and Wildlife Consumption BUI 8Eutrophication or Undesirable Algae or
Excessive Loading of Sediments and Nutrients
BUI 2 Tainting of Fish and Wildlife Flavor BUI 9Restrictions on Drinking Water Consumption or Taste and Odor
Problems
BUI 3 Degraded Fish and Wildlife Populations BUI 10 Beach Closings and Body Contact Restrictions
BUI 4 Fish Tumors and Other Deformities BUI 11 Degradation of Aesthetics
BUI 5 Bird or Animal Deformities or Reproductive Problems BUI 12 Added Costs to Agriculture or Industry
BUI 6 Degradation of Benthos BUI 13 Degradation of Phytoplankton and Zooplankton Populations
BUI 7 Restrictions on Dredging Activities BUI 14 Loss of Fish and Wildlife Habitat

Remedial Action Plan Update for the Milwaukee Estuary Area of Concern December 2017
Appendix D
Milwaukee River Floodplains Frequently Asked Questions
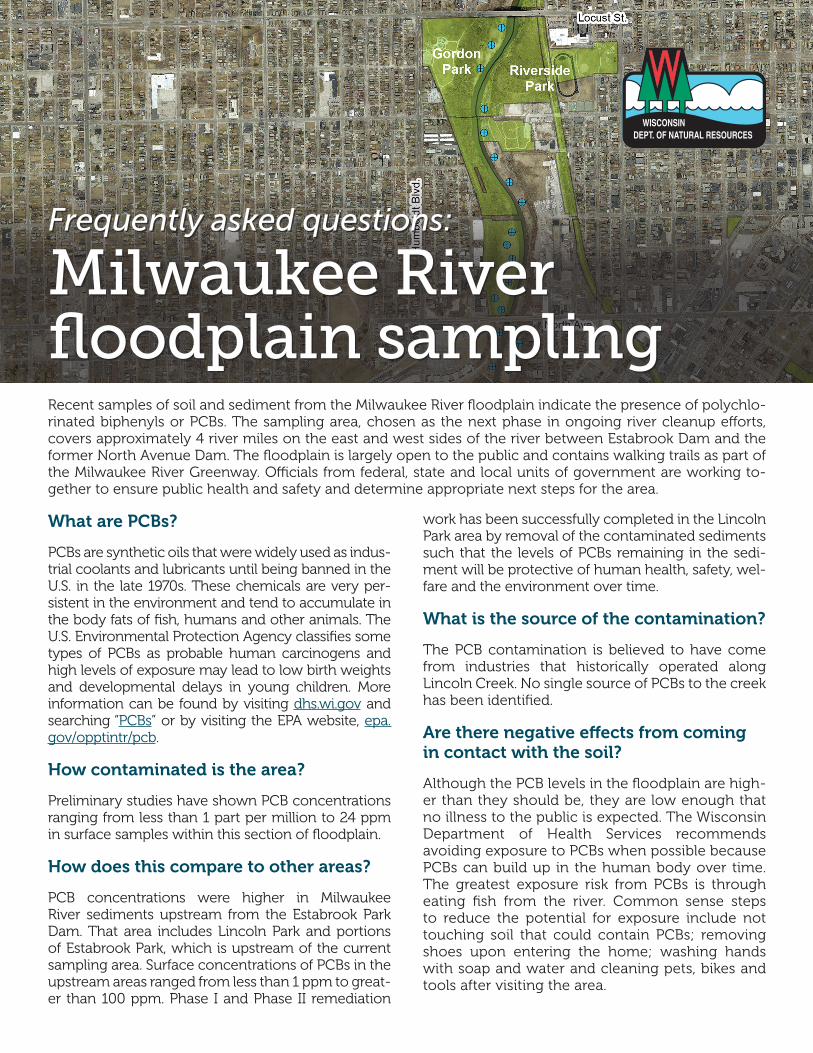
Recent samples of soil and sediment from the Milwaukee River floodplain indicate the presence of polychlo-rinated biphenyls or PCBs. The sampling area, chosen as the next phase in ongoing river cleanup efforts, covers approximately 4 river miles on the east and west sides of the river between Estabrook Dam and the former North Avenue Dam. The floodplain is largely open to the public and contains walking trails as part of the Milwaukee River Greenway. Officials from federal, state and local units of government are working to-gether to ensure public health and safety and determine appropriate next steps for the area.
What are PCBs?
PCBs are synthetic oils that were widely used as indus-trial coolants and lubricants until being banned in the U.S. in the late 1970s. These chemicals are very per-sistent in the environment and tend to accumulate in the body fats of fish, humans and other animals. The U.S. Environmental Protection Agency classifies some types of PCBs as probable human carcinogens and high levels of exposure may lead to low birth weights and developmental delays in young children. More information can be found by visiting dhs.wi.gov and searching “PCBs” or by visiting the EPA website, epa.gov/opptintr/pcb.
How contaminated is the area?
Preliminary studies have shown PCB concentrations ranging from less than 1 part per million to 24 ppm in surface samples within this section of floodplain.
How does this compare to other areas?
PCB concentrations were higher in Milwaukee River sediments upstream from the Estabrook Park Dam. That area includes Lincoln Park and portions of Estabrook Park, which is upstream of the current sampling area. Surface concentrations of PCBs in the upstream areas ranged from less than 1 ppm to great-er than 100 ppm. Phase I and Phase II remediation
work has been successfully completed in the Lincoln Park area by removal of the contaminated sediments such that the levels of PCBs remaining in the sedi-ment will be protective of human health, safety, wel-fare and the environment over time.
What is the source of the contamination?
The PCB contamination is believed to have come from industries that historically operated along Lincoln Creek. No single source of PCBs to the creek has been identified.
Are there negative effects from coming in contact with the soil?
Although the PCB levels in the floodplain are high-er than they should be, they are low enough that no illness to the public is expected. The Wisconsin Department of Health Services recommends avoiding exposure to PCBs when possible because PCBs can build up in the human body over time. The greatest exposure risk from PCBs is through eating fish from the river. Common sense steps to reduce the potential for exposure include not touching soil that could contain PCBs; removing shoes upon entering the home; washing hands with soap and water and cleaning pets, bikes and tools after visiting the area.
Frequently asked questions:
Milwaukee River floodplain sampling
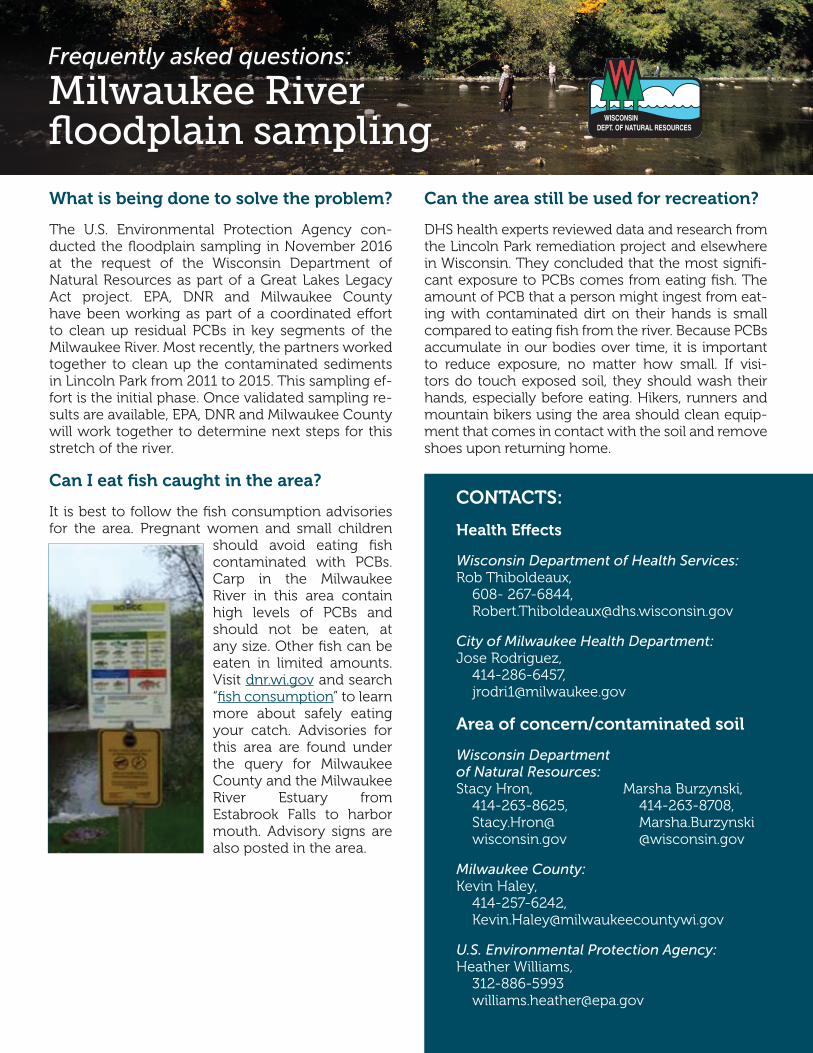
Frequently asked questions:
Milwaukee River floodplain sampling
CONTACTS:
Health Effects
Wisconsin Department of Health Services:Rob Thiboldeaux,
608- 267-6844, [email protected]
City of Milwaukee Health Department:Jose Rodriguez,
414-286-6457, [email protected]
Area of concern/contaminated soil
Wisconsin Department of Natural Resources:Stacy Hron,
414-263-8625, Stacy.Hron@ wisconsin.gov
Marsha Burzynski, 414-263-8708, Marsha.Burzynski @wisconsin.gov
Milwaukee County:Kevin Haley,
414-257-6242, [email protected]
U.S. Environmental Protection Agency:Heather Williams,
312-886-5993 [email protected]
What is being done to solve the problem?
The U.S. Environmental Protection Agency con-ducted the floodplain sampling in November 2016 at the request of the Wisconsin Department of Natural Resources as part of a Great Lakes Legacy Act project. EPA, DNR and Milwaukee County have been working as part of a coordinated effort to clean up residual PCBs in key segments of the Milwaukee River. Most recently, the partners worked together to clean up the contaminated sediments in Lincoln Park from 2011 to 2015. This sampling ef-fort is the initial phase. Once validated sampling re-sults are available, EPA, DNR and Milwaukee County will work together to determine next steps for this stretch of the river.
Can I eat fish caught in the area?
It is best to follow the fish consumption advisories for the area. Pregnant women and small children
should avoid eating fish contaminated with PCBs. Carp in the Milwaukee River in this area contain high levels of PCBs and should not be eaten, at any size. Other fish can be eaten in limited amounts. Visit dnr.wi.gov and search “fish consumption” to learn more about safely eating your catch. Advisories for this area are found under the query for Milwaukee County and the Milwaukee River Estuary from Estabrook Falls to harbor mouth. Advisory signs are also posted in the area.
Can the area still be used for recreation?
DHS health experts reviewed data and research from the Lincoln Park remediation project and elsewhere in Wisconsin. They concluded that the most signifi-cant exposure to PCBs comes from eating fish. The amount of PCB that a person might ingest from eat-ing with contaminated dirt on their hands is small compared to eating fish from the river. Because PCBs accumulate in our bodies over time, it is important to reduce exposure, no matter how small. If visi-tors do touch exposed soil, they should wash their hands, especially before eating. Hikers, runners and mountain bikers using the area should clean equip-ment that comes in contact with the soil and remove shoes upon returning home.

Remedial Action Plan Update for the Milwaukee Estuary Area of Concern December 2017
Appendix E
USGS Tree Swallow Publications
CONCENTRATIONS AND SPATIAL PATTERNS OF ORGANIC CONTAMINANTS INTREE SWALLOW (TACHYCINETA BICOLOR) EGGS AT UNITED STATES AND
BINATIONAL GREAT LAKES AREAS OF CONCERN, 2010–2015
CHRISTINE M. CUSTER,*y THOMAS W. CUSTER,y PAUL M. DUMMER,y DIANA GOLDBERG,z and J. CHRISTIAN FRANSONzyUpper Midwest Environmental Sciences Center, US Geological Survey, La Crosse, Wisconsin
zNational Wildlife Health Center, US Geological Survey, Madison, Wisconsin
(Submitted 2 February 2016; Returned for Revision 4 March 2016; Accepted 13 May 2016)
Abstract: Tree swallows, Tachycineta bicolor, were sampled across the Great Lakes basin in 2010 through 2015 to provide a system-wide assessment of current exposure to organic contaminants. The results provide information identified as critical by regulators to assessthe “bird or animal deformity or reproductive problems” beneficial use impairment. Eggs were collected from 69 sites across all 5 GreatLakes, including 27 Areas of Concern (AOCs), some with multiple sites, and 10 sites not listed as an AOC. Concentrations of organiccontaminants in eggs were quantified and compared with background and reproductive effect thresholds. Approximately 30% of AOCshad geometric mean concentrations of total polychlorinated biphenyls (PCBs) at or below average background exposure (0.34mg/g wetwt). Exposure to polybrominated diphenyl ethers (PBDEs) was minimal, and only 3 of 27 AOCs and 1 non-AOC had geometric meanconcentrations that exceeded background for tree swallows (96 ng/g wet wt). Concentrations of both PCBs and PBDEs were 10 to20 times below the lower limit associated with impaired hatching success. In contrast, geometric mean concentrations of polychlorinateddibenzo-p-dioxin and furan (PCDD-F) toxic equivalents (TEQs) at the Saginaw River and Bay AOC and Midland, Michigan, USA(a non-AOC site), exceeded the lower limit for hatching effects (181 pg/g PCDD-F TEQs). The rest of the sites had geometricmean concentrations of PCDD-F TEQs below background levels (87 pg/g PCDD-F TEQs). Other organic contaminants, includingp,p0-dichlorodiphenyldichloroethylene, mirex, heptachlor, and chlordane, were at or below background or adverse effect concentrations.Environ Toxicol Chem 2016;35:3071–3092. Published 2016Wiley Periodicals Inc on behalf of SETAC. This article is a US governmentwork and, as such, is in the public domain in the United States of America.
Keywords: Tree swallows Tachycineta bicolor Polychlorinated biphenyls (PCBs) Dioxins and furans
INTRODUCTION
The Great Lakes Water Quality Agreement [1] designatedAreas of Concern (AOCs), which are geographical areas wheresignificant beneficial use impairment has occurred as a result ofhuman activities. Thirty-oneAOCswere identified in the UnitedStates, 5 of which are shared (binational) with Canada. Fourteenbeneficial use impairments were identified in the Great LakesWater Quality Agreement. A beneficial use impairment relatesto a change in the chemical, physical, or biological integrity ofthe Great Lakes system sufficient to cause any of the 14conditions outlined in Annex 1.a of the Great Lakes WaterQuality Agreement [1]. Each AOC was assigned a variablenumber of beneficial use impairments [2]. Although eachstate has unique criteria, the “bird or animal deformities orreproductive problems” beneficial use impairment uses 2 basicapproaches to assess possible impairment: 1) reproductive datacollected in the field and compared with normal reproductiverates in similar, but non-AOC, areas; and 2) a comparison oftissue concentrations to background and known reproductiveeffect levels from both field and laboratory studies. For birds,egg concentrations are often used for these assessments and arethe subject of the present study.
The tree swallow (Tachycineta bicolor) is a useful speciesfor assessing the “bird or animal deformity or reproductiveproblems” beneficial use impairment because of the plethora of
published information on both reproduction and contaminantexposure in this species. For some classes of chemicals, such aspolychlorinated biphenyls (PCBs), dioxins and furans, anddichlorodiphenyldichloroethylene (p,p0-DDE), there are repro-ductive effect levels known specifically for tree swallows [3–7].For other chemical classes, the reproductive effect level canbe extrapolated from data published on other avian species.Because tree swallows have a localized feeding radius (mean¼ 661m for the prelaying period, 225m for the laying period)around their nest box [8], exposure to contaminants reflects theconditions within the AOC, rather than in a larger geographicalarea which some other commonly used avian species, such asherring gulls (Larus argentatus), are more appropriatelyused [9]. Because the tree swallow feeds primarily on theaerial stages of benthic aquatic insects [10,11] which readilyaccumulate sediment contamination, it is an avian model thatcan be tied to regulatory and management sediment qualityendpoints. Furthermore, linkages between sediment and treeswallow tissue concentrations are short and easily interpreted.Although the tree swallow is a midlevel consumer (insectivore),it bioaccumulates dioxins and furans more readily thanpiscivorous waterbirds [12,13]. Therefore, the tree swallow isa useful indicator for this relatively unstudied class of very toxichuman-made chemicals.
Another attribute of the tree swallow that makes it a usefulstudy species is its propensity to use nest boxes. Tree swallowscan be attracted to nest boxes placed in specific areas of interest,even to highly industrial landscapes where few other birds willnest, thus allowing attainment of adequate sample size in mostcases. Finally, tree swallows provide for a consistent samplingorganism across all AOCs, which allows direct comparison and
This article includes online-only Supplemental Data.* Address correspondence to [email protected] online 17 May 2016 in Wiley Online Library
(wileyonlinelibrary.com).DOI: 10.1002/etc.3496
Environmental Toxicology and Chemistry, Vol. 35, No. 12, pp. 3071–3092, 2016Published 2016 SETAC
Printed in the USA
3071
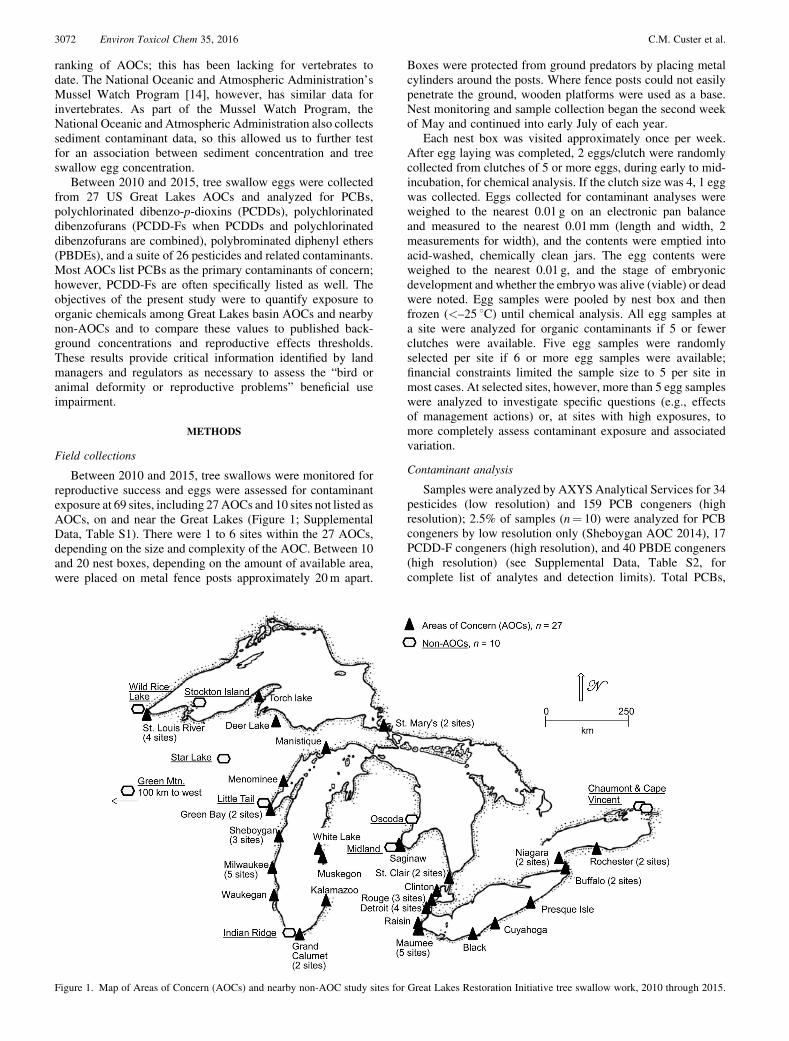
ranking of AOCs; this has been lacking for vertebrates todate. The National Oceanic and Atmospheric Administration’sMussel Watch Program [14], however, has similar data forinvertebrates. As part of the Mussel Watch Program, theNational Oceanic and Atmospheric Administration also collectssediment contaminant data, so this allowed us to further testfor an association between sediment concentration and treeswallow egg concentration.
Between 2010 and 2015, tree swallow eggs were collectedfrom 27 US Great Lakes AOCs and analyzed for PCBs,polychlorinated dibenzo-p-dioxins (PCDDs), polychlorinateddibenzofurans (PCDD-Fs when PCDDs and polychlorinateddibenzofurans are combined), polybrominated diphenyl ethers(PBDEs), and a suite of 26 pesticides and related contaminants.Most AOCs list PCBs as the primary contaminants of concern;however, PCDD-Fs are often specifically listed as well. Theobjectives of the present study were to quantify exposure toorganic chemicals among Great Lakes basin AOCs and nearbynon-AOCs and to compare these values to published back-ground concentrations and reproductive effects thresholds.These results provide critical information identified by landmanagers and regulators as necessary to assess the “bird oranimal deformity or reproductive problems” beneficial useimpairment.
METHODS
Field collections
Between 2010 and 2015, tree swallows were monitored forreproductive success and eggs were assessed for contaminantexposure at 69 sites, including 27AOCs and 10 sites not listed asAOCs, on and near the Great Lakes (Figure 1; SupplementalData, Table S1). There were 1 to 6 sites within the 27 AOCs,depending on the size and complexity of the AOC. Between 10and 20 nest boxes, depending on the amount of available area,were placed on metal fence posts approximately 20m apart.
Boxes were protected from ground predators by placing metalcylinders around the posts. Where fence posts could not easilypenetrate the ground, wooden platforms were used as a base.Nest monitoring and sample collection began the second weekof May and continued into early July of each year.
Each nest box was visited approximately once per week.After egg laying was completed, 2 eggs/clutch were randomlycollected from clutches of 5 or more eggs, during early to mid-incubation, for chemical analysis. If the clutch size was 4, 1 eggwas collected. Eggs collected for contaminant analyses wereweighed to the nearest 0.01 g on an electronic pan balanceand measured to the nearest 0.01mm (length and width, 2measurements for width), and the contents were emptied intoacid-washed, chemically clean jars. The egg contents wereweighed to the nearest 0.01 g, and the stage of embryonicdevelopment and whether the embryo was alive (viable) or deadwere noted. Egg samples were pooled by nest box and thenfrozen (<–25 8C) until chemical analysis. All egg samples ata site were analyzed for organic contaminants if 5 or fewerclutches were available. Five egg samples were randomlyselected per site if 6 or more egg samples were available;financial constraints limited the sample size to 5 per site inmost cases. At selected sites, however, more than 5 egg sampleswere analyzed to investigate specific questions (e.g., effectsof management actions) or, at sites with high exposures, tomore completely assess contaminant exposure and associatedvariation.
Contaminant analysis
Samples were analyzed by AXYS Analytical Services for 34pesticides (low resolution) and 159 PCB congeners (highresolution); 2.5% of samples (n¼ 10) were analyzed for PCBcongeners by low resolution only (Sheboygan AOC 2014), 17PCDD-F congeners (high resolution), and 40 PBDE congeners(high resolution) (see Supplemental Data, Table S2, forcomplete list of analytes and detection limits). Total PCBs,
Figure 1. Map of Areas of Concern (AOCs) and nearby non-AOC study sites for Great Lakes Restoration Initiative tree swallow work, 2010 through 2015.
3072 Environ Toxicol Chem 35, 2016 C.M. Custer et al.
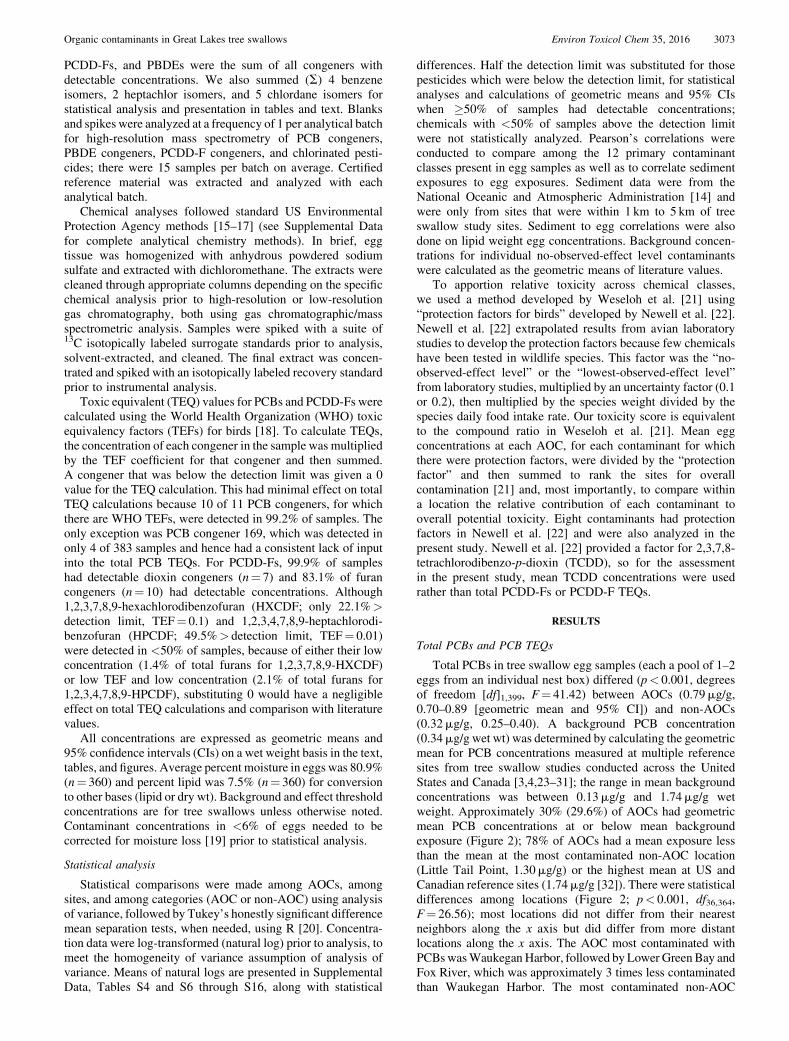
PCDD-Fs, and PBDEs were the sum of all congeners withdetectable concentrations. We also summed (S) 4 benzeneisomers, 2 heptachlor isomers, and 5 chlordane isomers forstatistical analysis and presentation in tables and text. Blanksand spikes were analyzed at a frequency of 1 per analytical batchfor high-resolution mass spectrometry of PCB congeners,PBDE congeners, PCDD-F congeners, and chlorinated pesti-cides; there were 15 samples per batch on average. Certifiedreference material was extracted and analyzed with eachanalytical batch.
Chemical analyses followed standard US EnvironmentalProtection Agency methods [15–17] (see Supplemental Datafor complete analytical chemistry methods). In brief, eggtissue was homogenized with anhydrous powdered sodiumsulfate and extracted with dichloromethane. The extracts werecleaned through appropriate columns depending on the specificchemical analysis prior to high-resolution or low-resolutiongas chromatography, both using gas chromatographic/massspectrometric analysis. Samples were spiked with a suite of13C isotopically labeled surrogate standards prior to analysis,solvent-extracted, and cleaned. The final extract was concen-trated and spiked with an isotopically labeled recovery standardprior to instrumental analysis.
Toxic equivalent (TEQ) values for PCBs and PCDD-Fs werecalculated using the World Health Organization (WHO) toxicequivalency factors (TEFs) for birds [18]. To calculate TEQs,the concentration of each congener in the sample was multipliedby the TEF coefficient for that congener and then summed.A congener that was below the detection limit was given a 0value for the TEQ calculation. This had minimal effect on totalTEQ calculations because 10 of 11 PCB congeners, for whichthere are WHO TEFs, were detected in 99.2% of samples. Theonly exception was PCB congener 169, which was detected inonly 4 of 383 samples and hence had a consistent lack of inputinto the total PCB TEQs. For PCDD-Fs, 99.9% of sampleshad detectable dioxin congeners (n¼ 7) and 83.1% of furancongeners (n¼ 10) had detectable concentrations. Although1,2,3,7,8,9-hexachlorodibenzofuran (HXCDF; only 22.1%>detection limit, TEF¼ 0.1) and 1,2,3,4,7,8,9-heptachlorodi-benzofuran (HPCDF; 49.5%> detection limit, TEF¼ 0.01)were detected in <50% of samples, because of either their lowconcentration (1.4% of total furans for 1,2,3,7,8,9-HXCDF)or low TEF and low concentration (2.1% of total furans for1,2,3,4,7,8,9-HPCDF), substituting 0 would have a negligibleeffect on total TEQ calculations and comparison with literaturevalues.
All concentrations are expressed as geometric means and95% confidence intervals (CIs) on a wet weight basis in the text,tables, and figures. Average percent moisture in eggs was 80.9%(n¼ 360) and percent lipid was 7.5% (n¼ 360) for conversionto other bases (lipid or dry wt). Background and effect thresholdconcentrations are for tree swallows unless otherwise noted.Contaminant concentrations in <6% of eggs needed to becorrected for moisture loss [19] prior to statistical analysis.
Statistical analysis
Statistical comparisons were made among AOCs, amongsites, and among categories (AOC or non-AOC) using analysisof variance, followed by Tukey’s honestly significant differencemean separation tests, when needed, using R [20]. Concentra-tion data were log-transformed (natural log) prior to analysis, tomeet the homogeneity of variance assumption of analysis ofvariance. Means of natural logs are presented in SupplementalData, Tables S4 and S6 through S16, along with statistical
differences. Half the detection limit was substituted for thosepesticides which were below the detection limit, for statisticalanalyses and calculations of geometric means and 95% CIswhen �50% of samples had detectable concentrations;chemicals with <50% of samples above the detection limitwere not statistically analyzed. Pearson’s correlations wereconducted to compare among the 12 primary contaminantclasses present in egg samples as well as to correlate sedimentexposures to egg exposures. Sediment data were from theNational Oceanic and Atmospheric Administration [14] andwere only from sites that were within 1 km to 5 km of treeswallow study sites. Sediment to egg correlations were alsodone on lipid weight egg concentrations. Background concen-trations for individual no-observed-effect level contaminantswere calculated as the geometric means of literature values.
To apportion relative toxicity across chemical classes,we used a method developed by Weseloh et al. [21] using“protection factors for birds” developed by Newell et al. [22].Newell et al. [22] extrapolated results from avian laboratorystudies to develop the protection factors because few chemicalshave been tested in wildlife species. This factor was the “no-observed-effect level” or the “lowest-observed-effect level”from laboratory studies, multiplied by an uncertainty factor (0.1or 0.2), then multiplied by the species weight divided by thespecies daily food intake rate. Our toxicity score is equivalentto the compound ratio in Weseloh et al. [21]. Mean eggconcentrations at each AOC, for each contaminant for whichthere were protection factors, were divided by the “protectionfactor” and then summed to rank the sites for overallcontamination [21] and, most importantly, to compare withina location the relative contribution of each contaminant tooverall potential toxicity. Eight contaminants had protectionfactors in Newell et al. [22] and were also analyzed in thepresent study. Newell et al. [22] provided a factor for 2,3,7,8-tetrachlorodibenzo-p-dioxin (TCDD), so for the assessmentin the present study, mean TCDD concentrations were usedrather than total PCDD-Fs or PCDD-F TEQs.
RESULTS
Total PCBs and PCB TEQs
Total PCBs in tree swallow egg samples (each a pool of 1–2eggs from an individual nest box) differed (p< 0.001, degreesof freedom [df]1,399, F¼ 41.42) between AOCs (0.79mg/g,0.70–0.89 [geometric mean and 95% CI]) and non-AOCs(0.32mg/g, 0.25–0.40). A background PCB concentration(0.34mg/g wet wt) was determined by calculating the geometricmean for PCB concentrations measured at multiple referencesites from tree swallow studies conducted across the UnitedStates and Canada [3,4,23–31]; the range in mean backgroundconcentrations was between 0.13mg/g and 1.74mg/g wetweight. Approximately 30% (29.6%) of AOCs had geometricmean PCB concentrations at or below mean backgroundexposure (Figure 2); 78% of AOCs had a mean exposure lessthan the mean at the most contaminated non-AOC location(Little Tail Point, 1.30mg/g) or the highest mean at US andCanadian reference sites (1.74mg/g [32]). There were statisticaldifferences among locations (Figure 2; p< 0.001, df36,364,F¼ 26.56); most locations did not differ from their nearestneighbors along the x axis but did differ from more distantlocations along the x axis. The AOC most contaminated withPCBswasWaukeganHarbor, followed by Lower GreenBay andFox River, which was approximately 3 times less contaminatedthan Waukegan Harbor. The most contaminated non-AOC
Organic contaminants in Great Lakes tree swallows Environ Toxicol Chem 35, 2016 3073
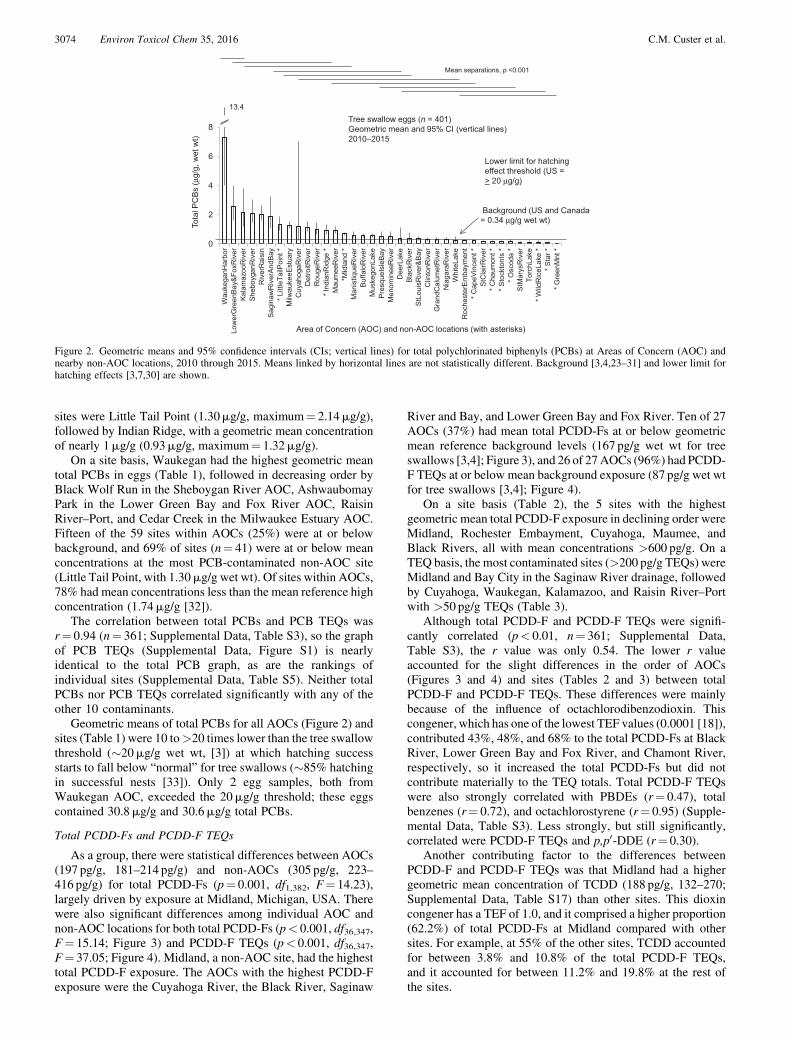
sites were Little Tail Point (1.30mg/g, maximum¼ 2.14mg/g),followed by Indian Ridge, with a geometric mean concentrationof nearly 1mg/g (0.93mg/g, maximum¼ 1.32mg/g).
On a site basis, Waukegan had the highest geometric meantotal PCBs in eggs (Table 1), followed in decreasing order byBlack Wolf Run in the Sheboygan River AOC, AshwaubomayPark in the Lower Green Bay and Fox River AOC, RaisinRiver–Port, and Cedar Creek in the Milwaukee Estuary AOC.Fifteen of the 59 sites within AOCs (25%) were at or belowbackground, and 69% of sites (n¼ 41) were at or below meanconcentrations at the most PCB-contaminated non-AOC site(Little Tail Point, with 1.30mg/g wet wt). Of sites within AOCs,78% had mean concentrations less than the mean reference highconcentration (1.74mg/g [32]).
The correlation between total PCBs and PCB TEQs wasr¼ 0.94 (n¼ 361; Supplemental Data, Table S3), so the graphof PCB TEQs (Supplemental Data, Figure S1) is nearlyidentical to the total PCB graph, as are the rankings ofindividual sites (Supplemental Data, Table S5). Neither totalPCBs nor PCB TEQs correlated significantly with any of theother 10 contaminants.
Geometric means of total PCBs for all AOCs (Figure 2) andsites (Table 1) were 10 to>20 times lower than the tree swallowthreshold (�20mg/g wet wt, [3]) at which hatching successstarts to fall below “normal” for tree swallows (�85% hatchingin successful nests [33]). Only 2 egg samples, both fromWaukegan AOC, exceeded the 20mg/g threshold; these eggscontained 30.8mg/g and 30.6mg/g total PCBs.
Total PCDD-Fs and PCDD-F TEQs
As a group, there were statistical differences between AOCs(197 pg/g, 181–214 pg/g) and non-AOCs (305 pg/g, 223–416 pg/g) for total PCDD-Fs (p¼ 0.001, df1,382, F¼ 14.23),largely driven by exposure at Midland, Michigan, USA. Therewere also significant differences among individual AOC andnon-AOC locations for both total PCDD-Fs (p< 0.001, df36,347,F¼ 15.14; Figure 3) and PCDD-F TEQs (p< 0.001, df36,347,F¼ 37.05; Figure 4). Midland, a non-AOC site, had the highesttotal PCDD-F exposure. The AOCs with the highest PCDD-Fexposure were the Cuyahoga River, the Black River, Saginaw
River and Bay, and Lower Green Bay and Fox River. Ten of 27AOCs (37%) had mean total PCDD-Fs at or below geometricmean reference background levels (167 pg/g wet wt for treeswallows [3,4]; Figure 3), and 26 of 27AOCs (96%) had PCDD-F TEQs at or below mean background exposure (87 pg/g wet wtfor tree swallows [3,4]; Figure 4).
On a site basis (Table 2), the 5 sites with the highestgeometric mean total PCDD-F exposure in declining order wereMidland, Rochester Embayment, Cuyahoga, Maumee, andBlack Rivers, all with mean concentrations >600 pg/g. On aTEQ basis, the most contaminated sites (>200 pg/g TEQs) wereMidland and Bay City in the Saginaw River drainage, followedby Cuyahoga, Waukegan, Kalamazoo, and Raisin River–Portwith >50 pg/g TEQs (Table 3).
Although total PCDD-F and PCDD-F TEQs were signifi-cantly correlated (p< 0.01, n¼ 361; Supplemental Data,Table S3), the r value was only 0.54. The lower r valueaccounted for the slight differences in the order of AOCs(Figures 3 and 4) and sites (Tables 2 and 3) between totalPCDD-F and PCDD-F TEQs. These differences were mainlybecause of the influence of octachlorodibenzodioxin. Thiscongener, which has one of the lowest TEF values (0.0001 [18]),contributed 43%, 48%, and 68% to the total PCDD-Fs at BlackRiver, Lower Green Bay and Fox River, and Chamont River,respectively, so it increased the total PCDD-Fs but did notcontribute materially to the TEQ totals. Total PCDD-F TEQswere also strongly correlated with PBDEs (r¼ 0.47), totalbenzenes (r¼ 0.72), and octachlorostyrene (r¼ 0.95) (Supple-mental Data, Table S3). Less strongly, but still significantly,correlated were PCDD-F TEQs and p,p0-DDE (r¼ 0.30).
Another contributing factor to the differences betweenPCDD-F and PCDD-F TEQs was that Midland had a highergeometric mean concentration of TCDD (188 pg/g, 132–270;Supplemental Data, Table S17) than other sites. This dioxincongener has a TEF of 1.0, and it comprised a higher proportion(62.2%) of total PCDD-Fs at Midland compared with othersites. For example, at 55% of the other sites, TCDD accountedfor between 3.8% and 10.8% of the total PCDD-F TEQs,and it accounted for between 11.2% and 19.8% at the rest ofthe sites.
0
2
4
6
8
Wau
kega
nHar
bor
Low
erG
reen
Bay&
FoxR
iver
Kala
maz
ooR
iver
Sheb
oyga
nRiv
erR
iver
Rai
sin
Sagi
naw
Riv
erAn
dBay
* Litt
leTa
ilPoi
nt *
Milw
auke
eEst
uary
Cuy
ahog
aRiv
erD
etro
itRiv
erR
ouge
Riv
er* I
ndia
nRid
ge *
Mau
mee
Riv
er*M
idla
nd *
Man
istiq
ueR
iver
Buffa
loR
iver
Mus
kego
nLak
ePr
esqu
eIsl
eBay
Men
omin
eeR
iver
Dee
rLak
eBl
ackR
iver
StLo
uisR
iver
&Bay
Clin
tonR
iver
Gra
ndC
alum
etR
iver
Nia
gara
Riv
erW
hite
Lake
Roc
hest
erEm
baym
ent
* Cap
eVin
cent
*St
Cla
irRiv
er* C
haum
ont *
* Sto
ckto
nIs
** O
scod
a *
StM
arys
Riv
erTo
rchL
ake
* Wild
Ric
eLak
e *
* Sta
r ** G
reen
Mnt
*
13.4Tree swallow eggs (n = 401)Geometric mean and 95% CI (vertical lines)2010–2015
Area of Concern (AOC) and non-AOC locations (with asterisks)
Background (US and Canada= 0.34 µg/g wet wt)To
tal P
CB
s (µ
g/g,
wet
wt)
Mean separations, p <0.001
Lower limit for hatching effect threshold (US => 20 µg/g)
Figure 2. Geometric means and 95% confidence intervals (CIs; vertical lines) for total polychlorinated biphenyls (PCBs) at Areas of Concern (AOC) andnearby non-AOC locations, 2010 through 2015. Means linked by horizontal lines are not statistically different. Background [3,4,23–31] and lower limit forhatching effects [3,7,30] are shown.
3074 Environ Toxicol Chem 35, 2016 C.M. Custer et al.
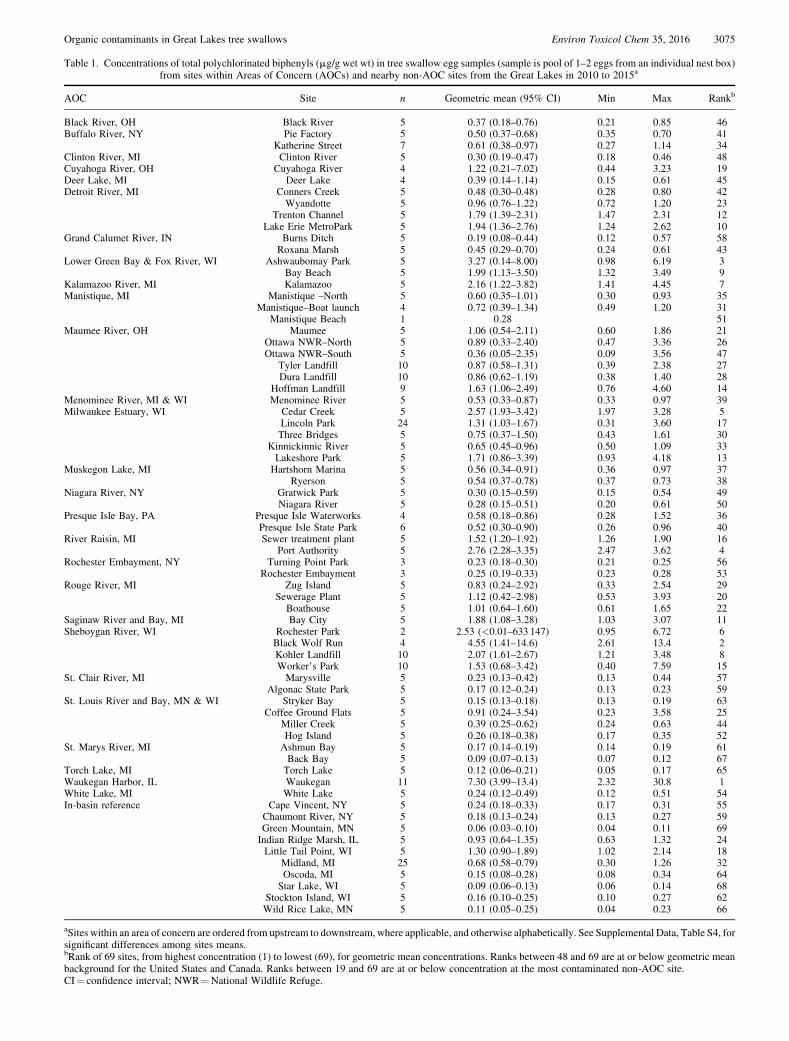
Table 1. Concentrations of total polychlorinated biphenyls (mg/g wet wt) in tree swallow egg samples (sample is pool of 1–2 eggs from an individual nest box)from sites within Areas of Concern (AOCs) and nearby non-AOC sites from the Great Lakes in 2010 to 2015a
AOC Site n Geometric mean (95% CI) Min Max Rankb
Black River, OH Black River 5 0.37 (0.18–0.76) 0.21 0.85 46Buffalo River, NY Pie Factory 5 0.50 (0.37–0.68) 0.35 0.70 41
Katherine Street 7 0.61 (0.38–0.97) 0.27 1.14 34Clinton River, MI Clinton River 5 0.30 (0.19–0.47) 0.18 0.46 48Cuyahoga River, OH Cuyahoga River 4 1.22 (0.21–7.02) 0.44 3.23 19Deer Lake, MI Deer Lake 4 0.39 (0.14–1.14) 0.15 0.61 45Detroit River, MI Conners Creek 5 0.48 (0.30–0.48) 0.28 0.80 42
Wyandotte 5 0.96 (0.76–1.22) 0.72 1.20 23Trenton Channel 5 1.79 (1.39–2.31) 1.47 2.31 12
Lake Erie MetroPark 5 1.94 (1.36–2.76) 1.24 2.62 10Grand Calumet River, IN Burns Ditch 5 0.19 (0.08–0.44) 0.12 0.57 58
Roxana Marsh 5 0.45 (0.29–0.70) 0.24 0.61 43Lower Green Bay & Fox River, WI Ashwaubomay Park 5 3.27 (0.14–8.00) 0.98 6.19 3
Bay Beach 5 1.99 (1.13–3.50) 1.32 3.49 9Kalamazoo River, MI Kalamazoo 5 2.16 (1.22–3.82) 1.41 4.45 7Manistique, MI Manistique –North 5 0.60 (0.35–1.01) 0.30 0.93 35
Manistique–Boat launch 4 0.72 (0.39–1.34) 0.49 1.20 31Manistique Beach 1 0.28 51
Maumee River, OH Maumee 5 1.06 (0.54–2.11) 0.60 1.86 21Ottawa NWR–North 5 0.89 (0.33–2.40) 0.47 3.36 26Ottawa NWR–South 5 0.36 (0.05–2.35) 0.09 3.56 47
Tyler Landfill 10 0.87 (0.58–1.31) 0.39 2.38 27Dura Landfill 10 0.86 (0.62–1.19) 0.38 1.40 28
Hoffman Landfill 9 1.63 (1.06–2.49) 0.76 4.60 14Menominee River, MI & WI Menominee River 5 0.53 (0.33–0.87) 0.33 0.97 39Milwaukee Estuary, WI Cedar Creek 5 2.57 (1.93–3.42) 1.97 3.28 5
Lincoln Park 24 1.31 (1.03–1.67) 0.31 3.60 17Three Bridges 5 0.75 (0.37–1.50) 0.43 1.61 30
Kinnickinnic River 5 0.65 (0.45–0.96) 0.50 1.09 33Lakeshore Park 5 1.71 (0.86–3.39) 0.93 4.18 13
Muskegon Lake, MI Hartshorn Marina 5 0.56 (0.34–0.91) 0.36 0.97 37Ryerson 5 0.54 (0.37–0.78) 0.37 0.73 38
Niagara River, NY Gratwick Park 5 0.30 (0.15–0.59) 0.15 0.54 49Niagara River 5 0.28 (0.15–0.51) 0.20 0.61 50
Presque Isle Bay, PA Presque Isle Waterworks 4 0.58 (0.18–0.86) 0.28 1.52 36Presque Isle State Park 6 0.52 (0.30–0.90) 0.26 0.96 40
River Raisin, MI Sewer treatment plant 5 1.52 (1.20–1.92) 1.26 1.90 16Port Authority 5 2.76 (2.28–3.35) 2.47 3.62 4
Rochester Embayment, NY Turning Point Park 3 0.23 (0.18–0.30) 0.21 0.25 56Rochester Embayment 3 0.25 (0.19–0.33) 0.23 0.28 53
Rouge River, MI Zug Island 5 0.83 (0.24–2.92) 0.33 2.54 29Sewerage Plant 5 1.12 (0.42–2.98) 0.53 3.93 20
Boathouse 5 1.01 (0.64–1.60) 0.61 1.65 22Saginaw River and Bay, MI Bay City 5 1.88 (1.08–3.28) 1.03 3.07 11Sheboygan River, WI Rochester Park 2 2.53 (<0.01–633 147) 0.95 6.72 6
Black Wolf Run 4 4.55 (1.41–14.6) 2.61 13.4 2Kohler Landfill 10 2.07 (1.61–2.67) 1.21 3.48 8Worker’s Park 10 1.53 (0.68–3.42) 0.40 7.59 15
St. Clair River, MI Marysville 5 0.23 (0.13–0.42) 0.13 0.44 57Algonac State Park 5 0.17 (0.12–0.24) 0.13 0.23 59
St. Louis River and Bay, MN & WI Stryker Bay 5 0.15 (0.13–0.18) 0.13 0.19 63Coffee Ground Flats 5 0.91 (0.24–3.54) 0.23 3.58 25
Miller Creek 5 0.39 (0.25–0.62) 0.24 0.63 44Hog Island 5 0.26 (0.18–0.38) 0.17 0.35 52
St. Marys River, MI Ashmun Bay 5 0.17 (0.14–0.19) 0.14 0.19 61Back Bay 5 0.09 (0.07–0.13) 0.07 0.12 67
Torch Lake, MI Torch Lake 5 0.12 (0.06–0.21) 0.05 0.17 65Waukegan Harbor, IL Waukegan 11 7.30 (3.99–13.4) 2.32 30.8 1White Lake, MI White Lake 5 0.24 (0.12–0.49) 0.12 0.51 54In-basin reference Cape Vincent, NY 5 0.24 (0.18–0.33) 0.17 0.31 55
Chaumont River, NY 5 0.18 (0.13–0.24) 0.13 0.27 59Green Mountain, MN 5 0.06 (0.03–0.10) 0.04 0.11 69Indian Ridge Marsh, IL 5 0.93 (0.64–1.35) 0.63 1.32 24Little Tail Point, WI 5 1.30 (0.90–1.89) 1.02 2.14 18
Midland, MI 25 0.68 (0.58–0.79) 0.30 1.26 32Oscoda, MI 5 0.15 (0.08–0.28) 0.08 0.34 64Star Lake, WI 5 0.09 (0.06–0.13) 0.06 0.14 68
Stockton Island, WI 5 0.16 (0.10–0.25) 0.10 0.27 62Wild Rice Lake, MN 5 0.11 (0.05–0.25) 0.04 0.23 66
aSites within an area of concern are ordered from upstream to downstream, where applicable, and otherwise alphabetically. See Supplemental Data, Table S4, forsignificant differences among sites means.bRank of 69 sites, from highest concentration (1) to lowest (69), for geometric mean concentrations. Ranks between 48 and 69 are at or below geometric meanbackground for the United States and Canada. Ranks between 19 and 69 are at or below concentration at the most contaminated non-AOC site.CI¼ confidence interval; NWR¼National Wildlife Refuge.
Organic contaminants in Great Lakes tree swallows Environ Toxicol Chem 35, 2016 3075
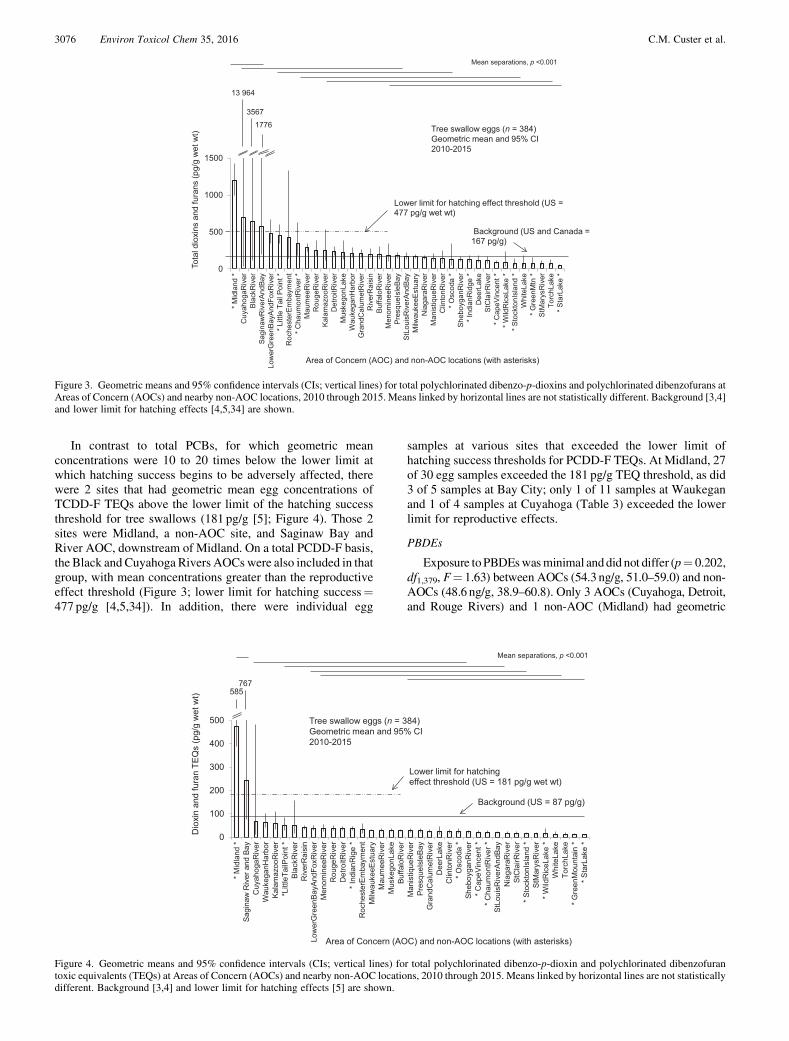
In contrast to total PCBs, for which geometric meanconcentrations were 10 to 20 times below the lower limit atwhich hatching success begins to be adversely affected, therewere 2 sites that had geometric mean egg concentrations ofTCDD-F TEQs above the lower limit of the hatching successthreshold for tree swallows (181 pg/g [5]; Figure 4). Those 2sites were Midland, a non-AOC site, and Saginaw Bay andRiver AOC, downstream of Midland. On a total PCDD-F basis,the Black and Cuyahoga Rivers AOCswere also included in thatgroup, with mean concentrations greater than the reproductiveeffect threshold (Figure 3; lower limit for hatching success¼477 pg/g [4,5,34]). In addition, there were individual egg
samples at various sites that exceeded the lower limit ofhatching success thresholds for PCDD-F TEQs. At Midland, 27of 30 egg samples exceeded the 181 pg/g TEQ threshold, as did3 of 5 samples at Bay City; only 1 of 11 samples at Waukeganand 1 of 4 samples at Cuyahoga (Table 3) exceeded the lowerlimit for reproductive effects.
PBDEs
Exposure toPBDEswasminimal anddid not differ (p¼ 0.202,df1,379, F¼ 1.63) between AOCs (54.3 ng/g, 51.0–59.0) and non-AOCs (48.6 ng/g, 38.9–60.8). Only 3 AOCs (Cuyahoga, Detroit,and Rouge Rivers) and 1 non-AOC (Midland) had geometric
0
500
1000
1500
* Mid
land
*C
uyah
ogaR
iver
Blac
kRiv
erSa
gina
wR
iver
AndB
ayLo
wer
Gre
enBa
yAnd
FoxR
iver
* Litt
le T
ail P
oint
*R
oche
ster
Emba
ymen
t* C
haum
ontR
iver
*M
aum
eeR
iver
Rou
geR
iver
Kala
maz
ooR
iver
Det
roitR
iver
Mus
kego
nLak
eW
auke
ganH
arbo
rG
rand
Cal
umet
Riv
erR
iver
Rai
sin
Buffa
loR
iver
Men
omin
eeR
iver
Pres
queI
sleB
aySt
Loui
sRiv
erAn
dBay
Milw
auke
eEst
uary
Nia
gara
Riv
erM
anis
tique
Riv
erC
linto
nRiv
er* O
scod
a *
Sheb
oyga
nRiv
er* I
ndia
nRid
ge *
Dee
rLak
eSt
Cla
irRiv
er* C
apeV
ince
nt *
* Wild
Ric
eLak
e *
* Sto
ckto
nIsl
and
*W
hite
Lake
* Gre
enM
tn *
StM
arys
Riv
erTo
rchL
ake
* Sta
rLak
e *
1776 Tree swallow eggs (n = 384)Geometric mean and 95% CI2010-2015
Area of Concern (AOC) and non-AOC locations (with asterisks)
Background (US and Canada =167 pg/g)
3567
13 964
Tota
l dio
xins
and
fura
ns (p
g/g
wet
wt)
Mean separations, p <0.001
Lower limit for hatching effect threshold (US =477 pg/g wet wt)
Figure 3. Geometric means and 95% confidence intervals (CIs; vertical lines) for total polychlorinated dibenzo-p-dioxins and polychlorinated dibenzofurans atAreas of Concern (AOCs) and nearby non-AOC locations, 2010 through 2015. Means linked by horizontal lines are not statistically different. Background [3,4]and lower limit for hatching effects [4,5,34] are shown.
0
100
200
300
400
500
* Mid
land
*Sa
gina
w R
iver
and
Bay
Cuy
ahog
aRiv
erW
auke
ganH
arbo
rKa
lam
azoo
Riv
er*L
ittle
TailP
oint
*Bl
ackR
iver
Riv
erR
aisi
nLo
wer
Gre
enBa
yAnd
FoxR
iver
Men
omin
eeR
iver
Rou
geR
iver
Det
roitR
iver
* Ind
ianR
ige
*R
oche
ster
Emba
ymen
tM
ilwau
keeE
stua
ryM
aum
eeR
iver
Mus
kego
nLak
eBu
ffalo
Riv
erM
anis
tique
Riv
erPr
esqu
eIsl
eBay
Gra
ndC
alum
etR
iver
Dee
rLak
eC
linto
nRiv
er* O
scod
a *
Sheb
oyga
nRiv
er* C
apeV
ince
nt *
* Cha
umon
tRiv
er *
StLo
uisR
iver
AndB
ayN
iaga
raR
iver
StC
lairR
iver
* Sto
ckto
nIsl
and
*St
Mar
ysR
iver
* Wild
Ric
eLak
e *
Whi
teLa
keTo
rchL
ake
* Gre
enM
ount
ain
** S
tarL
ake
*
Area of Concern (AOC) and non-AOC locations (with asterisks)
Dio
xin
and
fura
n TE
Qs
(pg/
g w
et w
t) 585
Mean separations, p <0.001
Tree swallow eggs (n = 384)Geometric mean and 95% CI2010-2015
Lower limit for hatching effect threshold (US = 181 pg/g wet wt)
Background (US = 87 pg/g)
767
Figure 4. Geometric means and 95% confidence intervals (CIs; vertical lines) for total polychlorinated dibenzo-p-dioxin and polychlorinated dibenzofurantoxic equivalents (TEQs) at Areas of Concern (AOCs) and nearby non-AOC locations, 2010 through 2015. Means linked by horizontal lines are not statisticallydifferent. Background [3,4] and lower limit for hatching effects [5] are shown.
3076 Environ Toxicol Chem 35, 2016 C.M. Custer et al.
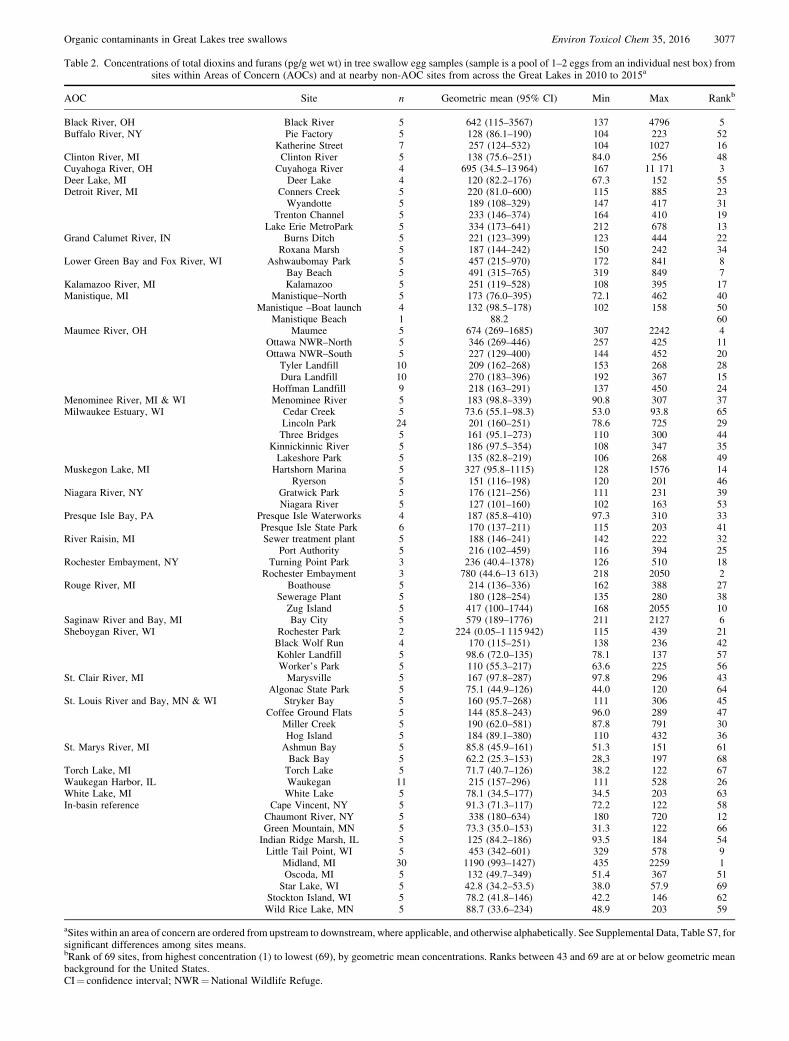
Table 2. Concentrations of total dioxins and furans (pg/g wet wt) in tree swallow egg samples (sample is a pool of 1–2 eggs from an individual nest box) fromsites within Areas of Concern (AOCs) and at nearby non-AOC sites from across the Great Lakes in 2010 to 2015a
AOC Site n Geometric mean (95% CI) Min Max Rankb
Black River, OH Black River 5 642 (115–3567) 137 4796 5Buffalo River, NY Pie Factory 5 128 (86.1–190) 104 223 52
Katherine Street 7 257 (124–532) 104 1027 16Clinton River, MI Clinton River 5 138 (75.6–251) 84.0 256 48Cuyahoga River, OH Cuyahoga River 4 695 (34.5–13 964) 167 11 171 3Deer Lake, MI Deer Lake 4 120 (82.2–176) 67.3 152 55Detroit River, MI Conners Creek 5 220 (81.0–600) 115 885 23
Wyandotte 5 189 (108–329) 147 417 31Trenton Channel 5 233 (146–374) 164 410 19
Lake Erie MetroPark 5 334 (173–641) 212 678 13Grand Calumet River, IN Burns Ditch 5 221 (123–399) 123 444 22
Roxana Marsh 5 187 (144–242) 150 242 34Lower Green Bay and Fox River, WI Ashwaubomay Park 5 457 (215–970) 172 841 8
Bay Beach 5 491 (315–765) 319 849 7Kalamazoo River, MI Kalamazoo 5 251 (119–528) 108 395 17Manistique, MI Manistique–North 5 173 (76.0–395) 72.1 462 40
Manistique –Boat launch 4 132 (98.5–178) 102 158 50Manistique Beach 1 88.2 60
Maumee River, OH Maumee 5 674 (269–1685) 307 2242 4Ottawa NWR–North 5 346 (269–446) 257 425 11Ottawa NWR–South 5 227 (129–400) 144 452 20
Tyler Landfill 10 209 (162–268) 153 268 28Dura Landfill 10 270 (183–396) 192 367 15
Hoffman Landfill 9 218 (163–291) 137 450 24Menominee River, MI & WI Menominee River 5 183 (98.8–339) 90.8 307 37Milwaukee Estuary, WI Cedar Creek 5 73.6 (55.1–98.3) 53.0 93.8 65
Lincoln Park 24 201 (160–251) 78.6 725 29Three Bridges 5 161 (95.1–273) 110 300 44
Kinnickinnic River 5 186 (97.5–354) 108 347 35Lakeshore Park 5 135 (82.8–219) 106 268 49
Muskegon Lake, MI Hartshorn Marina 5 327 (95.8–1115) 128 1576 14Ryerson 5 151 (116–198) 120 201 46
Niagara River, NY Gratwick Park 5 176 (121–256) 111 231 39Niagara River 5 127 (101–160) 102 163 53
Presque Isle Bay, PA Presque Isle Waterworks 4 187 (85.8–410) 97.3 310 33Presque Isle State Park 6 170 (137–211) 115 203 41
River Raisin, MI Sewer treatment plant 5 188 (146–241) 142 222 32Port Authority 5 216 (102–459) 116 394 25
Rochester Embayment, NY Turning Point Park 3 236 (40.4–1378) 126 510 18Rochester Embayment 3 780 (44.6–13 613) 218 2050 2
Rouge River, MI Boathouse 5 214 (136–336) 162 388 27Sewerage Plant 5 180 (128–254) 135 280 38Zug Island 5 417 (100–1744) 168 2055 10
Saginaw River and Bay, MI Bay City 5 579 (189–1776) 211 2127 6Sheboygan River, WI Rochester Park 2 224 (0.05–1 115 942) 115 439 21
Black Wolf Run 4 170 (115–251) 138 236 42Kohler Landfill 5 98.6 (72.0–135) 78.1 137 57Worker’s Park 5 110 (55.3–217) 63.6 225 56
St. Clair River, MI Marysville 5 167 (97.8–287) 97.8 296 43Algonac State Park 5 75.1 (44.9–126) 44.0 120 64
St. Louis River and Bay, MN & WI Stryker Bay 5 160 (95.7–268) 111 306 45Coffee Ground Flats 5 144 (85.8–243) 96.0 289 47
Miller Creek 5 190 (62.0–581) 87.8 791 30Hog Island 5 184 (89.1–380) 110 432 36
St. Marys River, MI Ashmun Bay 5 85.8 (45.9–161) 51.3 151 61Back Bay 5 62.2 (25.3–153) 28,3 197 68
Torch Lake, MI Torch Lake 5 71.7 (40.7–126) 38.2 122 67Waukegan Harbor, IL Waukegan 11 215 (157–296) 111 528 26White Lake, MI White Lake 5 78.1 (34.5–177) 34.5 203 63In-basin reference Cape Vincent, NY 5 91.3 (71.3–117) 72.2 122 58
Chaumont River, NY 5 338 (180–634) 180 720 12Green Mountain, MN 5 73.3 (35.0–153) 31.3 122 66Indian Ridge Marsh, IL 5 125 (84.2–186) 93.5 184 54Little Tail Point, WI 5 453 (342–601) 329 578 9
Midland, MI 30 1190 (993–1427) 435 2259 1Oscoda, MI 5 132 (49.7–349) 51.4 367 51Star Lake, WI 5 42.8 (34.2–53.5) 38.0 57.9 69
Stockton Island, WI 5 78.2 (41.8–146) 42.2 146 62Wild Rice Lake, MN 5 88.7 (33.6–234) 48.9 203 59
aSites within an area of concern are ordered from upstream to downstream, where applicable, and otherwise alphabetically. See Supplemental Data, Table S7, forsignificant differences among sites means.bRank of 69 sites, from highest concentration (1) to lowest (69), by geometric mean concentrations. Ranks between 43 and 69 are at or below geometric meanbackground for the United States.CI¼ confidence interval; NWR¼National Wildlife Refuge.
Organic contaminants in Great Lakes tree swallows Environ Toxicol Chem 35, 2016 3077
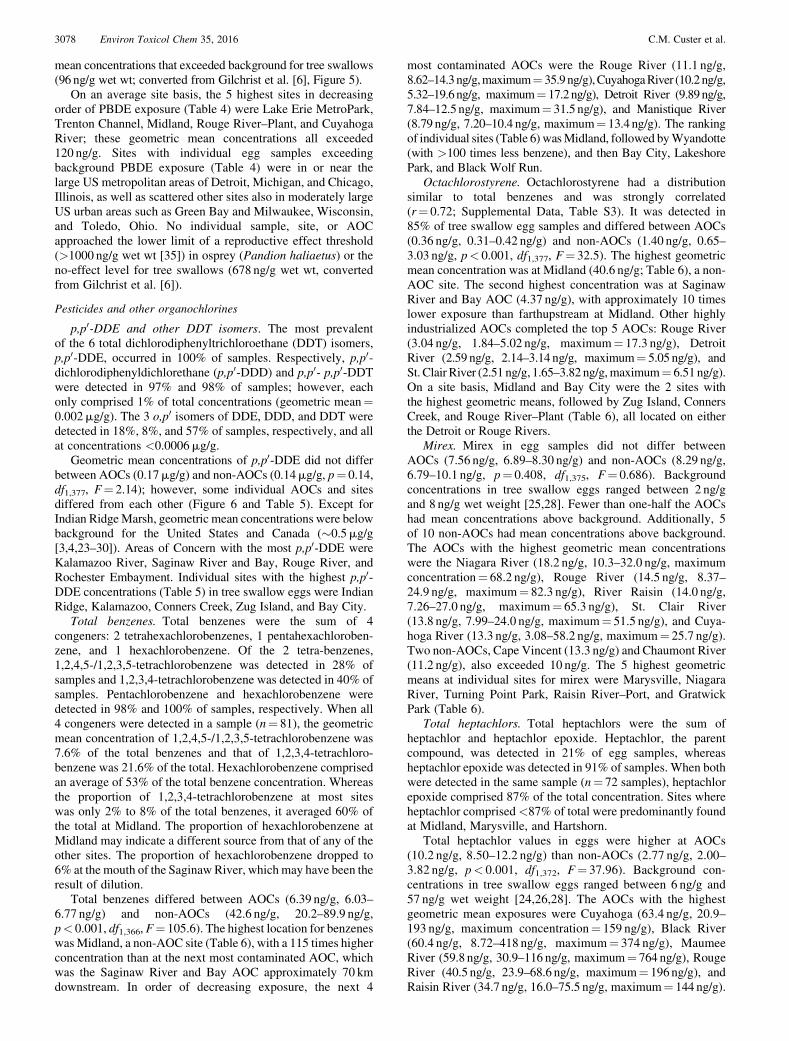
mean concentrations that exceeded background for tree swallows(96 ng/g wet wt; converted from Gilchrist et al. [6], Figure 5).
On an average site basis, the 5 highest sites in decreasingorder of PBDE exposure (Table 4) were Lake Erie MetroPark,Trenton Channel, Midland, Rouge River–Plant, and CuyahogaRiver; these geometric mean concentrations all exceeded120 ng/g. Sites with individual egg samples exceedingbackground PBDE exposure (Table 4) were in or near thelarge US metropolitan areas of Detroit, Michigan, and Chicago,Illinois, as well as scattered other sites also in moderately largeUS urban areas such as Green Bay and Milwaukee, Wisconsin,and Toledo, Ohio. No individual sample, site, or AOCapproached the lower limit of a reproductive effect threshold(>1000 ng/g wet wt [35]) in osprey (Pandion haliaetus) or theno-effect level for tree swallows (678 ng/g wet wt, convertedfrom Gilchrist et al. [6]).
Pesticides and other organochlorines
p,p0-DDE and other DDT isomers. The most prevalentof the 6 total dichlorodiphenyltrichloroethane (DDT) isomers,p,p0-DDE, occurred in 100% of samples. Respectively, p,p0-dichlorodiphenyldichlorethane (p,p0-DDD) and p,p0- p,p0-DDTwere detected in 97% and 98% of samples; however, eachonly comprised 1% of total concentrations (geometric mean¼0.002mg/g). The 3 o,p0 isomers of DDE, DDD, and DDT weredetected in 18%, 8%, and 57% of samples, respectively, and allat concentrations <0.0006mg/g.
Geometric mean concentrations of p,p0-DDE did not differbetween AOCs (0.17mg/g) and non-AOCs (0.14mg/g, p¼ 0.14,df1,377, F¼ 2.14); however, some individual AOCs and sitesdiffered from each other (Figure 6 and Table 5). Except forIndian RidgeMarsh, geometric mean concentrations were belowbackground for the United States and Canada (�0.5mg/g[3,4,23–30]). Areas of Concern with the most p,p0-DDE wereKalamazoo River, Saginaw River and Bay, Rouge River, andRochester Embayment. Individual sites with the highest p,p0-DDE concentrations (Table 5) in tree swallow eggs were IndianRidge, Kalamazoo, Conners Creek, Zug Island, and Bay City.
Total benzenes. Total benzenes were the sum of 4congeners: 2 tetrahexachlorobenzenes, 1 pentahexachloroben-zene, and 1 hexachlorobenzene. Of the 2 tetra-benzenes,1,2,4,5-/1,2,3,5-tetrachlorobenzene was detected in 28% ofsamples and 1,2,3,4-tetrachlorobenzene was detected in 40% ofsamples. Pentachlorobenzene and hexachlorobenzene weredetected in 98% and 100% of samples, respectively. When all4 congeners were detected in a sample (n¼ 81), the geometricmean concentration of 1,2,4,5-/1,2,3,5-tetrachlorobenzene was7.6% of the total benzenes and that of 1,2,3,4-tetrachloro-benzene was 21.6% of the total. Hexachlorobenzene comprisedan average of 53% of the total benzene concentration. Whereasthe proportion of 1,2,3,4-tetrachlorobenzene at most siteswas only 2% to 8% of the total benzenes, it averaged 60% ofthe total at Midland. The proportion of hexachlorobenzene atMidland may indicate a different source from that of any of theother sites. The proportion of hexachlorobenzene dropped to6% at the mouth of the SaginawRiver, which may have been theresult of dilution.
Total benzenes differed between AOCs (6.39 ng/g, 6.03–6.77 ng/g) and non-AOCs (42.6 ng/g, 20.2–89.9 ng/g,p< 0.001, df1,366, F¼ 105.6). The highest location for benzeneswasMidland, a non-AOC site (Table 6), with a 115 times higherconcentration than at the next most contaminated AOC, whichwas the Saginaw River and Bay AOC approximately 70 kmdownstream. In order of decreasing exposure, the next 4
most contaminated AOCs were the Rouge River (11.1 ng/g,8.62–14.3ng/g,maximum¼ 35.9ng/g),CuyahogaRiver (10.2ng/g,5.32–19.6ng/g, maximum¼ 17.2ng/g), Detroit River (9.89ng/g,7.84–12.5ng/g, maximum¼ 31.5 ng/g), and Manistique River(8.79 ng/g, 7.20–10.4 ng/g, maximum¼ 13.4 ng/g). The rankingof individual sites (Table 6) wasMidland, followed byWyandotte(with >100 times less benzene), and then Bay City, LakeshorePark, and Black Wolf Run.
Octachlorostyrene. Octachlorostyrene had a distributionsimilar to total benzenes and was strongly correlated(r¼ 0.72; Supplemental Data, Table S3). It was detected in85% of tree swallow egg samples and differed between AOCs(0.36 ng/g, 0.31–0.42 ng/g) and non-AOCs (1.40 ng/g, 0.65–3.03 ng/g, p< 0.001, df1,377, F¼ 32.5). The highest geometricmean concentration was at Midland (40.6 ng/g; Table 6), a non-AOC site. The second highest concentration was at SaginawRiver and Bay AOC (4.37 ng/g), with approximately 10 timeslower exposure than farthupstream at Midland. Other highlyindustrialized AOCs completed the top 5 AOCs: Rouge River(3.04 ng/g, 1.84–5.02 ng/g, maximum¼ 17.3 ng/g), DetroitRiver (2.59 ng/g, 2.14–3.14 ng/g, maximum¼ 5.05 ng/g), andSt. ClairRiver (2.51 ng/g, 1.65–3.82 ng/g,maximum¼ 6.51ng/g).On a site basis, Midland and Bay City were the 2 sites withthe highest geometric means, followed by Zug Island, ConnersCreek, and Rouge River–Plant (Table 6), all located on eitherthe Detroit or Rouge Rivers.
Mirex. Mirex in egg samples did not differ betweenAOCs (7.56 ng/g, 6.89–8.30 ng/g) and non-AOCs (8.29 ng/g,6.79–10.1 ng/g, p¼ 0.408, df1,375, F¼ 0.686). Backgroundconcentrations in tree swallow eggs ranged between 2 ng/gand 8 ng/g wet weight [25,28]. Fewer than one-half the AOCshad mean concentrations above background. Additionally, 5of 10 non-AOCs had mean concentrations above background.The AOCs with the highest geometric mean concentrationswere the Niagara River (18.2 ng/g, 10.3–32.0 ng/g, maximumconcentration¼ 68.2 ng/g), Rouge River (14.5 ng/g, 8.37–24.9 ng/g, maximum¼ 82.3 ng/g), River Raisin (14.0 ng/g,7.26–27.0 ng/g, maximum¼ 65.3 ng/g), St. Clair River(13.8 ng/g, 7.99–24.0 ng/g, maximum¼ 51.5 ng/g), and Cuya-hoga River (13.3 ng/g, 3.08–58.2 ng/g, maximum¼ 25.7 ng/g).Two non-AOCs, Cape Vincent (13.3 ng/g) and Chaumont River(11.2 ng/g), also exceeded 10 ng/g. The 5 highest geometricmeans at individual sites for mirex were Marysville, NiagaraRiver, Turning Point Park, Raisin River–Port, and GratwickPark (Table 6).
Total heptachlors. Total heptachlors were the sum ofheptachlor and heptachlor epoxide. Heptachlor, the parentcompound, was detected in 21% of egg samples, whereasheptachlor epoxide was detected in 91% of samples. When bothwere detected in the same sample (n¼ 72 samples), heptachlorepoxide comprised 87% of the total concentration. Sites whereheptachlor comprised<87% of total were predominantly foundat Midland, Marysville, and Hartshorn.
Total heptachlor values in eggs were higher at AOCs(10.2 ng/g, 8.50–12.2 ng/g) than non-AOCs (2.77 ng/g, 2.00–3.82 ng/g, p< 0.001, df1,372, F¼ 37.96). Background con-centrations in tree swallow eggs ranged between 6 ng/g and57 ng/g wet weight [24,26,28]. The AOCs with the highestgeometric mean exposures were Cuyahoga (63.4 ng/g, 20.9–193 ng/g, maximum concentration¼ 159 ng/g), Black River(60.4 ng/g, 8.72–418 ng/g, maximum¼ 374 ng/g), MaumeeRiver (59.8 ng/g, 30.9–116 ng/g, maximum¼ 764 ng/g), RougeRiver (40.5 ng/g, 23.9–68.6 ng/g, maximum¼ 196ng/g), andRaisin River (34.7 ng/g, 16.0–75.5 ng/g, maximum¼ 144 ng/g).
3078 Environ Toxicol Chem 35, 2016 C.M. Custer et al.
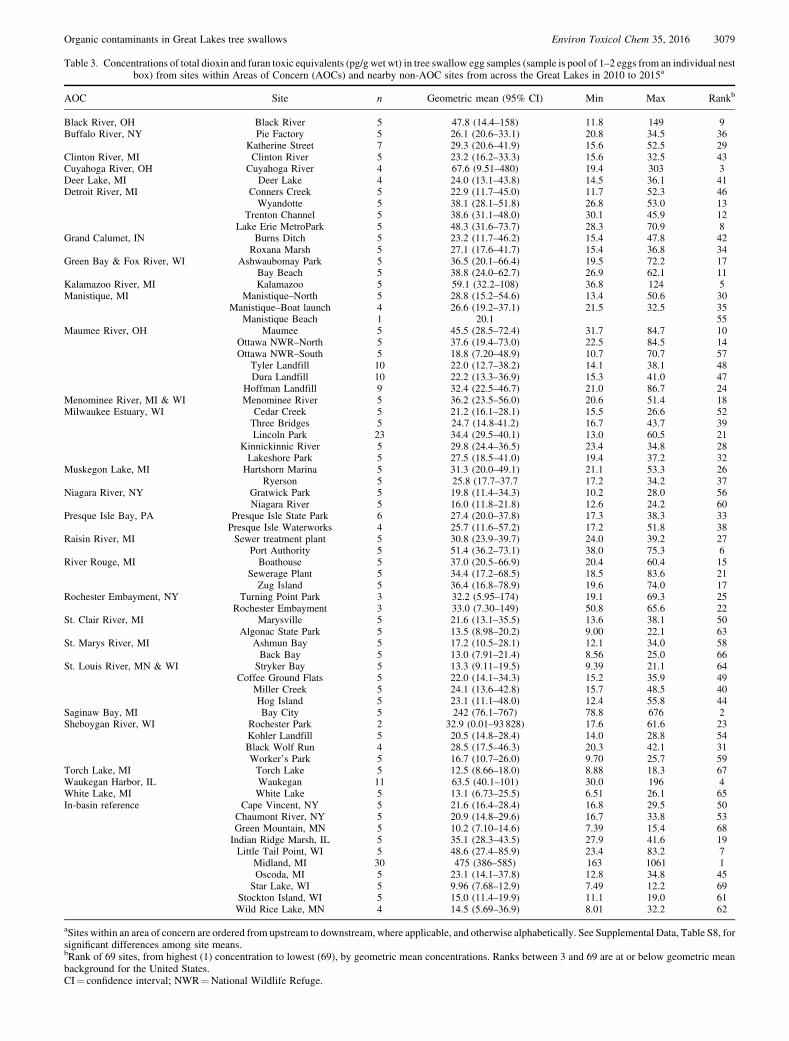
Table 3. Concentrations of total dioxin and furan toxic equivalents (pg/g wet wt) in tree swallow egg samples (sample is pool of 1–2 eggs from an individual nestbox) from sites within Areas of Concern (AOCs) and nearby non-AOC sites from across the Great Lakes in 2010 to 2015a
AOC Site n Geometric mean (95% CI) Min Max Rankb
Black River, OH Black River 5 47.8 (14.4–158) 11.8 149 9Buffalo River, NY Pie Factory 5 26.1 (20.6–33.1) 20.8 34.5 36
Katherine Street 7 29.3 (20.6–41.9) 15.6 52.5 29Clinton River, MI Clinton River 5 23.2 (16.2–33.3) 15.6 32.5 43Cuyahoga River, OH Cuyahoga River 4 67.6 (9.51–480) 19.4 303 3Deer Lake, MI Deer Lake 4 24.0 (13.1–43.8) 14.5 36.1 41Detroit River, MI Conners Creek 5 22.9 (11.7–45.0) 11.7 52.3 46
Wyandotte 5 38.1 (28.1–51.8) 26.8 53.0 13Trenton Channel 5 38.6 (31.1–48.0) 30.1 45.9 12
Lake Erie MetroPark 5 48.3 (31.6–73.7) 28.3 70.9 8Grand Calumet, IN Burns Ditch 5 23.2 (11.7–46.2) 15.4 47.8 42
Roxana Marsh 5 27.1 (17.6–41.7) 15.4 36.8 34Green Bay & Fox River, WI Ashwaubomay Park 5 36.5 (20.1–66.4) 19.5 72.2 17
Bay Beach 5 38.8 (24.0–62.7) 26.9 62.1 11Kalamazoo River, MI Kalamazoo 5 59.1 (32.2–108) 36.8 124 5Manistique, MI Manistique–North 5 28.8 (15.2–54.6) 13.4 50.6 30
Manistique–Boat launch 4 26.6 (19.2–37.1) 21.5 32.5 35Manistique Beach 1 20.1 55
Maumee River, OH Maumee 5 45.5 (28.5–72.4) 31.7 84.7 10Ottawa NWR–North 5 37.6 (19.4–73.0) 22.5 84.5 14Ottawa NWR–South 5 18.8 (7.20–48.9) 10.7 70.7 57
Tyler Landfill 10 22.0 (12.7–38.2) 14.1 38.1 48Dura Landfill 10 22.2 (13.3–36.9) 15.3 41.0 47
Hoffman Landfill 9 32.4 (22.5–46.7) 21.0 86.7 24Menominee River, MI & WI Menominee River 5 36.2 (23.5–56.0) 20.6 51.4 18Milwaukee Estuary, WI Cedar Creek 5 21.2 (16.1–28.1) 15.5 26.6 52
Three Bridges 5 24.7 (14.8-41.2) 16.7 43.7 39Lincoln Park 23 34.4 (29.5–40.1) 13.0 60.5 21
Kinnickinnic River 5 29.8 (24.4–36.5) 23.4 34.8 28Lakeshore Park 5 27.5 (18.5–41.0) 19.4 37.2 32
Muskegon Lake, MI Hartshorn Marina 5 31.3 (20.0–49.1) 21.1 53.3 26Ryerson 5 25.8 (17.7–37.7 17.2 34.2 37
Niagara River, NY Gratwick Park 5 19.8 (11.4–34.3) 10.2 28.0 56Niagara River 5 16.0 (11.8–21.8) 12.6 24.2 60
Presque Isle Bay, PA Presque Isle State Park 6 27.4 (20.0–37.8) 17.3 38.3 33Presque Isle Waterworks 4 25.7 (11.6–57.2) 17.2 51.8 38
Raisin River, MI Sewer treatment plant 5 30.8 (23.9–39.7) 24.0 39.2 27Port Authority 5 51.4 (36.2–73.1) 38.0 75.3 6
River Rouge, MI Boathouse 5 37.0 (20.5–66.9) 20.4 60.4 15Sewerage Plant 5 34.4 (17.2–68.5) 18.5 83.6 21Zug Island 5 36.4 (16.8–78.9) 19.6 74.0 17
Rochester Embayment, NY Turning Point Park 3 32.2 (5.95–174) 19.1 69.3 25Rochester Embayment 3 33.0 (7.30–149) 50.8 65.6 22
St. Clair River, MI Marysville 5 21.6 (13.1–35.5) 13.6 38.1 50Algonac State Park 5 13.5 (8.98–20.2) 9.00 22.1 63
St. Marys River, MI Ashmun Bay 5 17.2 (10.5–28.1) 12.1 34.0 58Back Bay 5 13.0 (7.91–21.4) 8.56 25.0 66
St. Louis River, MN & WI Stryker Bay 5 13.3 (9.11–19.5) 9.39 21.1 64Coffee Ground Flats 5 22.0 (14.1–34.3) 15.2 35.9 49
Miller Creek 5 24.1 (13.6–42.8) 15.7 48.5 40Hog Island 5 23.1 (11.1–48.0) 12.4 55.8 44
Saginaw Bay, MI Bay City 5 242 (76.1–767) 78.8 676 2Sheboygan River, WI Rochester Park 2 32.9 (0.01–93 828) 17.6 61.6 23
Kohler Landfill 5 20.5 (14.8–28.4) 14.0 28.8 54Black Wolf Run 4 28.5 (17.5–46.3) 20.3 42.1 31Worker’s Park 5 16.7 (10.7–26.0) 9.70 25.7 59
Torch Lake, MI Torch Lake 5 12.5 (8.66–18.0) 8.88 18.3 67Waukegan Harbor, IL Waukegan 11 63.5 (40.1–101) 30.0 196 4White Lake, MI White Lake 5 13.1 (6.73–25.5) 6.51 26.1 65In-basin reference Cape Vincent, NY 5 21.6 (16.4–28.4) 16.8 29.5 50
Chaumont River, NY 5 20.9 (14.8–29.6) 16.7 33.8 53Green Mountain, MN 5 10.2 (7.10–14.6) 7.39 15.4 68Indian Ridge Marsh, IL 5 35.1 (28.3–43.5) 27.9 41.6 19Little Tail Point, WI 5 48.6 (27.4–85.9) 23.4 83.2 7
Midland, MI 30 475 (386–585) 163 1061 1Oscoda, MI 5 23.1 (14.1–37.8) 12.8 34.8 45Star Lake, WI 5 9.96 (7.68–12.9) 7.49 12.2 69
Stockton Island, WI 5 15.0 (11.4–19.9) 11.1 19.0 61Wild Rice Lake, MN 4 14.5 (5.69–36.9) 8.01 32.2 62
aSites within an area of concern are ordered from upstream to downstream, where applicable, and otherwise alphabetically. See Supplemental Data, Table S8, forsignificant differences among site means.bRank of 69 sites, from highest (1) concentration to lowest (69), by geometric mean concentrations. Ranks between 3 and 69 are at or below geometric meanbackground for the United States.CI¼ confidence interval; NWR¼National Wildlife Refuge.
Organic contaminants in Great Lakes tree swallows Environ Toxicol Chem 35, 2016 3079
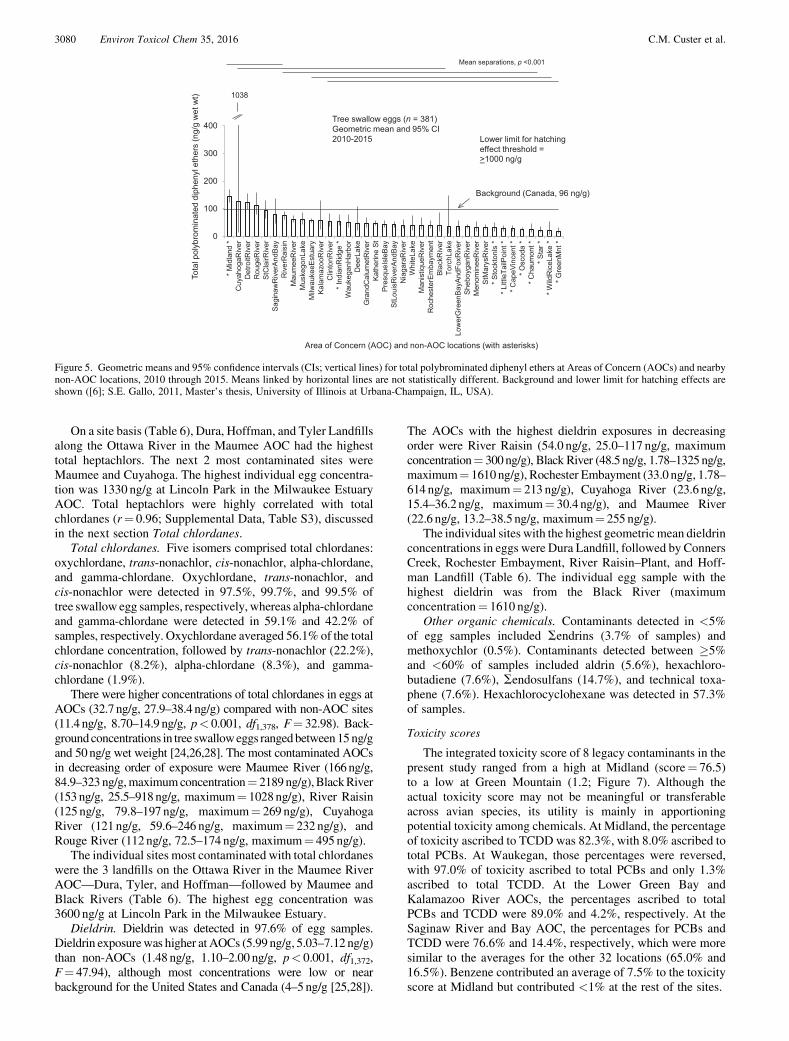
On a site basis (Table 6), Dura, Hoffman, and Tyler Landfillsalong the Ottawa River in the Maumee AOC had the highesttotal heptachlors. The next 2 most contaminated sites wereMaumee and Cuyahoga. The highest individual egg concentra-tion was 1330 ng/g at Lincoln Park in the Milwaukee EstuaryAOC. Total heptachlors were highly correlated with totalchlordanes (r¼ 0.96; Supplemental Data, Table S3), discussedin the next section Total chlordanes.
Total chlordanes. Five isomers comprised total chlordanes:oxychlordane, trans-nonachlor, cis-nonachlor, alpha-chlordane,and gamma-chlordane. Oxychlordane, trans-nonachlor, andcis-nonachlor were detected in 97.5%, 99.7%, and 99.5% oftree swallow egg samples, respectively, whereas alpha-chlordaneand gamma-chlordane were detected in 59.1% and 42.2% ofsamples, respectively. Oxychlordane averaged 56.1% of the totalchlordane concentration, followed by trans-nonachlor (22.2%),cis-nonachlor (8.2%), alpha-chlordane (8.3%), and gamma-chlordane (1.9%).
There were higher concentrations of total chlordanes in eggs atAOCs (32.7 ng/g, 27.9–38.4 ng/g) compared with non-AOC sites(11.4 ng/g, 8.70–14.9 ng/g, p< 0.001, df1,378, F¼ 32.98). Back-groundconcentrations in tree swalloweggs rangedbetween15ng/gand 50ng/g wet weight [24,26,28]. The most contaminated AOCsin decreasing order of exposure were Maumee River (166ng/g,84.9–323 ng/g,maximumconcentration¼ 2189ng/g),BlackRiver(153ng/g, 25.5–918ng/g, maximum¼ 1028ng/g), River Raisin(125ng/g, 79.8–197 ng/g, maximum¼ 269 ng/g), CuyahogaRiver (121ng/g, 59.6–246 ng/g, maximum¼ 232 ng/g), andRouge River (112ng/g, 72.5–174 ng/g, maximum¼ 495 ng/g).
The individual sites most contaminated with total chlordaneswere the 3 landfills on the Ottawa River in the Maumee RiverAOC—Dura, Tyler, and Hoffman—followed by Maumee andBlack Rivers (Table 6). The highest egg concentration was3600 ng/g at Lincoln Park in the Milwaukee Estuary.
Dieldrin. Dieldrin was detected in 97.6% of egg samples.Dieldrin exposurewas higher at AOCs (5.99 ng/g, 5.03–7.12 ng/g)than non-AOCs (1.48 ng/g, 1.10–2.00 ng/g, p< 0.001, df1,372,F¼ 47.94), although most concentrations were low or nearbackground for the United States and Canada (4–5 ng/g [25,28]).
The AOCs with the highest dieldrin exposures in decreasingorder were River Raisin (54.0 ng/g, 25.0–117 ng/g, maximumconcentration¼ 300ng/g), Black River (48.5 ng/g, 1.78–1325ng/g,maximum¼ 1610ng/g), Rochester Embayment (33.0 ng/g, 1.78–614 ng/g, maximum¼ 213 ng/g), Cuyahoga River (23.6 ng/g,15.4–36.2ng/g, maximum¼ 30.4 ng/g), and Maumee River(22.6 ng/g, 13.2–38.5 ng/g, maximum¼ 255 ng/g).
The individual sites with the highest geometric mean dieldrinconcentrations in eggs were Dura Landfill, followed by ConnersCreek, Rochester Embayment, River Raisin–Plant, and Hoff-man Landfill (Table 6). The individual egg sample with thehighest dieldrin was from the Black River (maximumconcentration¼ 1610 ng/g).
Other organic chemicals. Contaminants detected in <5%of egg samples included Sendrins (3.7% of samples) andmethoxychlor (0.5%). Contaminants detected between �5%and <60% of samples included aldrin (5.6%), hexachloro-butadiene (7.6%), Sendosulfans (14.7%), and technical toxa-phene (7.6%). Hexachlorocyclohexane was detected in 57.3%of samples.
Toxicity scores
The integrated toxicity score of 8 legacy contaminants in thepresent study ranged from a high at Midland (score¼ 76.5)to a low at Green Mountain (1.2; Figure 7). Although theactual toxicity score may not be meaningful or transferableacross avian species, its utility is mainly in apportioningpotential toxicity among chemicals. At Midland, the percentageof toxicity ascribed to TCDD was 82.3%, with 8.0% ascribed tototal PCBs. At Waukegan, those percentages were reversed,with 97.0% of toxicity ascribed to total PCBs and only 1.3%ascribed to total TCDD. At the Lower Green Bay andKalamazoo River AOCs, the percentages ascribed to totalPCBs and TCDD were 89.0% and 4.2%, respectively. At theSaginaw River and Bay AOC, the percentages for PCBs andTCDD were 76.6% and 14.4%, respectively, which were moresimilar to the averages for the other 32 locations (65.0% and16.5%). Benzene contributed an average of 7.5% to the toxicityscore at Midland but contributed <1% at the rest of the sites.
Mean separations, p <0.001
Area of Concern (AOC) and non-AOC locations (with asterisks)
0
100
200
300
400
* Mid
land
*C
uyah
ogaR
iver
Det
roitR
iver
Rou
geR
iver
StC
lairR
iver
Sagi
naw
Riv
erAn
dBay
Riv
erR
aisi
nM
aum
eeR
iver
Mus
kego
nLak
eM
ilwau
keeE
stua
ryKa
lam
azoo
Riv
erC
linto
nRiv
er* I
ndia
nRid
ge *
Wau
kega
nHar
bor
Dee
rLak
eG
rand
Cal
umet
Riv
erKa
ther
ine
StPr
esqu
eIsl
eBay
StLo
uisR
iver
AndB
ayN
iaga
raR
iver
Whi
teLa
keM
anis
tique
Riv
erR
oche
ster
Emba
ymen
tBl
ackR
iver
Torc
hLak
eLo
wer
Gre
enBa
yAnd
FoxR
iver
Sheb
oyga
nRiv
erM
enom
inee
Riv
erSt
Mar
ysR
iver
* Sto
ckto
nIs
** L
ittle
TailP
oint
** C
apeV
ince
nt *
* Osc
oda
** C
haum
ont *
* Sta
r ** W
ildR
iceL
ake
** G
reen
Mnt
*
Tree swallow eggs (n = 381)Geometric mean and 95% CI2010-2015
1038
Tota
l pol
ybro
min
ated
dip
heny
l eth
ers
( ng/
g w
et w
t)Background (Canada, 96 ng/g)
Lower limit for hatching effect threshold = >1000 ng/g
Figure 5. Geometric means and 95% confidence intervals (CIs; vertical lines) for total polybrominated diphenyl ethers at Areas of Concern (AOCs) and nearbynon-AOC locations, 2010 through 2015. Means linked by horizontal lines are not statistically different. Background and lower limit for hatching effects areshown ([6]; S.E. Gallo, 2011, Master’s thesis, University of Illinois at Urbana-Champaign, IL, USA).
3080 Environ Toxicol Chem 35, 2016 C.M. Custer et al.
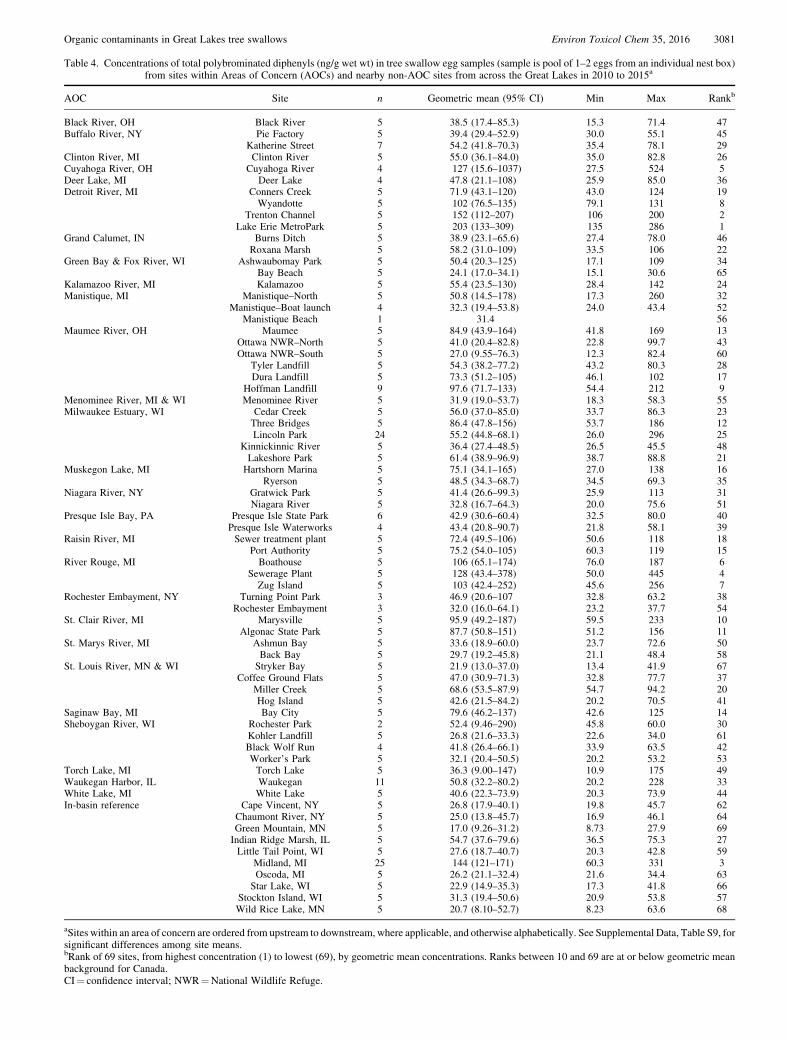
Table 4. Concentrations of total polybrominated diphenyls (ng/g wet wt) in tree swallow egg samples (sample is pool of 1–2 eggs from an individual nest box)from sites within Areas of Concern (AOCs) and nearby non-AOC sites from across the Great Lakes in 2010 to 2015a
AOC Site n Geometric mean (95% CI) Min Max Rankb
Black River, OH Black River 5 38.5 (17.4–85.3) 15.3 71.4 47Buffalo River, NY Pie Factory 5 39.4 (29.4–52.9) 30.0 55.1 45
Katherine Street 7 54.2 (41.8–70.3) 35.4 78.1 29Clinton River, MI Clinton River 5 55.0 (36.1–84.0) 35.0 82.8 26Cuyahoga River, OH Cuyahoga River 4 127 (15.6–1037) 27.5 524 5Deer Lake, MI Deer Lake 4 47.8 (21.1–108) 25.9 85.0 36Detroit River, MI Conners Creek 5 71.9 (43.1–120) 43.0 124 19
Wyandotte 5 102 (76.5–135) 79.1 131 8Trenton Channel 5 152 (112–207) 106 200 2
Lake Erie MetroPark 5 203 (133–309) 135 286 1Grand Calumet, IN Burns Ditch 5 38.9 (23.1–65.6) 27.4 78.0 46
Roxana Marsh 5 58.2 (31.0–109) 33.5 106 22Green Bay & Fox River, WI Ashwaubomay Park 5 50.4 (20.3–125) 17.1 109 34
Bay Beach 5 24.1 (17.0–34.1) 15.1 30.6 65Kalamazoo River, MI Kalamazoo 5 55.4 (23.5–130) 28.4 142 24Manistique, MI Manistique–North 5 50.8 (14.5–178) 17.3 260 32
Manistique–Boat launch 4 32.3 (19.4–53.8) 24.0 43.4 52Manistique Beach 1 31.4 56
Maumee River, OH Maumee 5 84.9 (43.9–164) 41.8 169 13Ottawa NWR–North 5 41.0 (20.4–82.8) 22.8 99.7 43Ottawa NWR–South 5 27.0 (9.55–76.3) 12.3 82.4 60
Tyler Landfill 5 54.3 (38.2–77.2) 43.2 80.3 28Dura Landfill 5 73.3 (51.2–105) 46.1 102 17
Hoffman Landfill 9 97.6 (71.7–133) 54.4 212 9Menominee River, MI & WI Menominee River 5 31.9 (19.0–53.7) 18.3 58.3 55Milwaukee Estuary, WI Cedar Creek 5 56.0 (37.0–85.0) 33.7 86.3 23
Three Bridges 5 86.4 (47.8–156) 53.7 186 12Lincoln Park 24 55.2 (44.8–68.1) 26.0 296 25
Kinnickinnic River 5 36.4 (27.4–48.5) 26.5 45.5 48Lakeshore Park 5 61.4 (38.9–96.9) 38.7 88.8 21
Muskegon Lake, MI Hartshorn Marina 5 75.1 (34.1–165) 27.0 138 16Ryerson 5 48.5 (34.3–68.7) 34.5 69.3 35
Niagara River, NY Gratwick Park 5 41.4 (26.6–99.3) 25.9 113 31Niagara River 5 32.8 (16.7–64.3) 20.0 75.6 51
Presque Isle Bay, PA Presque Isle State Park 6 42.9 (30.6–60.4) 32.5 80.0 40Presque Isle Waterworks 4 43.4 (20.8–90.7) 21.8 58.1 39
Raisin River, MI Sewer treatment plant 5 72.4 (49.5–106) 50.6 118 18Port Authority 5 75.2 (54.0–105) 60.3 119 15
River Rouge, MI Boathouse 5 106 (65.1–174) 76.0 187 6Sewerage Plant 5 128 (43.4–378) 50.0 445 4Zug Island 5 103 (42.4–252) 45.6 256 7
Rochester Embayment, NY Turning Point Park 3 46.9 (20.6–107 32.8 63.2 38Rochester Embayment 3 32.0 (16.0–64.1) 23.2 37.7 54
St. Clair River, MI Marysville 5 95.9 (49.2–187) 59.5 233 10Algonac State Park 5 87.7 (50.8–151) 51.2 156 11
St. Marys River, MI Ashmun Bay 5 33.6 (18.9–60.0) 23.7 72.6 50Back Bay 5 29.7 (19.2–45.8) 21.1 48.4 58
St. Louis River, MN & WI Stryker Bay 5 21.9 (13.0–37.0) 13.4 41.9 67Coffee Ground Flats 5 47.0 (30.9–71.3) 32.8 77.7 37
Miller Creek 5 68.6 (53.5–87.9) 54.7 94.2 20Hog Island 5 42.6 (21.5–84.2) 20.2 70.5 41
Saginaw Bay, MI Bay City 5 79.6 (46.2–137) 42.6 125 14Sheboygan River, WI Rochester Park 2 52.4 (9.46–290) 45.8 60.0 30
Kohler Landfill 5 26.8 (21.6–33.3) 22.6 34.0 61Black Wolf Run 4 41.8 (26.4–66.1) 33.9 63.5 42Worker’s Park 5 32.1 (20.4–50.5) 20.2 53.2 53
Torch Lake, MI Torch Lake 5 36.3 (9.00–147) 10.9 175 49Waukegan Harbor, IL Waukegan 11 50.8 (32.2–80.2) 20.2 228 33White Lake, MI White Lake 5 40.6 (22.3–73.9) 20.3 73.9 44In-basin reference Cape Vincent, NY 5 26.8 (17.9–40.1) 19.8 45.7 62
Chaumont River, NY 5 25.0 (13.8–45.7) 16.9 46.1 64Green Mountain, MN 5 17.0 (9.26–31.2) 8.73 27.9 69Indian Ridge Marsh, IL 5 54.7 (37.6–79.6) 36.5 75.3 27Little Tail Point, WI 5 27.6 (18.7–40.7) 20.3 42.8 59
Midland, MI 25 144 (121–171) 60.3 331 3Oscoda, MI 5 26.2 (21.1–32.4) 21.6 34.4 63
Star Lake, WI 5 22.9 (14.9–35.3) 17.3 41.8 66Stockton Island, WI 5 31.3 (19.4–50.6) 20.9 53.8 57Wild Rice Lake, MN 5 20.7 (8.10–52.7) 8.23 63.6 68
aSites within an area of concern are ordered from upstream to downstream, where applicable, and otherwise alphabetically. See Supplemental Data, Table S9, forsignificant differences among site means.bRank of 69 sites, from highest concentration (1) to lowest (69), by geometric mean concentrations. Ranks between 10 and 69 are at or below geometric meanbackground for Canada.CI¼ confidence interval; NWR¼National Wildlife Refuge.
Organic contaminants in Great Lakes tree swallows Environ Toxicol Chem 35, 2016 3081
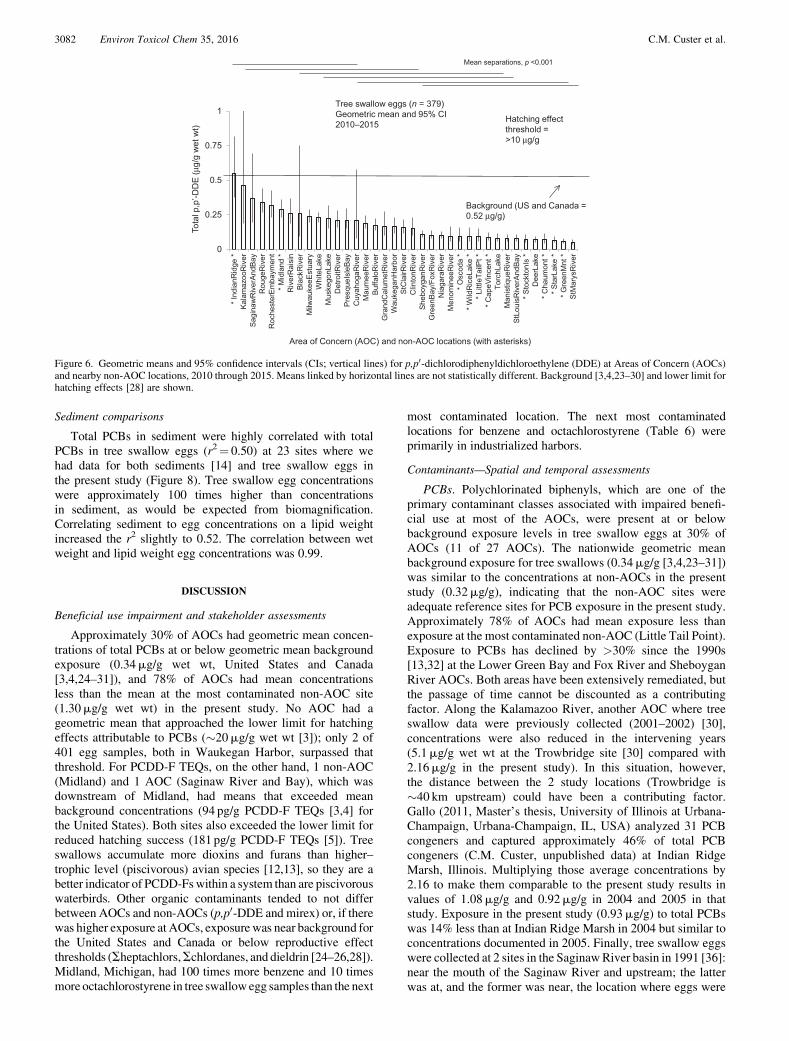
Sediment comparisons
Total PCBs in sediment were highly correlated with totalPCBs in tree swallow eggs (r2¼ 0.50) at 23 sites where wehad data for both sediments [14] and tree swallow eggs inthe present study (Figure 8). Tree swallow egg concentrationswere approximately 100 times higher than concentrationsin sediment, as would be expected from biomagnification.Correlating sediment to egg concentrations on a lipid weightincreased the r2 slightly to 0.52. The correlation between wetweight and lipid weight egg concentrations was 0.99.
DISCUSSION
Beneficial use impairment and stakeholder assessments
Approximately 30% of AOCs had geometric mean concen-trations of total PCBs at or below geometric mean backgroundexposure (0.34mg/g wet wt, United States and Canada[3,4,24–31]), and 78% of AOCs had mean concentrationsless than the mean at the most contaminated non-AOC site(1.30mg/g wet wt) in the present study. No AOC had ageometric mean that approached the lower limit for hatchingeffects attributable to PCBs (�20mg/g wet wt [3]); only 2 of401 egg samples, both in Waukegan Harbor, surpassed thatthreshold. For PCDD-F TEQs, on the other hand, 1 non-AOC(Midland) and 1 AOC (Saginaw River and Bay), which wasdownstream of Midland, had means that exceeded meanbackground concentrations (94 pg/g PCDD-F TEQs [3,4] forthe United States). Both sites also exceeded the lower limit forreduced hatching success (181 pg/g PCDD-F TEQs [5]). Treeswallows accumulate more dioxins and furans than higher–trophic level (piscivorous) avian species [12,13], so they are abetter indicator of PCDD-Fswithin a system than are piscivorouswaterbirds. Other organic contaminants tended to not differbetween AOCs and non-AOCs (p,p0-DDE and mirex) or, if therewas higher exposure at AOCs, exposurewas near background forthe United States and Canada or below reproductive effectthresholds (Sheptachlors,Schlordanes, and dieldrin [24–26,28]).Midland, Michigan, had 100 times more benzene and 10 timesmore octachlorostyrene in tree swallowegg samples than the next
most contaminated location. The next most contaminatedlocations for benzene and octachlorostyrene (Table 6) wereprimarily in industrialized harbors.
Contaminants—Spatial and temporal assessments
PCBs. Polychlorinated biphenyls, which are one of theprimary contaminant classes associated with impaired benefi-cial use at most of the AOCs, were present at or belowbackground exposure levels in tree swallow eggs at 30% ofAOCs (11 of 27 AOCs). The nationwide geometric meanbackground exposure for tree swallows (0.34mg/g [3,4,23–31])was similar to the concentrations at non-AOCs in the presentstudy (0.32mg/g), indicating that the non-AOC sites wereadequate reference sites for PCB exposure in the present study.Approximately 78% of AOCs had mean exposure less thanexposure at the most contaminated non-AOC (Little Tail Point).Exposure to PCBs has declined by >30% since the 1990s[13,32] at the Lower Green Bay and Fox River and SheboyganRiver AOCs. Both areas have been extensively remediated, butthe passage of time cannot be discounted as a contributingfactor. Along the Kalamazoo River, another AOC where treeswallow data were previously collected (2001–2002) [30],concentrations were also reduced in the intervening years(5.1mg/g wet wt at the Trowbridge site [30] compared with2.16mg/g in the present study). In this situation, however,the distance between the 2 study locations (Trowbridge is�40 km upstream) could have been a contributing factor.Gallo (2011, Master’s thesis, University of Illinois at Urbana-Champaign, Urbana-Champaign, IL, USA) analyzed 31 PCBcongeners and captured approximately 46% of total PCBcongeners (C.M. Custer, unpublished data) at Indian RidgeMarsh, Illinois. Multiplying those average concentrations by2.16 to make them comparable to the present study results invalues of 1.08mg/g and 0.92mg/g in 2004 and 2005 in thatstudy. Exposure in the present study (0.93mg/g) to total PCBswas 14% less than at Indian Ridge Marsh in 2004 but similar toconcentrations documented in 2005. Finally, tree swallow eggswere collected at 2 sites in the SaginawRiver basin in 1991 [36]:near the mouth of the Saginaw River and upstream; the latterwas at, and the former was near, the location where eggs were
0
0.25
0.5
0.75
1
* Ind
ianR
idge
*Ka
lam
azoo
Riv
erSa
gina
wR
iver
AndB
ayR
ouge
Riv
erR
oche
ster
Emba
ymen
t* M
idla
nd *
Riv
erR
aisi
nBl
ackR
iver
Milw
auke
eEst
uary
Whi
teLa
keM
uske
gonL
ake
Det
roitR
iver
Pres
queI
sleB
ayC
uyah
ogaR
iver
Mau
mee
Riv
erBu
ffalo
Riv
erG
rand
Cal
umet
Riv
erW
auke
ganH
arbo
rSt
Cla
irRiv
erC
linto
nRiv
erSh
eboy
ganR
iver
Gre
enB
ay/F
oxR
iver
Nia
gara
Riv
erM
enom
inee
Riv
er* O
scod
a *
* Wild
Ric
eLak
e *
* Litt
leTa
ilPt *
* Cap
eVin
cent
*To
rchL
ake
Man
istiq
ueR
iver
StLo
uisR
iver
AndB
ay* S
tock
tonI
s *
Dee
rLak
e* C
haum
ont *
* Sta
rLak
e *
* Gre
enM
nt *
StM
arys
Riv
er
Tree swallow eggs (n = 379)Geometric mean and 95% CI2010–2015
Area of Concern (AOC) and non-AOC locations (with asterisks)
Background (US and Canada =0.52 µg/g)
Tota
l p,p
’-DD
E (µ
g/g
wet
wt)
Mean separations, p <0.001
Hatching effectthreshold =>10 µg/g
Figure 6. Geometric means and 95% confidence intervals (CIs; vertical lines) for p,p0-dichlorodiphenyldichloroethylene (DDE) at Areas of Concern (AOCs)and nearby non-AOC locations, 2010 through 2015. Means linked by horizontal lines are not statistically different. Background [3,4,23–30] and lower limit forhatching effects [28] are shown.
3082 Environ Toxicol Chem 35, 2016 C.M. Custer et al.
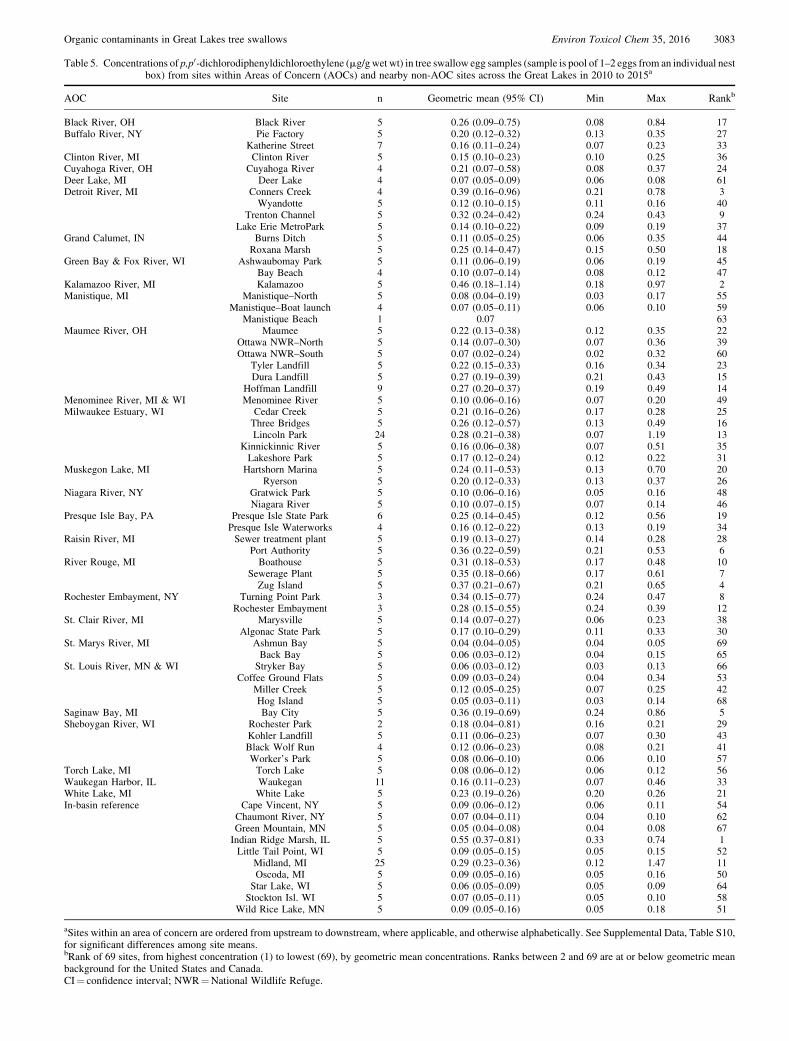
Table 5. Concentrations of p,p0-dichlorodiphenyldichloroethylene (mg/gwet wt) in tree swallow egg samples (sample is pool of 1–2 eggs from an individual nestbox) from sites within Areas of Concern (AOCs) and nearby non-AOC sites across the Great Lakes in 2010 to 2015a
AOC Site n Geometric mean (95% CI) Min Max Rankb
Black River, OH Black River 5 0.26 (0.09–0.75) 0.08 0.84 17Buffalo River, NY Pie Factory 5 0.20 (0.12–0.32) 0.13 0.35 27
Katherine Street 7 0.16 (0.11–0.24) 0.07 0.23 33Clinton River, MI Clinton River 5 0.15 (0.10–0.23) 0.10 0.25 36Cuyahoga River, OH Cuyahoga River 4 0.21 (0.07–0.58) 0.08 0.37 24Deer Lake, MI Deer Lake 4 0.07 (0.05–0.09) 0.06 0.08 61Detroit River, MI Conners Creek 4 0.39 (0.16–0.96) 0.21 0.78 3
Wyandotte 5 0.12 (0.10–0.15) 0.11 0.16 40Trenton Channel 5 0.32 (0.24–0.42) 0.24 0.43 9
Lake Erie MetroPark 5 0.14 (0.10–0.22) 0.09 0.19 37Grand Calumet, IN Burns Ditch 5 0.11 (0.05–0.25) 0.06 0.35 44
Roxana Marsh 5 0.25 (0.14–0.47) 0.15 0.50 18Green Bay & Fox River, WI Ashwaubomay Park 5 0.11 (0.06–0.19) 0.06 0.19 45
Bay Beach 4 0.10 (0.07–0.14) 0.08 0.12 47Kalamazoo River, MI Kalamazoo 5 0.46 (0.18–1.14) 0.18 0.97 2Manistique, MI Manistique–North 5 0.08 (0.04–0.19) 0.03 0.17 55
Manistique–Boat launch 4 0.07 (0.05–0.11) 0.06 0.10 59Manistique Beach 1 0.07 63
Maumee River, OH Maumee 5 0.22 (0.13–0.38) 0.12 0.35 22Ottawa NWR–North 5 0.14 (0.07–0.30) 0.07 0.36 39Ottawa NWR–South 5 0.07 (0.02–0.24) 0.02 0.32 60
Tyler Landfill 5 0.22 (0.15–0.33) 0.16 0.34 23Dura Landfill 5 0.27 (0.19–0.39) 0.21 0.43 15
Hoffman Landfill 9 0.27 (0.20–0.37) 0.19 0.49 14Menominee River, MI & WI Menominee River 5 0.10 (0.06–0.16) 0.07 0.20 49Milwaukee Estuary, WI Cedar Creek 5 0.21 (0.16–0.26) 0.17 0.28 25
Three Bridges 5 0.26 (0.12–0.57) 0.13 0.49 16Lincoln Park 24 0.28 (0.21–0.38) 0.07 1.19 13
Kinnickinnic River 5 0.16 (0.06–0.38) 0.07 0.51 35Lakeshore Park 5 0.17 (0.12–0.24) 0.12 0.22 31
Muskegon Lake, MI Hartshorn Marina 5 0.24 (0.11–0.53) 0.13 0.70 20Ryerson 5 0.20 (0.12–0.33) 0.13 0.37 26
Niagara River, NY Gratwick Park 5 0.10 (0.06–0.16) 0.05 0.16 48Niagara River 5 0.10 (0.07–0.15) 0.07 0.14 46
Presque Isle Bay, PA Presque Isle State Park 6 0.25 (0.14–0.45) 0.12 0.56 19Presque Isle Waterworks 4 0.16 (0.12–0.22) 0.13 0.19 34
Raisin River, MI Sewer treatment plant 5 0.19 (0.13–0.27) 0.14 0.28 28Port Authority 5 0.36 (0.22–0.59) 0.21 0.53 6
River Rouge, MI Boathouse 5 0.31 (0.18–0.53) 0.17 0.48 10Sewerage Plant 5 0.35 (0.18–0.66) 0.17 0.61 7Zug Island 5 0.37 (0.21–0.67) 0.21 0.65 4
Rochester Embayment, NY Turning Point Park 3 0.34 (0.15–0.77) 0.24 0.47 8Rochester Embayment 3 0.28 (0.15–0.55) 0.24 0.39 12
St. Clair River, MI Marysville 5 0.14 (0.07–0.27) 0.06 0.23 38Algonac State Park 5 0.17 (0.10–0.29) 0.11 0.33 30
St. Marys River, MI Ashmun Bay 5 0.04 (0.04–0.05) 0.04 0.05 69Back Bay 5 0.06 (0.03–0.12) 0.04 0.15 65
St. Louis River, MN & WI Stryker Bay 5 0.06 (0.03–0.12) 0.03 0.13 66Coffee Ground Flats 5 0.09 (0.03–0.24) 0.04 0.34 53
Miller Creek 5 0.12 (0.05–0.25) 0.07 0.25 42Hog Island 5 0.05 (0.03–0.11) 0.03 0.14 68
Saginaw Bay, MI Bay City 5 0.36 (0.19–0.69) 0.24 0.86 5Sheboygan River, WI Rochester Park 2 0.18 (0.04–0.81) 0.16 0.21 29
Kohler Landfill 5 0.11 (0.06–0.23) 0.07 0.30 43Black Wolf Run 4 0.12 (0.06–0.23) 0.08 0.21 41Worker’s Park 5 0.08 (0.06–0.10) 0.06 0.10 57
Torch Lake, MI Torch Lake 5 0.08 (0.06–0.12) 0.06 0.12 56Waukegan Harbor, IL Waukegan 11 0.16 (0.11–0.23) 0.07 0.46 33White Lake, MI White Lake 5 0.23 (0.19–0.26) 0.20 0.26 21In-basin reference Cape Vincent, NY 5 0.09 (0.06–0.12) 0.06 0.11 54
Chaumont River, NY 5 0.07 (0.04–0.11) 0.04 0.10 62Green Mountain, MN 5 0.05 (0.04–0.08) 0.04 0.08 67Indian Ridge Marsh, IL 5 0.55 (0.37–0.81) 0.33 0.74 1Little Tail Point, WI 5 0.09 (0.05–0.15) 0.05 0.15 52
Midland, MI 25 0.29 (0.23–0.36) 0.12 1.47 11Oscoda, MI 5 0.09 (0.05–0.16) 0.05 0.16 50
Star Lake, WI 5 0.06 (0.05–0.09) 0.05 0.09 64Stockton Isl. WI 5 0.07 (0.05–0.11) 0.05 0.10 58
Wild Rice Lake, MN 5 0.09 (0.05–0.16) 0.05 0.18 51
aSites within an area of concern are ordered from upstream to downstream, where applicable, and otherwise alphabetically. See Supplemental Data, Table S10,for significant differences among site means.bRank of 69 sites, from highest concentration (1) to lowest (69), by geometric mean concentrations. Ranks between 2 and 69 are at or below geometric meanbackground for the United States and Canada.CI¼ confidence interval; NWR¼National Wildlife Refuge.
Organic contaminants in Great Lakes tree swallows Environ Toxicol Chem 35, 2016 3083
collected in the present study. In contrast to Green Bay,Sheboygan, and Kalamazoo, concentrations of PCBs in treeswallow eggs at these 2 Saginaw River drainage locationshave not changed in the intervening 20 yr. At the mouth of theSaginaw River, total PCBs were 1.37mg/g wet weight in 1991compared with 1.88mg/g (1.08–3.28mg/g) in the present study.At the upstream site, total PCBs were 0.84mg/g wet weight inthe early 1990s compared with 0.68mg/g (0.58–0.79) in thepresent study. The relatively low concentration in 1991, whichwas near background exposure at the upstream site, perhapsallowed little room for significant diminution of exposure.
There are 2 well-known hot spots of PCB contamination: theHousatonic River in Massachusetts and the Hudson River inNew York. The geometric mean concentrations of total PCBs ineggs along the Housatonic River ranged between 31.5mg/g and101mg/g wet weight [3], which is considerably higher thanexposure at Waukegan Harbor (7.30mg/g wet wt). Exposurelevels at Waukegan Harbor were similar to exposure on theupper HudsonRiver, NewYork (6.77mg/gwet wt [12]), in 2004but less than the exposure there in 1995 (13–24mg/g [37]).
Reproductive effects of PCBs have beenwell studied in birdsincluding tree swallows (see review in Custer [7]). Geometricmean concentrations of PCBs at all AOCs studied, except forWaukegan Harbor, were �10 times less than the lower limitat which reproductive effects begin (20mg/g wet wt [3] and27mg/g wet wt, developed by Neigh et al. [30]). Only 2 eggsamples, both from Waukegan Harbor, exceeded the 20mg/gthreshold. Other sites that had individual egg concentrationsexceeding 5mg/g were the mid-reach segment of the Fox River(6.19mg/g [Ashwaubomay Park]) and egg samples at 3 of the4 sites in the Sheboygan River AOC (6.72mg/g [RochesterPark], 7.59mg/g [Workers Park], and 13.4mg/g [Black WolfRun]). Although this level of exposure is not expected toresult in reproductive impairment, it does indicate that thereare pockets of PCB contamination in the sediment that arebioavailable. These elevated exposures were not widespread ata site, indicating the patchiness of the contaminated deposits.For example, on the Sheboygan River, only 1 of 2, 1 of 4, and3 of 10 egg samples exceeded 5mg/g at Rochester Park, BlackWolf Run, and Workers Park, respectively. On the reverse side,however, only 3 of 26 samples from all 4 sites sampled on theSheboygan River were at background levels.
PCDD-F and PCDD-F TEQs. Dioxins and furans are arelatively little-studied class of chemicals despite their knownhigh toxicity; analytical costs and early difficulties withanalytical chemistry methods contributed to this lack ofknowledge. Because of fewer published studies, there is lesscertainty around background concentrations on both a total anda TEQ basis (167 pg/g total PCDD-Fs [3,4] and 87 pg/g TEQs[3,4]) as well as uncertainty in the lower limit for reproductiveimpairment (477 pg/g total PCDD-Fs [4,34] and 181 pg/g TEQs[5]). This uncertainty should be kept in mind when using thesedata. Dioxin and furan sources are varied and include chemical/industrial sources because they are a contaminant in chloro-phenoxy herbicides (i.e., Agents Orange and Purple) and aby-product from chloralkali plants; they are also present insome PCB formulations and in chlorinated phenols [38,39].Thermal sources include municipal incinerators, recyclingplants, backyard burn barrels, and iron-ore processing [38],all of which involve high-temperature combustion.
Geometric mean concentrations at Midland (a non-AOCsite) and Bay City exceeded background exposure for PCDD-FTEQs. Cuyahoga River, Black River, and Lower Green Bay FoxRiver exceeded background as well for total PCDD-Fs but not
for PCDD-F TEQs. Both Midland and Bay City sites were at, ordownstream of, a US production plant for Agent Orange, anherbicide contaminated with dioxins and furans. Geometricmean concentrations in tree swallow eggs at Midland (475 pg/gTEQs, maximum value¼ 1061 pg/g) were qualitatively higherin the present study than exposure quantified in 2005 through2007 at the same site (280 pg/g TEQs [40]); the 95% CIsoverlapped, however, which indicates no significant differencebetween the 2 time frames. Egg concentrations at Bay City,located approximately 60 km downstream from Midland, werestill elevated above background and averaged 242 pg/g PCDD-FTEQs (maximum value¼ 676 pg/g) in the present study. Again,the geometric mean in the present study was higher than the100 pg/g found in that same general area in the earlierstudy [40]; but with overlapping CIs, the difference betweenthe 2 time periods is not significant.
Exposures to PCDD-F TEQs at Midland were only slightlylower than those at the most contaminated site known fortree swallows in North America, which is a location in RhodeIsland along the Woonasquatucket River [4]. That is a rivercontaminated primarily with 2,3,7,8-TCDD from a hexachloro-phene manufacturing plant. Geometric mean tree swallow eggconcentrations along the Woonasquatucket River were between503 pg/g and 1126 pg/g PCDD-F TEQs [4]. Other sites in thepresent study with maximum exposure in eggs above 100 pg/gwere all industrial sites (Cuyahoga River, maximum value¼303 pg/g; Black River, maximum value¼ 149 pg/g; WaukeganHarbor, maximum value¼ 142 pg/g; and Kalamazoo River,maximum value¼ 124 pg/g). Comparisons to other earlier treeswallow studies that report PCDD-F in swallow eggs are notpossible because all congeners were not analyzed or reportedin those studies.
Geometric mean concentrations of PCDD-F TEQs at bothMidland and Bay City in the present study were above the181 pg/g lower limit for reproductive effect threshold estab-lished by Fredricks et al. [5]. Reproductive impairment wasalso documented along the Woonasquatucket River [4] atsimilar exposure to PCDD-Fs as was documented in theSaginaw River basin in that earlier study [5]. Reproductivesuccess as it relates to contaminant exposure in the present studywill be presented elsewhere.
Tree swallows are a particularly good model species toassess exposure to PCDD-Fs compared with piscivorouswaterbirds. It has been well documented that swallowsaccumulate more total PCDD-Fs and PCDD-F TEQs thanpiscivorous birds in the same area [12,13]. In lower Green Bay,tree swallow eggs had between nearly 2 and 4 times more totalPCDD-Fs than did the eggs of piscivorous waterbirds, such asdouble-crested cormorants (Phalacrocorax auritus), herringgulls, and black-crowned night herons (Nycticorax nycticorax)[13]. Along the Hudson River in New York, tree swallowshad more than twice as much PCDD-F as did belted kingfishers(Ceryle alcyon) and spotted sandpipers (Actitus macularia)[12] nesting in the same area. This probably results becausePCDD-Fs are not “processed” by the insects, which theswallows consume, to the same degree that they are “processed”by fish (i.e., metabolized or otherwise not continuallyaccumulated) [41,42]. The bioavailabilities of PCDD-Fs,therefore, are more accurately accessed in swallows than inpiscivorous waterbirds.
PBDEs. This class of chemicals was not considered duringthe AOC designation process. Beginning in the 1980s, PBDEswere used as flame retardants; but after dramatic increasesin bird eggs in the 1990s, some formulations were banned
3084 Environ Toxicol Chem 35, 2016 C.M. Custer et al.
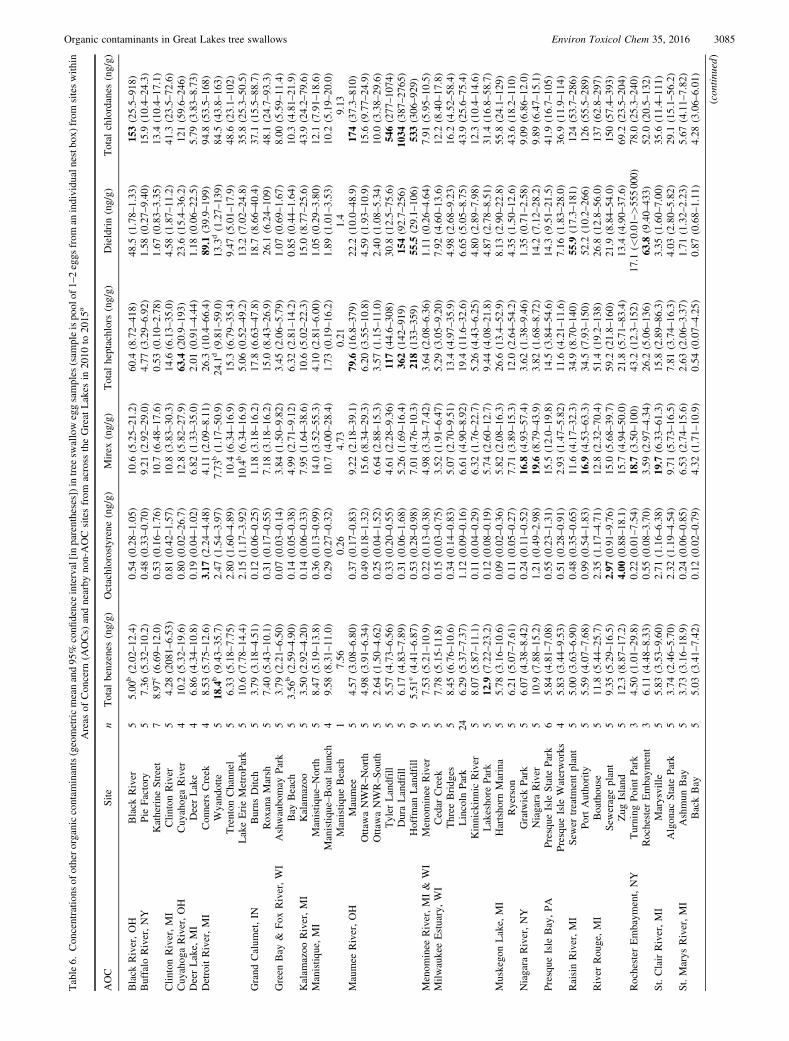
Table6.
Concentratio
nsof
othero
rganiccontam
inants(geometricmeanand95%
confi
denceinterval[inparentheses])intree
swalloweggsamples
(sam
pleispoolof
1–2eggs
from
anindividualnestbox)
from
siteswith
inAreas
ofConcern
(AOCs)
andnearby
non-AOCsitesfrom
across
theGreat
Lakes
in2010
to2015
a
AOC
Site
nTotal
benzenes
(ng/g)
Octachlorostyrene
(ng/g)
Mirex
(ng/g)
Total
heptachlors(ng/g)
Dieldrin(ng/g)
Total
chlordanes
(ng/g)
Black
River,OH
Black
River
55.00
b(2.02–
12.4)
0.54
(0.28–1.05)
10.6
(5.25–
21.2)
60.4
(8.72–418)
48.5
(1.78–
1.33)
153(25.5–918)
Buffalo
River,NY
PieFactory
57.36
(5.32–
10.2)
0.48
(0.33–0.70)
9.21
(2.92–
29.0)
4.77
(3.29–6.92)
1.58
(0.27–
9.40)
15.9
(10.4–24.3)
Katherine
Street
78.97
c(6.69–
12.0)
0.53
(0.16–1.76)
10.7
(6.48–
17.6)
0.53
(0.10–2.78)
1.67
(0.83–
3.35)
13.4
(10.4–17.1)
Clin
tonRiver,MI
Clin
tonRiver
54.28
(2081–
6.53)
0.81
(0.42–1.57)
10.8
(3.83–
30.3)
14.6
(6.13–35.0)
4.58
(1.87–
11.2)
41.3
(23.5–72.6)
CuyahogaRiver,OH
CuyahogaRiver
410.2
(5.32–
19.6)
0.80
(0.02–26.7)
12.8
(5.82–
27.9)
63.4
(20.9–193)
23.6
(15.4–
36.2)
121(59.6–246)
DeerLake,
MI
DeerLake
46.86
(4.34–
10.8)
0.19
(0.04–1.02)
6.82
(1.33–
35.0)
2.01
(0.91–4.44)
1.18
(0.06–
22.5)
5.79
(3.83–8.73)
DetroitRiver,MI
Conners
Creek
48.53
(5.75–
12.6)
3.17
(2.24–4.48)
4.11
(2.09–
8.11)
26.3
(10.4–66.4)
89.1
(39.9–
199)
94.8
(53.5–168)
Wyandotte
518.4b(9.43–
35.7)
2.47
(1.54–3.97)
7.73
b(1.17–
50.9)
24.1
d(9.81–59.0)
13.3
d(1.27–
139)
84.5
(43.8–163)
Trenton
Channel
56.33
(5.18–
7.75)
2.80
(1.60–4.89)
10.4
(6.34–
16.9)
15.3
(6.79–35.4)
9.47
(5.01–
17.9)
48.6
(23.1–102)
LakeErieMetroPark
510.6
(7.78–
14.4)
2.15
(1.17–3.92)
10.4b(6.34–
16.9)
5.06
(0.52–49.2)
13.2
(7.02–
24.8)
35.8
(25.3–50.5)
Grand
Calum
et,IN
Burns
Ditch
53.79
(3.18–
4.51)
0.12
(0.06–0.25)
1.18
(3.18–
16.2)
17.8
(6.63–47.8)
18.7
(8.66–
40.4)
37.1
(15.5–88.7)
RoxanaMarsh
57.40
(5.43–
10.1)
0.31
(0.17–0.55)
7.18
(3.18–
16.2)
15.0
(8.43–26.9)
26.1
(6.24–
109)
48.1
(24.7–93.3)
Green
Bay
&Fo
xRiver,WI
Ashwaubomay
Park
53.79
(2.21–
6.50)
0.07
(0.03–0.14)
3.84
(1.50–
9.82)
3.45
(2.06–5.79)
1.07
(0.69–
1.67)
8.00
(5.59–11.4)
Bay
Beach
53.56
b(2.59–
4.90)
0.14
(0.05–0.38)
4.99
(2.71–
9.12)
6.32
(2.81–14.2)
0.85
(0.44–
1.64)
10.3
(4.81–21.9)
Kalam
azoo
River,MI
Kalam
azoo
53.50
(2.92–
4.20)
0.14
(0.06–0.33)
7.95
(1.64–
38.6)
10.6
(5.02–22.3)
15.0
(8.77–
25.6)
43.9
(24.2–79.6)
Manistiq
ue,MI
Manistiq
ue–North
58.47
(5.19–
13.8)
0.36
(0.13–0.99)
14.0
(3.52–
55.3)
4.10
(2.81–6.00)
1.05
(0.29–
3.80)
12.1
(7.91–18.6)
Manistiq
ue–Boatlaunch
49.58
(8.31–
11.0)
0.29
(0.27–0.32)
10.7
(4.00–
28.4)
1.73
(0.19–16.2)
1.89
(1.01–
3.53)
10.2
(5.19–20.0)
Manistiq
ueBeach
17.56
0.26
4.73
0.21
1.4
9.13
Maumee
River,OH
Maumee
54.57
(3.08–
6.80)
0.37
(0.17–0.83)
9.22
(2.18–
39.1)
79.6
(16.8–379)
22.2
(10.0–
48.9)
174(37.3–810)
OttawaNWR–North
54.98
(3.91–
6.34)
0.49
(0.18–1.32)
15.6
(8.34–
29.3)
6.20
(3.55–10.8)
4.59
(1.93–
10.9)
15.6
(9.77–24.9)
OttawaNWR–So
uth
52.64
(1.50–
4.62)
0.25
(0.04–1.52)
6.64
(2.88–
15.3)
3.57
(1.15–11.0)
2.40
(1.08–
5.34)
10.0
(3.38–29.6)
Tyler
Landfill
55.57
(4.73–
6.56)
0.33
(0.20–0.55)
4.61
(2.28–
9.36)
117(44.6–308)
30.8
(12.5–
75.6)
546(277–1074)
DuraLandfill
56.17
(4.83–
7.89)
0.31
(0.06–1.68)
5.26
(1.69–
16.4)
362(142
–919)
154(92.7–
256)
1034
(387–2765)
Hoffm
anLandfill
95.51
e(4.41–
6.87)
0.53
(0.28–0.98)
7.01
(4.76–
10.3)
218(133
–359)
55.5
(29.1–
106)
533(306–929)
Menom
inee
River,MI&
WI
Menom
inee
River
57.53
(5.21–
10.9)
0.22
(0.13–0.38)
4.98
(3.34–
7.42)
3.64
(2.08–6.36)
1.11
(0.26–
4.64)
7.91
(5.95–10.5)
Milw
aukeeEstuary,WI
Cedar
Creek
57.78
(5.15-11.8)
0.15
(0.03–0.75)
3.52
(1.91–
6.47)
5.29
(3.05–9.20)
7.92
(4.60–
13.6)
12.2
(8.40–17.8)
Three
Bridges
58.45
(6.76–
10.6)
0.34
(0.14–0.83)
5.07
(2.70–
9.51)
13.4
(4.97–35.9)
4.98
(2.68–
9.23)
16.2
(4.52–58.4)
Lincoln
Park
246.29
(5.37–
7.37)
1.12
(0.09–0.16)
6.61
(4.90–
8.92)
19.4
(11.6–32.6)
6.65
(5.05–
8.75)
43.9
(25.6–75.4)
KinnickinnicRiver
58.07
(5.87–
11.1)
0.11
(0.04–0.29)
6.32
(1.76–
22.7)
5.26
(4.43–6.25)
4.80
(2.89–
7.98)
12.3
(10.4–14.6)
Lakeshore
Park
512.9
(7.22–
23.2)
0.12
(0.08–0.19)
5.74
(2.60–
12.7)
9.44
(4.08–21.8)
4.87
(2.78–
8.51)
31.4
(16.8–58.7)
MuskegonLake,
MI
Hartshorn
Marina
55.78
(3.16–
10.6)
0.09
(0.02–0.36)
5.82
(2.08–
16.3)
26.6
(13.4–52.9)
8.13
(2.90–
22.8)
55.8
(24.1–129)
Ryerson
56.21
(5.07–
7.61)
0.11
(0.05–0.27)
7.71
(3.89–
15.3)
12.0
(2.64–54.2)
4.35
(1.50–
12.6)
43.6
(18.2–110)
Niagara
River,NY
GratwickPark
56.07
(4.38–
8.42)
0.24
(0.11–0.52)
16.8
(4.93–
57.4)
3.62
(1.38–9.46)
1.35
(0.71–
2.58)
9.09
(6.86–12.0)
Niagara
River
510.9
(7.88–
15.2)
1.21
(0.49–2.98)
19.6
(8.79–
43.9)
3.82
(1.68–8.72)
14.2
(7.12–
28.2)
9.89
(6.47–15.1)
PresqueIsle
Bay,PA
PresqueIsle
StatePark
65.84
(4.81–
7.08)
0.55
(0.23–1.31)
15.5
(12.0–
19.8)
14.5
(3.84–54.6)
14.3
(9.51–
21.5)
41.9
(16.7–105)
PresqueIsle
Waterworks
45.83
(3.44–
9.53)
0.51
(0.28–0.91)
2.93
(1.47–
5.82)
11.6
(4.21–11.6)
7.16
(1.83–
28.0)
36.9
(11.9–114)
RaisinRiver,MI
Sewer
treatm
entplant
55.00
(3.63–
6.90)
0.48
(0.35–0.65)
11.6
(4.17–
32.3)
34.9
(8.70–140)
55.9
(17.3–
181)
124(53.7–286)
PortAuthority
55.59
(4.07–
7.68)
0.99
(0.54–1.83)
16.9
(4.53–
63.3)
34.5
(7.93–150)
52.2
(10.2–
266)
126(55.5–289)
River
Rouge,MI
Boathouse
511.8
(5.44–
25.7)
2.35
(1.17–4.71)
12.8
(2.32–
70.4)
51.4
(19.2–138)
26.8
(12.8–
56.0)
137(62.8–297)
Sewerageplant
59.35
(5.29–
16.5)
2.97
(0.91–9.76)
15.0
(5.68–
39.7)
59.2
(21.8–160)
21.9
(8.84–
54.0)
150(57.4–393)
Zug
Island
512.3
(8.87–
17.2)
4.00
(0.88–18.1)
15.7
(4.94–
50.0)
21.8
(5.71–83.4)
13.4
(4.90–
37.6)
69.2
(23.5–204)
Rochester
Embaym
ent,NY
Turning
PointPark
34.50
(1.01–
29.8)
0.22
(0.01–7.54)
18.7
(3.50–
100)
43.2
(12.3–152)
17.1
(<0.01
–>555000)
78.0
(25.3–240)
Rochester
Embaym
ent
36.11
(4.48–
8.33)
0.55
(0.08–3.70)
3.59
(2.97–
4.34)
26.2
(5.06–136)
63.8
(9.40–
433)
52.0
(20.5–132)
St.ClairRiver,MI
Marysville
55.83
(3.53–
9.60)
2.71
(1.16–6.38)
19.7
(6.33–
61.3)
15.8
(2.89–86.3)
3.35
(1.60–
7.00)
35.6
(11.4–111)
Algonac
StatePark
53.74
(2.46–
5.70)
2.32
(1.19 –4.54)
9.71
(5.73–
16.5)
7.81
(3.74–16.3)
4.03
(2.80–
5.82)
29.1
(15.1–56.2)
St.Marys
River,MI
Ashmun
Bay
53.73
(3.16–
18.9)
0.24
(0.06–0.85)
6.53
(2.74–
15.6)
2.63
(2.06–3.37)
1.71
(1.32–
2.23)
5.67
(4.11–7.82)
BackBay
55.03
(3.41–
7.42)
0.12
(0.02–0.79)
4.32
(1.71–
10.9)
0.54
(0.07–4.25)
0.87
(0.68–
1.11)
4.28
(3.06–6.01)
(continued)
Organic contaminants in Great Lakes tree swallows Environ Toxicol Chem 35, 2016 3085
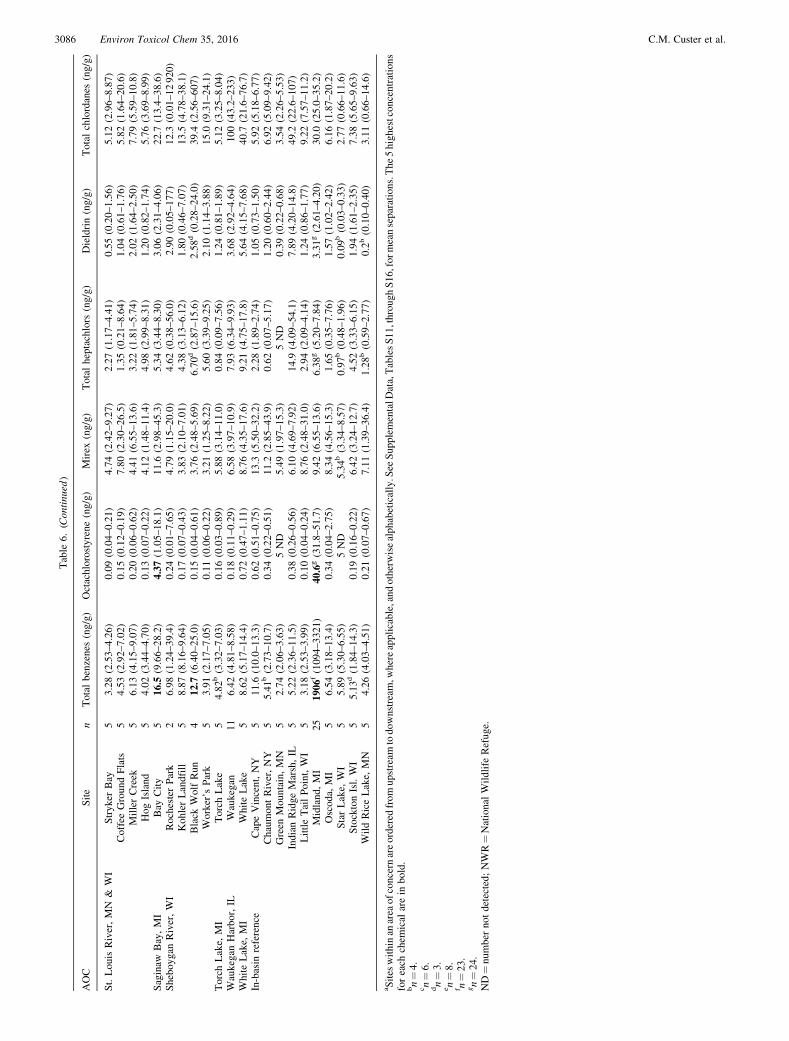
Table
6.(Continued
)
AOC
Site
nTotal
benzenes
(ng/g)
Octachlorostyrene
(ng/g)
Mirex
(ng/g)
Total
heptachlors(ng/g)
Dieldrin(ng/g)
Total
chlordanes
(ng/g)
St.Louis
River,MN
&WI
StrykerBay
53.28
(2.53–
4.26)
0.09
(0.04–0.21)
4.74
(2.42–
9.27)
2.27
(1.17–4.41)
0.55
(0.20–
1.56)
5.12
(2.96–8.87)
CoffeeGroundFlats
54.53
(2.92–
7.02)
0.15
(0.12–0.19)
7.80
(2.30–
26.5)
1.35
(0.21–8.64)
1.04
(0.61–
1.76)
5.82
(1.64–20.6)
Miller
Creek
56.13
(4.15–
9.07)
0.20
(0.06–0.62)
4.41
(6.55–
13.6)
3.22
(1.81–5.74)
2.02
(1.64–
2.50)
7.79
(5.59–10.8)
Hog
Island
54.02
(3.44–
4.70)
0.13
(0.07–0.22)
4.12
(1.48–
11.4)
4.98
(2.99–8.31)
1.20
(0.82–
1.74)
5.76
(3.69–8.99)
Saginaw
Bay,MI
Bay
City
516.5
(9.66–
28.2)
4.37
(1.05–18.1)
11.6
(2.98–
45.3)
5.34
(3.44–8.30)
3.06
(2.31–
4.06)
22.7
(13.4–38.6)
SheboyganRiver,WI
Rochester
Park
26.98
(1.24–
39.4)
0.24
(0.01–7.65)
4.79
(1.15–
20.0)
4.62
(0.38–56.0)
2.90
(0.05–
177)
12.3
(0.01–12
920)
KohlerLandfill
58.87
(8.16–
9.64)
0.17
(0.07–0.43)
3.83
(2.10–
7.01)
4.38
(3.13–6.12)
1.80
(0.46–
7.07)
13.5
(4.78–38.1)
Black
WolfRun
412.7
(6.40–
25.0)
0.15
(0.04–0.61)
3.76
(2.48–
5.69)
6.70
d(2.87–15.6)
2.58
d(0.28–24.0)
39.4
(2.56–607)
Worker’sPark
53.91
(2.17–
7.05)
0.11
(0.06–0.22)
3.21
(1.25–
8.22)
5.60
(3.39–9.25)
2.10
(1.14–
3.88)
15.0
(9.31–24.1)
Torch
Lake,
MI
Torch
Lake
54.82
b(3.32–
7.03)
0.16
(0.03–0.89)
5.88
(3.14–
11.0)
0.84
(0.09–7.56)
1.24
(0.81–
1.89)
5.12
(3.25–8.04)
WaukeganHarbor,IL
Waukegan
116.42
(4.81–
8.58)
0.18
(0.11–0.29)
6.58
(3.97–
10.9)
7.93
(6.34–9.93)
3.68
(2.92–
4.64)
100(43.2–233)
White
Lake,
MI
White
Lake
58.62
(5.17–
14.4)
0.72
(0.47–1.11)
8.76
(4.35–
17.6)
9.21
(4.75–17.8)
5.64
(4.15–
7.68)
40.7
(21.6–76.7)
In-basin
reference
CapeVincent,NY
511.6
(10.0–
13.3)
0.62
(0.51–0.75)
13.3
(5.50–
32.2)
2.28
(1.89–2.74)
1.05
(0.73–
1.50)
5.92
(5.18–6.77)
Chaum
ontRiver,NY
55.41
b(2.73–
10.7)
0.34
(0.22–0.51)
11.2
(2.85–
43.9)
0.62
(0.07–5.17)
1.20
(0.60–
2.44)
6.92
(5.09–9.42)
Green
Mountain,
MN
52.74
(2.06–
3.63)
5ND
5.49
(1.97–
15.3)
5ND
0.39
(0.22–
0.68)
3.54
(2.26–5.53)
Indian
Ridge
Marsh,IL
55.22
(2.36–
11.5)
0.38
(0.26–0.56)
6.10
(4.69–
7.92)
14.9
(4.09–54.1)
7.89
(4.20–
14.8)
49.2
(22.6–107)
Little
TailPo
int,WI
53.18
(2.53–
3.99)
0.10
(0.04–0.24)
8.76
(2.48–
31.0)
2.94
(2.09–4.14)
1.24
(0.86–
1.77)
9.22
(7.57–11.2)
Midland,MI
251906
f(1094–
3321)
40.6
g(31.8–51.7)
9.42
(6.55–
13.6)
6.38
g(5.20–7.84)
3.31
g(2.61–4.20)
30.0
(25.0–35.2)
Oscoda,
MI
56.54
(3.18–
13.4)
0.34
(0.04–2.75)
8.34
(4.56–
15.3)
1.65
(0.35–7.76)
1.57
(1.02–
2.42)
6.16
(1.87–20.2)
Star
Lake,
WI
55.89
(5.30–
6.55)
5ND
5.34
b(3.34–
8.57)
0.97
b(0.48–1.96)
0.09
b(0.03–0.33)
2.77
(0.66–11.6)
Stockton
Isl.WI
55.13
d(1.84–
14.3)
0.19
(0.16–0.22)
6.42
(3.24–
12.7)
4.52
(3.33–6.15)
1.94
(1.61–
2.35)
7.38
(5.65–9.63)
Wild
RiceLake,
MN
54.26
(4.03–
4.51)
0.21
(0.07–0.67)
7.11
(1.39–
36.4)
1.28
b(0.59–2.77)
0.2b
(0.10–0.40)
3.11
(0.66–14.6)
a Siteswith
inan
area
ofconcernareorderedfrom
upstream
todownstream,w
hereapplicable,and
otherw
isealphabetically.See
SupplementalD
ata,TablesS1
1,throughS1
6,form
eanseparatio
ns.T
he5highestconcentratio
nsforeach
chem
ical
arein
bold.
bn¼4.
c n¼6.
dn¼3.
e n¼8.
f n¼23.
gn¼24.
ND¼numbernotdetected;NWR¼NationalWild
lifeRefuge.
3086 Environ Toxicol Chem 35, 2016 C.M. Custer et al.
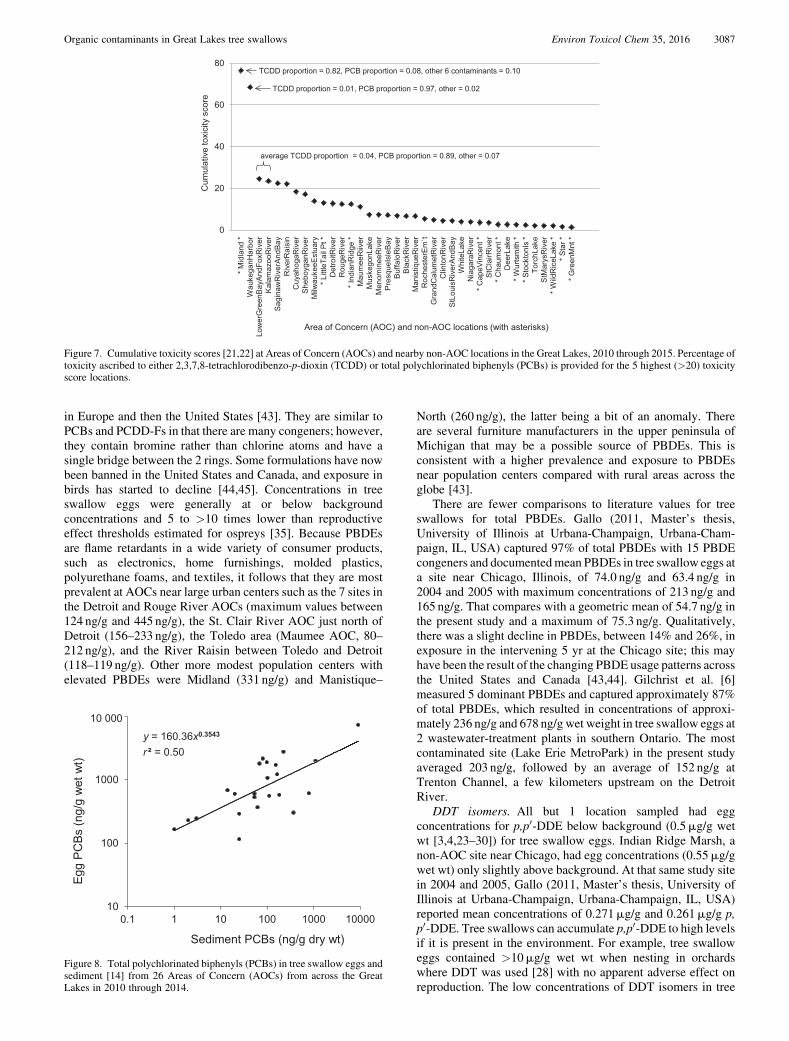
in Europe and then the United States [43]. They are similar toPCBs and PCDD-Fs in that there are many congeners; however,they contain bromine rather than chlorine atoms and have asingle bridge between the 2 rings. Some formulations have nowbeen banned in the United States and Canada, and exposure inbirds has started to decline [44,45]. Concentrations in treeswallow eggs were generally at or below backgroundconcentrations and 5 to >10 times lower than reproductiveeffect thresholds estimated for ospreys [35]. Because PBDEsare flame retardants in a wide variety of consumer products,such as electronics, home furnishings, molded plastics,polyurethane foams, and textiles, it follows that they are mostprevalent at AOCs near large urban centers such as the 7 sites inthe Detroit and Rouge River AOCs (maximum values between124 ng/g and 445 ng/g), the St. Clair River AOC just north ofDetroit (156–233 ng/g), the Toledo area (Maumee AOC, 80–212 ng/g), and the River Raisin between Toledo and Detroit(118–119 ng/g). Other more modest population centers withelevated PBDEs were Midland (331 ng/g) and Manistique–
North (260 ng/g), the latter being a bit of an anomaly. Thereare several furniture manufacturers in the upper peninsula ofMichigan that may be a possible source of PBDEs. This isconsistent with a higher prevalence and exposure to PBDEsnear population centers compared with rural areas across theglobe [43].
There are fewer comparisons to literature values for treeswallows for total PBDEs. Gallo (2011, Master’s thesis,University of Illinois at Urbana-Champaign, Urbana-Cham-paign, IL, USA) captured 97% of total PBDEs with 15 PBDEcongeners and documentedmean PBDEs in tree swallow eggs ata site near Chicago, Illinois, of 74.0 ng/g and 63.4 ng/g in2004 and 2005 with maximum concentrations of 213 ng/g and165 ng/g. That compares with a geometric mean of 54.7 ng/g inthe present study and a maximum of 75.3 ng/g. Qualitatively,there was a slight decline in PBDEs, between 14% and 26%, inexposure in the intervening 5 yr at the Chicago site; this mayhave been the result of the changing PBDE usage patterns acrossthe United States and Canada [43,44]. Gilchrist et al. [6]measured 5 dominant PBDEs and captured approximately 87%of total PBDEs, which resulted in concentrations of approxi-mately 236 ng/g and 678 ng/g wet weight in tree swallow eggs at2 wastewater-treatment plants in southern Ontario. The mostcontaminated site (Lake Erie MetroPark) in the present studyaveraged 203 ng/g, followed by an average of 152 ng/g atTrenton Channel, a few kilometers upstream on the DetroitRiver.
DDT isomers. All but 1 location sampled had eggconcentrations for p,p0-DDE below background (0.5mg/g wetwt [3,4,23–30]) for tree swallow eggs. Indian Ridge Marsh, anon-AOC site near Chicago, had egg concentrations (0.55mg/gwet wt) only slightly above background. At that same study sitein 2004 and 2005, Gallo (2011, Master’s thesis, University ofIllinois at Urbana-Champaign, Urbana-Champaign, IL, USA)reported mean concentrations of 0.271mg/g and 0.261mg/g p,p0-DDE. Tree swallows can accumulate p,p0-DDE to high levelsif it is present in the environment. For example, tree swalloweggs contained >10mg/g wet wt when nesting in orchardswhere DDT was used [28] with no apparent adverse effect onreproduction. The low concentrations of DDT isomers in tree
0
20
40
60
80
Cum
ulat
ive
toxi
city
sco
re
Area of Concern (AOC) and non-AOC locations (with asterisks)
TCDD proportion = 0.82, PCB proportion = 0.08, other 6 contaminants = 0.10
TCDD proportion = 0.01, PCB proportion = 0.97, other = 0.02
average TCDD proportion = 0.04, PCB proportion = 0.89, other = 0.07
* Mid
land
*W
auke
ganH
arbo
rLo
wer
Gre
enB
ayA
ndFo
xRiv
erK
alam
azoo
Riv
erS
agin
awR
iver
And
Bay
Riv
erR
aisi
nC
uyah
ogaR
iver
She
boyg
anR
iver
Milw
auke
eEst
uary
*Litt
leTa
ilP
t *D
etro
itRiv
erR
ouge
Riv
er*I
ndia
nRid
ge*
Mau
mee
Riiv
erM
uske
gonL
ake
Men
omin
eeR
iver
Pre
sque
Isle
Bay
Buf
falo
Riv
erB
lack
Riv
erM
anis
tique
Riv
erR
oche
ster
Em
`tG
rand
Cal
umet
Riv
erC
linto
nRiv
erS
tLou
isR
iver
And
Bay
Whi
teLa
keN
iaga
raR
iver
*Cap
eVin
cent
*S
tCla
irRiv
er* C
haum
ont *
Dee
rLak
e*W
urts
mith
**S
tock
tonI
s*
Torc
hLak
eS
tMar
ysR
iver
*Wild
Ric
eLak
e*
* Sta
r **G
reen
Mnt
*
Figure 7. Cumulative toxicity scores [21,22] at Areas of Concern (AOCs) and nearby non-AOC locations in the Great Lakes, 2010 through 2015. Percentage oftoxicity ascribed to either 2,3,7,8-tetrachlorodibenzo-p-dioxin (TCDD) or total polychlorinated biphenyls (PCBs) is provided for the 5 highest (>20) toxicityscore locations.
y = 160.36x0.3543
10
100
1000
0.1 1 10 100 1000 10000
r ² = 0.50
Sediment PCBs (ng/g dry wt)
Egg
PC
Bs
(ng/
g w
et w
t)
10 000
Figure 8. Total polychlorinated biphenyls (PCBs) in tree swallow eggs andsediment [14] from 26 Areas of Concern (AOCs) from across the GreatLakes in 2010 through 2014.
Organic contaminants in Great Lakes tree swallows Environ Toxicol Chem 35, 2016 3087
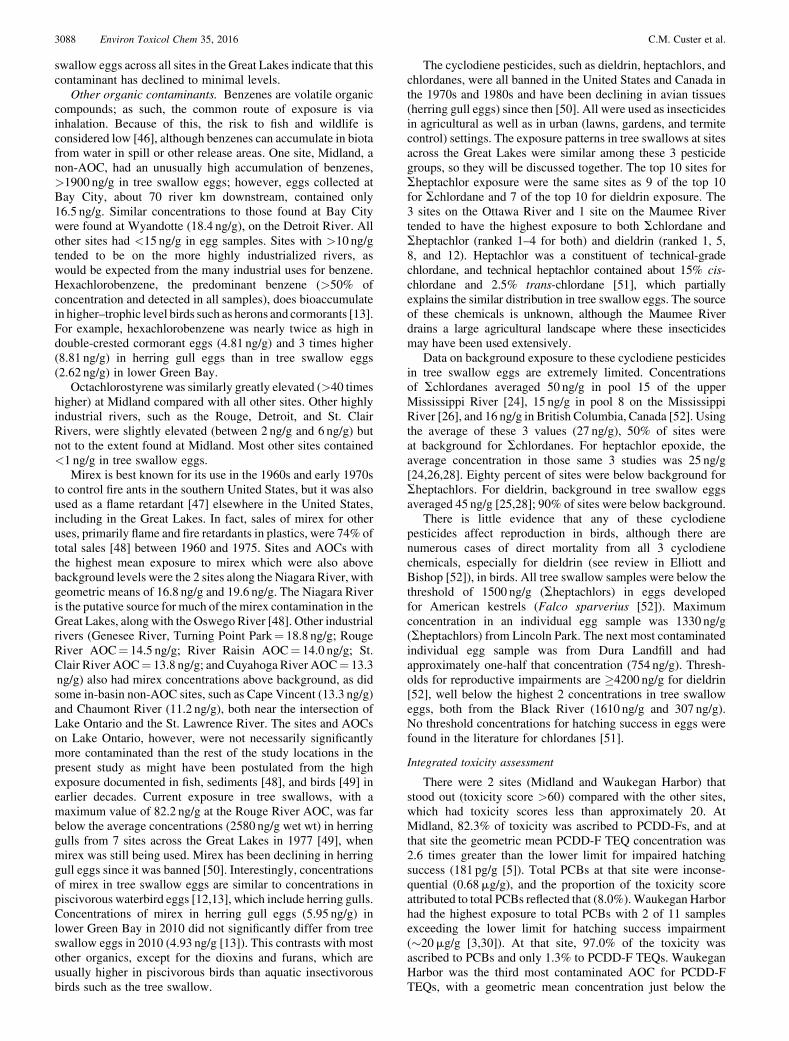
swallow eggs across all sites in the Great Lakes indicate that thiscontaminant has declined to minimal levels.
Other organic contaminants. Benzenes are volatile organiccompounds; as such, the common route of exposure is viainhalation. Because of this, the risk to fish and wildlife isconsidered low [46], although benzenes can accumulate in biotafrom water in spill or other release areas. One site, Midland, anon-AOC, had an unusually high accumulation of benzenes,>1900 ng/g in tree swallow eggs; however, eggs collected atBay City, about 70 river km downstream, contained only16.5 ng/g. Similar concentrations to those found at Bay Citywere found at Wyandotte (18.4 ng/g), on the Detroit River. Allother sites had <15 ng/g in egg samples. Sites with >10 ng/gtended to be on the more highly industrialized rivers, aswould be expected from the many industrial uses for benzene.Hexachlorobenzene, the predominant benzene (>50% ofconcentration and detected in all samples), does bioaccumulatein higher–trophic level birds such as herons and cormorants [13].For example, hexachlorobenzene was nearly twice as high indouble-crested cormorant eggs (4.81 ng/g) and 3 times higher(8.81 ng/g) in herring gull eggs than in tree swallow eggs(2.62 ng/g) in lower Green Bay.
Octachlorostyrene was similarly greatly elevated (>40 timeshigher) at Midland compared with all other sites. Other highlyindustrial rivers, such as the Rouge, Detroit, and St. ClairRivers, were slightly elevated (between 2 ng/g and 6 ng/g) butnot to the extent found at Midland. Most other sites contained<1 ng/g in tree swallow eggs.
Mirex is best known for its use in the 1960s and early 1970sto control fire ants in the southern United States, but it was alsoused as a flame retardant [47] elsewhere in the United States,including in the Great Lakes. In fact, sales of mirex for otheruses, primarily flame and fire retardants in plastics, were 74% oftotal sales [48] between 1960 and 1975. Sites and AOCs withthe highest mean exposure to mirex which were also abovebackground levels were the 2 sites along the Niagara River, withgeometric means of 16.8 ng/g and 19.6 ng/g. The Niagara Riveris the putative source for much of themirex contamination in theGreat Lakes, along with the Oswego River [48]. Other industrialrivers (Genesee River, Turning Point Park¼ 18.8 ng/g; RougeRiver AOC¼ 14.5 ng/g; River Raisin AOC¼ 14.0 ng/g; St.Clair River AOC¼ 13.8 ng/g; and Cuyahoga River AOC¼ 13.3ng/g) also had mirex concentrations above background, as didsome in-basin non-AOC sites, such as Cape Vincent (13.3 ng/g)and Chaumont River (11.2 ng/g), both near the intersection ofLake Ontario and the St. Lawrence River. The sites and AOCson Lake Ontario, however, were not necessarily significantlymore contaminated than the rest of the study locations in thepresent study as might have been postulated from the highexposure documented in fish, sediments [48], and birds [49] inearlier decades. Current exposure in tree swallows, with amaximum value of 82.2 ng/g at the Rouge River AOC, was farbelow the average concentrations (2580 ng/g wet wt) in herringgulls from 7 sites across the Great Lakes in 1977 [49], whenmirex was still being used. Mirex has been declining in herringgull eggs since it was banned [50]. Interestingly, concentrationsof mirex in tree swallow eggs are similar to concentrations inpiscivorous waterbird eggs [12,13], which include herring gulls.Concentrations of mirex in herring gull eggs (5.95 ng/g) inlower Green Bay in 2010 did not significantly differ from treeswallow eggs in 2010 (4.93 ng/g [13]). This contrasts with mostother organics, except for the dioxins and furans, which areusually higher in piscivorous birds than aquatic insectivorousbirds such as the tree swallow.
The cyclodiene pesticides, such as dieldrin, heptachlors, andchlordanes, were all banned in the United States and Canada inthe 1970s and 1980s and have been declining in avian tissues(herring gull eggs) since then [50]. All were used as insecticidesin agricultural as well as in urban (lawns, gardens, and termitecontrol) settings. The exposure patterns in tree swallows at sitesacross the Great Lakes were similar among these 3 pesticidegroups, so they will be discussed together. The top 10 sites forSheptachlor exposure were the same sites as 9 of the top 10for Schlordane and 7 of the top 10 for dieldrin exposure. The3 sites on the Ottawa River and 1 site on the Maumee Rivertended to have the highest exposure to both Schlordane andSheptachlor (ranked 1–4 for both) and dieldrin (ranked 1, 5,8, and 12). Heptachlor was a constituent of technical-gradechlordane, and technical heptachlor contained about 15% cis-chlordane and 2.5% trans-chlordane [51], which partiallyexplains the similar distribution in tree swallow eggs. The sourceof these chemicals is unknown, although the Maumee Riverdrains a large agricultural landscape where these insecticidesmay have been used extensively.
Data on background exposure to these cyclodiene pesticidesin tree swallow eggs are extremely limited. Concentrationsof Schlordanes averaged 50 ng/g in pool 15 of the upperMississippi River [24], 15 ng/g in pool 8 on the MississippiRiver [26], and 16 ng/g in British Columbia, Canada [52]. Usingthe average of these 3 values (27 ng/g), 50% of sites wereat background for Schlordanes. For heptachlor epoxide, theaverage concentration in those same 3 studies was 25 ng/g[24,26,28]. Eighty percent of sites were below background forSheptachlors. For dieldrin, background in tree swallow eggsaveraged 45 ng/g [25,28]; 90% of sites were below background.
There is little evidence that any of these cyclodienepesticides affect reproduction in birds, although there arenumerous cases of direct mortality from all 3 cyclodienechemicals, especially for dieldrin (see review in Elliott andBishop [52]), in birds. All tree swallow samples were below thethreshold of 1500 ng/g (Sheptachlors) in eggs developedfor American kestrels (Falco sparverius [52]). Maximumconcentration in an individual egg sample was 1330 ng/g(Sheptachlors) from Lincoln Park. The next most contaminatedindividual egg sample was from Dura Landfill and hadapproximately one-half that concentration (754 ng/g). Thresh-olds for reproductive impairments are �4200 ng/g for dieldrin[52], well below the highest 2 concentrations in tree swalloweggs, both from the Black River (1610 ng/g and 307 ng/g).No threshold concentrations for hatching success in eggs werefound in the literature for chlordanes [51].
Integrated toxicity assessment
There were 2 sites (Midland and Waukegan Harbor) thatstood out (toxicity score >60) compared with the other sites,which had toxicity scores less than approximately 20. AtMidland, 82.3% of toxicity was ascribed to PCDD-Fs, and atthat site the geometric mean PCDD-F TEQ concentration was2.6 times greater than the lower limit for impaired hatchingsuccess (181 pg/g [5]). Total PCBs at that site were inconse-quential (0.68mg/g), and the proportion of the toxicity scoreattributed to total PCBs reflected that (8.0%).Waukegan Harborhad the highest exposure to total PCBs with 2 of 11 samplesexceeding the lower limit for hatching success impairment(�20mg/g [3,30]). At that site, 97.0% of the toxicity wasascribed to PCBs and only 1.3% to PCDD-F TEQs. WaukeganHarbor was the third most contaminated AOC for PCDD-FTEQs, with a geometric mean concentration just below the
3088 Environ Toxicol Chem 35, 2016 C.M. Custer et al.
87 pg/g background exposure level, so attributing a smallamount of toxicity to PCDD-F TEQs seems warranted. FourAOCs had toxicity scores slightly above 20: Lower Fox Riverand Green Bay (24.5), Kalamazoo (23.5), Saginaw River andBay (22.4), and River Raisin (22.1). All 4 sites exceededbackground for total PCBs (0.34mg/g) by a factor of 6 to 7(geometric means of 2.55mg/g, 2.16mg/g, 1.88mg/g, and2.05mg/g, respectively), but all 4 sites were 10 times lowerthan the lower limit of hatching impairment for total PCBs.Geometric mean exposure to PCDD-F TEQs was belowbackground at these 4 sites as well. The method developedby Weseloh et al. [21] using the “protection factor forpiscivorous birds” developed by Newell et al. [22] seemsuseful, mainly to apportion possible toxicity among chemicals,especially for nonpiscivorous avian species.
For 3 chemical classes (PCBs, PCDD-Fs, and PBDEs) and 7other organochlorine contaminants considered in the presentstudy, nearly all of the sites were either at or below background,below average concentrations at non-AOCs, or below the meanat the most contaminated non-AOC. Geometric mean totalPCBs at approximately 70% of sites (78% of AOCs) were beloweither themeans at themost contaminated non-AOC (1.30mg/g)in the present study or the maximum reference value (1.74mg/g[32]) from those described in the literature. This, combined withthe documented reduction in exposure to PCBs [13,30,32] intree swallow eggs over the past 20 yr and declining PBDEs[44,45] in osprey egg samples, is a promising development.
Interpretation and sampling issues
PCBs and PCDD-F TEQs. A series of TEF systems hasbeen developed to assess the toxicity of PCBs and PCDD-Fmixtures. They were proposed as a method to better compareamong sites with different PCB or PCDD-F sources, which inturn might have different mixtures of specific PCB or PCDD-Fcongeners. These mixture differences could result in different“toxicities” at sites with similar concentrations or the same“toxicities” at sites with vastly different concentrations. TheWHO system [18] is currently the most commonly used for thispurpose. Data from the present study indicate that this conceptseems useful for PCDD-Fs but does not add to our understand-ing for PCBs. Furthermore, it seems to cloud, rather thanilluminate, the issue when apportioning the potential effects ofPCBs and PCDD-Fs. The r value correlating total PCBs andPCB TEQs for the 69 sites in the present study, which likelyhave very different PCB sources, was 0.94 and indicates thattotal PCBs can be used equally well in field studies as PCBTEQs. The disadvantage of reporting PCB TEQs exclusively, assome do, is that only 12 of 209 congeners are used to definethe toxicity. This excludes modes of action, other than arylhydrocarbon receptor activation, which is the basis for theWHOTEFs, and may miss other possibly important PCB congeners.For PCDD-Fs, there is a lower correlation between total PCDD-Fs and PCDD-F TEQs (r¼ 0.53), so information gained fromusing both metrics may be useful.
A continuing issue with the current WHO TEF system is thatthe relationship between PCB TEQs and PCDD-F TEQs doesnot reflect hatching success under field conditions. This may beattributable, in part, to the TEFs assigned to specific congeners(see further discussion in next paragraph). This can best beshown at a location such as Midland, where reproductiveimpairment was associated with PCDD-Fs [5]. According tocalculations using WHO TEFs [18], an average of 34% of thetoxicity at that site is the result of PCBs despite the fact that thegeometric mean concentration of total PCBs at Midland was
0.68mg/g wet weight, an average barely above backgroundexposure. A similar overestimate of PCB toxicity relative toPCDD-F toxicity was found on the Woonasquatucket River [4].The incongruence of the 2 systems is still present even whenPCDD-Fs are not as dominant. At Bay City, which had 3 of 5egg samples with PCDD-F TEQs over the hatching successimpairment threshold of 181 pg/g [5] and only slightly elevatedmean total PCBs (1.88mg/g), 65% of the toxicity was assignedto PCBs. Application of the WHO TEF system [18] at these2 sites seems to overinflate PCB toxicity relative to PCDD-Ftoxicity.
The main reasons for the inflated PCB toxicity estimatesseem to be 2-fold: the TEF assigned to PCB congener 77 and theTEFs assigned to some of the furan congeners. Congener 77,which accounted for 83% to 85% of the PCB TEQs (C.M.Custer, unpublished data) at those 2 sites, may in fact notwarrant a TEF of 0.05 for birds. Van den Berg et al. [18]indicated that the relative potency for PCB 77 was extremelywide, <0.0003 to 0.15, but gave this congener a TEF of 0.05.The TEF for congener 77 is second only to that for congeners81 and 126, both with TEFs of 0.1. Recent evidence for birdsindicates that PCB 77 has little ability to induce the arylhydrocarbon receptor (M. Ottinger, University of Houston,Houston, TX USA, personal communication), so the TEF forthis congener should probably be revised downward. Incontrast, the toxicity of some furan congeners is underestimatedbased on the work of Cohen-Barnhouse et al. [53] and Farmahinet al. [54]. Two furan congeners had relative potencies greaterthan TCDD in 3 avian species; this was especially apparent for2,3,4,7,8-pentachlorodibenzofuran.
Congener 77 may have an oversized impact on PCB TEQsfor tree swallows, because of their food habits, compared withthe TEQs calculated for many piscivorous waterbirds. Aquaticinvertebrates, which are nearly the entire diet of tree swallows,tend to exhibit less metabolism of some PCB congeners, suchas congener 77 [55], compared with fish [56]. Therefore,tree swallows are exposed to and accumulate congener 77 atgreater rates than piscivorous waterbirds because fish aremore capable of metabolizing and excreting congener 77 thanaquatic insects, thus exposing piscivorous taxa to lowerconcentrations of congener 77 than taxa that consume primarilyaquatic insects. An aquatic insectivore, therefore, may be amoreuseful monitoring species than a piscivore for those chemicals,which are readily metabolized by, reach a steady state in, or arenot as highly accumulated in fish as in aquatic insects.
Characterization of contaminant sources
The correlation of sediment concentrations to egg concen-trations in the present study supports the premise thatcontaminant exposure in nesting tree swallow is sediment-based and of local (�1 km) origin [8]. Studies have documentedthat the tree swallow diet is mainly composed of aquaticinsects [11], and an earlier publication [29], which synthesized5 different studies, described a significant, positive association(n¼ 6) between PCB concentrations in sediment and treeswallow eggs. Echols et al. [37] also demonstrated thisassociation with sediments for PCB congeners at a singlelocation. The present study adds to this assessment bydemonstrating a significant relationship between PCBs insediment [14] and PCBs in eggs across 23 AOCs. Eventhough tree swallows are migratory [57] and could conceivablyaccumulate some contaminants away from the area ofcollection, the strong association (r2¼ 0.50) between PCBs ineggs and sediment demonstrates that most contaminants in tree
Organic contaminants in Great Lakes tree swallows Environ Toxicol Chem 35, 2016 3089
swallow eggs are from the immediate local area. The associationbetween sediment and egg concentrations was not materiallyimproved by correlating lipid-normalized egg data, most likelybecause of the high correlation between PCB concentrationson a wet weight basis and a lipid weight basis (r¼ 0.99). Thishigh correlation resulted because egg samples were collectedearly in incubation, and thus all had a similar percent lipidcontent. The results from the present study corroborate otherdata that suggest that tree swallows are “interest breeders,”relying on nutrient sources collected locally on the breedinggrounds [58,59]. Female tree swallows base egg-layingdecisions, especially timing, on short-term income from recentforaging bouts rather than on long-term somatic stores [59].Results from barn swallows (Hirundo rustica), a closely relatedspecies, also suggest that eggs are formed mainly from currentfood intake [60]. One site that was inconsistent with the general“1-km rule” was Midland. Pine Creek, which is adjacent to thenest boxes at that site, was still frozen during the pre-eggand egg-laying periods (C.M. Custer, personal observation).Swallows at that site were flying to the nearest open water, mostlikely along the Tittabawassee River. That river is known to becontaminated with PCDD-Fs; this incongruity was also foundby Fredericks et al. [40].
Sample size considerations
Five egg samples per site were collected at nearly all sites.The choice of 5 was a compromise between the cost of chemicalanalyses and the large number of sites being assessed (n¼ 69).Where exposure was elevated, however (e.g., PCBs on theSheboygan River and Waukegan Harbor and PCDD-Fs atMidland), an additional 10 to 20 egg samples were analyzed tobetter characterize exposure and understand variation in thatexposure. An issue with a sample size of 5 or fewer is that 1 or 2samples with unusually high exposure can skew the mean. Anexample was the Cuyahoga River in 2014. Of 3 egg samples,1 had a PCDD-F concentration approximately 30 times higher(11 170 pg/g) than the other 2 (334 pg/g and 374 pg/g). Thefollowing year on the Cuyahoga River, the PCDD-F exposurewas <200 pg/g. It is not known where the swallows that nestedalong the lower Cuyahoga in 2014 spent the previous 4 wkto 6 wk. However, 1 female apparently fed in a locale thatwas much more contaminated, as evidenced by the higherconcentrations for most organic contaminants, than the other 2females in 2014 or any of the females in 2015.
Other species comparisons
The National Oceanic and Atmospheric AdministrationMussel Watch Program [14] is the only other published largegeographic–scale assessment of contaminants that targetedAOCs during the same time frame as the current tree swallowwork. At sites where mussels or sediments, as well as treeswallows, were sampled in close geographic proximity, the2 data sets showed remarkably similar trends. For example,the 4 sites highest for alpha-chlordane in mussels—Cuyahoga,Black River, Presque Isle, and Maumee AOCs—were the first,second, and fourth most contaminated AOCs forSchlordanes intree swallows. For hexachlorobenzenes, the second highestsite for mussel tissues was Milwaukee Bay; Lakeshore Park inMilwaukee Bay was the third highest tree swallow site forSbenzenes. The 2 higher AOC sites for tree swallows did nothave mussels sampled.
The mouth of the River Raisin was the only location in theCanadian Wildlife Service’s herring gull monitoring pro-gram [61] that overlapped with tree swallow sampling sites in
the present study. Concentrations of the sum of 14 PBDEcongeners were 568 ng/g wet weight in herring gull eggscompared with 72.4 ng/g and 75.2 ng/g in tree swallow eggsfrom 2 sites on the lower portion of the Raisin River. A similarbiomagnification in exposure in herring gulls for total PCBswas present at that location; that is, PCBs were higher in gulls(12.7mg/g; T.W. Custer, unpublished data) compared withswallows (2.05mg/g).Also consistentwith recent literature [13],there was an inversion of the typical biomagnification pyramidfor PCB TEQs in herring gull eggs compared with tree swalloweggs at that site. Total PCB TEQs averaged 211 pg/g in herringgull eggs in 2012 (T.W. Custer, unpublished data) at the mouthof the Raisin River, which was about one-half the concentrationmeasured in tree swallow eggs (401 pg/g PCBTEQs) at that site.Similar biomagnification and inversion at higher trophic levelswas found for total PCBs and PCB TEQs in lower GreenBay [13]. Again, this was mostly likely because of the TEFassigned to PCB congener 77 and the differing food habitsand metabolic processes within those food webs betweenaquatic insectivores and piscivores (see discussion in Interpre-tation and sampling issues section).
Reference site considerations
The use of reference sites for comparing exposure to, oreffects of, contaminants is standard practice in most fieldstudies. However, our knowledge about a location, especiallywhen new chemicals are frequently being introduced to theenvironment, is imperfect. Establishing a reference site can beproblematic if not all contaminants are included in the list ofanalytes being studied. This can sometimes result in an effectbeing ascribed to one chemical when in fact the causative agentmay be another related, or correlated, contaminant, such asPCBs and DDE [62] in lower Green Bay. In the present study,several of the non-AOC sites actually had the highestconcentration for 1 or more chemical classes. For example,Wild Rice Lake and Oscoda had background exposure to PCBs,PCDD-Fs, and assorted pesticides but the highest exposure toperfluorinated chemicals, a relatively new contaminant ofconcern. Although this was known at the time of the presentstudy, these sites were included to provide samples withextreme exposure to perfluorinated chemicals in the absence ofexposure to other classes of chemicals to assess biomarkerresponses. This points out the limitations of field studies whenan exhaustive assessment of other contaminants in the samplesis not possible. Another example is Midland, which wasdesignated as a reference location in another study [40], eventhough it ended up having some of the highest dioxin and furanexposures of anywhere in the United States. Categorization of asite as “reference” should be used with caution and may need tobe changed as new information is acquired.
CONCLUSIONS
Exposure to legacy organic contaminants, such as PCBs, andvarious organic pesticides as measured in tree swallow eggswere at or below background for PCBs at approximately 30% ofAOCs and below the most contaminated non-AOCs at 78% ofAOCs. Even the most elevated sites for total PCBs, exceptfor Waukegan Harbor, were >10 times below the lower limitat which hatching begins to be affected. Geometric meanconcentrations of total PCDD-F TEQs, however, were abovethe lower threshold where hatching success begins to benegatively affected at 2 locations, a non-AOC (Midland) anddownstream in the AOC (at Bay City in the Saginaw River and
3090 Environ Toxicol Chem 35, 2016 C.M. Custer et al.
BayAOC). On a total PCDD-F basis, 4 other AOCs—CuyahogaRiver, Black River, Rochester Embayment, and Lower GreenBay and Fox River AOCs—had geometric mean concentrationsthat exceeded or were at the lower limit for hatching success aswell. Nearly 90% of AOCs and 90% of non-AOCs were belowbackground for PBDEs. Active dredging and other remediationefforts are planned or under way, which may further reduceexposure in birds to these contaminants.
Supplemental Data—The Supplemental Data are available on the WileyOnline Library at DOI: 10.1002/etc.3496.
Acknowledgment—This work was funded by the Great Lakes RestorationInitiative, the US Environmental Protection Agency, MI Dept. Environ-mental Quality, and the US Geological Survey. We thank C. Balk,G. Berner, C. Bole, P. Boone, R. Booth Jr., A. Bosak, A. Haertel,A. Heimann, Y. Hernandez, M. Iverson, M. Larkin, A. Lorenz, S. O’Mara,R. Mayer, P. McKann, K. McMullen, M.Meier, K. Artner Mott, K. Prestby,D. Ripp, P. Ripple, C. Schneider, L. Solem, D. Tagerson, J. Teslaa,J. Tschaikovsky, M. Weber, and T. Zimmerman for field assistance;R. Erickson for help with R programming; K. Murray for contractingassistance; state personnel from Minnesota, Wisconsin, Illinois, Indiana,Ohio, Michigan, Pennsylvania, and New York for help obtaining collectingpermits; and J. Waide, M. Gaikowski, and 3 anonymous reviewers forcomments on earlier drafts of the manuscript. The present work could nothave been done without the access granted by the following landowners: thecities of Ashwaubenon, Wisconsin; Chicago, Illinois; Douglas, Michigan;Duluth, Minnesota; Green Bay, Wisconsin; Manistique, Michigan; Marys-ville, Michigan; Milwaukee, Wisconsin; Monroe, Michigan; Muskegon,Michigan; North Tonawanda, New York; Portage, Indiana; Rochester, NewYork; Sault St. Marie, Michigan; Sheboygan, Wisconsin; Sheboygan Falls,Wisconsin; Superior, Wisconsin; Toledo, Ohio; Whitehall, Michigan; andWyandotte, Michigan.We also thank Algonac State Park; Allete Energy; K.Aukerman; C. Balk; Bay City Waste Water Treatment Plant; Bay MillsIndian Community; BNSF Railroad; R. Booth Jr.; Buffalo UrbanDevelopment Corp.; Cedarburg Waste Water Treatment Plant; ChippewaNature Center; Cleveland MetroParks; Commercial Heat Treating Co.;Detroit Water and Sewerage; DTE Energy; Eagles Club Restaurant; ErieCo., New York; Erie, Pennsylvania, Waterworks; Fruitland Township;Fibrek, Inc.; Hallett Dock Co.; Hank Aaron State Trail, Honeywell Corp.;Horseshoe Casino; State of Indiana (RoxanaMarsh); IronheadMarine, Inc.;KK Integrated Logistics; Kohler Company; LaFarge Co.; Lake ErieMetroPark, Michigan; Lakeshore State Park, Wisconsin; C. Larscheid,Lorain Port Authority; Macomb Co.; Manistique Paper Corp.; Martineauand Morris Contracting; Mayline Co.; Milwaukee County Department ofParks, Recreation, and Culture; Michigan Department of Natural Resources(Deer Lake and Algonac State Park); Minnesota Department of NaturalResources (Green Mountain); National Gypsum, National Park Service(Apostle Islands National Lakeshore); H. Nelson; New Page Paper; NewYork State Parks (Niagara Falls); Port of Monroe; Presque Isle State Park;RiverWildlife; C. Schneider; R. Seichter, SheboyganMonument; L. Solem;Stimm Associates; True North Architecture and Construction Co.; US FishandWildlife Service (Ottawa National Wildlife Refuge); US Forest Service(Huron Manistee National Forest); Van Riper State Park; and WisconsinDepartment of Natural Resources (Star Lake).
Disclaimer—Any use of trade, firm, or product names is for descriptivepurposes only and does not imply endorsement by the US government.
Data availability—Data are available upon request from the correspondingauthor at [email protected].
REFERENCES
1. The Government of Canada and The Government of The United Statesof America. 2012. Great Lakes Water Quality Agreement. [cited 2016March 22]. Available from Great Lakes Water Quality Agreement.2012. Available from: http://www.epa.gov/greatlakes/glwqa/.
2. Allan RJ, Ball AJ, Cairns VW, Fox GA, Gilman AP, Peakall DB,Piekarz DA, Van Oosdam JC, Villeneuve DC, Williams DT. 1991.Toxic Chemicals in the Great Lakes and Associated Effects, Vols I andII. Environment Canada, Department of Fisheries and Oceans, Healthand Welfare Canada, Ottawa.
3. Custer CM,Custer TW,Dummer PM,MunneyKL. 2003. Exposure andeffects of chemical contaminants on tree swallows nesting along the
Housatonic River, Berkshire County,Massachusetts, USA, 1998–2000.Environ Toxicol Chem 22:1605–1621.
4. Custer CM, Custer TW, Rosiu CJ, MelanconMJ, Bickham JW,MatsonCW. 2005. Exposure and effects of 2,3,7,8-tetrachlorodibenzo-p-dioxinin tree swallows (Tachycineta bicolor) nesting along the Woonasqua-tucket River, Rhode Island, USA. Environ Toxicol Chem 24:93–109.
5. Fredricks TB, Zwiernik MJ, Seston RM, Coefield SJ, Tazelaar DL,Roark SA, Kay DP, Newsted JL, Giesy JP. 2011. Effects on treeswallows exposed to dioxin-like compounds associated with theTittabawassee River and floodplain near Midland, Michigan, USA.Environ Toxicol Chem 30:1354–1365.
6. Gilchrist TT, Letcher RJ, Thomas P, Fernie KJ. 2014. Polybrominateddiphenyl ethers and multiple stressor influence the reproduction of free-ranging tree swallows (Tachycineta bicolor) nesting at wastewatertreatment plants. Sci Total Environ 472:63–71.
7. Custer CM. 2011. Swallows as a sentinel species for contaminantexposure and effect studies. In Elliott JE, Bishop CA, Morrissey CA,eds, Wildlife Ecotoxicology: Forensic Approaches, Vol 3—EmergingTopics in Ecotoxicology. Springer, New York, NY, USA pp 45–91.
8. Stapleton MK, Robertson RJ. 2006. Female tree swallow home-rangemovements during their fertile period as revealed by radio-tracking.Wilson Journal of Ornithology 118:502–507.
9. Gewurtz SB, Backus SM, Bhavsar SP, McGoldrick DJ, de Solla SR,Murphy EW. 2011. Contaminant biomonitoring programs in the GreatLakes region: Review of approaches and critical factors. Environ Rev19:162–184.
10. Blancher PJ, McNicol DK. 1991. Tree swallow diet in relation towetland acidity. Can J Zool 69:2629–2637.
11. Mengelkoch JM, Niemi GJ, Regal RR. 2004. Diet of the nestling treeswallow. Condor 106:423–429.
12. Custer CM, Custer TW, Dummer PM. 2010. Patterns of contaminantsin eggs of an insectivorous, an omnivorous, and a piscivorous birdnesting on the Hudson River, New York, USA. Environ Toxicol Chem29:2286–2296.
13. Custer TW, Dummer PM, Franson JC, Custer CM, Jones M. 2014.Contaminant exposure of birds nesting in Green Bay, Wisconsin, USA.Environ Toxicol Chem 33:1832–1839.
14. Kimbrough K, Johnson WE, Jacob A, Edwards M, Davenport E,Lauenstein G, Nalepa T, Fulton M, Pait A. 2014. Mussel Watch GreatLakes contaminant monitoring and assessment: Phase 1. NOAATechnical Memorandum NOS NCCOS 180. National Oceanic andAtmospheric Administration, Silver Spring, MD, USA.
15. US Environmental Protection Agency. 1999. Method 1668 revision A:Chlorinated biphenyl congeners in water soil sediment and tissueby HRGC/HRMS. EPA 821R00002. Washington, DC. Availablefrom: https://yosemite.epa.gov/water/owrccatalog.nsf/065ca07e299b464685256ce50075c11a/3d9893f0309b8a1e85256b0600723f76
16. US Environmental Protection Agency. 1994. Method 1613, revision B:Tetra- through octa-chlorinated dioxins and furans by isotope dilutionHRGC/HRMS. Washington, DC.
17. US Environmental Protection Agency. 2007. Method 1614: Bromi-nated diphenyl ethers in water soil, sediment and tissue by HRGC/HRMS. EPA 821/R-07/005. Washington, DC.
18. Van den Berg M, Birnbaum L, Bosveld ATC, Brunstrom B, Cook P,Feeley M, Giesey JP, Hanberg A, Hasegawa R, Kennedy SW, KubiakT, Larsen JCO, Rolaf van Leeuwen RX, Djien Liem AK, Nolt C,Peterson RE, Poellinger L, Safe S, Schrenk D, Tillitt D, Tysklind M,Younes M, Waern F, Zacharewski T. 1998. Toxic equivalency factors(TEFs) for PCBs, PCDDs, PCDFs for humans and wildlife. EnvironHealth Perspect 106:775–792.
19. Stickel LF, Wiemeyer SN, Blus LJ. 1973. Pesticide residues in eggs ofwild birds: Adjustment for loss of moisture and lipid. Bull ContamToxicol 9:193–195.
20. R Core Team. 2013. R: A Language and Environment for StatisticalComputing. R Foundation for Statistical Computing, Vienna, Austria.
21. Weseloh DV, Pekarik C, de Solla SR. 2006. Spatial patterns andrankings of contaminant concentrations in herring gull eggs from 15sites in the Great Lakes and connecting channels, 1998–2002. EnvironMonit Assess 113:265–284.
22. Newell AJ, Johnson DW, Allen LK. 1987. Niagara River biotacontamination project: Fish flesh criteria for piscivorous wildlife.Technical Report 87.3. New York State Department of EnvironmentalConservation, Albany, NY, USA. [cited 2016March 8]. Available from:http://www.dec.ny.gov/docs/wildlife_pdf/niagarabiotacontamproj.pdf
23. Custer CM, Custer TW, Allen PD, Stromborg KL,MelanconMJ. 1998.Reproduction and environmental contamination in tree swallowsnesting in the Fox River drainage and Green Bay, Wisconsin, USA.Environ Toxicol Chem 17:1765–1987.
Organic contaminants in Great Lakes tree swallows Environ Toxicol Chem 35, 2016 3091
24. Custer CM, Custer TW, Coffey M. 2000. Organochlorine chemicals intree swallows nesting in pool 15 of the upper Mississippi River. BullEnviron Contam Toxicol 64:341–346.
25. Custer TM, Custer CM, Hines RK. 2002. Dioxins and congener-specific polychlorinated biphenyls in three avian species from theWisconsin River, Wisconsin. Environ Pollut 119:223–232.
26. Custer TW, Dummer PM, Custer CM, Li AU, Warburton D, MelanconMJ, Hoffman DJ, Matson CW, Bickham JW. 2007. Water levelmanagement and contaminant exposure to tree swallows nesting on theupper Mississippi River. Environ Monit Assess 133:335–345.
27. Bishop CA, Collins B, Mineau P, Burgess NM, Read WF, Risley C.2000. Reproduction of cavity-nesting birds in pesticide-sprayed appleorchards in southern Ontario, Canada, 1988–1994. Environ ToxicolChem 19:588–599.
28. Elliott JE, Martin PA, Arnold TW, Sinclair PH. 1994. Organochlorinesand reproductive success of birds in orchard and non-orchard areas ofcentral British Columbia, Canada, 1990–91. Arch Environ ContamToxicol 26:435–443.
29. Jayaraman S, Nacci DE, Champlin DM, Pruell RJ, Rocha KJ, CusterCM, Custer TW, Cantwell M. 2009. PCBs and DDE in tree swallow(Tachycineta bicolor) eggs and nestlings from an estuarine PCBsuperfund site, New Bedford Harbor, MA, USA. Environ Sci Technol43:8387–8392.
30. Neigh AM, Zwiernik MJ, Bradley PW, Kay DP, Park CS, Jones PD,Newsted JL, Blankenship AL, Giesy JP. 2006. Tree swallow(Tachycineta bicolor) exposure to polychlorinated biphenyls at theKalamazoo River superfund site, Michigan, USA. Environ ToxicolChem 25:428–437.
31. Spears BL, Brown MW, Hester CM. 2008. Evaluation of polychlori-nated biphenyl remediation at a superfund site using tree swallows(Tachycineta bicolor) as indicators. Environ Toxicol Chem 27:2512–2520.
32. Custer CM, Custer TW, Strom SM, Patnode KA, Franson JC. 2014.Changes in polychlorinated biphenyl (PCB) exposure in tree swallows(Tachycineta bicolor) nesting along the Sheboygan River, WI, USA.Ecotoxicology 23:1439–1446.
33. Robertson RJ, Stutchbury BJ, Cohen RR. 1992. Tree swallow. In PooleA, Stettenheim P, Gill F, eds, The Birds of North America, No. 11.Academy of Natural Sciences and American Ornithologists Union,Philadelphia and Washington, DC.
34. White DH, Seginak JT. 1994. Dioxins and furans linked to reproductiveimpairment in wood ducks. J Wildl Manage 58:100–106.
35. Henny CJ, Kaiser JL, Grove RA, Johnson BL, Letcher RJ. 2009.Polybrominated diphenyl ether flame retardants in eggs may reducereproductive success of ospreys in Oregon and Washington, USA.Ecotoxicology 18:802–813.
36. Nichols JW, Larsen CP, McDonald ME, Niemi GJ, Ankley GT. 1995.Bioenergetics-based model for accumulation of polychlorinatedbiphenyls by nestling tree swallows, Tachycineta bicolor. EnvironSci Technol 29:604–612.
37. Echols KR, Tillitt DE, Nichols JW, Secord AL, McCarty JP. 2004.Accumulation of PCB congeners in nestling tree swallows (Tachycinetabicolor) on the Hudson River, New York. Environ Sci Technol38:6240–6246.
38. Rappe C, Anderson R, Bergqvist P-A, Brohede C, Mansson M, KjellerL-O, Lindström G, Markund S, Nygren M, Swanson SE, Tysklind M,Wiberg K. 1987. Overview of environmental fate of chlorinated dioxinsand dibenzofurans. Sources, levels and isomeric pattern in variousmatrices. Chemosphere 16:1603–1618.
39. Fiedler H. 1996. Sources of PCDD/PCDF and impact on theenvironment. Chemosphere 32:55–64.
40. Fredericks TB, Zwiernik MJ, Seston RM, Coefield SJ, Plautz SC,Tazelaar DL, Shotwell MS, Bradley PW, Kay DP, Giesy JP. 2010.Passerine exposure to primarily PCDFs and PCDDs in the riverfloodplains near Midland, Michigan USA. Environ Toxicol Chem58:1048–1064.
41. Opperhuizen A, Sijm DTHM. 1990. Bioaccumulation and biotransfor-mation of polychlorinated dibenzo-p-dioxins and dibenzofurans in fish.Environ Toxicol Chem 9:175–186.
42. Isosaari P, Kiviranta H, LieØ, Lundebye A-K, Ritchie G, Vartiainen T.2004. Accumulation and distribution of polychlorinated dibenzo-p-dioxin, dibenzofuran, and polychlorinated biphenyl congeners inAtlantic salmon (Salmo salar). Environ Toxicol Chem 23:1672–1679.
43. Chen D, Hale RC. 2010. A global review of polybrominated diphenylether flame retardants in birds. Environ Int 36:800–811.
44. Lazarus RS, Rattner BA, McGowan PC, Hale RC, Schultz SL,Karouna-Renier NK, Ottinger MA. 2015. Decadal re-evaluation ofcontaminant exposure and productivity of ospreys (Pandion haliaetus)nesting in Chesapeake Bay regions of concern. Environ Pollut205:278–290.
45. HennyCJ,GroveRA,Kaiser JL, JohnsonBL, FuriCV,LetcherRJ. 2011.Wastewater dilution index partially explains observed polybrominateddiphenyl ether flame retardant concentrations in osprey eggs fromColumbia River basin, 2008–2009. Ecotoxicology 20:682–697.
46. Irwin RJ, VanMouwerik M, Stevens L, Seese MD, Basham W. 1997.Environmental Contaminants Encyclopedia. National Park Service,Water Resources Division, Fort Collins, CO, USA.
47. Eisler R. 1985. Mirex hazards to fish, wildlife, and invertebrates: Asynoptic review. US Fish and Wildlife Service Biological Report 85(1.1), Contaminant Hazard Reviews Report No 1. Patuxent WildlifeResearch Center, US Fish and Wildlife Service, Laurel, MD.
48. Kaiser KLE. 1978. The rise and fall of mirex. Environ Sci Technol12:520–528.
49. Norstrom RJ, Hallett DJ, Onuska FL, Comba ME. 1980. Mirex and itsdegradation products in Great Lakes herring gulls. Environ Sci Technol14:860–866.
50. Pekarik C,Weseloh DV. 1998. Organochlorine contaminants in herringgull eggs from the Great Lakes, 1974-1995: Change point regressionanalysis and short-term regression. Environ Monit Assess 53:77–115.
51. Eisler R. 1990. Chlordane hazards to fish, wildlife, and invertebrates: Asynoptic review. US Fish Wildlife Service Biological Rep 85 (1.21).Patuxent Wildlife Research Center, US Fish and Wildlife Service,Laurel, MD.
52. Elliott JE, Bishop CA. 2011. Cyclodiene and other organochlorinepesticides in birds. In Beyer WN, Meador JP, eds, EnvironmentalContaminants in Biota: Interpreting Tissue Concentrations, 2nd ed.CRC, Boca Raton, FL, USA, pp 447–475.
53. Cohen-Barnhouse A, Zwiernik MJ, Lind JE, Fitzgerald SD, KennedySW, Herv�e JC, Gies JP,Wiseman S, Yang Y, Jones PD,Wan Y, CollinsB, Newsted J, Kay D, Bursian SJ. 2011. Sensitivity of Japanese quail(Coturnix japonica), common pheasant (Phasianus colchicus) andwhite leghorn chicken (Gallus gallus domesticus) embryos to in ovoexposure to TCDD, PeCDF, and TCDF. Toxicol Sci 119:93–103.
54. Farmahin R,WuD, CrumpD, Herv�e JC, Jones SP, HahnME, KarchnerSI, Giesy JP, Bursian SJ, Zwiernik MJ, Kennedy SW. 2012. Sequenceand in vitro function of chicken, ring-necked pheasant, and Japanesequail AHR1 predict in vivo sensitivity to dioxins. Environ Sci Technol46:2967–2975.
55. Lester DC, McIntosh A. 1994. Accumulation of polychlorinatedbiphenyl congeners from Lake Champlain sediments byMysis relicata.Environ Toxicol Chem 13:1825–1841.
56. Willman EJ, Manchester-Neesvig JB, Armstrong DE. 1997. Influenceof ortho-substitution on patterns of PCB accumulation in sediment,plankton, and fish in a freshwater estuary. Environ Sci Technol31:3712–3718.
57. Winkler DW, Hallinger KK, Ardia DR, Robertson RJ, Stutchbury BJ,Cohen RR. 2011. Tree swallow (Tachycineta bicolor). In Poole A, ed,The Birds of North America Online. Ithaca: Cornell Lab of Ornithology.[cited 2016 March 22]. Available from: http://bna.birds.cornell.edu/bna/species/011
58. Stephens PA, Boyd IL, McNamara JM, Houston AI. 2009. Capitalbreeding and income breeding: Their meaning, measurement, andworth. Ecology 90:2057–2067.
59. Winkler DW, Allen PE. 1996. The seasonal decline in tree swallowclutch size: Physiological constraint or strategic adjustment? Ecology77:922–932.
60. Ward S, Bryant DM. 2006. Barn swallows Hirundo rustica form eggsmainly from current food intake. J Avian Biol 37:179–189.
61. Su G, Letcher RJ, Moore JN, Williams LL, Martin PA, deSolla SR,BowermanWW. 2015. Spatial and temporal comparisons of legacy andemerging flame retardants in herring gull eggs from colonies spanningthe Laurentian Great Lakes of Canada and United States. Environ Res142:720–730.
62. Custer TW, Custer CM, Hines RK, Gutreuter S, Stromborg KL, AllenPD, Melancon MJ. 1999. Organochlorine contaminants and reproduc-tive success of double-crested cormorants from Green Bay, Wisconsin,USA. Environ Toxicol Chem 18:1209–1217.
3092 Environ Toxicol Chem 35, 2016 C.M. Custer et al.
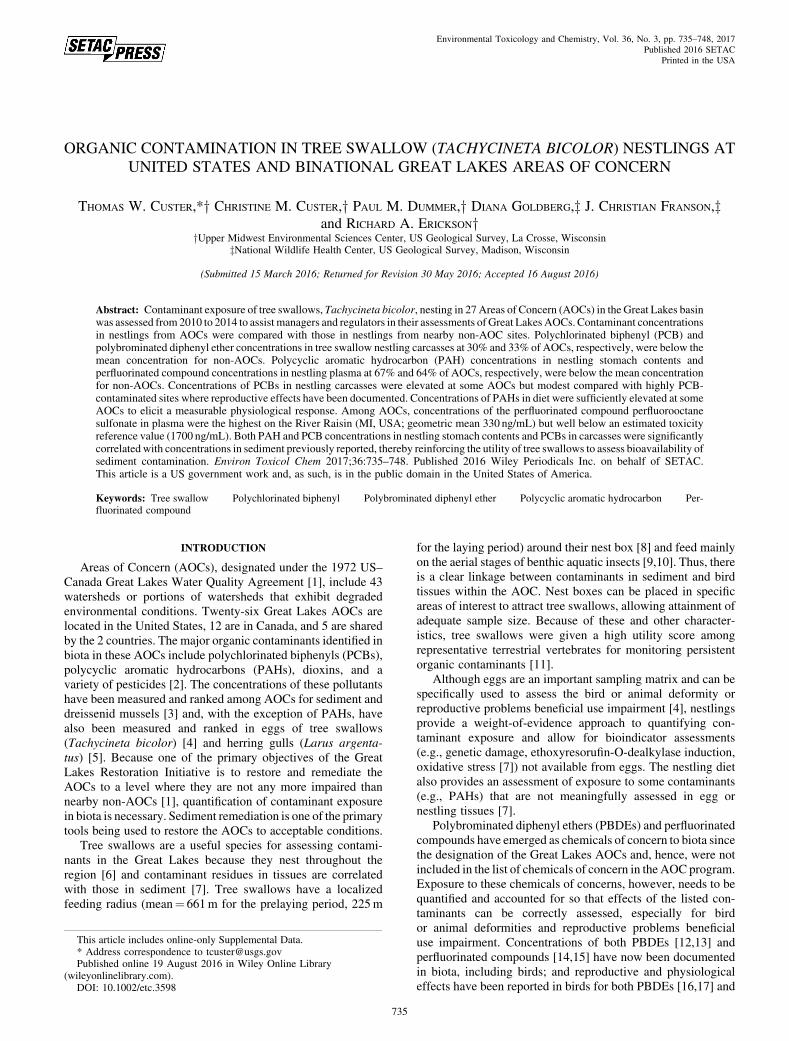
ORGANIC CONTAMINATION IN TREE SWALLOW (TACHYCINETA BICOLOR) NESTLINGS ATUNITED STATES AND BINATIONAL GREAT LAKES AREAS OF CONCERN
THOMAS W. CUSTER,*y CHRISTINE M. CUSTER,y PAUL M. DUMMER,y DIANA GOLDBERG,z J. CHRISTIAN FRANSON,zand RICHARD A. ERICKSONy
yUpper Midwest Environmental Sciences Center, US Geological Survey, La Crosse, WisconsinzNational Wildlife Health Center, US Geological Survey, Madison, Wisconsin
(Submitted 15 March 2016; Returned for Revision 30 May 2016; Accepted 16 August 2016)
Abstract: Contaminant exposure of tree swallows, Tachycineta bicolor, nesting in 27Areas of Concern (AOCs) in the Great Lakes basinwas assessed from 2010 to 2014 to assist managers and regulators in their assessments of Great Lakes AOCs. Contaminant concentrationsin nestlings from AOCs were compared with those in nestlings from nearby non-AOC sites. Polychlorinated biphenyl (PCB) andpolybrominated diphenyl ether concentrations in tree swallow nestling carcasses at 30% and 33% of AOCs, respectively, were below themean concentration for non-AOCs. Polycyclic aromatic hydrocarbon (PAH) concentrations in nestling stomach contents andperfluorinated compound concentrations in nestling plasma at 67% and 64% of AOCs, respectively, were below the mean concentrationfor non-AOCs. Concentrations of PCBs in nestling carcasses were elevated at some AOCs but modest compared with highly PCB-contaminated sites where reproductive effects have been documented. Concentrations of PAHs in diet were sufficiently elevated at someAOCs to elicit a measurable physiological response. Among AOCs, concentrations of the perfluorinated compound perfluorooctanesulfonate in plasma were the highest on the River Raisin (MI, USA; geometric mean 330 ng/mL) but well below an estimated toxicityreference value (1700 ng/mL). Both PAH and PCB concentrations in nestling stomach contents and PCBs in carcasses were significantlycorrelated with concentrations in sediment previously reported, thereby reinforcing the utility of tree swallows to assess bioavailability ofsediment contamination. Environ Toxicol Chem 2017;36:735–748. Published 2016 Wiley Periodicals Inc. on behalf of SETAC.This article is a US government work and, as such, is in the public domain in the United States of America.
Keywords: Tree swallow Polychlorinated biphenyl Polybrominated diphenyl ether Polycyclic aromatic hydrocarbon Per-fluorinated compound
INTRODUCTION
Areas of Concern (AOCs), designated under the 1972 US–Canada Great Lakes Water Quality Agreement [1], include 43watersheds or portions of watersheds that exhibit degradedenvironmental conditions. Twenty-six Great Lakes AOCs arelocated in the United States, 12 are in Canada, and 5 are sharedby the 2 countries. The major organic contaminants identified inbiota in these AOCs include polychlorinated biphenyls (PCBs),polycyclic aromatic hydrocarbons (PAHs), dioxins, and avariety of pesticides [2]. The concentrations of these pollutantshave been measured and ranked among AOCs for sediment anddreissenid mussels [3] and, with the exception of PAHs, havealso been measured and ranked in eggs of tree swallows(Tachycineta bicolor) [4] and herring gulls (Larus argenta-tus) [5]. Because one of the primary objectives of the GreatLakes Restoration Initiative is to restore and remediate theAOCs to a level where they are not any more impaired thannearby non-AOCs [1], quantification of contaminant exposurein biota is necessary. Sediment remediation is one of the primarytools being used to restore the AOCs to acceptable conditions.
Tree swallows are a useful species for assessing contami-nants in the Great Lakes because they nest throughout theregion [6] and contaminant residues in tissues are correlatedwith those in sediment [7]. Tree swallows have a localizedfeeding radius (mean¼ 661m for the prelaying period, 225m
for the laying period) around their nest box [8] and feed mainlyon the aerial stages of benthic aquatic insects [9,10]. Thus, thereis a clear linkage between contaminants in sediment and birdtissues within the AOC. Nest boxes can be placed in specificareas of interest to attract tree swallows, allowing attainment ofadequate sample size. Because of these and other character-istics, tree swallows were given a high utility score amongrepresentative terrestrial vertebrates for monitoring persistentorganic contaminants [11].
Although eggs are an important sampling matrix and can bespecifically used to assess the bird or animal deformity orreproductive problems beneficial use impairment [4], nestlingsprovide a weight-of-evidence approach to quantifying con-taminant exposure and allow for bioindicator assessments(e.g., genetic damage, ethoxyresorufin-O-dealkylase induction,oxidative stress [7]) not available from eggs. The nestling dietalso provides an assessment of exposure to some contaminants(e.g., PAHs) that are not meaningfully assessed in egg ornestling tissues [7].
Polybrominated diphenyl ethers (PBDEs) and perfluorinatedcompounds have emerged as chemicals of concern to biota sincethe designation of the Great Lakes AOCs and, hence, were notincluded in the list of chemicals of concern in the AOC program.Exposure to these chemicals of concerns, however, needs to bequantified and accounted for so that effects of the listed con-taminants can be correctly assessed, especially for birdor animal deformities and reproductive problems beneficialuse impairment. Concentrations of both PBDEs [12,13] andperfluorinated compounds [14,15] have now been documentedin biota, including birds; and reproductive and physiologicaleffects have been reported in birds for both PBDEs [16,17] and
This article includes online-only Supplemental Data.* Address correspondence to [email protected] online 19 August 2016 in Wiley Online Library
(wileyonlinelibrary.com).DOI: 10.1002/etc.3598
Environmental Toxicology and Chemistry, Vol. 36, No. 3, pp. 735–748, 2017Published 2016 SETAC
Printed in the USA
735
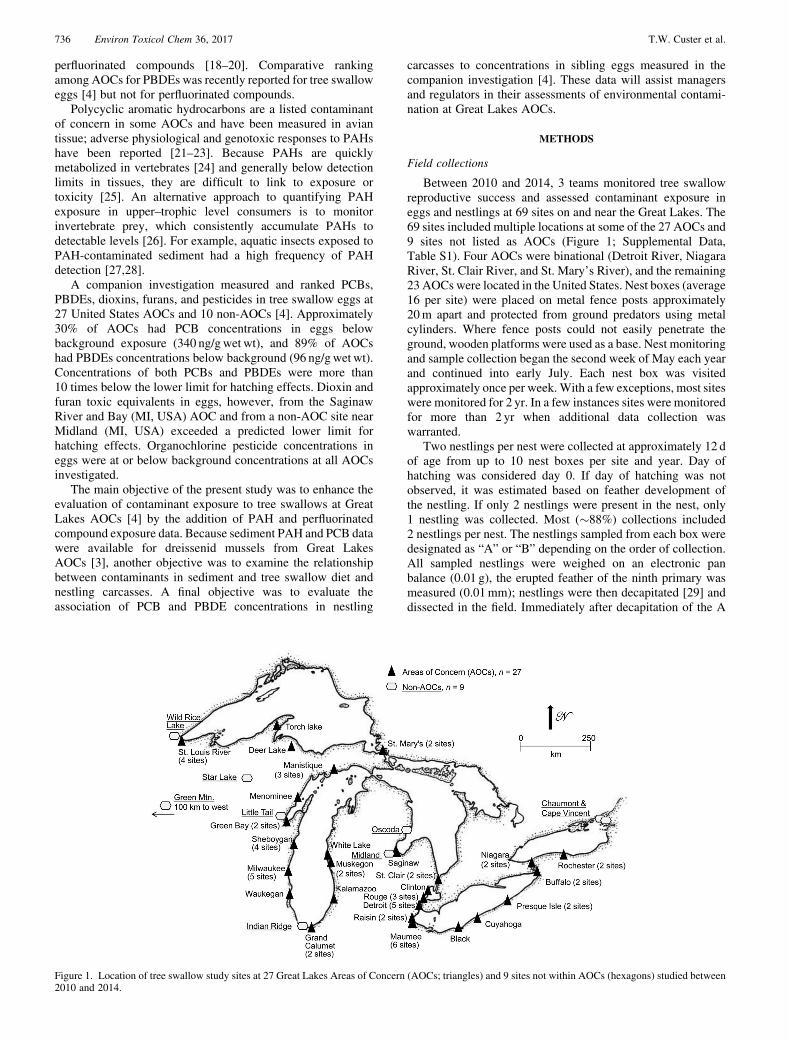
perfluorinated compounds [18–20]. Comparative rankingamong AOCs for PBDEs was recently reported for tree swalloweggs [4] but not for perfluorinated compounds.
Polycyclic aromatic hydrocarbons are a listed contaminantof concern in some AOCs and have been measured in aviantissue; adverse physiological and genotoxic responses to PAHshave been reported [21–23]. Because PAHs are quicklymetabolized in vertebrates [24] and generally below detectionlimits in tissues, they are difficult to link to exposure ortoxicity [25]. An alternative approach to quantifying PAHexposure in upper–trophic level consumers is to monitorinvertebrate prey, which consistently accumulate PAHs todetectable levels [26]. For example, aquatic insects exposed toPAH-contaminated sediment had a high frequency of PAHdetection [27,28].
A companion investigation measured and ranked PCBs,PBDEs, dioxins, furans, and pesticides in tree swallow eggs at27 United States AOCs and 10 non-AOCs [4]. Approximately30% of AOCs had PCB concentrations in eggs belowbackground exposure (340 ng/gwetwt), and 89% of AOCshad PBDEs concentrations below background (96 ng/gwetwt).Concentrations of both PCBs and PBDEs were more than10 times below the lower limit for hatching effects. Dioxin andfuran toxic equivalents in eggs, however, from the SaginawRiver and Bay (MI, USA) AOC and from a non-AOC site nearMidland (MI, USA) exceeded a predicted lower limit forhatching effects. Organochlorine pesticide concentrations ineggs were at or below background concentrations at all AOCsinvestigated.
The main objective of the present study was to enhance theevaluation of contaminant exposure to tree swallows at GreatLakes AOCs [4] by the addition of PAH and perfluorinatedcompound exposure data. Because sediment PAH and PCB datawere available for dreissenid mussels from Great LakesAOCs [3], another objective was to examine the relationshipbetween contaminants in sediment and tree swallow diet andnestling carcasses. A final objective was to evaluate theassociation of PCB and PBDE concentrations in nestling
carcasses to concentrations in sibling eggs measured in thecompanion investigation [4]. These data will assist managersand regulators in their assessments of environmental contami-nation at Great Lakes AOCs.
METHODS
Field collections
Between 2010 and 2014, 3 teams monitored tree swallowreproductive success and assessed contaminant exposure ineggs and nestlings at 69 sites on and near the Great Lakes. The69 sites included multiple locations at some of the 27 AOCs and9 sites not listed as AOCs (Figure 1; Supplemental Data,Table S1). Four AOCs were binational (Detroit River, NiagaraRiver, St. Clair River, and St. Mary’s River), and the remaining23 AOCs were located in the United States. Nest boxes (average16 per site) were placed on metal fence posts approximately20m apart and protected from ground predators using metalcylinders. Where fence posts could not easily penetrate theground, wooden platforms were used as a base. Nest monitoringand sample collection began the second week of May each yearand continued into early July. Each nest box was visitedapproximately once per week.With a few exceptions, most siteswere monitored for 2 yr. In a few instances sites were monitoredfor more than 2 yr when additional data collection waswarranted.
Two nestlings per nest were collected at approximately 12 dof age from up to 10 nest boxes per site and year. Day ofhatching was considered day 0. If day of hatching was notobserved, it was estimated based on feather development ofthe nestling. If only 2 nestlings were present in the nest, only1 nestling was collected. Most (�88%) collections included2 nestlings per nest. The nestlings sampled from each box weredesignated as “A” or “B” depending on the order of collection.All sampled nestlings were weighed on an electronic panbalance (0.01 g), the erupted feather of the ninth primary wasmeasured (0.01mm); nestlings were then decapitated [29] anddissected in the field. Immediately after decapitation of the A
Figure 1. Location of tree swallow study sites at 27 Great Lakes Areas of Concern (AOCs; triangles) and 9 sites not within AOCs (hexagons) studied between2010 and 2014.
736 Environ Toxicol Chem 36, 2017 T.W. Custer et al.
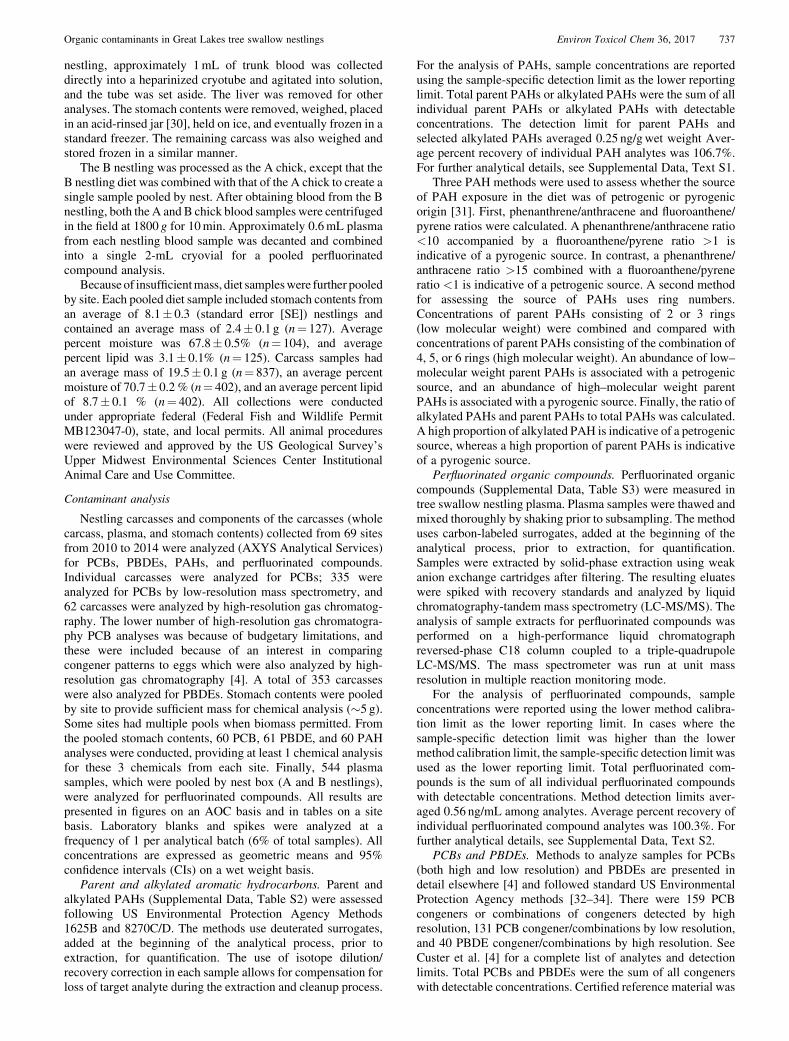
nestling, approximately 1mL of trunk blood was collecteddirectly into a heparinized cryotube and agitated into solution,and the tube was set aside. The liver was removed for otheranalyses. The stomach contents were removed, weighed, placedin an acid-rinsed jar [30], held on ice, and eventually frozen in astandard freezer. The remaining carcass was also weighed andstored frozen in a similar manner.
The B nestling was processed as the A chick, except that theB nestling diet was combined with that of the A chick to create asingle sample pooled by nest. After obtaining blood from the Bnestling, both the A and B chick blood samples were centrifugedin the field at 1800 g for 10min. Approximately 0.6mL plasmafrom each nestling blood sample was decanted and combinedinto a single 2-mL cryovial for a pooled perfluorinatedcompound analysis.
Because of insufficientmass, diet sampleswere further pooledby site. Each pooled diet sample included stomach contents froman average of 8.1� 0.3 (standard error [SE]) nestlings andcontained an average mass of 2.4� 0.1 g (n¼ 127). Averagepercent moisture was 67.8� 0.5% (n¼ 104), and averagepercent lipid was 3.1� 0.1% (n¼ 125). Carcass samples hadan average mass of 19.5� 0.1 g (n¼ 837), an average percentmoisture of 70.7� 0.2 % (n¼ 402), and an average percent lipidof 8.7� 0.1 % (n¼ 402). All collections were conductedunder appropriate federal (Federal Fish and Wildlife PermitMB123047-0), state, and local permits. All animal procedureswere reviewed and approved by the US Geological Survey’sUpper Midwest Environmental Sciences Center InstitutionalAnimal Care and Use Committee.
Contaminant analysis
Nestling carcasses and components of the carcasses (wholecarcass, plasma, and stomach contents) collected from 69 sitesfrom 2010 to 2014 were analyzed (AXYS Analytical Services)for PCBs, PBDEs, PAHs, and perfluorinated compounds.Individual carcasses were analyzed for PCBs; 335 wereanalyzed for PCBs by low-resolution mass spectrometry, and62 carcasses were analyzed by high-resolution gas chromatog-raphy. The lower number of high-resolution gas chromatogra-phy PCB analyses was because of budgetary limitations, andthese were included because of an interest in comparingcongener patterns to eggs which were also analyzed by high-resolution gas chromatography [4]. A total of 353 carcasseswere also analyzed for PBDEs. Stomach contents were pooledby site to provide sufficient mass for chemical analysis (�5 g).Some sites had multiple pools when biomass permitted. Fromthe pooled stomach contents, 60 PCB, 61 PBDE, and 60 PAHanalyses were conducted, providing at least 1 chemical analysisfor these 3 chemicals from each site. Finally, 544 plasmasamples, which were pooled by nest box (A and B nestlings),were analyzed for perfluorinated compounds. All results arepresented in figures on an AOC basis and in tables on a sitebasis. Laboratory blanks and spikes were analyzed at afrequency of 1 per analytical batch (6% of total samples). Allconcentrations are expressed as geometric means and 95%confidence intervals (CIs) on a wet weight basis.
Parent and alkylated aromatic hydrocarbons. Parent andalkylated PAHs (Supplemental Data, Table S2) were assessedfollowing US Environmental Protection Agency Methods1625B and 8270C/D. The methods use deuterated surrogates,added at the beginning of the analytical process, prior toextraction, for quantification. The use of isotope dilution/recovery correction in each sample allows for compensation forloss of target analyte during the extraction and cleanup process.
For the analysis of PAHs, sample concentrations are reportedusing the sample-specific detection limit as the lower reportinglimit. Total parent PAHs or alkylated PAHs were the sum of allindividual parent PAHs or alkylated PAHs with detectableconcentrations. The detection limit for parent PAHs andselected alkylated PAHs averaged 0.25 ng/gwet weight Aver-age percent recovery of individual PAH analytes was 106.7%.For further analytical details, see Supplemental Data, Text S1.
Three PAH methods were used to assess whether the sourceof PAH exposure in the diet was of petrogenic or pyrogenicorigin [31]. First, phenanthrene/anthracene and fluoroanthene/pyrene ratios were calculated. A phenanthrene/anthracene ratio<10 accompanied by a fluoroanthene/pyrene ratio >1 isindicative of a pyrogenic source. In contrast, a phenanthrene/anthracene ratio >15 combined with a fluoroanthene/pyreneratio <1 is indicative of a petrogenic source. A second methodfor assessing the source of PAHs uses ring numbers.Concentrations of parent PAHs consisting of 2 or 3 rings(low molecular weight) were combined and compared withconcentrations of parent PAHs consisting of the combination of4, 5, or 6 rings (high molecular weight). An abundance of low–molecular weight parent PAHs is associated with a petrogenicsource, and an abundance of high–molecular weight parentPAHs is associated with a pyrogenic source. Finally, the ratio ofalkylated PAHs and parent PAHs to total PAHs was calculated.A high proportion of alkylated PAH is indicative of a petrogenicsource, whereas a high proportion of parent PAHs is indicativeof a pyrogenic source.
Perfluorinated organic compounds. Perfluorinated organiccompounds (Supplemental Data, Table S3) were measured intree swallow nestling plasma. Plasma samples were thawed andmixed thoroughly by shaking prior to subsampling. The methoduses carbon-labeled surrogates, added at the beginning of theanalytical process, prior to extraction, for quantification.Samples were extracted by solid-phase extraction using weakanion exchange cartridges after filtering. The resulting eluateswere spiked with recovery standards and analyzed by liquidchromatography-tandem mass spectrometry (LC-MS/MS). Theanalysis of sample extracts for perfluorinated compounds wasperformed on a high-performance liquid chromatographreversed-phase C18 column coupled to a triple-quadrupoleLC-MS/MS. The mass spectrometer was run at unit massresolution in multiple reaction monitoring mode.
For the analysis of perfluorinated compounds, sampleconcentrations were reported using the lower method calibra-tion limit as the lower reporting limit. In cases where thesample-specific detection limit was higher than the lowermethod calibration limit, the sample-specific detection limit wasused as the lower reporting limit. Total perfluorinated com-pounds is the sum of all individual perfluorinated compoundswith detectable concentrations. Method detection limits aver-aged 0.56 ng/mL among analytes. Average percent recovery ofindividual perfluorinated compound analytes was 100.3%. Forfurther analytical details, see Supplemental Data, Text S2.
PCBs and PBDEs. Methods to analyze samples for PCBs(both high and low resolution) and PBDEs are presented indetail elsewhere [4] and followed standard US EnvironmentalProtection Agency methods [32–34]. There were 159 PCBcongeners or combinations of congeners detected by highresolution, 131 PCB congener/combinations by low resolution,and 40 PBDE congener/combinations by high resolution. SeeCuster et al. [4] for a complete list of analytes and detectionlimits. Total PCBs and PBDEs were the sum of all congenerswith detectable concentrations. Certified reference material was
Organic contaminants in Great Lakes tree swallow nestlings Environ Toxicol Chem 36, 2017 737
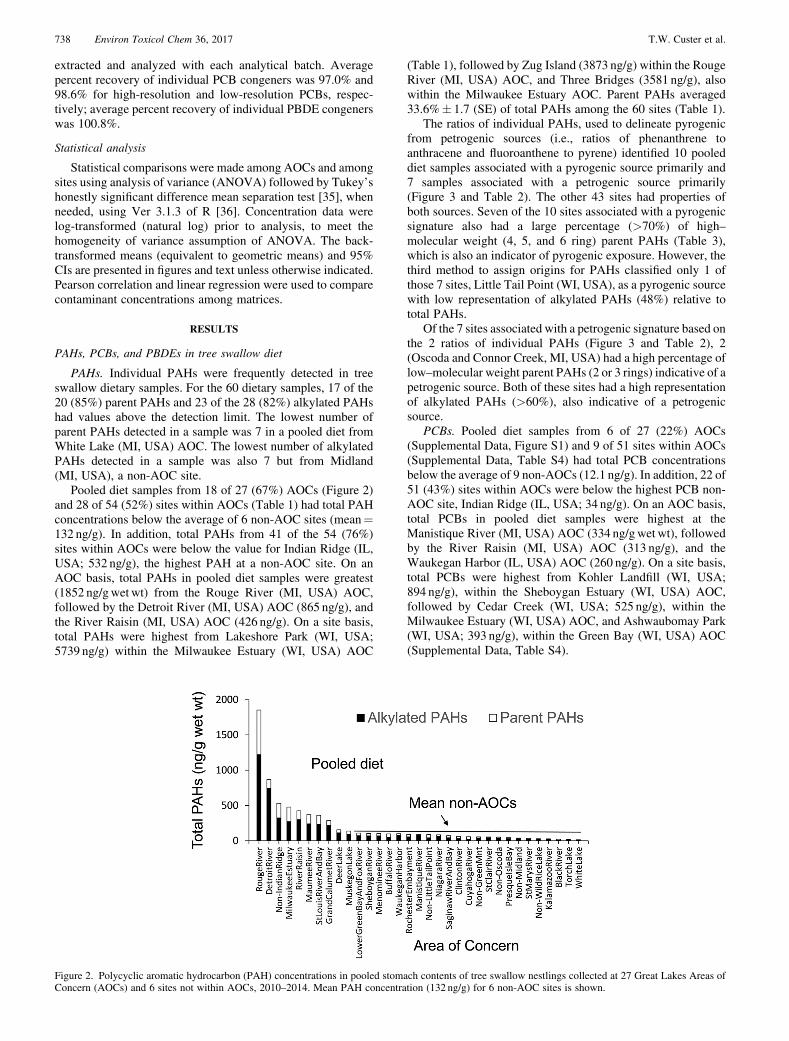
extracted and analyzed with each analytical batch. Averagepercent recovery of individual PCB congeners was 97.0% and98.6% for high-resolution and low-resolution PCBs, respec-tively; average percent recovery of individual PBDE congenerswas 100.8%.
Statistical analysis
Statistical comparisons were made among AOCs and amongsites using analysis of variance (ANOVA) followed by Tukey’shonestly significant difference mean separation test [35], whenneeded, using Ver 3.1.3 of R [36]. Concentration data werelog-transformed (natural log) prior to analysis, to meet thehomogeneity of variance assumption of ANOVA. The back-transformed means (equivalent to geometric means) and 95%CIs are presented in figures and text unless otherwise indicated.Pearson correlation and linear regression were used to comparecontaminant concentrations among matrices.
RESULTS
PAHs, PCBs, and PBDEs in tree swallow diet
PAHs. Individual PAHs were frequently detected in treeswallow dietary samples. For the 60 dietary samples, 17 of the20 (85%) parent PAHs and 23 of the 28 (82%) alkylated PAHshad values above the detection limit. The lowest number ofparent PAHs detected in a sample was 7 in a pooled diet fromWhite Lake (MI, USA) AOC. The lowest number of alkylatedPAHs detected in a sample was also 7 but from Midland(MI, USA), a non-AOC site.
Pooled diet samples from 18 of 27 (67%) AOCs (Figure 2)and 28 of 54 (52%) sites within AOCs (Table 1) had total PAHconcentrations below the average of 6 non-AOC sites (mean¼132 ng/g). In addition, total PAHs from 41 of the 54 (76%)sites within AOCs were below the value for Indian Ridge (IL,USA; 532 ng/g), the highest PAH at a non-AOC site. On anAOC basis, total PAHs in pooled diet samples were greatest(1852 ng/gwetwt) from the Rouge River (MI, USA) AOC,followed by the Detroit River (MI, USA) AOC (865 ng/g), andthe River Raisin (MI, USA) AOC (426 ng/g). On a site basis,total PAHs were highest from Lakeshore Park (WI, USA;5739 ng/g) within the Milwaukee Estuary (WI, USA) AOC
(Table 1), followed by Zug Island (3873 ng/g) within the RougeRiver (MI, USA) AOC, and Three Bridges (3581 ng/g), alsowithin the Milwaukee Estuary AOC. Parent PAHs averaged33.6%� 1.7 (SE) of total PAHs among the 60 sites (Table 1).
The ratios of individual PAHs, used to delineate pyrogenicfrom petrogenic sources (i.e., ratios of phenanthrene toanthracene and fluoroanthene to pyrene) identified 10 pooleddiet samples associated with a pyrogenic source primarily and7 samples associated with a petrogenic source primarily(Figure 3 and Table 2). The other 43 sites had properties ofboth sources. Seven of the 10 sites associated with a pyrogenicsignature also had a large percentage (>70%) of high–molecular weight (4, 5, and 6 ring) parent PAHs (Table 3),which is also an indicator of pyrogenic exposure. However, thethird method to assign origins for PAHs classified only 1 ofthose 7 sites, Little Tail Point (WI, USA), as a pyrogenic sourcewith low representation of alkylated PAHs (48%) relative tototal PAHs.
Of the 7 sites associated with a petrogenic signature based onthe 2 ratios of individual PAHs (Figure 3 and Table 2), 2(Oscoda and Connor Creek, MI, USA) had a high percentage oflow–molecular weight parent PAHs (2 or 3 rings) indicative of apetrogenic source. Both of these sites had a high representationof alkylated PAHs (>60%), also indicative of a petrogenicsource.
PCBs. Pooled diet samples from 6 of 27 (22%) AOCs(Supplemental Data, Figure S1) and 9 of 51 sites within AOCs(Supplemental Data, Table S4) had total PCB concentrationsbelow the average of 9 non-AOCs (12.1 ng/g). In addition, 22 of51 (43%) sites within AOCs were below the highest PCB non-AOC site, Indian Ridge (IL, USA; 34 ng/g). On an AOC basis,total PCBs in pooled diet samples were highest at theManistique River (MI, USA) AOC (334 ng/gwetwt), followedby the River Raisin (MI, USA) AOC (313 ng/g), and theWaukegan Harbor (IL, USA) AOC (260 ng/g). On a site basis,total PCBs were highest from Kohler Landfill (WI, USA;894 ng/g), within the Sheboygan Estuary (WI, USA) AOC,followed by Cedar Creek (WI, USA; 525 ng/g), within theMilwaukee Estuary (WI, USA) AOC, and Ashwaubomay Park(WI, USA; 393 ng/g), within the Green Bay (WI, USA) AOC(Supplemental Data, Table S4).
Figure 2. Polycyclic aromatic hydrocarbon (PAH) concentrations in pooled stomach contents of tree swallow nestlings collected at 27 Great Lakes Areas ofConcern (AOCs) and 6 sites not within AOCs, 2010–2014. Mean PAH concentration (132 ng/g) for 6 non-AOC sites is shown.
738 Environ Toxicol Chem 36, 2017 T.W. Custer et al.
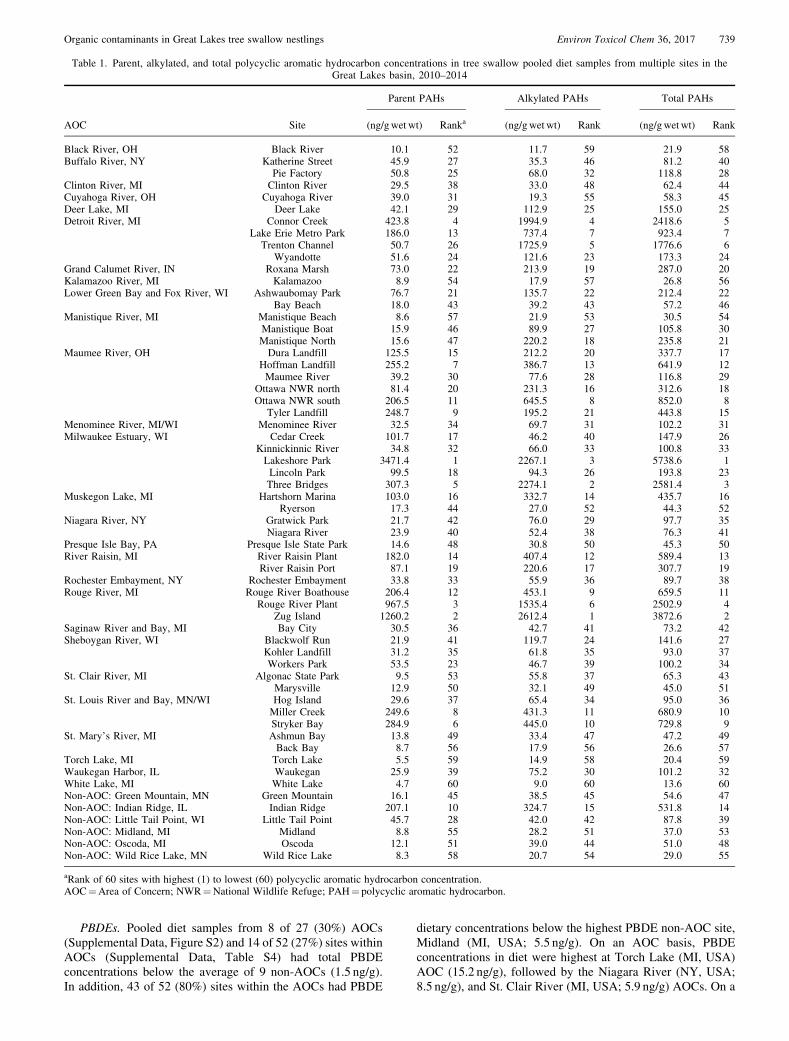
PBDEs. Pooled diet samples from 8 of 27 (30%) AOCs(Supplemental Data, Figure S2) and 14 of 52 (27%) sites withinAOCs (Supplemental Data, Table S4) had total PBDEconcentrations below the average of 9 non-AOCs (1.5 ng/g).In addition, 43 of 52 (80%) sites within the AOCs had PBDE
dietary concentrations below the highest PBDE non-AOC site,Midland (MI, USA; 5.5 ng/g). On an AOC basis, PBDEconcentrations in diet were highest at Torch Lake (MI, USA)AOC (15.2 ng/g), followed by the Niagara River (NY, USA;8.5 ng/g), and St. Clair River (MI, USA; 5.9 ng/g) AOCs. On a
Table 1. Parent, alkylated, and total polycyclic aromatic hydrocarbon concentrations in tree swallow pooled diet samples from multiple sites in theGreat Lakes basin, 2010–2014
Parent PAHs Alkylated PAHs Total PAHs
AOC Site (ng/gwet wt) Ranka (ng/gwetwt) Rank (ng/gwetwt) Rank
Black River, OH Black River 10.1 52 11.7 59 21.9 58Buffalo River, NY Katherine Street 45.9 27 35.3 46 81.2 40
Pie Factory 50.8 25 68.0 32 118.8 28Clinton River, MI Clinton River 29.5 38 33.0 48 62.4 44Cuyahoga River, OH Cuyahoga River 39.0 31 19.3 55 58.3 45Deer Lake, MI Deer Lake 42.1 29 112.9 25 155.0 25Detroit River, MI Connor Creek 423.8 4 1994.9 4 2418.6 5
Lake Erie Metro Park 186.0 13 737.4 7 923.4 7Trenton Channel 50.7 26 1725.9 5 1776.6 6
Wyandotte 51.6 24 121.6 23 173.3 24Grand Calumet River, IN Roxana Marsh 73.0 22 213.9 19 287.0 20Kalamazoo River, MI Kalamazoo 8.9 54 17.9 57 26.8 56Lower Green Bay and Fox River, WI Ashwaubomay Park 76.7 21 135.7 22 212.4 22
Bay Beach 18.0 43 39.2 43 57.2 46Manistique River, MI Manistique Beach 8.6 57 21.9 53 30.5 54
Manistique Boat 15.9 46 89.9 27 105.8 30Manistique North 15.6 47 220.2 18 235.8 21
Maumee River, OH Dura Landfill 125.5 15 212.2 20 337.7 17Hoffman Landfill 255.2 7 386.7 13 641.9 12Maumee River 39.2 30 77.6 28 116.8 29
Ottawa NWR north 81.4 20 231.3 16 312.6 18Ottawa NWR south 206.5 11 645.5 8 852.0 8
Tyler Landfill 248.7 9 195.2 21 443.8 15Menominee River, MI/WI Menominee River 32.5 34 69.7 31 102.2 31Milwaukee Estuary, WI Cedar Creek 101.7 17 46.2 40 147.9 26
Kinnickinnic River 34.8 32 66.0 33 100.8 33Lakeshore Park 3471.4 1 2267.1 3 5738.6 1Lincoln Park 99.5 18 94.3 26 193.8 23Three Bridges 307.3 5 2274.1 2 2581.4 3
Muskegon Lake, MI Hartshorn Marina 103.0 16 332.7 14 435.7 16Ryerson 17.3 44 27.0 52 44.3 52
Niagara River, NY Gratwick Park 21.7 42 76.0 29 97.7 35Niagara River 23.9 40 52.4 38 76.3 41
Presque Isle Bay, PA Presque Isle State Park 14.6 48 30.8 50 45.3 50River Raisin, MI River Raisin Plant 182.0 14 407.4 12 589.4 13
River Raisin Port 87.1 19 220.6 17 307.7 19Rochester Embayment, NY Rochester Embayment 33.8 33 55.9 36 89.7 38Rouge River, MI Rouge River Boathouse 206.4 12 453.1 9 659.5 11
Rouge River Plant 967.5 3 1535.4 6 2502.9 4Zug Island 1260.2 2 2612.4 1 3872.6 2
Saginaw River and Bay, MI Bay City 30.5 36 42.7 41 73.2 42Sheboygan River, WI Blackwolf Run 21.9 41 119.7 24 141.6 27
Kohler Landfill 31.2 35 61.8 35 93.0 37Workers Park 53.5 23 46.7 39 100.2 34
St. Clair River, MI Algonac State Park 9.5 53 55.8 37 65.3 43Marysville 12.9 50 32.1 49 45.0 51
St. Louis River and Bay, MN/WI Hog Island 29.6 37 65.4 34 95.0 36Miller Creek 249.6 8 431.3 11 680.9 10Stryker Bay 284.9 6 445.0 10 729.8 9
St. Mary’s River, MI Ashmun Bay 13.8 49 33.4 47 47.2 49Back Bay 8.7 56 17.9 56 26.6 57
Torch Lake, MI Torch Lake 5.5 59 14.9 58 20.4 59Waukegan Harbor, IL Waukegan 25.9 39 75.2 30 101.2 32White Lake, MI White Lake 4.7 60 9.0 60 13.6 60Non-AOC: Green Mountain, MN Green Mountain 16.1 45 38.5 45 54.6 47Non-AOC: Indian Ridge, IL Indian Ridge 207.1 10 324.7 15 531.8 14Non-AOC: Little Tail Point, WI Little Tail Point 45.7 28 42.0 42 87.8 39Non-AOC: Midland, MI Midland 8.8 55 28.2 51 37.0 53Non-AOC: Oscoda, MI Oscoda 12.1 51 39.0 44 51.0 48Non-AOC: Wild Rice Lake, MN Wild Rice Lake 8.3 58 20.7 54 29.0 55
aRank of 60 sites with highest (1) to lowest (60) polycyclic aromatic hydrocarbon concentration.AOC¼Area of Concern; NWR¼National Wildlife Refuge; PAH¼ polycyclic aromatic hydrocarbon.
Organic contaminants in Great Lakes tree swallow nestlings Environ Toxicol Chem 36, 2017 739
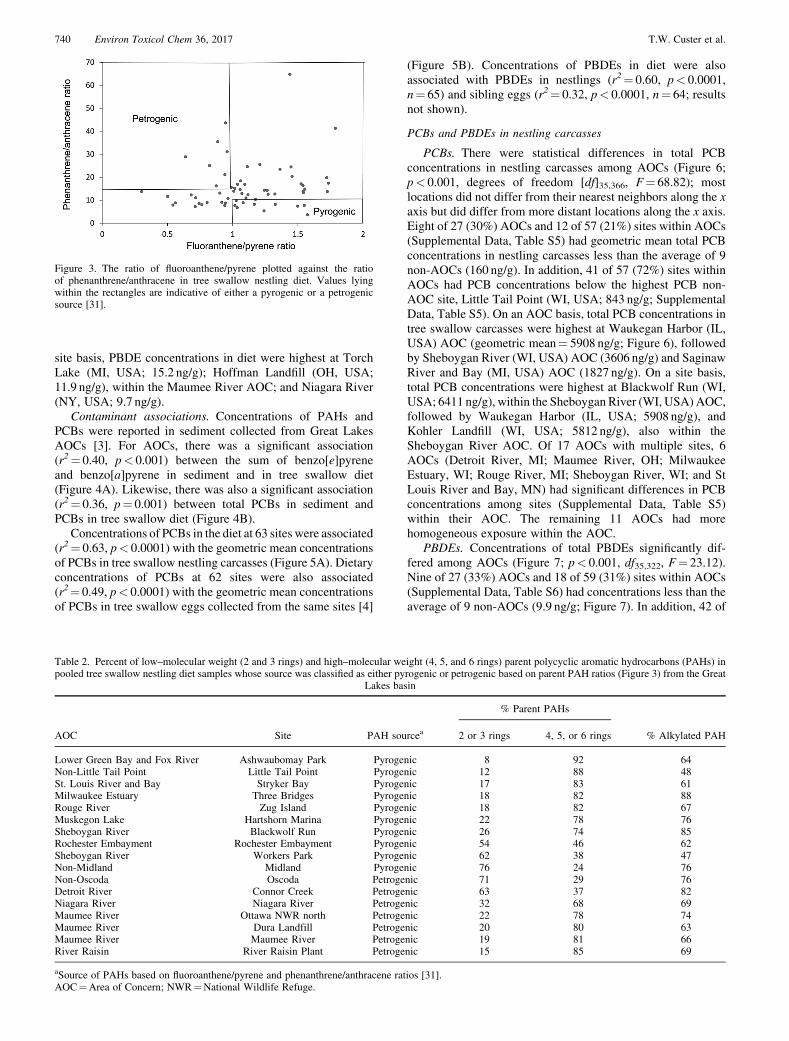
site basis, PBDE concentrations in diet were highest at TorchLake (MI, USA; 15.2 ng/g); Hoffman Landfill (OH, USA;11.9 ng/g), within the Maumee River AOC; and Niagara River(NY, USA; 9.7 ng/g).
Contaminant associations. Concentrations of PAHs andPCBs were reported in sediment collected from Great LakesAOCs [3]. For AOCs, there was a significant association(r2¼ 0.40, p< 0.001) between the sum of benzo[e]pyreneand benzo[a]pyrene in sediment and in tree swallow diet(Figure 4A). Likewise, there was also a significant association(r2¼ 0.36, p¼ 0.001) between total PCBs in sediment andPCBs in tree swallow diet (Figure 4B).
Concentrations of PCBs in the diet at 63 sites were associated(r2¼ 0.63, p< 0.0001) with the geometric mean concentrationsof PCBs in tree swallow nestling carcasses (Figure 5A). Dietaryconcentrations of PCBs at 62 sites were also associated(r2¼ 0.49, p< 0.0001) with the geometric mean concentrationsof PCBs in tree swallow eggs collected from the same sites [4]
(Figure 5B). Concentrations of PBDEs in diet were alsoassociated with PBDEs in nestlings (r2¼ 0.60, p< 0.0001,n¼ 65) and sibling eggs (r2¼ 0.32, p< 0.0001, n¼ 64; resultsnot shown).
PCBs and PBDEs in nestling carcasses
PCBs. There were statistical differences in total PCBconcentrations in nestling carcasses among AOCs (Figure 6;p< 0.001, degrees of freedom [df]35,366, F¼ 68.82); mostlocations did not differ from their nearest neighbors along the xaxis but did differ from more distant locations along the x axis.Eight of 27 (30%) AOCs and 12 of 57 (21%) sites within AOCs(Supplemental Data, Table S5) had geometric mean total PCBconcentrations in nestling carcasses less than the average of 9non-AOCs (160 ng/g). In addition, 41 of 57 (72%) sites withinAOCs had PCB concentrations below the highest PCB non-AOC site, Little Tail Point (WI, USA; 843 ng/g; SupplementalData, Table S5). On an AOC basis, total PCB concentrations intree swallow carcasses were highest at Waukegan Harbor (IL,USA) AOC (geometric mean¼ 5908 ng/g; Figure 6), followedby Sheboygan River (WI, USA) AOC (3606 ng/g) and SaginawRiver and Bay (MI, USA) AOC (1827 ng/g). On a site basis,total PCB concentrations were highest at Blackwolf Run (WI,USA; 6411 ng/g), within the Sheboygan River (WI, USA)AOC,followed by Waukegan Harbor (IL, USA; 5908 ng/g), andKohler Landfill (WI, USA; 5812 ng/g), also within theSheboygan River AOC. Of 17 AOCs with multiple sites, 6AOCs (Detroit River, MI; Maumee River, OH; MilwaukeeEstuary, WI; Rouge River, MI; Sheboygan River, WI; and StLouis River and Bay, MN) had significant differences in PCBconcentrations among sites (Supplemental Data, Table S5)within their AOC. The remaining 11 AOCs had morehomogeneous exposure within the AOC.
PBDEs. Concentrations of total PBDEs significantly dif-fered among AOCs (Figure 7; p< 0.001, df35,322, F¼ 23.12).Nine of 27 (33%) AOCs and 18 of 59 (31%) sites within AOCs(Supplemental Data, Table S6) had concentrations less than theaverage of 9 non-AOCs (9.9 ng/g; Figure 7). In addition, 42 of
Figure 3. The ratio of fluoroanthene/pyrene plotted against the ratioof phenanthrene/anthracene in tree swallow nestling diet. Values lyingwithin the rectangles are indicative of either a pyrogenic or a petrogenicsource [31].
Table 2. Percent of low–molecular weight (2 and 3 rings) and high–molecular weight (4, 5, and 6 rings) parent polycyclic aromatic hydrocarbons (PAHs) inpooled tree swallow nestling diet samples whose source was classified as either pyrogenic or petrogenic based on parent PAH ratios (Figure 3) from the Great
Lakes basin
% Parent PAHs
AOC Site PAH sourcea 2 or 3 rings 4, 5, or 6 rings % Alkylated PAH
Lower Green Bay and Fox River Ashwaubomay Park Pyrogenic 8 92 64Non-Little Tail Point Little Tail Point Pyrogenic 12 88 48St. Louis River and Bay Stryker Bay Pyrogenic 17 83 61Milwaukee Estuary Three Bridges Pyrogenic 18 82 88Rouge River Zug Island Pyrogenic 18 82 67Muskegon Lake Hartshorn Marina Pyrogenic 22 78 76Sheboygan River Blackwolf Run Pyrogenic 26 74 85Rochester Embayment Rochester Embayment Pyrogenic 54 46 62Sheboygan River Workers Park Pyrogenic 62 38 47Non-Midland Midland Pyrogenic 76 24 76Non-Oscoda Oscoda Petrogenic 71 29 76Detroit River Connor Creek Petrogenic 63 37 82Niagara River Niagara River Petrogenic 32 68 69Maumee River Ottawa NWR north Petrogenic 22 78 74Maumee River Dura Landfill Petrogenic 20 80 63Maumee River Maumee River Petrogenic 19 81 66River Raisin River Raisin Plant Petrogenic 15 85 69
aSource of PAHs based on fluoroanthene/pyrene and phenanthrene/anthracene ratios [31].AOC¼Area of Concern; NWR¼National Wildlife Refuge.
740 Environ Toxicol Chem 36, 2017 T.W. Custer et al.
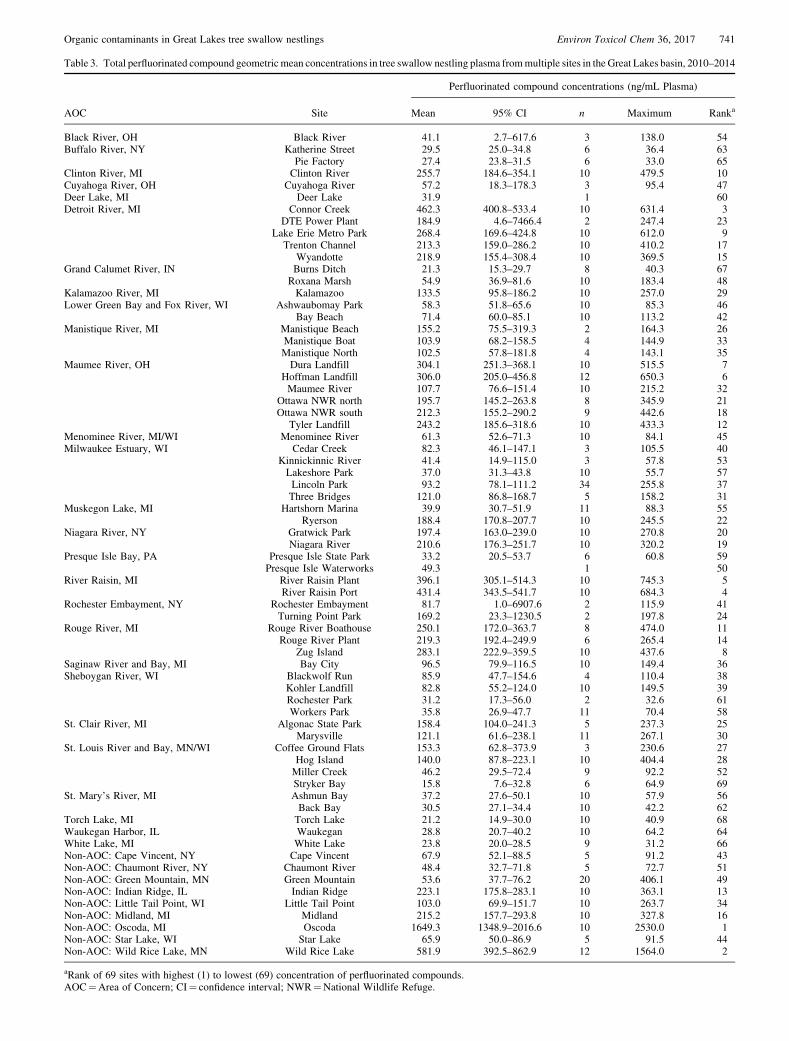
Table 3. Total perfluorinated compound geometric mean concentrations in tree swallow nestling plasma frommultiple sites in the Great Lakes basin, 2010–2014
Perfluorinated compound concentrations (ng/mL Plasma)
AOC Site Mean 95% CI n Maximum Ranka
Black River, OH Black River 41.1 2.7–617.6 3 138.0 54Buffalo River, NY Katherine Street 29.5 25.0–34.8 6 36.4 63
Pie Factory 27.4 23.8–31.5 6 33.0 65Clinton River, MI Clinton River 255.7 184.6–354.1 10 479.5 10Cuyahoga River, OH Cuyahoga River 57.2 18.3–178.3 3 95.4 47Deer Lake, MI Deer Lake 31.9 1 60Detroit River, MI Connor Creek 462.3 400.8–533.4 10 631.4 3
DTE Power Plant 184.9 4.6–7466.4 2 247.4 23Lake Erie Metro Park 268.4 169.6–424.8 10 612.0 9
Trenton Channel 213.3 159.0–286.2 10 410.2 17Wyandotte 218.9 155.4–308.4 10 369.5 15
Grand Calumet River, IN Burns Ditch 21.3 15.3–29.7 8 40.3 67Roxana Marsh 54.9 36.9–81.6 10 183.4 48
Kalamazoo River, MI Kalamazoo 133.5 95.8–186.2 10 257.0 29Lower Green Bay and Fox River, WI Ashwaubomay Park 58.3 51.8–65.6 10 85.3 46
Bay Beach 71.4 60.0–85.1 10 113.2 42Manistique River, MI Manistique Beach 155.2 75.5–319.3 2 164.3 26
Manistique Boat 103.9 68.2–158.5 4 144.9 33Manistique North 102.5 57.8–181.8 4 143.1 35
Maumee River, OH Dura Landfill 304.1 251.3–368.1 10 515.5 7Hoffman Landfill 306.0 205.0–456.8 12 650.3 6Maumee River 107.7 76.6–151.4 10 215.2 32
Ottawa NWR north 195.7 145.2–263.8 8 345.9 21Ottawa NWR south 212.3 155.2–290.2 9 442.6 18
Tyler Landfill 243.2 185.6–318.6 10 433.3 12Menominee River, MI/WI Menominee River 61.3 52.6–71.3 10 84.1 45Milwaukee Estuary, WI Cedar Creek 82.3 46.1–147.1 3 105.5 40
Kinnickinnic River 41.4 14.9–115.0 3 57.8 53Lakeshore Park 37.0 31.3–43.8 10 55.7 57Lincoln Park 93.2 78.1–111.2 34 255.8 37Three Bridges 121.0 86.8–168.7 5 158.2 31
Muskegon Lake, MI Hartshorn Marina 39.9 30.7–51.9 11 88.3 55Ryerson 188.4 170.8–207.7 10 245.5 22
Niagara River, NY Gratwick Park 197.4 163.0–239.0 10 270.8 20Niagara River 210.6 176.3–251.7 10 320.2 19
Presque Isle Bay, PA Presque Isle State Park 33.2 20.5–53.7 6 60.8 59Presque Isle Waterworks 49.3 1 50
River Raisin, MI River Raisin Plant 396.1 305.1–514.3 10 745.3 5River Raisin Port 431.4 343.5–541.7 10 684.3 4
Rochester Embayment, NY Rochester Embayment 81.7 1.0–6907.6 2 115.9 41Turning Point Park 169.2 23.3–1230.5 2 197.8 24
Rouge River, MI Rouge River Boathouse 250.1 172.0–363.7 8 474.0 11Rouge River Plant 219.3 192.4–249.9 6 265.4 14
Zug Island 283.1 222.9–359.5 10 437.6 8Saginaw River and Bay, MI Bay City 96.5 79.9–116.5 10 149.4 36Sheboygan River, WI Blackwolf Run 85.9 47.7–154.6 4 110.4 38
Kohler Landfill 82.8 55.2–124.0 10 149.5 39Rochester Park 31.2 17.3–56.0 2 32.6 61Workers Park 35.8 26.9–47.7 11 70.4 58
St. Clair River, MI Algonac State Park 158.4 104.0–241.3 5 237.3 25Marysville 121.1 61.6–238.1 11 267.1 30
St. Louis River and Bay, MN/WI Coffee Ground Flats 153.3 62.8–373.9 3 230.6 27Hog Island 140.0 87.8–223.1 10 404.4 28Miller Creek 46.2 29.5–72.4 9 92.2 52Stryker Bay 15.8 7.6–32.8 6 64.9 69
St. Mary’s River, MI Ashmun Bay 37.2 27.6–50.1 10 57.9 56Back Bay 30.5 27.1–34.4 10 42.2 62
Torch Lake, MI Torch Lake 21.2 14.9–30.0 10 40.9 68Waukegan Harbor, IL Waukegan 28.8 20.7–40.2 10 64.2 64White Lake, MI White Lake 23.8 20.0–28.5 9 31.2 66Non-AOC: Cape Vincent, NY Cape Vincent 67.9 52.1–88.5 5 91.2 43Non-AOC: Chaumont River, NY Chaumont River 48.4 32.7–71.8 5 72.7 51Non-AOC: Green Mountain, MN Green Mountain 53.6 37.7–76.2 20 406.1 49Non-AOC: Indian Ridge, IL Indian Ridge 223.1 175.8–283.1 10 363.1 13Non-AOC: Little Tail Point, WI Little Tail Point 103.0 69.9–151.7 10 263.7 34Non-AOC: Midland, MI Midland 215.2 157.7–293.8 10 327.8 16Non-AOC: Oscoda, MI Oscoda 1649.3 1348.9–2016.6 10 2530.0 1Non-AOC: Star Lake, WI Star Lake 65.9 50.0–86.9 5 91.5 44Non-AOC: Wild Rice Lake, MN Wild Rice Lake 581.9 392.5–862.9 12 1564.0 2
aRank of 69 sites with highest (1) to lowest (69) concentration of perfluorinated compounds.AOC¼Area of Concern; CI¼ confidence interval; NWR¼National Wildlife Refuge.
Organic contaminants in Great Lakes tree swallow nestlings Environ Toxicol Chem 36, 2017 741
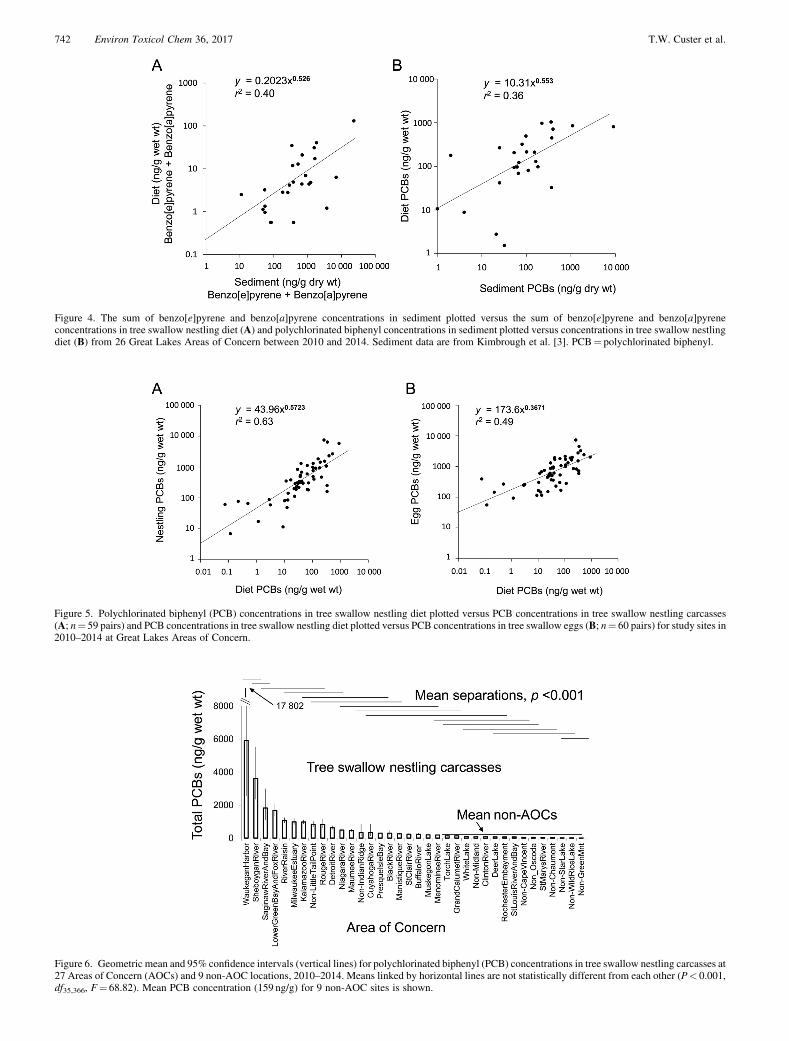
Figure 4. The sum of benzo[e]pyrene and benzo[a]pyrene concentrations in sediment plotted versus the sum of benzo[e]pyrene and benzo[a]pyreneconcentrations in tree swallow nestling diet (A) and polychlorinated biphenyl concentrations in sediment plotted versus concentrations in tree swallow nestlingdiet (B) from 26 Great Lakes Areas of Concern between 2010 and 2014. Sediment data are from Kimbrough et al. [3]. PCB¼ polychlorinated biphenyl.
Figure 5. Polychlorinated biphenyl (PCB) concentrations in tree swallow nestling diet plotted versus PCB concentrations in tree swallow nestling carcasses(A; n¼ 59 pairs) and PCB concentrations in tree swallow nestling diet plotted versus PCB concentrations in tree swallow eggs (B; n¼ 60 pairs) for study sites in2010–2014 at Great Lakes Areas of Concern.
Figure 6. Geometric mean and 95% confidence intervals (vertical lines) for polychlorinated biphenyl (PCB) concentrations in tree swallow nestling carcasses at27 Areas of Concern (AOCs) and 9 non-AOC locations, 2010–2014. Means linked by horizontal lines are not statistically different from each other (P< 0.001,df35,366, F¼ 68.82). Mean PCB concentration (159 ng/g) for 9 non-AOC sites is shown.
742 Environ Toxicol Chem 36, 2017 T.W. Custer et al.
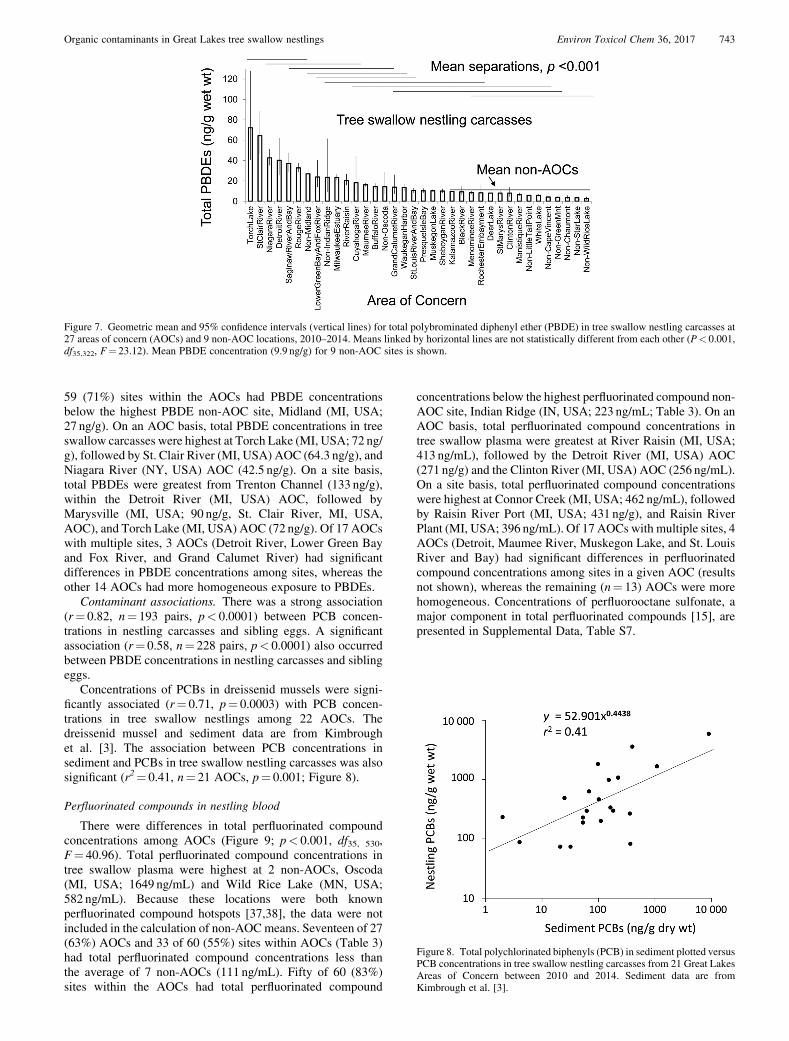
59 (71%) sites within the AOCs had PBDE concentrationsbelow the highest PBDE non-AOC site, Midland (MI, USA;27 ng/g). On an AOC basis, total PBDE concentrations in treeswallow carcasses were highest at Torch Lake (MI, USA; 72 ng/g), followed by St. Clair River (MI, USA) AOC (64.3 ng/g), andNiagara River (NY, USA) AOC (42.5 ng/g). On a site basis,total PBDEs were greatest from Trenton Channel (133 ng/g),within the Detroit River (MI, USA) AOC, followed byMarysville (MI, USA; 90 ng/g, St. Clair River, MI, USA,AOC), and Torch Lake (MI, USA) AOC (72 ng/g). Of 17 AOCswith multiple sites, 3 AOCs (Detroit River, Lower Green Bayand Fox River, and Grand Calumet River) had significantdifferences in PBDE concentrations among sites, whereas theother 14 AOCs had more homogeneous exposure to PBDEs.
Contaminant associations. There was a strong association(r¼ 0.82, n¼ 193 pairs, p< 0.0001) between PCB concen-trations in nestling carcasses and sibling eggs. A significantassociation (r¼ 0.58, n¼ 228 pairs, p< 0.0001) also occurredbetween PBDE concentrations in nestling carcasses and siblingeggs.
Concentrations of PCBs in dreissenid mussels were signi-ficantly associated (r¼ 0.71, p¼ 0.0003) with PCB concen-trations in tree swallow nestlings among 22 AOCs. Thedreissenid mussel and sediment data are from Kimbroughet al. [3]. The association between PCB concentrations insediment and PCBs in tree swallow nestling carcasses was alsosignificant (r2¼ 0.41, n¼ 21 AOCs, p¼ 0.001; Figure 8).
Perfluorinated compounds in nestling blood
There were differences in total perfluorinated compoundconcentrations among AOCs (Figure 9; p< 0.001, df35, 530,F¼ 40.96). Total perfluorinated compound concentrations intree swallow plasma were highest at 2 non-AOCs, Oscoda(MI, USA; 1649 ng/mL) and Wild Rice Lake (MN, USA;582 ng/mL). Because these locations were both knownperfluorinated compound hotspots [37,38], the data were notincluded in the calculation of non-AOCmeans. Seventeen of 27(63%) AOCs and 33 of 60 (55%) sites within AOCs (Table 3)had total perfluorinated compound concentrations less thanthe average of 7 non-AOCs (111 ng/mL). Fifty of 60 (83%)sites within the AOCs had total perfluorinated compound
concentrations below the highest perfluorinated compound non-AOC site, Indian Ridge (IN, USA; 223 ng/mL; Table 3). On anAOC basis, total perfluorinated compound concentrations intree swallow plasma were greatest at River Raisin (MI, USA;413 ng/mL), followed by the Detroit River (MI, USA) AOC(271 ng/g) and the Clinton River (MI, USA) AOC (256 ng/mL).On a site basis, total perfluorinated compound concentrationswere highest at Connor Creek (MI, USA; 462 ng/mL), followedby Raisin River Port (MI, USA; 431 ng/g), and Raisin RiverPlant (MI, USA; 396 ng/mL). Of 17 AOCs with multiple sites, 4AOCs (Detroit, Maumee River, Muskegon Lake, and St. LouisRiver and Bay) had significant differences in perfluorinatedcompound concentrations among sites in a given AOC (resultsnot shown), whereas the remaining (n¼ 13) AOCs were morehomogeneous. Concentrations of perfluorooctane sulfonate, amajor component in total perfluorinated compounds [15], arepresented in Supplemental Data, Table S7.
Figure 7. Geometric mean and 95% confidence intervals (vertical lines) for total polybrominated diphenyl ether (PBDE) in tree swallow nestling carcasses at27 areas of concern (AOCs) and 9 non-AOC locations, 2010–2014. Means linked by horizontal lines are not statistically different from each other (P< 0.001,df35,322, F¼ 23.12). Mean PBDE concentration (9.9 ng/g) for 9 non-AOC sites is shown.
Figure 8. Total polychlorinated biphenyls (PCB) in sediment plotted versusPCB concentrations in tree swallow nestling carcasses from 21 Great LakesAreas of Concern between 2010 and 2014. Sediment data are fromKimbrough et al. [3].
Organic contaminants in Great Lakes tree swallow nestlings Environ Toxicol Chem 36, 2017 743
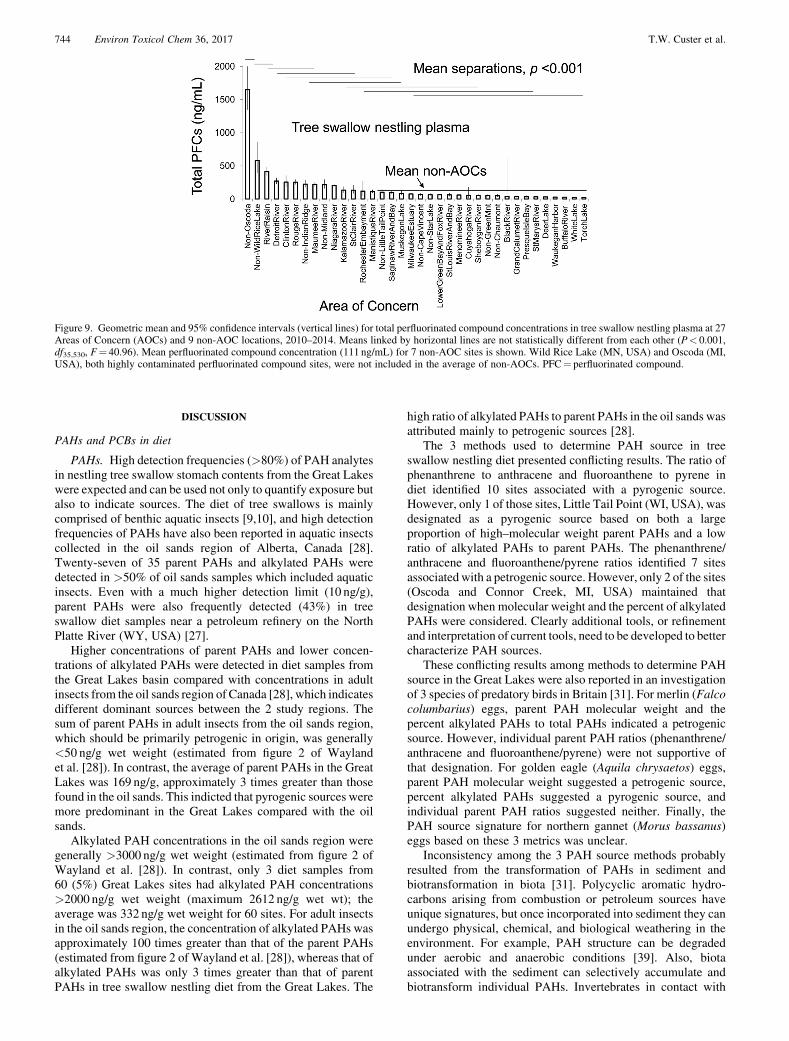
DISCUSSION
PAHs and PCBs in diet
PAHs. High detection frequencies (>80%) of PAH analytesin nestling tree swallow stomach contents from the Great Lakeswere expected and can be used not only to quantify exposure butalso to indicate sources. The diet of tree swallows is mainlycomprised of benthic aquatic insects [9,10], and high detectionfrequencies of PAHs have also been reported in aquatic insectscollected in the oil sands region of Alberta, Canada [28].Twenty-seven of 35 parent PAHs and alkylated PAHs weredetected in >50% of oil sands samples which included aquaticinsects. Even with a much higher detection limit (10 ng/g),parent PAHs were also frequently detected (43%) in treeswallow diet samples near a petroleum refinery on the NorthPlatte River (WY, USA) [27].
Higher concentrations of parent PAHs and lower concen-trations of alkylated PAHs were detected in diet samples fromthe Great Lakes basin compared with concentrations in adultinsects from the oil sands region of Canada [28], which indicatesdifferent dominant sources between the 2 study regions. Thesum of parent PAHs in adult insects from the oil sands region,which should be primarily petrogenic in origin, was generally<50 ng/g wet weight (estimated from figure 2 of Waylandet al. [28]). In contrast, the average of parent PAHs in the GreatLakes was 169 ng/g, approximately 3 times greater than thosefound in the oil sands. This indicted that pyrogenic sources weremore predominant in the Great Lakes compared with the oilsands.
Alkylated PAH concentrations in the oil sands region weregenerally >3000 ng/g wet weight (estimated from figure 2 ofWayland et al. [28]). In contrast, only 3 diet samples from60 (5%) Great Lakes sites had alkylated PAH concentrations>2000 ng/g wet weight (maximum 2612 ng/g wet wt); theaverage was 332 ng/g wet weight for 60 sites. For adult insectsin the oil sands region, the concentration of alkylated PAHs wasapproximately 100 times greater than that of the parent PAHs(estimated from figure 2 of Wayland et al. [28]), whereas that ofalkylated PAHs was only 3 times greater than that of parentPAHs in tree swallow nestling diet from the Great Lakes. The
high ratio of alkylated PAHs to parent PAHs in the oil sands wasattributed mainly to petrogenic sources [28].
The 3 methods used to determine PAH source in treeswallow nestling diet presented conflicting results. The ratio ofphenanthrene to anthracene and fluoroanthene to pyrene indiet identified 10 sites associated with a pyrogenic source.However, only 1 of those sites, Little Tail Point (WI, USA), wasdesignated as a pyrogenic source based on both a largeproportion of high–molecular weight parent PAHs and a lowratio of alkylated PAHs to parent PAHs. The phenanthrene/anthracene and fluoroanthene/pyrene ratios identified 7 sitesassociatedwith a petrogenic source. However, only 2 of the sites(Oscoda and Connor Creek, MI, USA) maintained thatdesignation when molecular weight and the percent of alkylatedPAHs were considered. Clearly additional tools, or refinementand interpretation of current tools, need to be developed to bettercharacterize PAH sources.
These conflicting results among methods to determine PAHsource in the Great Lakes were also reported in an investigationof 3 species of predatory birds in Britain [31]. For merlin (Falcocolumbarius) eggs, parent PAH molecular weight and thepercent alkylated PAHs to total PAHs indicated a petrogenicsource. However, individual parent PAH ratios (phenanthrene/anthracene and fluoroanthene/pyrene) were not supportive ofthat designation. For golden eagle (Aquila chrysaetos) eggs,parent PAH molecular weight suggested a petrogenic source,percent alkylated PAHs suggested a pyrogenic source, andindividual parent PAH ratios suggested neither. Finally, thePAH source signature for northern gannet (Morus bassanus)eggs based on these 3 metrics was unclear.
Inconsistency among the 3 PAH source methods probablyresulted from the transformation of PAHs in sediment andbiotransformation in biota [31]. Polycyclic aromatic hydro-carbons arising from combustion or petroleum sources haveunique signatures, but once incorporated into sediment they canundergo physical, chemical, and biological weathering in theenvironment. For example, PAH structure can be degradedunder aerobic and anaerobic conditions [39]. Also, biotaassociated with the sediment can selectively accumulate andbiotransform individual PAHs. Invertebrates in contact with
Figure 9. Geometric mean and 95% confidence intervals (vertical lines) for total perfluorinated compound concentrations in tree swallow nestling plasma at 27Areas of Concern (AOCs) and 9 non-AOC locations, 2010–2014. Means linked by horizontal lines are not statistically different from each other (P< 0.001,df35,530, F¼ 40.96). Mean perfluorinated compound concentration (111 ng/mL) for 7 non-AOC sites is shown. Wild Rice Lake (MN, USA) and Oscoda (MI,USA), both highly contaminated perfluorinated compound sites, were not included in the average of non-AOCs. PFC¼ perfluorinated compound.
744 Environ Toxicol Chem 36, 2017 T.W. Custer et al.
PAH-contaminated sediment can incorporate individual PAHsthrough ingestion or contact with the water [40].
Concentrations of PAHs in diet were sufficiently elevatedat many of the AOCs to be expected to induce hepatic mono-oxygenase activity in tree swallow nestlings. Exposure to PAHshas been linked to induced hepatic monooxygenase activity inbirds [23]; total parent PAHs in the diet of tree swallows nestingnear a petroleum refinery on the Platte River (Casper, WY,USA) averaged 280 ng/g [27], and mean hepatic monooxyge-nase activity was 9 times greater near the petroleum site than at acomparable reference site. Of the sites in the Great Lakes, 6had parent PAHs in diet >280 ng/g (Table 2), so an elevationof hepatic monooxygenase activity in swallows is postulated.Finally, an association between PAH concentrations andethoxyresorufin-O-deethylase activity in tree swallow nestl-ings measured in the oil sands region of Canada was alsosuggested [41].
PCBs. Concentrations of PCBs in the diet samples wereelevated at some of the Great Lakes sites but modest comparedwith sites at other locations considered highly PCB-contami-nated (e.g., Housatonic and Hudson Rivers). Concentrations ofPCBs in diet in the present study averaged 103 ng/g wet weight.At the most contaminated individual site in the present study,PCBs were 7 to 20 times lower than concentrations in insectprey fed to tree swallow nestlings from 2 sites on the HudsonRiver (NY, USA), which averaged 6700 ng/g and 18 000 ng/gwet weight [42]. In addition, PCB concentrations in stomachcontents of tree swallow nestlings from 1 site on the PCB-contaminated Housatonic River (MA, USA) varied from5630 ng/g to 8800 ng/g wet weight over 3 yr [43] and were>50 times higher than the average diet concentration in thepresent study.
Perfluorinated compounds, PCBs, and PBDEs in nestlings
Perfluorinated compounds. The range of perfluorinatedcompound concentrations in tree swallow nestling plasma atGreat Lakes AOCs was comparable to 10 sites inMinnesota andWisconsin sampled between 2007 and 2011 [19]. Concen-trations of perfluorinated compounds in tree swallow nestlingplasma varied in Minnesota and Wisconsin from 14 ng/mL(North Bass Lake, a remote site in north central Wisconsin,USA) to 437 ng/mL (Pigs Eye Lake, MN, USA) [19] on theMississippi River near the Twin Citiesmetro area. AmongGreatLakes AOC sites, total perfluorinated compounds in treeswallow nestling plasma varied from 16 ng/mL at Stryker Baylocated within the St. Louis River AOC near Duluth (MN,USA), which was similar to remote areas in the upper Midwestto 462 ng/mL at Connor Creek within the Detroit River (MI,USA) AOC, which was similar to areas adjacent to large urbanareas in Michigan and Wisconsin.
Two non-AOCs, Oscoda (MI, USA) and Wild RiceLake (MN, USA), had the highest total perfluorinated com-pound concentrations in plasma, measuring 1649 ng/mL and582 ng/mL, respectively; and both sites were associated withairport fire-training facilities. The site near Oscoda (MI, USA)was associated with Wurtsmith Air Force Base, where aqueousfilm-foaming firefighting foams, whose key componentsincluded perfluorinated compounds, were used as part of fire-training exercises. Even though Wurtsmith Air Force Base wasdecommissioned in 1993, measurable quantities of perfluori-nated compounds were present in groundwater 5 or more yearslater [37]. Wild Rice Lake potentially received runoff from afire-training site at what is now the Duluth InternationalAirport [38].
Results of laboratory studies do not suggest adversereproductive effects even at Oscoda (MI, USA), a non-AOC,where the mean perfluorooctane sulfonate concentration inplasma was 1324 ng/mL (maximum 1840 ng/mL; SupplementalData, Table S7). This value surpassed a no-observable-adverse-effects level for perfluorooctane sulfonate concentrations inplasma (1000 ng/mL) and approached the avian toxicityreference value (1700 ng/mL) calculated from a bobwhite quail(Colinus virginianus) feeding study [44]. Another investigationestimated an even higher perfluorooctane sulfonate toxicityreference value in serum (9000 ng/mL) [45].
Based on a field investigation [19], however, the high plasmaperfluorinated compound concentrations at Oscoda (MI, USA)non-AOC (1649 ng/mL),Wild Rice Lake (MN,USA) non-AOC(582 ng/mL), Connor Creek, Detroit River (MI, USA) AOC(462 ng/mL), and the 2 sites on the Raisin River (MI, USA)AOC (305 ng/mL and 343 ng/mL) are suggestive of potentialreproductive impairment. In that reproductive study [19],elevated perfluorinated compound concentrations in treeswallow eggs from the Mississippi River were associatedwith lower hatching success. Total perfluorinated compoundplasma concentrations from nestlings at the most contami-nated site on the Mississippi River averaged 352 ng/mL and437 ng/mL over 2 yr. Because excessive egg failures were notobserved at Oscoda (MI, USA) in 2014 and 2015 (T.W. Custer,personal observation), there is little support for the adverseeffects predicted by that single field study; and the laboratorytoxicity reference value and no-observable-adverse-effectslevel values seem appropriate guidelines. Further evaluationof reproduction at Oscoda (MI, USA) is under way.
PCBs. The nestling PCB results from the Great Lakesreinforce conclusions of a companion investigation of con-taminants in eggs [4] where elevated PCB concentrations werereported but were much lower than recorded at known PCBhotspots. Concentrations of PCBs in nestling carcasses in thepresent study varied among sites from 7 ng/g at GreenMountain(MN, USA), a non-AOC site, to 6411 ng/g at Blackwolf Run(Sheboygan, WI, USA) AOC. Mean concentrations of totalPCBs in tree swallow nestling carcasses from 12 NorthAmerican sites varied from 10 ng/g to 16 300 ng/g [46]. Evenhigher exposures to PCBs were documented in 1995 at the PCB-contaminated Hudson River (NY, USA), where geometric meanPCB concentrations were 48 000 ng/g in 10-d-old nestlingcarcasses [42], and the Housatonic River (MA, USA) in 1998,where geometric mean PCB concentrations in 12-d-old nestlingcarcasses were 44 660 ng/g [43].
Given the strong association between PCBs in diet andnestlings on a site basis (Figure 5A), it is not surprising that theranking of PCB concentrations in diet were concordant with theranking in nestlings on an AOC basis. However, Manistique(MI, USA) AOC was an exception. At Manistique, PCBconcentrations in diet were the highest of all AOCs but onlyranked 15th among AOCs in PCB concentrations in nestlings.It is unknown why this occurred. Manistique is unusual inthat it was the only AOC among the 27 AOCs where totalPCB concentrations measured in the diet (335 ng/gwetwt)were greater than PCBs measured in nestling carcasses(267 ng/gwetwt). Also, the Manistique diet sample was apool of only 3 stomach contents, whereas the average numberof stomach contents was 8 per sample. It is possible that theinsects that were being consumed on the days the diet sampleswere collected were by chance more highly exposed to PCBsthan the insects consumed over the entire 12 d of nestlingexposure.
Organic contaminants in Great Lakes tree swallow nestlings Environ Toxicol Chem 36, 2017 745
PBDEs. We are aware of only 1 other study in which PBDEconcentrations were reported in tree swallow nestlings. Gallo(2011, Master’s thesis, University of Illinois at Urbana-Champaign, Urbana-Champaign, IL, USA) reported meanPBDE concentrations in tree swallow nestlings of 30 ng/g(maximum¼ 60 ng/g) and 62.5 ng/g (maximum¼ 219 ng/g) atIndian Ridge Marsh (IL, USA) in 2004 and 2005. Concen-trations of PBDEs in tree swallow nestlings at Indian Ridgereported in the present study were comparable; mean PBDEconcentrations were 24 ng/g (maximum¼ 60 ng/g). TotalPBDEs, based on nestling and diet information from thepresent study and egg data [4], all suggest there is little cause forconcern about this chemical from an AOC perspective.
The ranking of AOCs and individual sites by PCB and PBDEconcentrations in nestlings was similar to the rankings usingegg concentrations [4]. For example, 6 of the most PCB-contaminated sites based on egg concentrations were among thetop 10 most contaminated sites for nestlings. For PBDEs, 4 ofthe most PBDE-contaminated sites based on egg concentrationswere among the top 10 most contaminated sites for nestlings.These results are not surprising given the strong associationbetween nestlings and sibling eggs for PCB and PBDEconcentrations.
Tree swallows as indicators of sediment contamination
The high correlations in organic contaminant concentrationsbetween nestlings and sediment of the present study furthersupport the premise that contaminant exposure in nesting treeswallows is principally sediment-based. It is well documentedthat the tree swallow diet is mainly composed of adult aquaticinsects [9,10] whose immature life stages are exposed tocontaminants in the sediment. Also, a significant relationshiphas been documented between PCB concentrations in sedimentand tree swallow eggs and nestlings [4,47], indicating that bothmatrices can be used equally well.
An important outcome of spatial assessments is ranking ofcontaminated areas to prioritize future remediation andmanagement activities [26]. Our results add to earlier bioticattempts to rank contamination among Great Lakes AOCs. Inthe present study, AOCs were ranked based on each of thecontaminants measured in the tree swallow nestling diet (PAHs,PCBs, PBDEs) and nestling carcasses (PCBs, PBDEs,perfluorinated compounds). Rankings based on tree swallowegg concentrations included organochlorine pesticides, PCBs,PBDEs, dioxins, and furans [4]. Finally, trace elements,organochlorine pesticides, PCBs, and PAHs were measuredand ranked for zebra mussels (Dreissena polymorpha) andquagga mussels (Dreissena rostriformis bugensis)amongAOCs [3]. All 3 biotic matrices can be used together forAOC-specific assessment predictions of contaminant exposureat various trophic levels. In addition, lake-wide or regionalcontaminant concentration rankings based on young of the yearspot-tailed shiners (Notropis hudsonius) [48] and herring gulleggs [5] are available, but these do not necessarily reflectconditions within a specific AOC.
Because contaminant concentrations in tree swallow tissuesreflect local sediment contamination (�1 km around their nestbox), 1 site may not always be representative of an entire AOC,especially for large (e.g., Saginaw River) or complicated (e.g.,Clinton River) AOCs with multiple tributaries or sources ofcontamination. Of 17 AOCs with multiple sites, 6 (�35%) hadsignificant differences among sites in PCB concentrations,3 (�18%) had significant differences among sites in PBDEconcentrations, and 4 (�24%) had significant differences
among sites in perfluorinated compound concentrations. Forexample, within the Maumee River (OH, USA) AOC, PCBconcentrations increased downriver on the Ottawa River (OH,USA) from Tyler Landfill (mean¼ 308 ng/g PCBs) to DuraLandfill (470 ng/g) to Hoffman Landfill (941 ng/g). Concen-trations of PCBs were significantly greater (Supplemental Data,Table S5) at Hoffman Landfill than Tyler Landfill, despiteHoffman Landfill being only 3 km downriver. The Ottawa Riveris roughly 20m to 40m wide near Tyler and Dura Landfills andis formed into a small pool (�250m wide) near HoffmanLandfill before going through a restricted bridge overpass. Wesuspect that contaminated sediment moving downriver formsdeposits in the pool, resulting in higher PCB concentrations insediment and subsequently nestling tree swallows. In anothersituation, perfluorinated compound concentrations were signifi-cantly higher at Ryerson (188mg/mL) than at HartshornMarina(40 ng/mL), which were 2 sites separated by 3.4 km in theMuskegon Lake (MI, USA) AOC. These 2 sites, however, donot have a direct hydrologic connection such as the connectionbetween the 3 landfill sites on the Ottawa River. Contaminationfrom Ryerson Creek, a small tributary which entered MuskegonLake where the nest boxes were located, may have beenresponsible for the local increase in perfluorinated compounds.The hydrologic connections and patterns, as well as potentialcontaminant sources, should be understood when interpretingtree swallow results beyond their foraging range.
CONCLUSIONS
Concentrations of PAHs and PCBs, 2 chemicals of concernused in the designation of AOCs, were below the meanconcentration of non-AOC reference sites at many of the 27AOCs investigated. These findings suggest that less emphasisshould be placed on remediation for PAHs and PCBs at theseAOCs. Concentrations of PAHs in tree swallow diet at 67% ofthe AOCs were below the mean PAH concentration for non-AOCs. Nonetheless, 2 field studies [27,41] suggest that PAHsin diet were sufficiently elevated at some of the more highlyPAH-exposed AOCs to induce hepatic monooxygenase activityin tree swallow nestlings. Nestling carcass PCB concentrationswere elevated at many of the Great Lakes AOCs studied. Only30% of AOCs had PCB concentrations in nestling carcassesbelow the concentration in non-AOCs. However, exposure toPCBs was modest compared with sites outside of the GreatLakes region that are considered highly PCB-contaminated andwhere reproductive effects have been documented.
Concentrations of perfluorinated compounds and PBDEs(not included in the designation of AOCs) were belowconcentrations found at non-AOCs. Specifically, nestlingplasma perfluorinated compound concentrations at 63% ofAOCs investigated were below the mean perfluorinatedcompound concentration for non-AOCs. Concentrations ofperfluorooctane sulfonate, a major contributor to total per-fluorinated compounds, were the highest at the River Raisin(MI, USA) AOC (geometric mean 330 ng/mL) but well belowan estimated toxicity reference value (1700 ng/mL). Nestlingcarcass PBDE concentrations in 33% of AOCs were below themean concentration in non-AOCs.
Significant associations were found for PCB and PAHconcentrations among nestling diet, nestling carcasses (PCBonly), and sediment. These results strengthen the utility of usingcontaminant concentrations in nestling carcasses to monitor themovement of sediment contamination to a terrestrial insectivorethat primarily feeds on the aerial stages of benthic invertebrates.
746 Environ Toxicol Chem 36, 2017 T.W. Custer et al.
Overall, the findings of the present study will assist in theevaluation and remediation of AOCs in the Great Lakes.
Supplemental Data—The Supplemental Data are available on the WileyOnline Library at DOI: 10.1002/etc.3598.
Acknowledgment—The present study was funded by the Great LakesRestoration Initiative, the US Environmental Protection Agency, theMichigan Department of Environmental Quality, and the US GeologicalSurvey. We thank C. Balk, G. Berner, C. Bole, P. Boone, R. Booth, Jr., A.Bosak, A. Haertel, A. Heimann, Y. Hernandez, M. Iverson, M. Larkin,A. Lorenz, S. O’Mara, R. Mayer, P. McKann, K. McMullen, M. Meier, K.Mott, K. Prestby, D. Ripp, P. Ripple, C. Schneider, L. Solem,D. Tagerson, J.TeSlaa, J. Tschaikovsky, M.Weber, and T. Zimmerman for field assistance;K. Murray for contracting assistance; state personnel from Minnesota,Wisconsin, Illinois, Indiana, Ohio, Michigan, Pennsylvania, and New Yorkfor help obtaining collecting permits; and J. Waide, B. Rattner, and 4anonymous reviewers for comments on earlier drafts of the manuscript. Thepresent study could not have been conducted without the access granted bythe following landowners: cities of Ashwaubenon, WI; Chicago, IL;Douglas, MI; Duluth, MN; Green Bay, WI; Manistique, MI; Marysville,MI; Milwaukee, WI; Monroe, MI; Muskegon, MI; North Tonawanda, NY;Portage, IN; Rochester, NY; Sault St. Marie, MI; Sheboygan, WI;Sheboygan Falls, WI; Superior, WI; Toledo, OH; Whitehall, MI; andWyandotte, MI. We also thank Algonac State Park; Allete Energy; K.Aukerman; C. Balk; Bay City Waste Water Treatment Plant; Bay MillsIndian Community; BNSF Railroad; Rod Booth, Jr.; Buffalo UrbanDevelopment Corp.; Cedarburg Waste Water Treatment Plant; ChippewaNature Center; Cleveland MetroParks; Commercial Heat Treating; DetroitWater and Sewerage; DTE Energy; Eagles Club Restaurant; Erie County,NY; Erie, PA, Waterworks; Fruitland Township; Fibrek; Hallett Dock;Hank Aaron State Trail; Honeywell; Horseshoe Casino; state of Indiana(Roxana Marsh); Ironhead Marine; KK Integrated Logistics; KohlerCompany; LaFarge; Lake Erie MetroPark, MI; Lakeshore State Park,WI; C. Larscheid; Lorain Port Authority; Macomb County; ManistiquePaper; Martineau and Morris Contracting; Mayline; Milwaukee CountyDepartment of Parks, Recreation and Culture; MI Department of NaturalResources (Deer Lake and Algonac State Park); Minnesota Department ofNatural Resources (Green Mountain); National Gypsum; H. Nelson; NewPage Paper; New York State Parks (Niagara Falls, NY); Port of Monroe;Presque Isle State Park; River Wildlife; C. Schneider; R. Seichter;Sheboygan Monument; L. Solem; Stimm Associates; True NorthArchitecture and Construction; US Fish and Wildlife Service (OttawaNational Wildlife Refuge); US Forest Service (Huron Manistee NationalForest); Van Riper State Park; and Wisconsin Department of NaturalResources (Star Lake).
Disclaimer—The authors declare that they have no conflict of interest. Anyuse of trade, firm, or product names is for descriptive purposes only and doesnot imply endorsement by the US government.
Data availability—Data are available on request. Please contact thecorresponding author ([email protected]).
REFERENCES
1. US Environmental Protection Agency. 2012. Great Lakes WaterQuality Agreement (GLWQA). [cited 2016March 22]. Available from:http://www.epa.gov/greatlakes/glwqa/.
2. Allan RJ, Ball AJ, Cairns VW, Fox GA, Gilman AP, Peakall DB,Piekarz DA, Van Oosdam JC, Villeneuve DC, Williams DT. 1991.Toxic Chemicals in the Great Lakes and Associated Effects, Vols 1 and2. Environment Canada, Department of Fisheries and Oceans, Healthand Welfare Canada, Ottawa, Canada.
3. Kimbrough K, Johnson WE, Jacob A, Edwards M, Davenport E,Lauenstein G, Nlepa T, Fulton M, Pait A. 2014. Mussel Watch GreatLakes contaminant monitoring and assessment: Phase 1. NOAATechnical Memorandum NOS NCCOS 180. National Oceanic andAtmospheric Administration, Silver Spring, MD, USA.
4. Custer CM, Custer TW, Dummer PM, Goldberg D, Franson JC. 2016.Concentrations and spatial patterns of organic contaminants in treeswallow (Tachycineta bicolor) eggs at US and binational GreatLakes areas of concern, 2010–2015. Environ Toxicol Chem35:3071–3092.
5. Weseloh DV, Pekarik C, de Solla SR. 2006. Spatial patterns andrankings of contaminant concentrations in herring gull eggs from 15
sites in the Great Lakes and connecting channels, 1998–2002. EnvironMonit Assess 113:265–284.
6. Winkler DW, Hallinger KK, Ardia DR, Robertson RJ, Stutchbury BJ,Cohen RR. 2011. Tree swallow (Tachycineta bicolor). In Poole A, ed,The Birds of North America Online. Cornell Lab of Ornithology, Ithaca,NY, USA. [cited 2016 March 22]. Available from: http://bna.birds.cornell.edu/bna/species/011
7. Custer CM. 2011. Swallows as a sentinel species for contaminantexposure and effect studies. In Elliott JE, Bishop CA, Morrissey CA,eds, Wildlife Ecotoxicology: Forensic Approaches, Vol 3—EmergingTopics in Ecotoxicology. Springer, New York, NY, USA, pp 45–91.
8. Stapleton MK, Robertson RJ. 2006. Female tree swallow home-rangemovements during their fertile period as revealed by radio-tracking.Wilson J Ornithol 118:502–507.
9. Blancher PJ, McNicol DK. 1991. Tree swallow diet in relation towetland acidity. Can J Zool 69:2629–2637.
10. Mengelkoch JM, Niemi GJ, Regal RR. 2004. Diet of the nestling treeswallow. Condor 106:423–429.
11. Golden NH, Rattner BA. 2003. Ranking terrestrial vertebrate speciesfor utility in biomonitoring and vulnerability to environmentalcontaminants. Rev Environ Contam Toxicol 176:67–136.
12. Luross JM, AlaeeM, Sergeant DB, Cannon CM,Whittle DM, SolomonKR, Muir DC. 2002. Spatial distribution of polybrominated diphenylethers and polybrominated biphenyls in lake trout from the LaurentianGreat lakes. Chemosphere 46:665–672.
13. Gauthier LT, Hebert CE, Weseloh DC, Letcher RJ. 2008. Dramaticchanges in the temporal trends of polybrominated diphenyl ethers(PBDEs) in herring gull eggs from the Laurentian Great Lakes: 1982–2006. Environ Sci Technol 42:1524–1530.
14. Gebbink WA, Hebert CE, Letcher RJ. 2009. Perfluorinated carbox-ylates and sulfonates and precursor compounds in herring gull eggsfrom colonies spanning the Laurentian Great Lakes of North America.Environ Sci Technol 43:7443–7449.
15. Kannan K, Tao L, Sinclair E, Pastva SD, Jude DJ, Giesy JP. 2005.Perfluorinated compounds in aquatic organisms at various trophiclevels in a Great Lakes food chain. Arch Environ Contam Toxicol48:559–566.
16. Rattner BA, Lazarus RS, Heinz GH, Karouna-Renier NK, SchultzSL, Hale RC. 2013. Comparative embryotoxicity of a pentabro-minated diphenyl ether mixture to common terns (Sterna hirundo)and American kestrels (Falco sparverius). Chemosphere 93:441–447.
17. Henny CJ, Kaiser JL, Grove RA, Johnson BL, Letcher RJ. 2009.Polybrominated diphenyl ether flame retardants in eggs may reducereproductive success of ospreys in Oregon and Washington, USA.Ecotoxicology 18:802–813.
18. Custer CM, Custer TW, Schoenfuss HL, Poganski BH, Solem L. 2012.Exposure and effects of perfluoroalkyl compounds on tree swallowsnesting at Lake Johanna in east central Minnesota, USA. ReprodToxicol 33:556–562.
19. Custer CM, Custer TW, Dummer PM, Etterson MA, Thogmartin WE,Wu Q, Kannan K, Trowbridge A, McKann PC. 2014. Exposure andeffects of perfluoroalkyl substances in tree swallows nesting inMinnesota and Wisconsin, USA. Arch Environ Contam Toxicol66:120–138.
20. Hoff PT, Van de Vijver K, Dauwe T, Covaci A, Maervoet J, Eens M,Blust R, De CoenW. 2005. Evaluation of biochemical effects related toperfluorooctane sulfonic acid exposure in organohalogen-contaminatedgreat tit (Parus major) and blue tit (Parus caeruleus) nestlings.Chemosphere 61:1558–1569.
21. Michot TC, Custer TW, Nault AJ, Mitchell CA. 1994. Environmentalcontaminants in redheads wintering in coastal Louisiana and Texas.Arch Environ Contam Toxicol 26:425–434.
22. Custer TW, Custer CM, Hines RK, Sparks DW, Melancon MJ,Hoffman DJ, Bickham JW, Wickliffe JK. 2000. Mixed-functionoxygenases, oxidative stress, and chromosomal damage measured inlesser scaup wintering on the Indiana Harbor Canal. Arch EnvironContam Toxicol 38:522–529.
23. Head JA, Jeffery RW, Farmahin R, Kennedy SW. 2015. Potency ofpolycyclic aromatic hydrocarbons (PAHs) for induction of ethoxyr-esorufin-O-deethylase (EROD) activity in hepatocyte cultures fromchicken, Pekin duck, and greater scaup. Environ Sci Technol49:3787–3794.
24. N€af C, Broman D, Brunström B. 1992. Distribution and metabolism ofpolycyclic aromatic hydrocarbons (PAHs) injected into eggs of chicken(Gallus domesticus) and common eider duck (Somateria mollissima).Environ Toxicol Chem 11:1653–1660.
Organic contaminants in Great Lakes tree swallow nestlings Environ Toxicol Chem 36, 2017 747
25. Arcand-Hoy LD,Metcalfe CD. 1999. Biomarkers of exposure of brownbullheads (Ameiurus nebulosus) to contaminants in the lower GreatLakes, North America. Environ Toxicol Chem 18:740–749.
26. Gewurtz SB, Backus SM, Bhavsar SP, McGoldrick DJ, de Solla SR,Murphy EW. 2011. Contaminant biomonitoring programs in the GreatLakes region: Review of approaches and critical factors. Environ Rev19:162–184.
27. Custer TW, Custer CM, Dickerson K, Allen K, Melancon MJ, SchmidtLJ. 2001. Polycyclic aromatic hydrocarbons, aliphatic hydrocarbons,trace elements, and monooxygenase activity in birds nesting on theNorth Platte River, Casper, Wyoming, USA. Environ Toxicol Chem20:624–631.
28. Wayland M, Headley JV, Peru KM, Crosley R, Brownlee BG. 2008.Levels of polycyclic aromatic hydrocarbons and dibenzothiophenes inwetland sediments and aquatic insects in the oil sands area ofnortheastern Alberta, Canada. Environ Monit Assess 136:167–182.
29. Leary S, Underwood W, Anthony R, Cartner S, Corey D, Grandin T,Greenacre CB, Gwaltney-Bran S, McCrackin MA, Meyer R, Miller D,Shearer J, Yanong R. 2013. AVMA guidelines for the euthanasia ofanimals: 2013 edition. American Veterinary Medical Association,Schaumburg, IL.
30. US Environmental Protection Agency. 1992. Specifications andguidance for contaminant-free sample containers. 9240.0-05A. Wash-ington, DC.
31. Pereira MG, Walker LA, Wright J, Best J, Shore RF. 2009.Concentrations of polycyclic aromatic hydrocarbons (PAHs) in theeggs of predatory birds in Britain. Environ Sci Technol 43:9010–9015.
32. US Environmental Protection Agency. 1999. Method 1668 revisionA: Chlorinated biphenyl congeners in water soil sediment andtissue by HRGC/HRMS. EPA 821R00002. Washington, DC. [cited2016 March 22]. Available from: https://yosemite.epa.gov/water/owrccatalog.nsf/065ca07e299b464685256ce50075c11a/3d9893f0309b8a1e85256b0600723f76!Open
33. US Environmental Protection Agency. 1994. Method 1613, revision B:Tetra- through octa-chlorinated dioxins and furans by isotope dilutionHRGC/HRMS. Washington, DC.
34. US Environmental Protection Agency. 2007. Method 1614: Bromi-nated diphenyl ethers in water soil, sediment and tissue by HRGC/HRMS. EPA 821/R-07/005. Washington, DC.
35. Sokal RR, Rolf FJ. 1980. Biometry, 2nd ed. WH Freeman, New York,NY, USA.
36. R Core Team. 2015. R: A Language and Environment for StatisticalComputing. R Foundation for Statistical Computing, Vienna, Austria.[cited 2016 March 22]. Available from: https://www.R-project.org/.
37. Moody CA, Hebert GN, Strauss SH, Field JA. 2003. Occurrence andpersistence of perfluorooctanesulfonate and other perfluorinatedsurfactants in groundwater at a fire-training area at Wurtsmith AirForce Base, Michigan, USA. J Environ Monit 5:341–345.
38. Nakayama SF, Strynar MJ, Reiner JL, Delinsky AD, Lindstrom AB.2010. Determination of perfluorinated compounds in the upperMississippi River basin. Environ Sci Technol 44:4103–4109.
39. Lei L, Khodadoust AP, Suidan MT, Tabak HH. 2005. Biodegradationof sediment-bound PAHs in field-contaminated sediment. Water Res39:349–361.
40. Baumard P, Budzinski H, Garrigues P. 1998. Polycyclic aromatichydrocarbons in sediments and mussels of the western MediterraneanSea. Environ Toxicol Chem 17:765–776.
41. Smits JE, Wayland ME, Miller MJ, Liber K, Trudeau S. 2000.Reproductive, immune, and physiological end points in tree swallowson reclaimed oil sands mine sites. Environ Toxicol Chem 19:2951–2960.
42. Echols KR, Tillitt DE, Nichols JW, Secord AL, McCarty JP. 2004.Accumulation of PCB congeners in nestling tree swallows (Tachycinetabicolor) on the Hudson River, New York. Environ Sci Technol38:6240–6246.
43. Custer CM,Custer TW,Dummer PM,MunneyKL. 2003. Exposure andeffects of chemical contaminants on tree swallows nesting along theHousatonic River, Berkshire County,Massachusetts, USA, 1998–2000.Environ Toxicol Chem 22:1605–1621.
44. Newsted JL, Jones PD, Coady K, Giesy JP. 2005. Avian toxicityreference values for perfluorooctane sulfonate. Environ Sci Technol39:9357–9362.
45. Beach SA, Newsted JL, Coady K, Giesy JP. 2006. Ecotoxicologicalevaluation of perfluorooctanesulfonate (PFOS). Rev Environ ContamToxicol 186:133–174.
46. Spears BL, Brown MW, Hester CM. 2008. Evaluation of polychlori-nated biphenyl remediation at a Superfund site using tree swallows(Tachycineta bicolor) as indicators. Environ Toxicol Chem 27:2512–2520.
47. Jayaraman S, Nacci DE, Champlin DM, Pruell RJ, Rocha KJ, CusterCM, Custer TW, Cantwell M. 2009. PCBs and DDE in tree swallow(Tachycineta bicolor) eggs and nestlings from an estuarine PCBsuperfund site, New Bedford Harbor, MA, USA. Environ Sci Technol43:8387–8392.
48. Suns KR, Hitchin GG, Toner D. 1993. Spatial and temporal trendsof organochlorine contaminants in spottail shiners from selectedsites in the Great Lakes (1975–1990). J Great Lakes Res 19:703–714.
748 Environ Toxicol Chem 36, 2017 T.W. Custer et al.