MILK AND MILK PRODUCTS IN THE EUROPEAN UNIONec.europa.eu/agriculture/publi/fact/milk/2007_en.pdf ·...
29
MILK AND MILK PRODUCTS IN THE EUROPEAN UNION August 2006 European Commission
-
Upload
dangnguyet -
Category
Documents
-
view
237 -
download
1
Transcript of MILK AND MILK PRODUCTS IN THE EUROPEAN UNIONec.europa.eu/agriculture/publi/fact/milk/2007_en.pdf ·...
MILK AND MILK PRODUCTS IN THE EUROPEAN UNION
August 2006
European Commission
MILK AND MILK PRODUCTS IN THE EUROPEAN UNION
August 2006

The text of this publication is for information purposes only and is not legally binding.
A great deal of additional information on the European Union is available on the Internet.It can be accessed through the Europa server (http://europa.eu).
Cataloguing data can be found at the end of this publication.
Luxembourg: Offi ce for Offi cial Publications of the European Communities, 2006
ISBN 92-79-02199-0
© European Communities, 2006Reproduction is authorised provided the source is acknowledged.
Printed in Belgium
PRINTED ON WHITE CHLORINE-FREE BLEACHED PAPER
Europe Direct is a service to help you fi nd answers to your questions about the European Union
Freephone number (*):
00 800 6 7 8 9 10 11
(*) Certain mobile telephone operators do not allow access to 00 800 numbers or these calls may be billed.
3
The dairy sector is of great importance to the European Union (EU) in a variety of ways. Its most striking feature is that milk is produced in every single EU Member State without exception. Dairy is the most prominent sector in many regions of the EU, often regions of particular value for their landscape and environment (e.g. mountainous areas). Dairy farming has helped to shape those land-scapes. Dairying therefore has an importance that goes far beyond simple statistics. Dairy farming gives many rural areas their distinctive character, and a thriving milk sector is important for the economy and employment.
Milk is the number one single product sector in terms of value at approximately 14 % of agricultural output. In 2004 milk production was worth about EUR 43 billion at farm level. The turnover of the dairy processing sector is EUR 117 billion. The EU dairy industry is renowned for the qual-
ity of its dairy products, not only its justly famous cheeses but also its wide variety of yoghurts, creams, ice creams and other value-added products. The EU is a major player in the world dairy market and is the leading exporter of many dairy products, most notably cheeses.
In addition, the food industry uses many sophisticated dairy-based ingredients. The applications for dairy prod-ucts are constantly expanding as research and innova-tion bring in new technologies, novel food formulations, improved composition and ‘functional foods’.
This fact sheet examines the dairy sector in facts and fi g-ures, explains the role of the EU’s Common Agricultural Policy (CAP) in relation to milk production and market-ing and highlights the main factors that will infl uence its future.
Introduction to the EU dairy sector
Contents
Products made from dairy cows’ milk 7
The EU dairy sector in fi gures 9
The dairy sector and the CAP 16
Trade in the dairy sector 20
The EU’s milk budget 23
Dairy in harmony with other sectors 23
EU enlargement and the dairy sector 24
Future developments 25
For further information 26
Relevant regulations 27

7
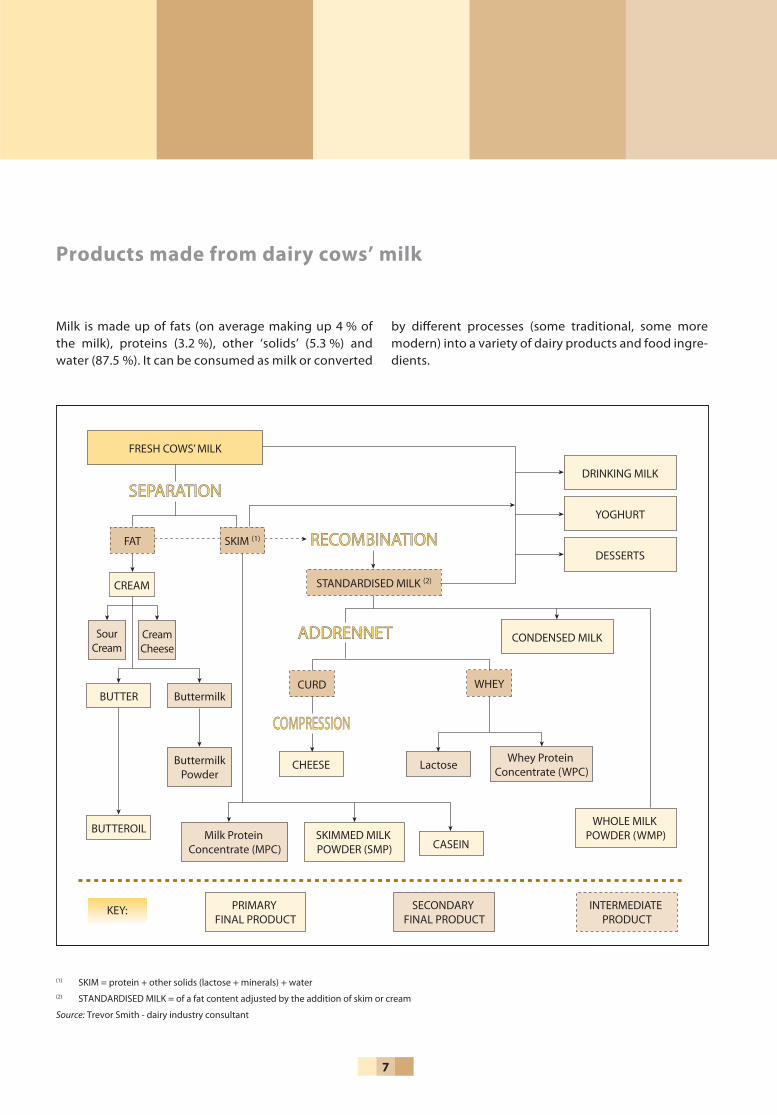
Milk is made up of fats (on average making up 4 % of the milk), proteins (3.2 %), other ‘solids’ (5.3 %) and water (87.5 %). It can be consumed as milk or converted
by diff erent processes (some traditional, some more modern) into a variety of dairy products and food ingre-dients.
Products made from dairy cows’ milk
FRESH COWS’ MILK
FAT
CURD WHEY
SKIM (1)
STANDARDISED MILK (2)
SEPARATIONSEPARATION
RECOMBINATIONRECOMBINATION
ADDRENNETADDRENNET
COMPRESSIONCOMPRESSION
DRINKING MILK
CREAM
BUTTER
BUTTEROIL
CHEESE
CASEINSKIMMED MILK POWDER (SMP)
PRIMARY FINAL PRODUCT
SECONDARY FINAL PRODUCT
INTERMEDIATE PRODUCT
WHOLE MILK POWDER (WMP)
LactoseWhey Protein
Concentrate (WPC)
Buttermilk
ButtermilkPowder
Milk Protein Concentrate (MPC)
SourCream
CreamCheese
YOGHURT
DESSERTS
CONDENSED MILK
KEY:
(1) SKIM = protein + other solids (lactose + minerals) + water(2) STANDARDISED MILK = of a fat content adjusted by the addition of skim or cream
Source: Trevor Smith - dairy industry consultant

8
Milk used in dairy products in the EU (2006 forecast) (1)
Butter, 16.2 %
Other, 5 %
SMP, 3.8 %
Cheeses, 37.3 %
WMP, 4.7 %
Casein, 1.4 %
Fresh milk, 31.6 %
Source: European Commission - Directorate-General for Agriculture and Rural Development
(1) Milk Equivalent Quantity, expressed as percentages and based on total protein and fat content

9
A variety of systems is in operation for marketing the milk produced on dairy farms. Most dairy farmers sell their milk to dairy processors and it then enters the food chain. Other dairy farmers market their milk directly to consum-ers and on some dairy farms milk is consumed on the farm. In some of the newest Member States (in Eastern Europe) a signifi cant proportion is still consumed on farm. Selling and processing of milk often takes place via farmer-owned cooperatives while, in some Member States, the majority of processing is in the hands of private companies. Dis-tinct ‘national’ markets were once the norm – now there
is more cross-border ownership of farms and processing facilities.
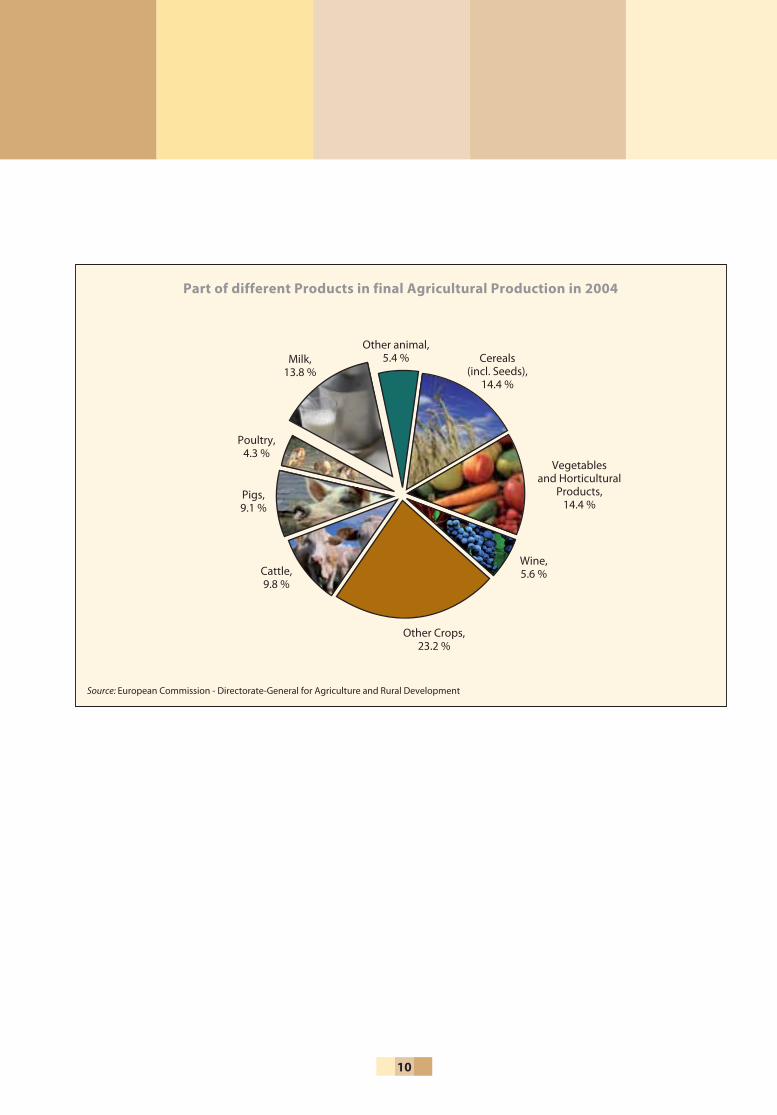
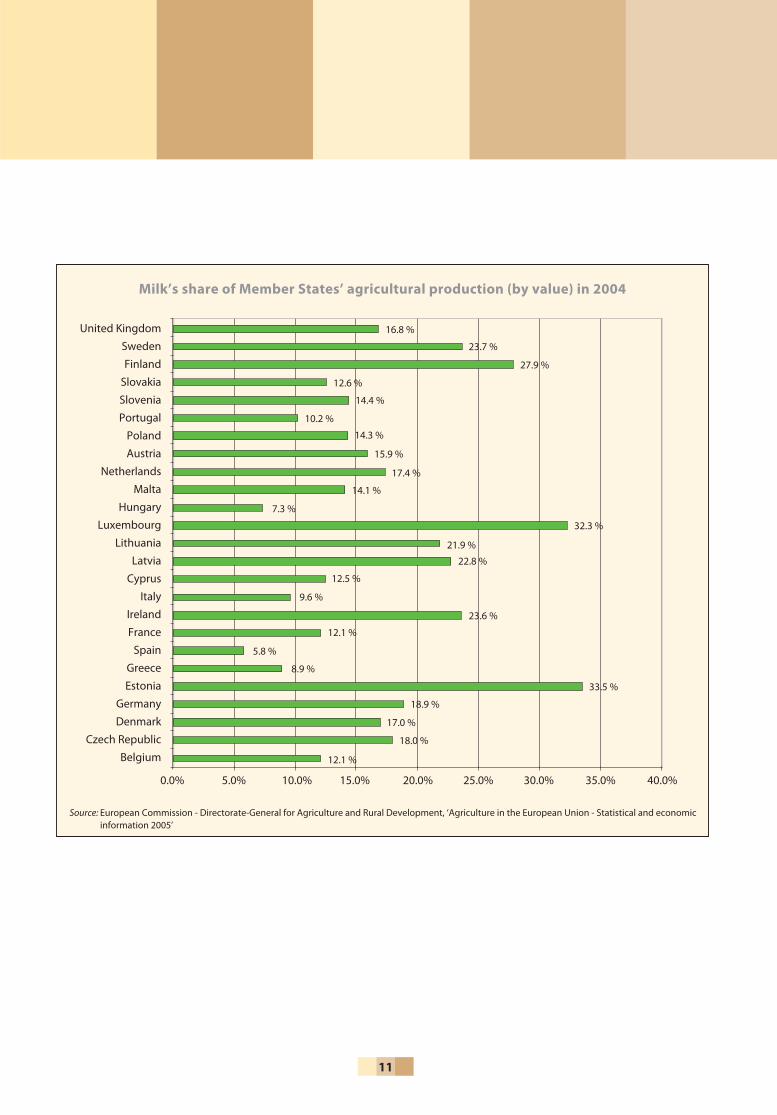
Milk production takes place in all EU Member States and rep-resents a signifi cant proportion of the value of EU agricultural output (see chart: ‘Part of diff erent products in fi nal agricul-tural production in 2004’). For some Member States it forms a very important part of the agricultural economy. The share of milk in total production varies between Member States, from 5.8 % to 33.5 %. The share tends to be higher in north-ern Europe and below 10 % in Mediterranean countries.
The EU dairy sector in figures
The structure of EU dairy farming
Dairy farming is structured diff erently from Member State to Member State. Farm and dairy herd sizes vary enor-
mously, as do yields (particularly following the May 2004 EU enlargement that brought ten new Member States into the EU). However, as the dairy sector develops throughout the EU, so variations in yield and other technical factors are being reduced – less developed dairy producers are rapidly catching up with those who had restructured and modernised fi rst. There is no ‘typical’ European dairy cow breed, though the Friesian-Holstein is the most prevalent.
Dairy Cows ‘Yield
EU 25
In T
hous
and
kg p
er H
ead
per Y
ear
Swed
en
Denm
ark
Finlan
d
Neth
erlan
ds
Unite
d Ki
ngdo
m
Luxe
mbo
urg
Germ
any
Slov
enia
Hung
ary
Spain
Fran
ce
Portu
gal
Czec
h Re
publ
ic
Italy
Aust
ria
Cypr
us
Esto
nia
Malt
a
Belg
ium
Slov
akia
Irelan
d
Gree
ce
Lithu
ania
Polan
d
Latv
ia
Source: European Commission - Directorate-General for Agriculture and Rural Development
9000
8000
7000
6000
5000
4000
3000
2000
1000
0
10
Part of different Products in final Agricultural Production in 2004
Poultry, 4.3 %
Other animal, 5.4 %
Cattle, 9.8 %
Other Crops, 23.2 %
Wine, 5.6 %
Vegetables and Horticultural
Products, 14.4 %
Cereals (incl. Seeds),
14.4 %
Source: European Commission - Directorate-General for Agriculture and Rural Development
Pigs, 9.1 %
Milk, 13.8 %
11
Milk’s share of Member States’ agricultural production (by value) in 2004
Source: European Commission - Directorate-General for Agriculture and Rural Development, ‘Agriculture in the European Union - Statistical and economic information 2005’
United Kingdom
Sweden
Finland
Slovakia
Slovenia
Portugal
Poland
Austria
Netherlands
Malta
Hungary
Luxembourg
Lithuania
Latvia
Cyprus
Italy
Ireland
France
Spain
Greece
Estonia
Germany
Denmark
Czech Republic
Belgium
0.0% 5.0% 10.0% 15.0% 20.0% 25.0% 30.0% 35.0% 40.0%
16.8 %
23.7 %
27.9 %
12.6 %
14.4 %
10.2 %
14.3 %
15.9 %
17.4 %
14.1 %
7.3 %
32.3 %
21.9 %
22.8 %
12.5 %
9.6 %
23.6 %
12.1 %
5.8 %
8.9 %
33.5 %
18.9 %
17.0 %
18.0 %
12.1 %
12
Milk supply
The milk quota system (introduced in 1984) has put an eff ective limit on the amount of milk EU dairy farmers produce each year. Farm management decisions, climatic and other factors can have an impact on fi nal production fi gures but, generally speaking, total EU production in any given year tends to match quota.
Under the quota system, if a farmer delivers more milk than his quota in any one year he can be penalised fi nan-cially. This involves paying a ‘superlevy’ on the over-quota amount, with the levy set at a rate that eff ectively deters deliveries exceeding quotas. It is diffi cult for dairy farmers,
individually or collectively, to meet their quota exactly in each year (for instance, the EU exceeded its quota for the 2004-2005 quota year by just under 1 %). Quotas are split between deliveries to processors and direct sales from the farm.
Recent European Commission estimates indicate that there will be a slight increase in milk production in the coming years (due to programmed quota increases, which amount to approximately two million tonnes in total) though from a lower number of cows as milk yields per cow improve. Also, in the new Member States there is expected to be some switching from on farm consumption and direct sales to deliveries of milk to processing plants.
13
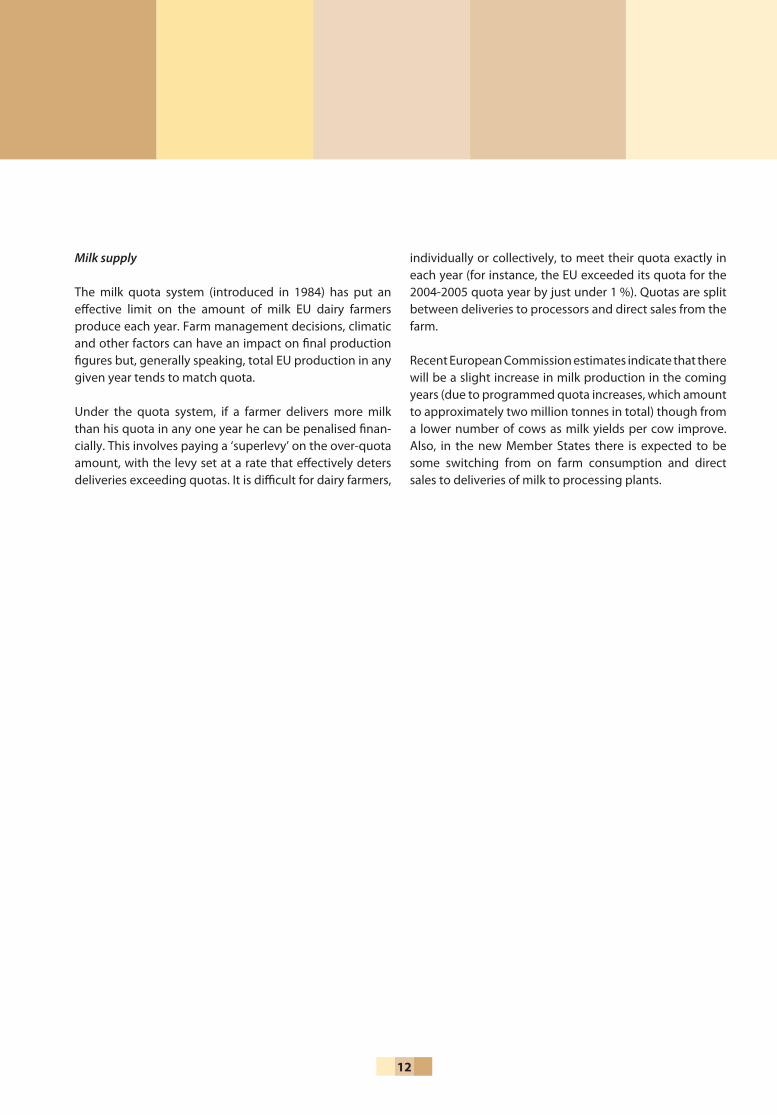
Milk quotas in the EU-25 and per Member State
Source: European Commission - Directorate-General for Agriculture and Rural Development, ‘Agriculture in the European Union - Statistical and economic information 2005’
GermanyFrance
United KingdomNetherlands
ItalyPoland
SpainIreland
DenmarkBelgiumSwedenAustria
Czech RepublicFinland
HungaryPortugal
LithuaniaSlovakia
GreeceLatvia
EstoniaSlovenia
LuxembourgCyprus
Malta
0 5 10 15 20 25 30
Total milk quotas EU-25 137 340 928 tonnes 10 new Member States 18 327 895 tonnes (2)
(2) Including ‘restructuring quota’– see point 6 on EU enlargement
Quota in tonnesMillions
Consumption of milk products in the EU
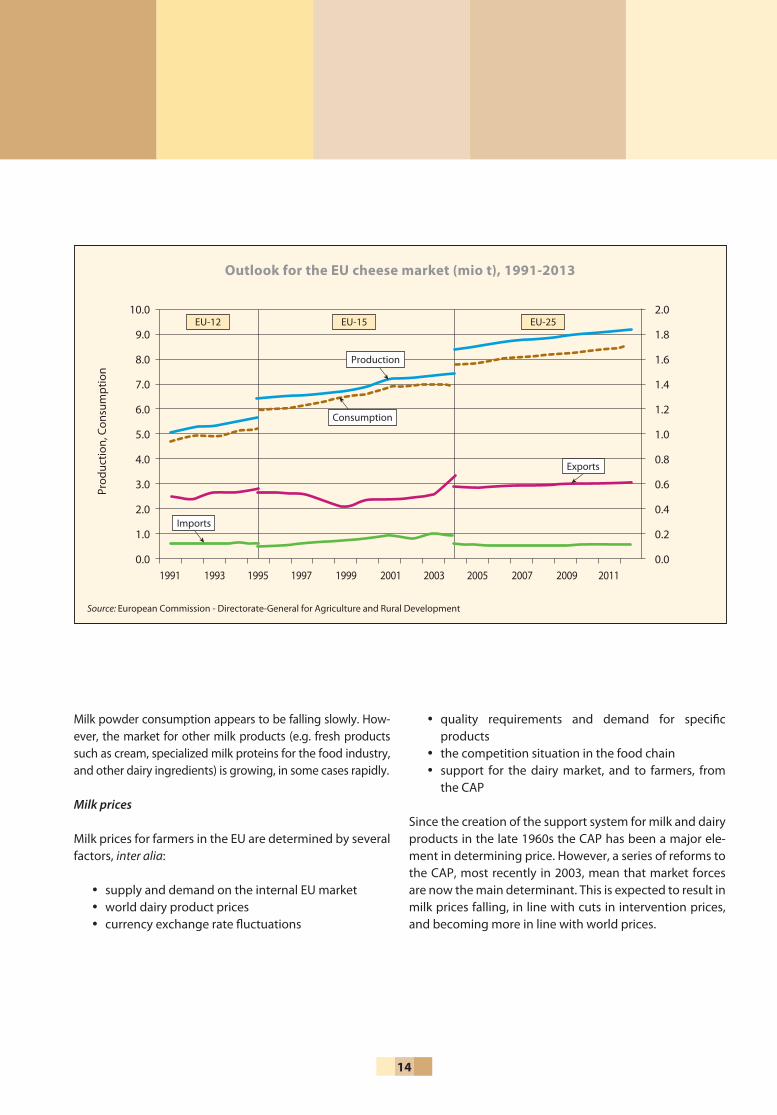
Some broad trends among the dairy products are apparent – butter consumption in the EU has been declining, slowly but steadily, for many years. On the other hand, cheese consumption has been on a rising curve, a trend that is
expected to continue. Between 1995 and 2004 cheese production increased by nearly 15 %, with per capita con-sumption growing at an average rate of 1.5 % per year. Nearly 40 % of EU milk is consumed as cheese. Four Mem-ber States (Germany, France, Italy and the Netherlands) produce more than 75 % of EU cheese.
14
Milk powder consumption appears to be falling slowly. How-ever, the market for other milk products (e.g. fresh products such as cream, specialized milk proteins for the food industry, and other dairy ingredients) is growing, in some cases rapidly.
Milk prices
Milk prices for farmers in the EU are determined by several factors, inter alia:
supply and demand on the internal EU marketworld dairy product pricescurrency exchange rate fl uctuations
•••
quality requirements and demand for specifi c productsthe competition situation in the food chain support for the dairy market, and to farmers, from the CAP
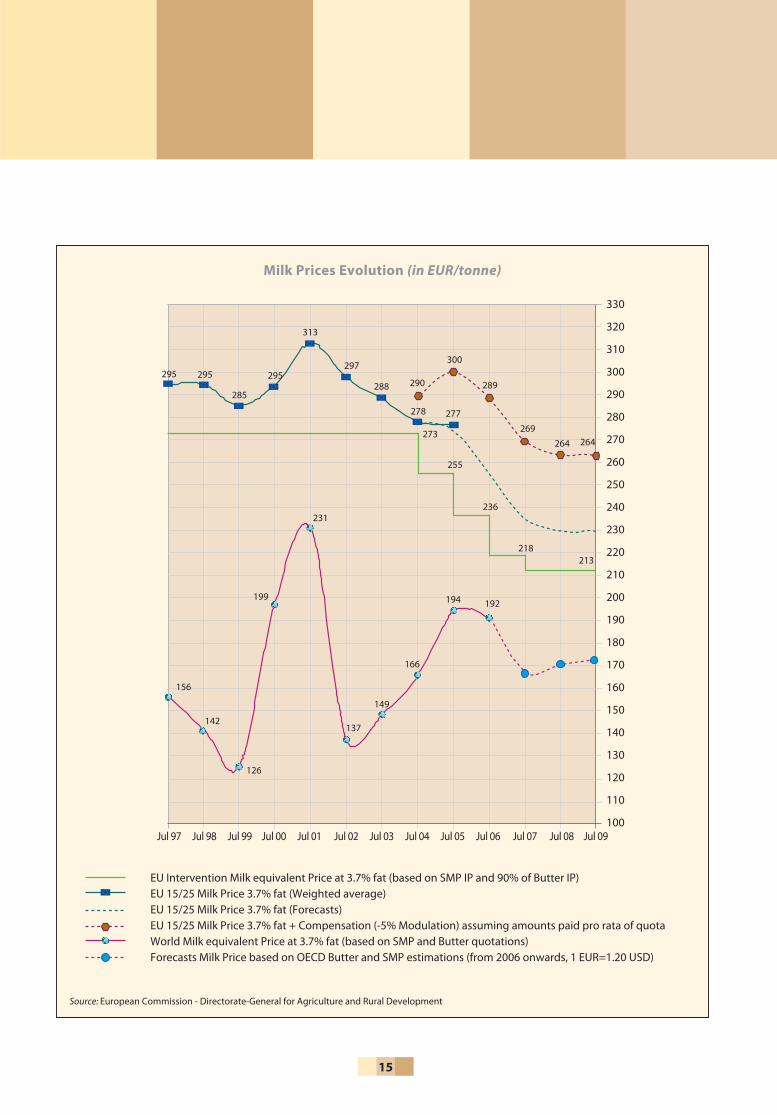
Since the creation of the support system for milk and dairy products in the late 1960s the CAP has been a major ele-ment in determining price. However, a series of reforms to the CAP, most recently in 2003, mean that market forces are now the main determinant. This is expected to result in milk prices falling, in line with cuts in intervention prices, and becoming more in line with world prices.
•
••
Outlook for the EU cheese market (mio t), 1991-2013
Source: European Commission - Directorate-General for Agriculture and Rural Development
Production
Consumption
EU-12 EU-15 EU-2510.0
9.0
8.0
7.0
6.0
5.0
4.0
3.0
2.0
1.0
0.0
2.0
1.8
1.6
1.4
1.2
1.0
0.8
0.6
0.4
0.2
0.0
Exports
Imports
1991 1993 1995 1997 1999 2001 2003 2005 2007 2009 2011
Prod
uctio
n, C
onsu
mpt
ion
15
Milk Prices Evolution (in EUR/tonne)
Source: European Commission - Directorate-General for Agriculture and Rural Development
330
320
310
300
290
280
270
260
250
240
230
220
210
200
190
180
170
160
150
140
130
120
110
100Jul 97 Jul 98 Jul 99 Jul 00 Jul 01 Jul 02 Jul 03 Jul 04 Jul 05 Jul 06 Jul 07 Jul 08 Jul 09
EU Intervention Milk equivalent Price at 3.7% fat (based on SMP IP and 90% of Butter IP)EU 15/25 Milk Price 3.7% fat (Weighted average)EU 15/25 Milk Price 3.7% fat (Forecasts)EU 15/25 Milk Price 3.7% fat + Compensation (-5% Modulation) assuming amounts paid pro rata of quotaWorld Milk equivalent Price at 3.7% fat (based on SMP and Butter quotations)Forecasts Milk Price based on OECD Butter and SMP estimations (from 2006 onwards, 1 EUR=1.20 USD)
295 295
285
295
313
297
288
278 277
273
255
236
290
300
289
269
264 264
218213
192194
166
149
137
231
199
126
142
156
16
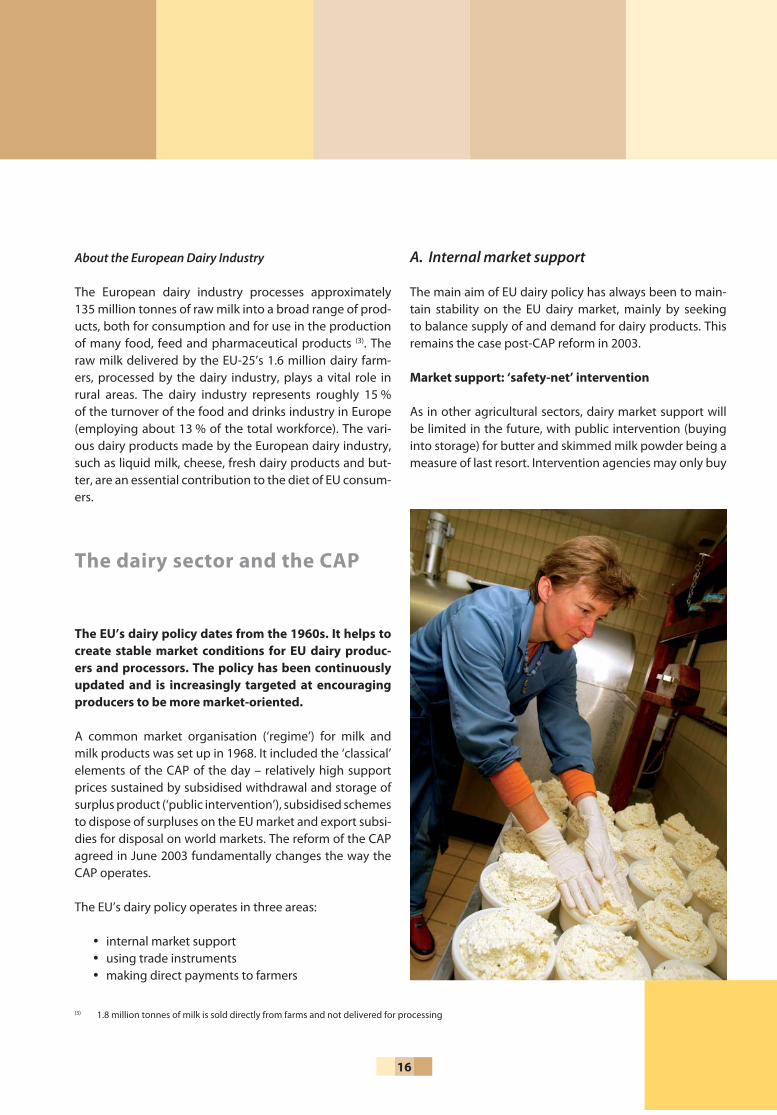
About the European Dairy Industry
The European dairy industry processes approximately 135 million tonnes of raw milk into a broad range of prod-ucts, both for consumption and for use in the production of many food, feed and pharmaceutical products (3). The raw milk delivered by the EU-25’s 1.6 million dairy farm-ers, processed by the dairy industry, plays a vital role in rural areas. The dairy industry represents roughly 15 % of the turnover of the food and drinks industry in Europe (employing about 13 % of the total workforce). The vari-ous dairy products made by the European dairy industry, such as liquid milk, cheese, fresh dairy products and but-ter, are an essential contribution to the diet of EU consum-ers.
The dairy sector and the CAP
The EU’s dairy policy dates from the 1960s. It helps to create stable market conditions for EU dairy produc-ers and processors. The policy has been continuously updated and is increasingly targeted at encouraging producers to be more market-oriented.
A common market organisation (‘regime’) for milk and milk products was set up in 1968. It included the ‘classical’ elements of the CAP of the day – relatively high support prices sustained by subsidised withdrawal and storage of surplus product (‘public intervention’), subsidised schemes to dispose of surpluses on the EU market and export subsi-dies for disposal on world markets. The reform of the CAP agreed in June 2003 fundamentally changes the way the CAP operates.
The EU’s dairy policy operates in three areas:
internal market supportusing trade instrumentsmaking direct payments to farmers
•••
A. Internal market support
The main aim of EU dairy policy has always been to main-tain stability on the EU dairy market, mainly by seeking to balance supply of and demand for dairy products. This remains the case post-CAP reform in 2003.
Market support: ‘safety-net’ intervention
As in other agricultural sectors, dairy market support will be limited in the future, with public intervention (buying into storage) for butter and skimmed milk powder being a measure of last resort. Intervention agencies may only buy
(3) 1.8 million tonnes of milk is sold directly from farms and not delivered for processing
17
in butter during the period 1 March to 31 August of any year. When the quantities of butter off ered for intervention exceed the thresholds indicated below (during the period 1 March – 31 August) the Commission may suspend con-ventional intervention buying and continue buying using a tendering procedure. The thresholds are 50 000 tonnes in 2006, 40 000 tonnes in 2007 and 30 000 tonnes in 2008 and subsequent years.
It was agreed in 2003 that the butter intervention price would be reduced by 25 % over a four-year period, begin-ning on 1 July 2004, the four reductions being three times 7 % plus a fi nal cut of 4 % in 2007, meaning price levels of:
EUR 328.20/100 kg until 30 June 2004, reducing toEUR 246.39/100 kg from 1 July 2007
The actual buying in price is only 90 % of the intervention price (i.e. EUR 221.75/100 kg on 1 July 2007 ).
SMP intervention was already only open between 1 March and end-August each year, for a maximum quantity of 109 000 tonnes. Beyond this quantity, intervention may be suspended and may be replaced by a tender procedure. The SMP intervention price was reduced by 15 % over a three-year period, with reductions of 5 % in each of 2004, 2005 and 2006, resulting in the following price levels:
EUR 205.52/100 kg in 2003/04, reducing toEUR 174.69/100 kg from 1 July 2006
Disposal of dairy products on the internal EU market
In order that a healthy market balance is maintained, the EU dairy industry continues to have access to measures to ensure the competitiveness of their dairy products on the internal market. Various schemes for dairy products on the EU market still play a role in the dairy regime, though spending has been reducing in recent years in most cases.
The main subsidised disposal schemes are: cream, butter and concentrated butter for non-profi t organizations, for commercial pastry and ice cream manufacture (still a signifi cant scheme – disposal measures for butter, butter oil and cream covered a total quantity of 600 000 tonnes of butter equiva-lents in 2004) SMP for use in animal feed
••
••
•
•
skimmed milk for the manufacture of casein/caseinatesschool milk aid in the form of dairy products for the most depri-ved people
Private storage aid
For butter and certain cheeses (mainly Italian cheeses) cheese producers can obtain fi nancial support (aid) for storage costs. Due to seasonal variations in raw milk deliv-eries the production of some products is high for a short period, which can destabilise markets. This aid stabilises prices by helping producers to take product temporar-ily off the market. In the case of butter it also serves as an alternative to intervention.
Milk quotas: providing continued stability in the dairy sector
The milk quota regime has brought stability to the EU’s dairy sector since its introduction in 1984. In recognition of this, the regime has been extended to 31 March 2015. There will be three annual increases of 0.5 % of quota vol-umes for 11 of the EU-15 Member States beginning in 2006 (Greece, Ireland and North Ireland, Italy and Spain are the exceptions as they benefi t from earlier quota increases).
Larger quota increases were discussed but the fi nal 2003 CAP reform deal included a commitment that “no addi-tional general quota increase in 2007 and 2008 is decided now. The Commission will present a market outlook report once the dairy reform is fully implemented on the basis of which a decision will be taken”.
B. Using trade instruments
Exports
As the EU market price is higher than the world price for dairy products, exports generally take place with the aid of export subsidies. Following the 1994 multilateral trade agreement (known as the Uruguay Round) of the World Trade Organisation (WTO), export subsidies have been restricted – both the quantities exported and the amount of total subsidies paid out are strictly limited.
•••
18
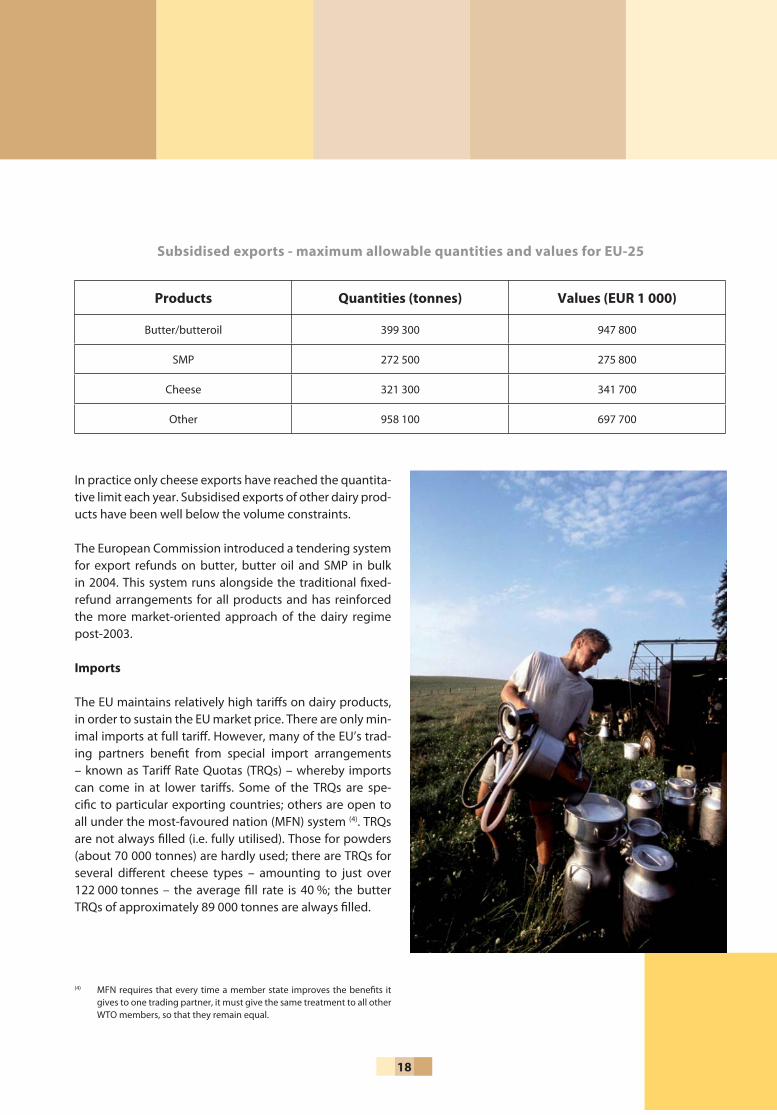
Subsidised exports - maximum allowable quantities and values for EU-25
Products Quantities (tonnes) Values (EUR 1 000)
Butter/butteroil 399 300 947 800
SMP 272 500 275 800
Cheese 321 300 341 700
Other 958 100 697 700
In practice only cheese exports have reached the quantita-tive limit each year. Subsidised exports of other dairy prod-ucts have been well below the volume constraints.
The European Commission introduced a tendering system for export refunds on butter, butter oil and SMP in bulk in 2004. This system runs alongside the traditional fi xed-refund arrangements for all products and has reinforced the more market-oriented approach of the dairy regime post-2003.
Imports
The EU maintains relatively high tariff s on dairy products, in order to sustain the EU market price. There are only min-imal imports at full tariff . However, many of the EU’s trad-ing partners benefi t from special import arrangements – known as Tariff Rate Quotas (TRQs) – whereby imports can come in at lower tariff s. Some of the TRQs are spe-cifi c to particular exporting countries; others are open to all under the most-favoured nation (MFN) system (4). TRQs are not always fi lled (i.e. fully utilised). Those for powders (about 70 000 tonnes) are hardly used; there are TRQs for several diff erent cheese types – amounting to just over 122 000 tonnes – the average fi ll rate is 40 %; the butter TRQs of approximately 89 000 tonnes are always fi lled.
(4) MFN requires that every time a member state improves the benefi ts it gives to one trading partner, it must give the same treatment to all other WTO members, so that they remain equal.
19
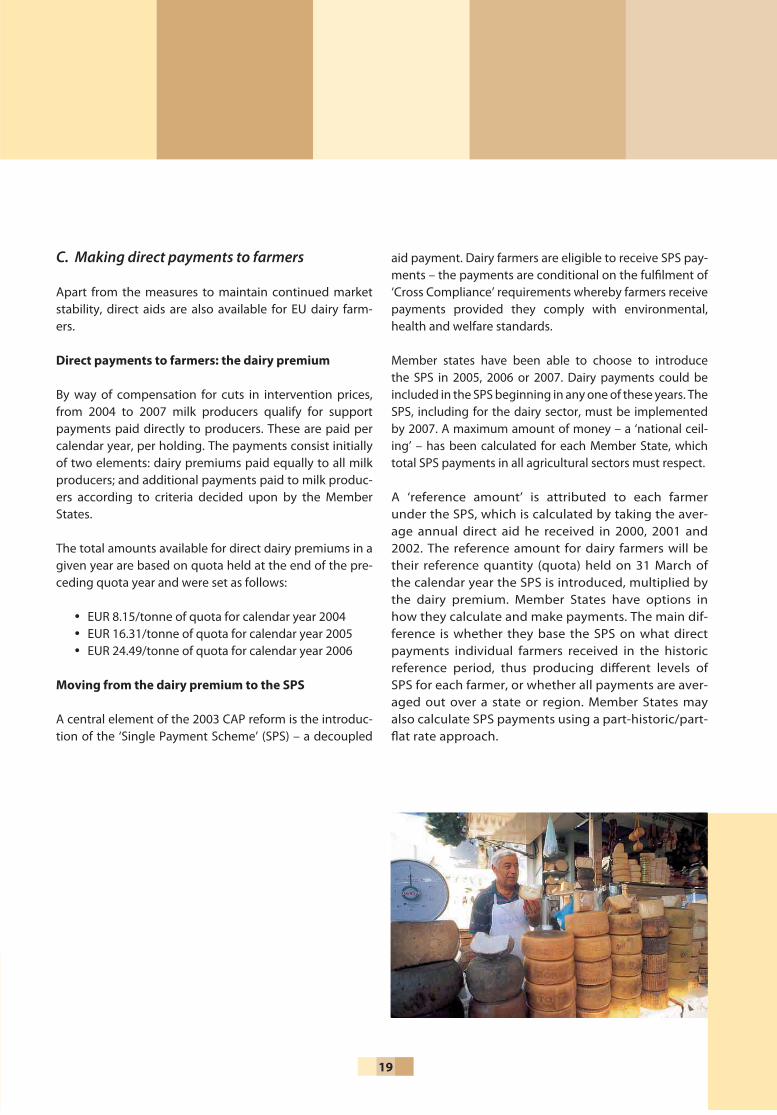
C. Making direct payments to farmers
Apart from the measures to maintain continued market stability, direct aids are also available for EU dairy farm-ers.
Direct payments to farmers: the dairy premium
By way of compensation for cuts in intervention prices, from 2004 to 2007 milk producers qualify for support payments paid directly to producers. These are paid per calendar year, per holding. The payments consist initially of two elements: dairy premiums paid equally to all milk producers; and additional payments paid to milk produc-ers according to criteria decided upon by the Member States.
The total amounts available for direct dairy premiums in a given year are based on quota held at the end of the pre-ceding quota year and were set as follows:
EUR 8.15/tonne of quota for calendar year 2004EUR 16.31/tonne of quota for calendar year 2005EUR 24.49/tonne of quota for calendar year 2006
Moving from the dairy premium to the SPS
A central element of the 2003 CAP reform is the introduc-tion of the ‘Single Payment Scheme’ (SPS) – a decoupled
•••
aid payment. Dairy farmers are eligible to receive SPS pay-ments – the payments are conditional on the fulfi lment of ‘Cross Compliance’ requirements whereby farmers receive payments provided they comply with environmental, health and welfare standards.
Member states have been able to choose to introduce the SPS in 2005, 2006 or 2007. Dairy payments could be included in the SPS beginning in any one of these years. The SPS, including for the dairy sector, must be implemented by 2007. A maximum amount of money – a ‘national ceil-ing’ – has been calculated for each Member State, which total SPS payments in all agricultural sectors must respect.
A ‘reference amount’ is attributed to each farmer under the SPS, which is calculated by taking the aver-age annual direct aid he received in 2000, 2001 and 2002. The reference amount for dairy farmers will be their reference quantity (quota) held on 31 March of the calendar year the SPS is introduced, multiplied by the dairy premium. Member States have options in how they calculate and make payments. The main dif-ference is whether they base the SPS on what direct payments individual farmers received in the historic reference period, thus producing diff erent levels of SPS for each farmer, or whether all payments are aver-aged out over a state or region. Member States may also calculate SPS payments using a part-historic/part-fl at rate approach.
20
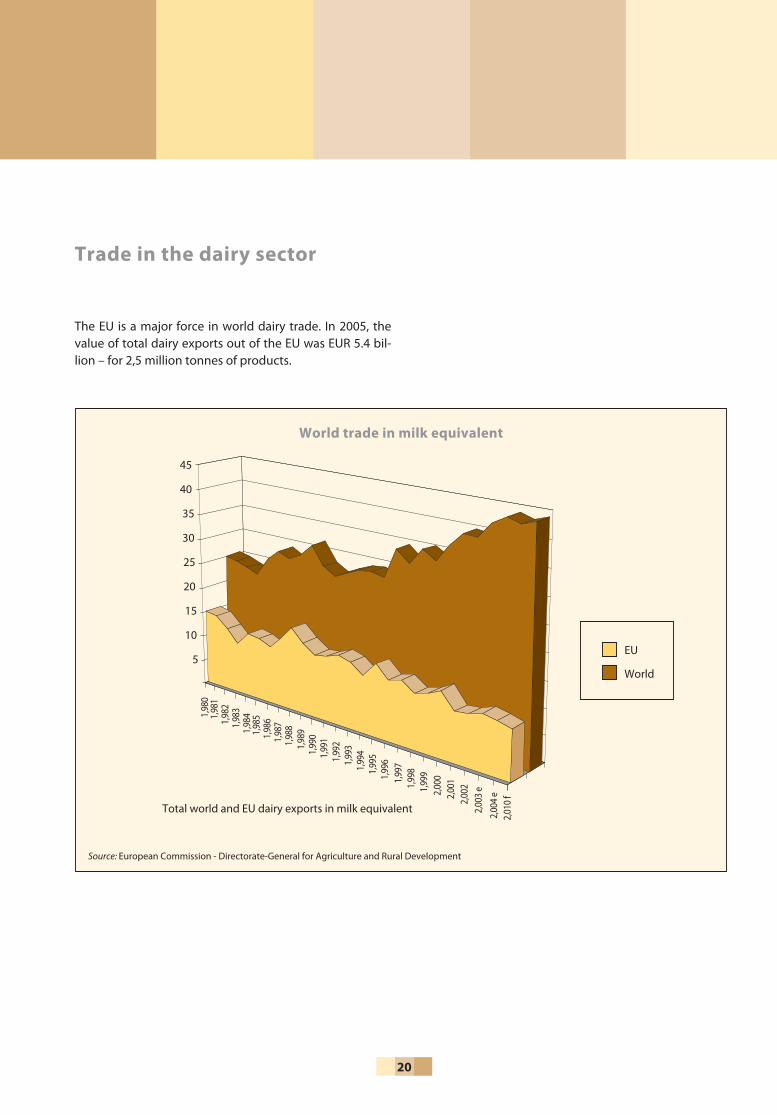
World trade in milk equivalent
1,98
0
1
,981
1
,982
1,9
83
1,984
1
,985
1,98
6
1,9
87
1
,988
1
,989
1
,990
1,991
1,992
1,9
93
1,9
94
1,995
1,9
96
1,9
97
1,998
1,999
2,0
00
2,0
01
2,002
2,0
03 e
2,00
4 e
2,010
f
Source: European Commission - Directorate-General for Agriculture and Rural Development
Total world and EU dairy exports in milk equivalent
EU
World
Trade in the dairy sector
The EU is a major force in world dairy trade. In 2005, the value of total dairy exports out of the EU was EUR 5.4 bil-lion – for 2,5 million tonnes of products.
45
40
35
30
25
20
15
10
5
21
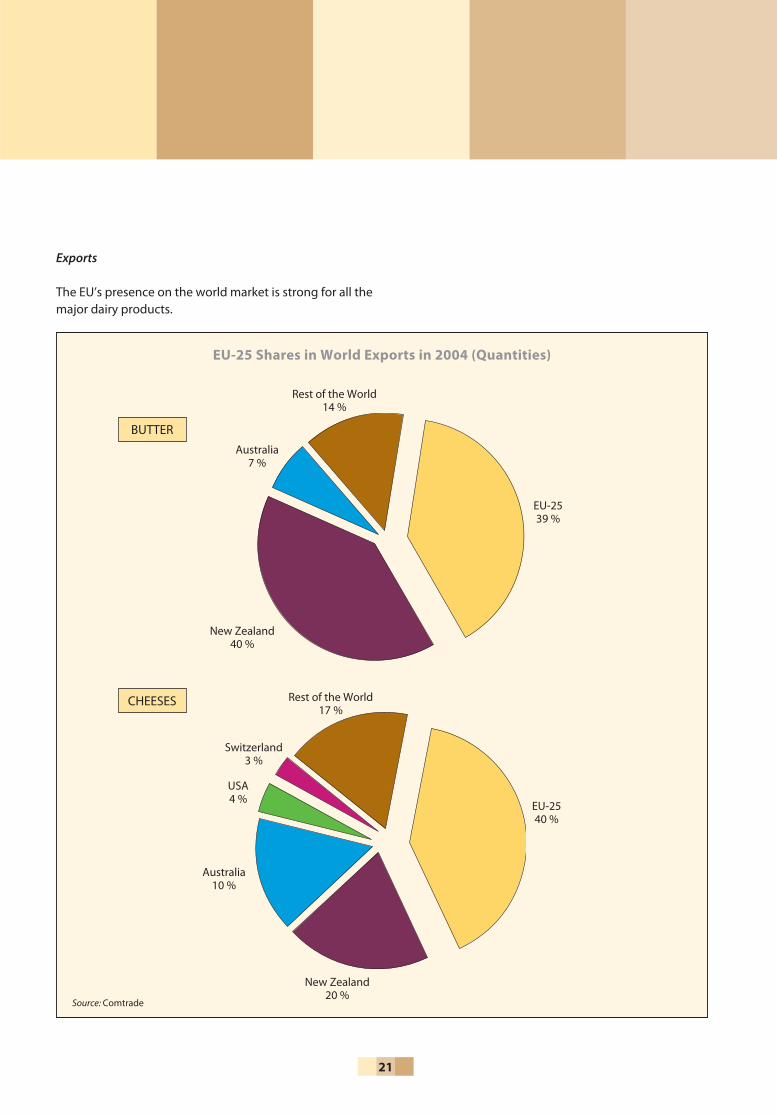
Exports
The EU’s presence on the world market is strong for all the major dairy products.
EU-25 Shares in World Exports in 2004 (Quantities)
Australia 7 %
Rest of the World 14 %
New Zealand 40 %
EU-25 39 %
Rest of the World 17 %
EU-25 40 %
Switzerland 3 %
USA 4 %
Australia 10 %
New Zealand 20 %
BUTTER
CHEESES
Source: Comtrade
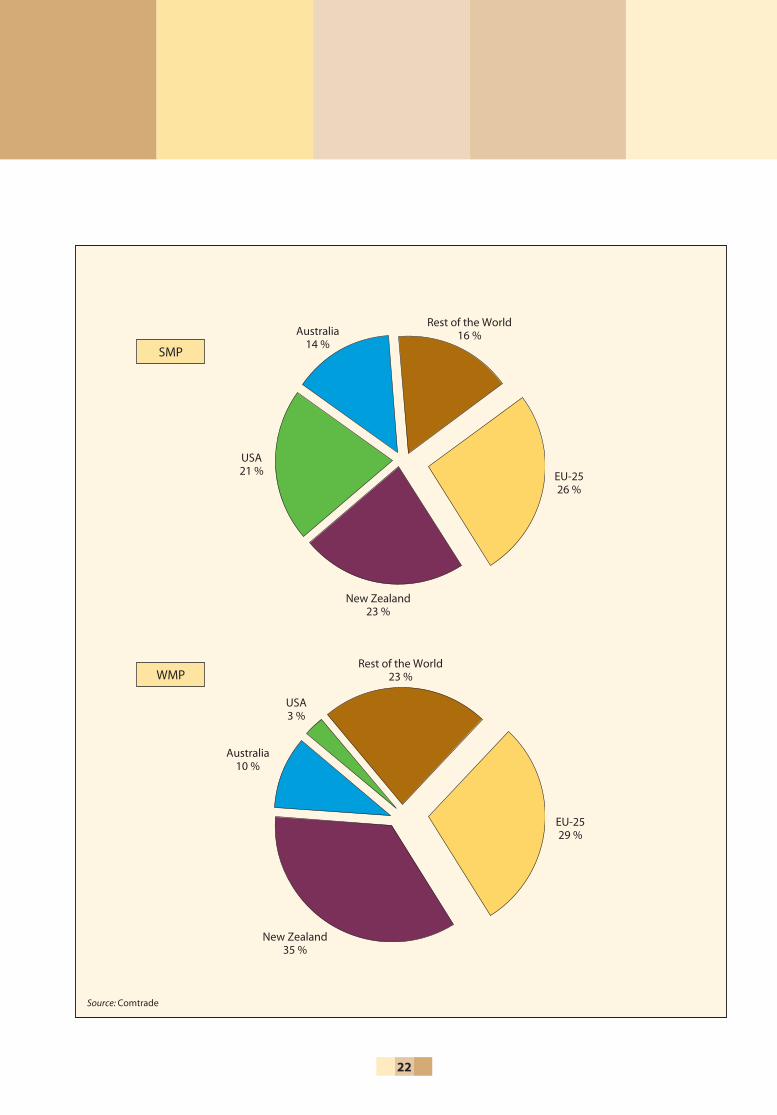
22
Australia 14 %
Rest of the World 16 %
New Zealand 23 %
EU-25 26 %
Source: Comtrade
Rest of the World 23 %
EU-25 29 %
USA 3 %
Australia 10 %
New Zealand 35 %
SMP
WMP
USA 21 %
23
Intra-EU trade in dairy products
Trade within the EU-25 (intra-EU trade) takes place freely, as all agricultural products benefi t from the long-stand-ing internal market. There is signifi cant trade between Member States. In 2005 the fi gure for intra-EU trade in dairy products was 14.6 million tonnes, with a value of EUR 18.6 billion, much higher than for exports outside the EU.
Inward processing
Not all dairy products that enter the EU are consumed there. Under special import arrangements dairy products can enter the EU for further processing and re-export. In practice this system is only used for cheese. This pro-vides a market for some of the EU’s trading partners and also helps EU processors to maximize throughput in their processing plants. Cheese exported under the inward processing system represents about 6 % of total EU annual cheese exports (down from 10 % in the early years of the century).
The EU’s milk budget
Successive CAP reforms have resulted in a signifi cant reduction in expenditure on supporting the dairy market. The budget for dairy in 2006 is below EUR one billion (less than 2 % of the total CAP budget).
Targets for expenditure have changed. Export subsidies, aid for disposal of milk powders and spending on pub-lic intervention have all fallen and will continue to be restricted. Spending on direct aids to dairy farmers has increased following CAP reform, but this forms part of the Single Payment Scheme and is no longer directly linked to dairy farming (and is therefore no longer part of the dairy budget). It is anticipated that market-related budgetary expenditure in the dairy sector will continue to fall in the coming years.
Dairy in harmony with other sectors
Developments in the CAP have occurred not only because of changes in farming, but also in response to the demands of society as a whole. These include increasing concerns about food safety, the environment, nature conservation and animal welfare. In these areas, the CAP and other EU policies have been considerably strengthened since the 1990s and the dairy sector operates within new rules and tighter controls, along with all other parts of the agriculture and food industries.
In response to a number of headline-hitting food safety issues a major overhaul of EU food law has taken place. The objective has been to ensure that EU food safety laws are as comprehensive as possible and that consumers have access to information about potential risks, and measures being taken to minimise them. There are four important elements to the EU’s food safety strategy:
rules on the safety of food and animal feed
independent and publicly available scientifi c advice
action to enforce the rules and control the proces ses
recognition of the consumer’s right to make choices based on full information about a food’s origins and contents
If food is to be safe, the animals it comes from must be healthy. The EU therefore gives priority to keeping animals healthy, through good veterinary practice and preventing outbreaks of contagious diseases, such as foot-and-mouth. Again, the dairy sector has been involved in the eff ort to improve regulations and controls.
The EU has also developed policies to promote better quality food, taking into consideration that the exceptional nature and quality of some products derives from their production location and methods. Consumers and the food industry are increasingly interested in the geographical origin of food and other characteristics. In response to this development, the EU has developed three ‘quality logos’, which many dairy products have earned the right to use. Over 150 EU cheeses have earned the right to carry EU quality logos. With other products such as special butters and creams also carrying quality logos, the dairy sector is well-represented among the more than 700 designated EU quality products.
••••

24
EU enlargement and the dairy sector
May 2004
The EU enlargement of May 2004 brought ten new Mem-ber States into the EU, all of them dairy producing coun-tries with some heavily dependent on milk production. They took on all elements of the EU dairy regime, including the quota system.
Prior to enlargement, there had been fears in the EU-15 that new Member States would export large quantities
of dairy products to the EU-15 countries, undermining the market price. Equally, there were concerns in the new Member States that the reverse might happen and that their dairy producers would have insuffi cient economies of scale and technical skill to compete. Neither fear proved justifi ed. The EU-25 market absorbed the production of the new Member States relatively easily in the dairy sec-tor. In fact market prices have gradually converged in the EU-15 and the new Member States.
Restructuring reserve for the new Member States
During the accession negotiations with the 10 countries it was agreed that a ‘milk quota reserve’ would be added to
EU-25 Milk Price Evolution
in E
UR/
100
kg
Jan-
03Fe
b-03
Mar
-03
Apr-0
3M
ay-0
3Ju
n-03
Jul-0
3Au
g-03
Sep-
03Oc
t-03
Nov-
03De
c-03
Jan-
04Fe
b-04
Mar
-04
Apr-0
4M
ay-0
4Ju
n-04
Jul-0
4Au
g-04
Sep-
04Oc
t-04
Nov-
04De
c-04
Jan-
05Fe
b-05
Mar
-05
Apr-0
5M
ay-0
5Ju
n-05
Jul-0
5Au
g-05
Sep-
05Oc
t-05
Nov-
05De
c-05
Source: European Commission - Directorate-General for Agriculture and Rural Development
Ten New Members Milk price (real fat content)
Intervention milk equivalent price
EU-15 Milk price (real fat content)
32.1
31.6
30.7
30.1
29.5 29.4
29.9
30.9
31.9
32.9 33.0
32.5
31.7
31.9
30.3
29.629.5 29.5
30.3
31.0
32.0
32.7 32.7
32.2
31.0
30.6
29.8
29.128.8
28.6
29.1
30.0
30.931.3 31.2
30.7
27.4
25.625.6
23.8
25.0
24.8
24.8
24.3
24.023.8
23.5 23.6 23.7
24.4
24.8 24.9
24.524.7
25.425.7 25.7
25.6
25.826.1
26.626.9
27.527.6
27.827.6
27.0
26.4
26.6
26.1
26.426.7
26.8
26.8
27.4
34
33
32
31
30
29
28
27
26
25
24
23
25
most new Member States’ dairy quota in 2006 in recogni-tion of an expected decrease in on-farm consumption of milk and milk products. The addition of the reserve brings about an increase of 671 418 tonnes in quotas across the new Member States (adding approximately 0.5 % to the total EU-25 milk quota).
Next phase of enlargement
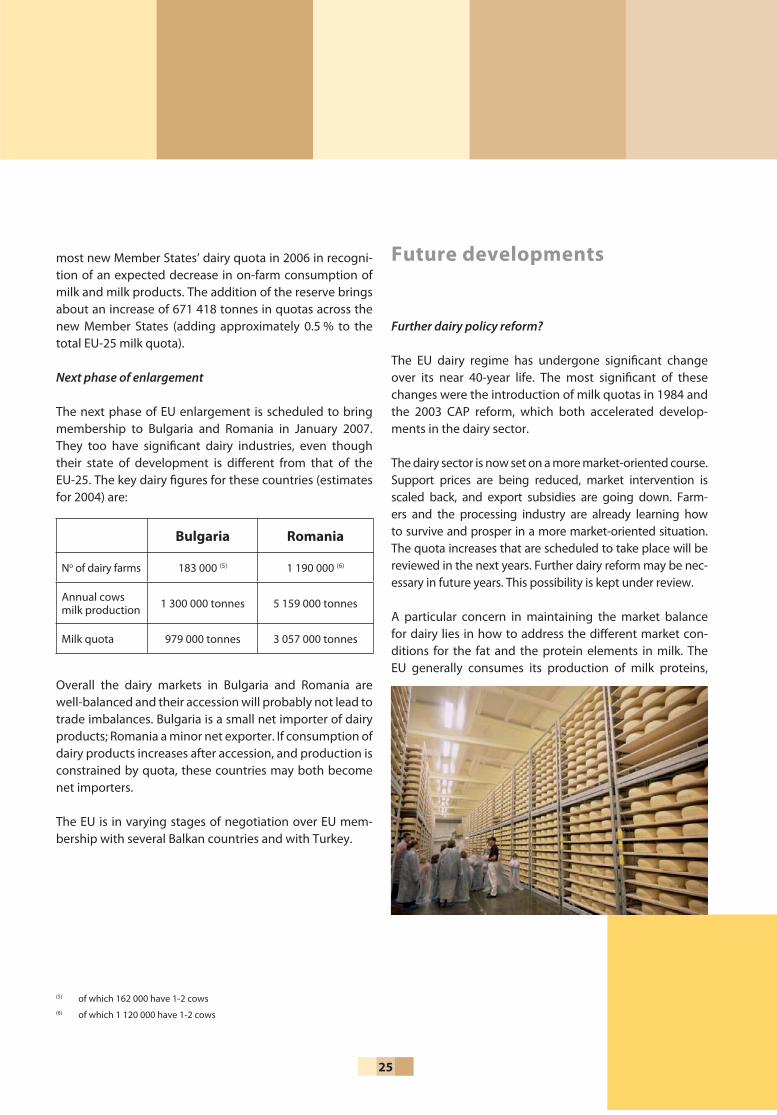
The next phase of EU enlargement is scheduled to bring membership to Bulgaria and Romania in January 2007. They too have signifi cant dairy industries, even though their state of development is diff erent from that of the EU-25. The key dairy fi gures for these countries (estimates for 2004) are:
Overall the dairy markets in Bulgaria and Romania are well-balanced and their accession will probably not lead to trade imbalances. Bulgaria is a small net importer of dairy products; Romania a minor net exporter. If consumption of dairy products increases after accession, and production is constrained by quota, these countries may both become net importers.
The EU is in varying stages of negotiation over EU mem-bership with several Balkan countries and with Turkey.
Future developments
Further dairy policy reform?
The EU dairy regime has undergone signifi cant change over its near 40-year life. The most signifi cant of these changes were the introduction of milk quotas in 1984 and the 2003 CAP reform, which both accelerated develop-ments in the dairy sector.
The dairy sector is now set on a more market-oriented course. Support prices are being reduced, market intervention is scaled back, and export subsidies are going down. Farm-ers and the processing industry are already learning how to survive and prosper in a more market-oriented situation. The quota increases that are scheduled to take place will be reviewed in the next years. Further dairy reform may be nec-essary in future years. This possibility is kept under review.
A particular concern in maintaining the market balance for dairy lies in how to address the diff erent market con-ditions for the fat and the protein elements in milk. The EU generally consumes its production of milk proteins,
Bulgaria Romania
No of dairy farms 183 000 (5) 1 190 000 (6)
Annual cows milk production 1 300 000 tonnes 5 159 000 tonnes
Milk quota 979 000 tonnes 3 057 000 tonnes
(5) of which 162 000 have 1-2 cows(6) of which 1 120 000 have 1-2 cows

26
and therefore has less need to export, whereas there have been problems with market surpluses for dairy fats. Future dairy policy changes need to address this.
Other forces that may aff ect the EU dairy policy
a WTO trade deal (in the Doha Development Round)future EU enlargements continued pressure on the CAP budgetthe push to simplify the CAP
Simplifi cation
Simplifi cation and Better Regulation for the Common Agri-cultural Policy is one of the key policy goals of the Com-mission (7). In this context the Commission proposes to move to a single ‘Common Market Organisation’ replacing the (21) existing ones including the milk CMO. The aim is to reduce red tape for both farmers and administrations by making rules more transparent, easier to understand and less burdensome to comply with.
The 2003 dairy reforms have resulted in other simplifi ca-tion opportunities. The 2003 dairy sector reform reduced intervention prices – butter by 25 % and SMP by 15 %. In line with the intervention price reductions the Commission intends to reduce the aid for subsidies for butter and SMP disposal on the internal market. This could have the eff ect that these schemes become redundant which would lead to signifi cant simplifi cation in operation of the dairy regime.
There will be a continuous search for options to simplify dairy policy. Other measures may be revised or withdrawn if appropriate.
••••
For further information
More information can be found at:
The CAP: http://europa.eu.int/comm/agriculture/index_en.htmhttp://europa.eu.int/comm/agriculture/publi/capexplained/ cap_en.pdfhttp://europa.eu.int/comm/agriculture/capreform/index_ en.htm
The dairy sector:http://europa.eu.int/comm/agriculture/markets/milk/index_ en.htm
Markets:http://europa.eu.int/comm/agriculture/agrista/index_en.htm
Trade/trade data:http://europa.eu.int/comm/agriculture/agrista/tradestats/ index_sem.htmhttp://europa.eu.int/comm/agriculture/external/wto/backgrou/ index_en.htm
(7) See Communication COM(2005) 509 fi nal
27
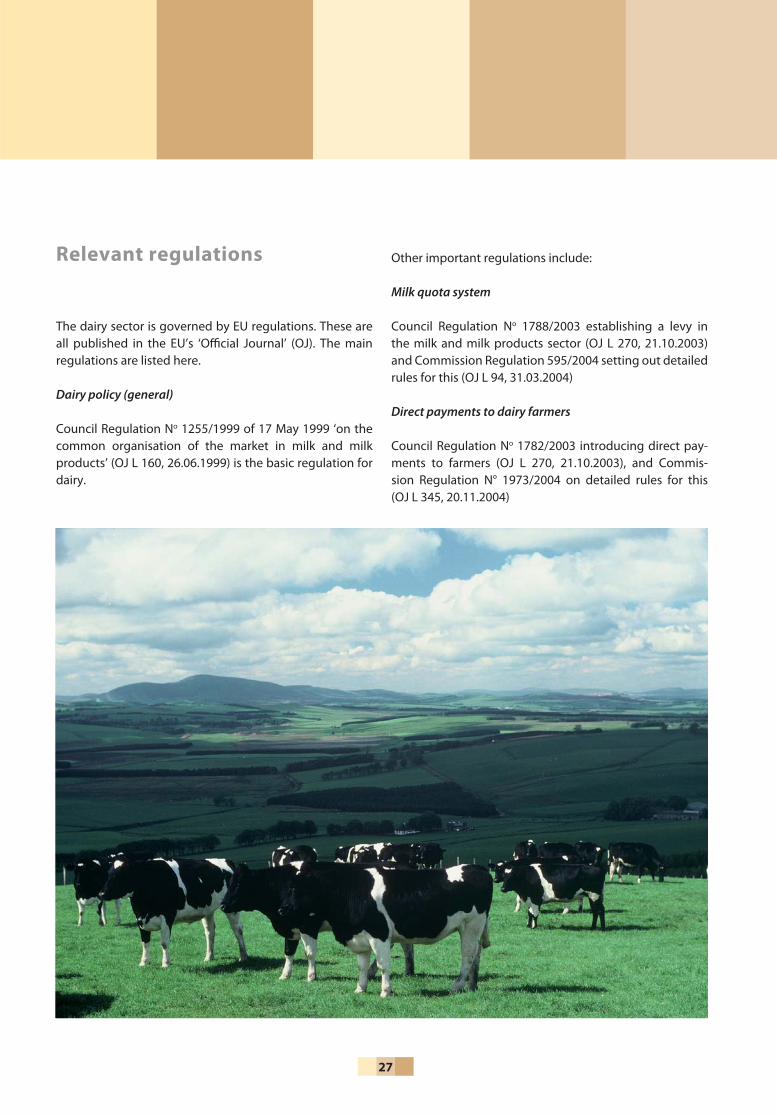
Relevant regulations
The dairy sector is governed by EU regulations. These are all published in the EU’s ‘Offi cial Journal’ (OJ). The main regulations are listed here.
Dairy policy (general)
Council Regulation No 1255/1999 of 17 May 1999 ‘on the common organisation of the market in milk and milk products’ (OJ L 160, 26.06.1999) is the basic regulation for dairy.
Other important regulations include:
Milk quota system
Council Regulation No 1788/2003 establishing a levy in the milk and milk products sector (OJ L 270, 21.10.2003) and Commission Regulation 595/2004 setting out detailed rules for this (OJ L 94, 31.03.2004)
Direct payments to dairy farmers
Council Regulation No 1782/2003 introducing direct pay-ments to farmers (OJ L 270, 21.10.2003), and Commis-sion Regulation N° 1973/2004 on detailed rules for this (OJ L 345, 20.11.2004)

European Commission
Milk and milk products in the European Union — August 2006
Luxembourg: Offi ce for Offi cial Publications of the European Communities
2006 — 27 pp. — 21 x 29.7 cm
ISBN 92-79-02199-0
,!7IJ2H9-acbjjc!ISBN 92-79-02199-0
KF-76-06-075-EN-C
© DigitalVision
European CommissionDirectorate-General for Agriculture and Rural Development
For further informationRue de la Loi 200, B-1049 BrusselsBelgium
TelephoneDirect line (+32) 2 295 63 63Exchange (+32) 2 299 11 11
Fax(+32) 2 299 17 61
Internethttp://ec.europa.eu/agriculture/index_en.htm