Military Draft and Economic Growth in OECD...
42
öMmföäflsäafaäsflassflassflas ffffffffffffffffffffffffffffffffffff Discussion Papers Military Draft and Economic Growth in OECD Countries Katarina Keller Susquehanna University Panu Poutvaara University of Helsinki and HECER Andreas Wagener University of Vienna Discussion Paper No. 228 June 2008 ISSN 1795-0562 HECER – Helsinki Center of Economic Research, P.O. Box 17 (Arkadiankatu 7), FI-00014 University of Helsinki, FINLAND, Tel +358-9-191-28780, Fax +358-9-191-28781, E-mail [email protected] , Internet www.hecer.fi
Transcript of Military Draft and Economic Growth in OECD...

öMmföäflsäafaäsflassflassflasffffffffffffffffffffffffffffffffffff
Discussion Papers
Military Draft and Economic Growth in OECDCountries
Katarina KellerSusquehanna University
Panu PoutvaaraUniversity of Helsinki and HECER
Andreas WagenerUniversity of Vienna
Discussion Paper No. 228June 2008
ISSN 1795-0562
HECER – Helsinki Center of Economic Research, P.O. Box 17 (Arkadiankatu 7), FI-00014University of Helsinki, FINLAND, Tel +358-9-191-28780, Fax +358-9-191-28781,E-mail [email protected], Internet www.hecer.fi

HECERDiscussion Paper No. 228
Military Draft and Economic Growth in OECDCountries*
Abstract
Economic theory predicts that military conscription is associated with static inefficienciesas well as with dynamic distortions of the accumulation of human and physical capital.Relative to an economy with an all-volunteer force, output levels and growth rates shouldbe lower in countries that rely on a military draft to recruit their army personnel. For OECDcountries, we show that military conscription indeed has a statistically significantly negativeimpact on economic performance.
JEL Classification: H20, H57, J22, C68.
Keywords: Growth, military draft, augmented Solow model.
Katarina Keller Panu Poutvaara
Department of Economics Department of EconomicsSigmund Weis School of Business University of HelsinkiSusquehanna University P.O. Box 17Selinsgrove, PA 17870 00014 University of HelsinkiUSA FINLAND
[email protected] [email protected]
Andreas Wagener
University of HannoverInstitute of Social PolicyKoenigsworther Platz 130167 HannoverGERMANY
*We are grateful for useful comments from two anonymous referees, Niclas Berggren,Jesus Crespo-Cuaresma, Henrik Jordahl, Doina Radulescu, seminar participants at theUniversity of Linz, WZB Berlin, ETLA and VATT in Helsinki, IFN in Stockholm, andconference participants in Munich, Yaroslavl, Hanoi, and Paphos. Poutvaaraacknowledges financial support from the Yrjö Jahnsson Foundation.

1 Introduction
To recruit military manpower, governments can rely on conscription (military
draft), on voluntary enlistments, or on a combination of both. Military manpower
systems differ considerably across time and space. A number of countries (like the
United Kingdom and the United States) rely on all-volunteer forces while other
countries traditionally recruit substantial fractions of their military staff through
conscription. Many nations have changed their recruitment systems over time,
even during periods of peace. Although proposals to (re-)establish a military draft
surface from time to time even in traditionally nondrafting countries, the recent
trend in military recruitment is moving toward professional armed forces. A
number of countries (such as Belgium, the Netherlands, France, Spain, Portugal,
Italy, Hungary, Romania, the Czech Republic and South Africa) have abolished
or started to phase out conscription. Yet, 8 out of the 22 countries that belonged
to the OECD already in 1985 and had a population over one million still (i.e.,
in 2008) use conscription, with draft spells ranging from 4 to 17 months. As
a corollary to the military draft, most democratic countries offer conscientious
objectors to bearing arms the option of an alternative service, typically to be
delivered in the social sector.
Given its volume (the draft is generally intended to cover all able-bodied
men in every cohort) and its duration (spells in the past typically were well
above one and a half years), conscription can be expected to significantly impact
economic performance. Naturally, the economic costs of an all-volunteer force are
significant as well. Both systems rely on the government’s power to tax, either
by forcing young men and, although rarely, women to work in the military or by
levying monetary and general taxes, the proceeds of which go to pay professional
soldiers. Economists routinely argue that a military draft is the more costly way
for a society to enlist military personnel. The extra costs of military conscription
range from static deadweight losses to long-term distortions in the accumulation
1

of human and physical capital (see the next section for a brief survey). Being
of the same nature as military conscription, the use of conscientious objectors in
the social sector causes similar efficiency losses.
Despite this clear verdict by economic theory, so far not much empirical ev-
idence has been provided on the macroeconomic inferiority of a military draft,
relative to an all-volunteer force. This paper establishes such evidence for OECD
countries in the period between 1960 and 2000. Taking as our starting point the
growth model by Mankiw et al. (1992), we empirically evaluate the hypothesis
that, compared with a professional army, military conscription exerts negative
and lasting impacts on aggregate output and growth. Our empirical results are
in line with this hypothesis. To capture the effects of changes in military conscrip-
tion on growth not only across countries but also over time, we then extend the
analysis to a panel data model, which convincingly corroborates our cross-country
regressions.
An important remaining concern is that the choice of manpower procurement
method is endogenous. The elimination of conscription could be an endogenous
response to rising income levels, rather than a cause of rising income levels (or
higher growth). Furthermore, rising income levels may be associated with tech-
nological improvements that make military capital more productive, as suggested
by Warner and Asch (1996).1 In other words, high-income countries have a higher
opportunity cost of providing for national defense via manpower than low-income
countries. Therefore, causality could run from income levels to growth, rather
than the other way round. To address this important concern, we have tested for
Granger causality between conscription and growth. Our results indicate that
for the statistically highly significant results, generally the length of conscription
time Granger causes growth and the conscripts share causes the income level.
However, we also find in some instances that the level of income Granger cause
1We are indebted to an anonymous referee for raising this point.
2

the length of conscription time. Therefore, our results still need to be interpreted
with caution.
The rest of the paper is organized as follows: Section 2 briefly outlines the
economic effects (which are mostly disadvantages) of military conscription. Sec-
tion 3 reviews previous studies on the empirical relationships between conscrip-
tion, military expenditures, and economic performance. None of these studies
has, however, focused on the macroeconomic and long-term impacts of military
draft. Section 4 introduces such a set-up in the form of an augmented Solow
model. Section 5 reports our results and includes a sensitivity analysis, and
Section 6 concludes.
2 Static and Dynamic Costs of the Draft
Adam Smith presented a clear case against conscription and found an ”irresistible
superiority which a well-regulated standing [=all-volunteer] army has over a mili-
tia [= conscription]” (Smith 1976 [1776], p. 701). Most economists have since
been favoring professional soldiers over conscripted ones. They argue that, in
spite of its lower budgetary cost for the government, a draft system imposes
larger opportunity costs on society than an all-volunteer force. Most arguments
in that discussion focus on static inefficiencies from which a draft system suffers
(Hansen and Weisbrod, 1967; Fisher, 1969; Lee and McKenzie, 1992; Sandler
and Hartley, 1995, Chapter 6; Warner and Asch, 2001, Poutvaara and Wagener,
2007):
• Military draft burdens conscripts with opportunity costs that exceed the
fiscal costs by the maximum amount draftees are willing to pay to avoid
compulsory service. These extra costs can be measured by the difference
between the draftees’ potential market income and the lower pay during
the service plus the pecuniary value of the disutility from having to work in
3

an occupation and under circumstances that draftees otherwise would not
have chosen. This pecuniary disutility includes the extra risk of death or
injury that military service may entail.
• Largely ignoring the draftees’ productivity differences and comparative ad-
vantages, conscription involves an inefficient match between people and jobs
and, thus, an avoidable output loss.
• The apparent cheapness of draftee labor leads to an excessive personnel-
capital ratio in conscript armies.
• Shorter periods of training, lack of experience, higher turnover rates, and
absence of motivation and incentives imply lower labor productivity for
draftees than for professional soldiers.
There are a few exceptions on the widespread disapproval of military draft
among economists: Lee and McKenzie (1992) and Warner and Asch (1995) argue
that military draft with its in-kind finance can be socially less costly than a
professional army if the latter’s budgetary costs are financed through high and
distortionary taxes.
Lau et al. (2004) argue that the draft involves, in addition to static ineffi-
ciencies, dynamic and long-term costs that do not arise with a professional army.
These costs emerge through two channels from the specific timing and incidence
of the draft. First, the military draft hits young men and, although rarely, women
during a period of their lives that they would otherwise devote to the accumu-
lation of human capital: education, studying, vocational training, or gathering
first work experiences. The draft interrupts or postpones this investment process.
Moreover, draftees see the human capital they accumulated before the draft de-
preciating during service – a point which was already stressed by von Thunen
(1875, pp. 145ff.) when arguing that conscripted soldiers should be viewed as
4

“capital goods” (see Kiker, 1969). Both effects imply a reduction in the econ-
omy’s stock of human capital (also see Spencer and Woroniak, 1969). Second,
the draft as an in-kind tax is one-sidedly levied on young people. Compared
to “normal” monetary taxation (which then could, among other things, go to
finance a professional army) the burden of the draft tax is higher, measured in
terms of the present value of the reduction of taxpayers’ lifetime incomes. The
front-loaded reduction in lifetime income discourages saving and, thus, capital
accumulation, leaving the physical capital stock in an economy with a military
draft smaller than in an otherwise identical economy with a professional army.
With a lower stock of human and physical capital, the level and the growth
rate of national income in an economy with a conscripted army tend to be lower
than with an all-volunteer force. Simulations for a computational general equi-
librium economy by Lau et al. (2004) demonstrate that these long-run costs of
the draft can be sizeable: If the whole population was subject to a draft (i.e.,
everybody has to spend one year in military service at the age of 18), long-run
GDP would be depressed by up to one percent, relative to an identical econ-
omy that has the same level of military output produced in an (equally efficient)
all-volunteer army.
There is also some literature on how the use of draft is related to other coun-
try characteristics. Warner and Negrusa (2005) suggest that also differences in
evasion costs could explain why some European countries have kept conscription,
and others have abolished it. Mulligan and Shleifer (2005) relate the use of con-
scription to other government regulation. They argue that countries with a lot
of other government regulation are also more likely to use draft. Their exam-
ple of a typical such country is France, which actually abolished conscription in
2001. Moreover, based on cross-sectional data from 1980, Anderson et al. (1996)
conclude that “warlike” states are more likely to employ conscription.
5

3 Empirical Studies
Virtually all empirical studies focus on the static efficiency losses of a draft system.
These losses seem to be quite sizeable: Kerstens and Meyermans (1993) estimate
that the social cost of the (now abolished) Belgian draft system amounted to
twice the budgetary cost. Lutz (1996) reviews several studies from the 1980s
and 1990s and reports that the annual monetarized utility losses of conscripts
in the German army (which remain unaccounted for in the government budget)
were between 2.2 and 6.7 billion euros (i.e., between 9 and 27 percent of German
defense expenditure at that time).
A number of studies examine the impact of serving in the military on the
lifetime earnings of ex-soldiers. Imbens and van der Klaauw (1995) observe sub-
stantial losses of up to 5 percent of lifetime earnings (compared to non-conscripts)
for Dutch draftees in the 1980s and early 1990s. Effects are even larger during
times of war: in the early 1980s, the earnings of white Vietnam War veterans
were 15 percent lower than the earnings of comparable non-veterans (cf. An-
grist, 1990). For Germany, Kunze (2002) finds that compulsory service leads
to increases in wage income for men by 3.2 percent during the first year after
conscription and depresses wage income beyond the first year, where the gap in
wages increases with time. To the extent that earning differentials reflect differ-
ences in human capital formation, this empirical evidence thus corroborates that
the military draft imposes dynamic costs in the form of a lower labor productiv-
ity. One should highlight that these estimated effects include any potential gains
from skills learned during military service; the fact that the estimated effect of
draft is negative reflects the extent to which such skills are less valuable than
civilian education or on-the-job experiences. Holmlund and Liu (2006) estimate
the effects of postponing university education in Sweden, whether due to mili-
tary draft or other reasons. They find that postponing education by one (two)
years reduces the average lifetime earnings of men by an amount equal to 21 (37)
6

percent of annual earnings at the age of 40.
There is a substantial body of literature, initiated by Benoit (1973) and sur-
veyed, e.g., by Ram (1995), Deger and Sen (1995), and Dunne et al. (2005), on
the nexus between military expenditure and economic growth. By and large, mil-
itary spending does not seem to contribute positively to economic well-being and
growth. Some studies have found that especially at low levels of economic devel-
opment military expenditure may go along with positive externalities (e.g., public
infrastructure development, technology spillover effects) that promote economic
growth (Crespo-Cuaresma and Reitschuler, 2003; Hooker and Knetter, 1997; Heo,
1998). These studies mainly employ the so-called Feder-Ram model; other stud-
ies, using mainstream growth models, do not identify a statistically significant
effect of military expenditure on growth or even show clearly negative impacts
(e.g., Knight et al., 1996). Reviewing the literature, Dunne et al. (2005) conclude
that the Feder-Ram model suffers from serious problems. Dunne et al. (2005)
advocate instead using mainstream growth models, like the augmented Solow
model that we employ in our analysis.
As argued by Stroup and Heckelman (2001), the impact of the military’s use
of an economy’s labor force on economic growth may be non-linear and depend
on the overall quality of human capital: With higher educational attainment, the
opportunity costs of displacing young men from the private sector workforce to the
military is high, resulting in reduced economic prosperity. With low educational
attainment of the young male workforce, spending a certain time in the military
may increase the quality of human capital by providing training opportunities,
e.g., self-discipline, communicative skills, or problem-solving techniques. Stroup
and Heckelman (2001) indeed find empirical support using data for Africa and
Latin America that recruitment to the military has higher and adverse effects on
economic growth in countries with higher educational standards. However, they
do not relate their estimates to whether the countries in question were running
professional armies or used conscription.
7

A measure for the usage of the military draft is included in Haltiner (2003)
which, for a sample of 15 Western European countries with military conscription
between 1970 and 2000, finds a faint association between a country’s GDP per
capita and the share of conscripts among the active military personnel. However,
this study excludes countries with all-volunteer armies and is based on a simple
bivariate correlation analysis that does not control for any other factors that
could influence either GDP or the recruitment scheme.
4 Model and Data
Our analysis to estimate the income and growth effects of military conscription
builds on an augmented Solow growth model where the production process uses
physical capital, human capital, and labor:
Y (t) = A(t,m) · K(t)α · H(t)β · L(t)1−α−β.
All inputs receive a positive factor share, i.e., α, β, 1 − α − β > 0. For year t,
Y (t) denotes the gross domestic product, K(t) and L(t) represent the amounts of
physical capital and non-augmented labor employed in the production, and H(t)
captures the stock of human capital. The variable A(t,m) measures total factor
productivity which depends on m, a vector of military variables (see below).
A similar Solow-type approach was used by Knight et al. (1996) to test for the
impact of military spending on economic growth. We apply the augmented Solow
model first to a cross-country analysis, extending Mankiw et al. (1992), as well
as to a panel data analysis.
The labor force grows at an exogenous and constant rate n, and the technology
parameter grows at constant rate g. Moreover, the economy is assumed to be
on a balanced growth path where it devotes constant shares sk and sh of GDP
to investments in physical and human capital. Assuming an equal rate δ of
depreciation for human and physical capital, one obtains (for details see Mankiw
8

et al. (1992)):
ln[Y (t)/L(t)] =1
(1 − α − β)ln A(0,m) +
g · t(1 − α − β)
− (α + β)
(1 − α − β)· ln(n + g + δ) +
α
(1 − α − β)· ln(sk)
+β
(1 − α − β)· ln(sh). (1)
As argued by Bernanke and Gurkaynak (2001), this framework can be used to
evaluate essentially any growth model that admits a balanced growth path (also
endogenous growth models).
Following Mankiw et al. (1992), we approximate the above equation by a Tay-
lor expansion around the steady-state and solve the resulting differential equa-
tion. We then obtain the following estimable equation for the growth of per-capita
GDP:
ln[Y (t)/L(t)] − ln[Y (0)/L(0)] = (1 − e−λt)(ln A(0,m) + g · t)
+(1 − e−λt)α
1 − α − βln(sk)
+(1 − e−λt)β
1 − α − βln(sh)
−(1 − e−λt)α + β
1 − α − βln(n + g + δ)
−(1 − e−λt) ln[Y (0)/L(0)] (2)
where λ := (1 − α − β)(n + g + δ) is the rate of convergence.
We use data for the group of 21 OECD2 countries, also used in Mankiw et
al. (1992). While Mankiw et al. (1992) analyze the time period from 1960 to
1985, our time period spans from 1960 to 2000. In the cross-country regressions,
the dependent variable is the natural logarithm of real per-working-age-person
2These are: Australia, Austria, Belgium, Canada, Denmark, Finland, France, Greece, Ire-
land, Italy, Japan, the Netherlands, New Zealand, Norway, Portugal, Spain, Sweden, Switzer-
land, Turkey, the United Kingdom and the United States. Germany is omitted due to its
reunification.
9

GDP in 2000 for the analysis of income levels and the difference in the logarithm
of GDP per working-age person between 2000 and 1960 for growth regressions.
Data sources are listed in the Appendix.
In the growth regressions, the natural logarithm of initial real GDP per
working-age person in 1960 is held constant. We proxy sh by the average share of
the working-age population in secondary education over this time, i.e., the ratio
of those enrolled in secondary education to those of high school age times the
share of the working-age population of high school age.
Following Mankiw et al. (1992), Nonneman and Vanhoudt (1996), and Bernan-
ke and Gurkaynak (2001), we estimate (n + g + δ) by adding 0.05 (of which the
technology growth rate is 0.02 and the depreciation rate is 0.03) to the average
annual growth rates of the working-age populations between 1960 and 2000.
As suggested by theory, military recruitment and expenditures may impact
output and growth. Here, we hypothesize that they affect growth of GDP per
person of working age. In particular, we include the following alternative mea-
sures of military conscription, one at a time: a dummy for whether conscription
was enforced or not, the number of conscripts as a share of the labor force, the
duration of conscription (in years), each measured for the year 1985, and the du-
ration of alternative service for as early as available.3 While growing over time,
the fraction of recruited draftees who actually deliver alternative service has been
rather low in most countries.4 Yet, we include the length of alternative service as
3When the time of service varies between the different branches of the military, the share of
conscripts in each branch is calculated (or if unavailable, the share of each branch, assuming
that conscripts are proportionally distributed) and then multiplied with the respective time of
service.4For the countries in our sample, WRI (2005) reports shares between 3 and 10 percent for
the 1990s, with exceptions including Austria (more than 20 percent) and Italy (more than 50
percent). In Spain, about 75 percent of eligible men claimed conscientious-objector status by
2001 when the draft ended (and beyond our sample, in 2006, Germany had more men entering
alternative service than conscription. See Gilroy and Williams, 2006).
10

a regressor. In most countries, alternative service has been considerably longer
than ordinary military service. Moreover, there is a selection effect that the bet-
ter educated people may be more likely to opt for alternative service, rendering
the impact of alternative service more important than the population share of
those choosing such service suggests. In addition to features of military conscrip-
tion, we include the size of the military sector in the analysis, captured by the
logarithm of military expenditures as a share of GDP.
The panel regressions are estimated analogously, however, by decade instead
of the whole 1960-2000 time period. Averages are taken over each of the four
decades separately. To improve the reliability of each estimate, the conscription
variables are average values for the initial year and the middle year of each decade
(as available).5 We also report estimates for a pooled least squares model and a
fixed-effects model with country-specific dummy variables as well as discuss panel
regressions with period dummy variables.
Table 1 summarizes descriptive statistics on the use of conscription and mil-
itary expenditures. There has been a steady decline in the use of conscription:
in 1965, 16 out of 21 OECD countries (apart from Germany) used conscription.
5For example, the value for the 1980s is an average of the values for 1980 and 1985. As
averages of the initial and middle years of the decades are used, in a few cases some countries
receive 0.5 for their dummy variables when conscription was changed between those years.
Moreover, as New Zealand’s military service until at least 1980 was ”voluntary, supplemented
by Territorial service of 12 weeks for the Army” (Military Balance, 1980-1981, p.73), which by
1985 was reduced to ”7 weeks basic [training], 20 days per year” (Military Balance, 1985-6,
p.130), its conscription dummy is set to 0.5. For Austria, we use the general conscription time,
ignoring the possibility for conscripts to voluntarily extend their service in certain army units.
As the Military Balance does not provide 1965 conscription data for Austria and Finland, the
values for the conscription dummy and the service time are extended backward from 1970 by
corresponding information from Austria’s Ministry of Defense (personal communication) and
FINLEX (2006). The Republic of Ireland (which is also missing in the Military Balance) has
never used conscription (see Irish Defence Forces, 2006). Data on alternative service is not
sufficiently available for a panel.
11

The number of countries with conscription decreased to 14 in 1975 and 1985, and
13 in 1995. Alternative service has generally been longer and was on average
almost 14 months in 2000 (or earliest available information), excluding Turkey
which did not allow for alternative service. The average share of the labor force
drafted has also decreased over time from 1.4 percent of the labor force in 1965
to 0.9 percent in 1995.
As seen in Table 1, countries with conscription on average had a lower real
GDP during the whole time period 1960 to 2000. According to the hypothesis of
conditional convergence, we would expect them to catch up and – they did indeed
grow faster in the early decades. However, in the last decades, the countries with
conscription have been growing at a lower rate than those without, thus falling
further behind. Their consistently lower investment in human capital is likely to
have contributed to this inferior economic performance. Their initially slightly
higher investment in physical capital tapered off to equal levels over this time.
[INSERT TABLE 1 HERE.]
5 Results
5.1 Cross-country Analysis
When estimating eqs. (1) and (2), we extend the cross-country growth model by
Mankiw et al. (1992) by adding four alternative variables measuring the use of
conscription. For the sake of comparison, we report growth regressions without
conscription variables for the same time period. As inflation often has been
shown to negatively affect economic growth, we add inflation as an additional
control variable (Tables 3 and 5). In all specifications, our analysis suggests that
military conscription negatively impacts both the level and the growth of GDP
per working-age person in OECD countries.
12

Tables 2 and 3 report OLS regression results for income levels. Enforcing
the military draft depresses income, although not statistically significantly so at
conventional levels once inflation is added. When interpreting this result, one
should notice that high inflation is more likely in countries that are not able to
collect enough taxes by direct means. As countries may also resort to conscription
when there is a high deadweight loss of taxation, inflation and conscription are
likely to be correlated. For our regressions, the conscripts share and inflation are
highly correlated usually at the 1 percent level.6 The number of conscripts as
a share of the labor force, the length of conscription spells and the duration of
alternative service have statistically highly significant negative impacts on income
levels (at the 1- or 5-percent levels).
[INSERT TABLES 2 AND 3 HERE.]
Tables 4 and 5 show the results of growth regressions. Running a draft scheme
turns out to hamper growth statistically significantly (at the 1- or 5-percent level).
However, when inflation is included, the conscription dummy variable loses statis-
tical significance at standard levels. As with income levels, the conscripts share,
and the time spent in military service or in alternative service have statistically
highly significant negative effects also on economic growth. The coefficient of
the conscripts share of the labor force is the largest in both the income and
growth regressions, thus indicating a strong negative relationship between coun-
tries’ conscripts share and their income levels and its growth. In extensions of
our analysis, we observed a statistically significant and high correlation between
inflation and conscription variables. This may explain why the inclusion of infla-
tion as a regressor in income and growth regressions reduces the significance of
the conscription variables.
6Warner and Negrusa (2005) argue that the end of the Cold War reduced the necessity of high
military capacities which, given that deadweight costs of normal taxes had been high, reduced
European countries’ inclination towards conscription. Shleifer and Mulligan (2005), however,
show that a high deadweight loss of taxation is not able to explain the use of conscription.
13

[INSERT TABLES 4 AND 5 HERE.]
There is little evidence that military expenditures per se statistically signifi-
cantly impact income levels or their growth (Tables 3 and 5). This is in line with
the inconclusive evidence on the relationship between defense expenditure and
growth that emerges from similar growth models (see Dunne et al., 2005).
Overall, the augmented Solow model with conscription variables explains
much of per-working-age-person GDP and its economic growth for OECD coun-
tries with adjusted R2s varying between 53 and 87 percent in the income re-
gressions and between 77 and 86 percent in the growth regressions. Remarkably,
adding conscription variables improves the adjusted R2 in all cases, and often sub-
stantially. Moreover, conscription variables have in many cases a higher statistical
significance than the traditional explanatory variables for economic growth. To-
gether, these patterns suggest that military conscription indeed has a statistically
significant negative impact on economic growth.
5.2 Panel Data Analysis
For the panel data analysis, we use four 10-year periods and report results both for
pooled least squares (PLS) regressions with a common constant and for a fixed-
effects model with country dummy variables. Panel regressions use 84 variables
(four decades with 21 countries each) except for those with Conscripts/Labor
Force as a regressor. Here, only 73 observations are available. The baseline
scenario (without conscription) for these samples has been accordingly adjusted.7
Our panel data analysis confirms the negative and statistically significant im-
pact of conscription on income and economic growth that already arises from the
7Moreover, regressions with time-period dummy variables exhibit qualitatively similar re-
sults and are available upon request. The regressions with a common constant extend the
cross-country regressions by Mankiw et al. (1992) to a dynamic panel data model. In this
context, Islam (1995) advocates a fixed-effects model with country-specific differences in the
aggregate production function.
14

cross-country analysis. The negative impact on income is statistically significant
at the 1-percent level for the share of conscripts in the labor force and for the du-
ration of military service, and at the 10-percent level for the conscription dummy
variable (Table 6). Adding inflation (see Table 7) decreases the statistical signif-
icance somewhat. However, only the conscription dummy becomes insignificant.
Similarly, the conscription coefficients are negative and statistically significant to
growth at the 1- or 5-percent level (Table 8), while including inflation leads to
insignificance of the conscript share (Table 9).8 However, this variable generally
has the largest negative coefficient. Adding conscription variables to the stan-
dard model by Mankiw et al. (1992), and alternatively including also inflation,
generally increases the explanatory power, with the adjusted R2 now ranging
from 0.457 to 0.664 for the income regressions and 0.427 to 0.709 for the growth
regressions.
[INSERT TABLES 6 TO 9 HERE.]
The fixed-effects regressions (reported in Tables 10 to 13) yield qualitatively
similar results to the PLS regressions. The explanatory power generally improves,
with the adjusted R2 ranging from 0.735 to 0.795 for income levels and 0.532 to
0.770 for growth, when including the conscription variables. Conscription statis-
tically significantly depresses income and its growth (according to Tables 10 to 13
generally at the 1- or 5-percent level). However, the conscripts share loses its sig-
nificance once inflation is added to the income regressions and is insignificant in
these growth regressions with country-specific effects. Including country-specific
effects removes the important cross-country differences in panel data, and relies
instead on the within-country time-series aspect. Moreover, adding conscription
8The statistically significant correlation between inflation and the conscription variables
persists in a panel framework, and is especially strong for the conscripts share. This may again
be the reason why the statistical significance of the conscription variables is affected when
inflation is included in these regressions.
15

variables, inflation or country-specific effects boosts the estimated rate of conver-
gence (the implied λ) in almost all of our growth regressions.
[INSERT TABLES 10 TO 13 HERE.]
Our different panel regressions corroborate the statistically significant nega-
tive impact of conscription on income and growth. To consider the magnitudes of
these effects for the numerical conscription variables, if the duration of military
service or the conscripts share were decreased by one standard deviation (0.66
and 0.01 respectively), growth over a 10-year period would increase by on average
4.61 or 4.32 percentage points.9 These effects are quite large. They conform to
the intuition that the more intensely conscription is enforced, the more labor is
diverted from endeavors of higher productivity in the economy, and the lower is
output and its growth.
A complementary explanation might originate from Mulligan and Shleifer
(2005) who show that conscription is especially salient in countries with extensive
bureaucracies and government regulations. Hence, the negative effects captured
by conscription could reflect not just misallocations and distortions caused by the
military recruitment system, but of state intervention more generally.10 However,
when we test for this by adding government spending (without education expen-
ditures) to the regressions in our tables, the highly significantly negative signs
of the conscription variables generally remain. In a few cases, the consciption
variables obtain even higher levels of significance. E.g., the conscription dummy
variable gains significance at the 5 percent level in Table 6. In Table 7, con-
scription duration becomes significant at the 5 percent level, and the share of
conscripts at the 1 percent level. An exception is the fixed effects model for
9Based upon efficient estimators. The length of military service is estimated from the fixed
effects growth regression with inflation, which has a higher explanatory power. The conscripts
share estimate is based on the PLS regressions without inflation where a common constant is
accepted and where the variable is of high statistical significance.10We are grateful to an anonymous referee for offering this interpretation.
16

growth without inflation (Table 12), where the conscription variables lose signif-
icance at standard levels (although by a narrow margin). However, they regain
the same significance levels as in Table 13 once inflation is included.11 Hence, it
does not appear that the conscription variables are capturing the effects of overall
government spending.
5.3 Sensitivity Analysis and Extensions
Causality. An important concern related to our analysis is that the use of
conscription is an endogenous variable. Previous contributions by Warner and
Asch (1996), Warner and Negrusa (2005) and Mulligan and Shleifer (2005) have
aimed at explaining why some countries use military draft while others do not.
More specifically, it could be that poorer countries use draft and richer countries
professional armies, in which case the causality would run reversely from income
levels to conscription variables.12 Growth rates are often used in the growth
literature because it is less prone to reverse causality problems than income levels,
and half of our regressions are using growth rates as the dependent variable,
following Mankiw et al. (1992). Using lagged variables reduces reverse causality
11The variable for government expenditure generally has a positive sign to income and a
negative sign to growth, and is usually insignificant in the cross-country regressions and to
growth. The significant positive sign to income levels in the shorter time spans of the panel
regressions could be a sign of reverse causality where richer countries spend a larger share of
their GDP on government expenditures. Tables that report the numerical results for these
regressions are available upon request.12In an analysis of the causes of conscription, Mulligan and Shleifer (2005) do not find any
statistical significance for an impact of a country’s per-capita income on the choice of military
recruitment systems. Rather the choice of conscription seems to be largely driven by countries’
ability to cope with the high administrative burden of organizing a system of military draft;
Mulligan and Shleifer argue that this ability is positively correlated with a French, civil-law
legal origin. Moreover, both countries with conscription and all-volunteer forces have downsized
their militaries since the end of the Cold War (Gilroy and Williams, 2006).
17

problems as well, and we use conscription variables from 1985 or from early in
the decade.
To investigate the possibility of reverse causality, we estimate Granger causal-
ity between conscription and income or its growth, using 5-year intervals of our
data for each country. We test for causality in both ways (with one and two lags,
representing 5 and 10 years, respectively).13 For many countries the null hypoth-
esis of no Granger causality in either direction cannot be rejected at the 5-percent
confidence level. This finding is not at odds with the previously estimated nega-
tive effect of conscription on income levels and growth as Granger causality tests
omit other explanatory variables for income levels and growth, like investment
in physical and human capital. Moreover, the tests do not take into account the
cross-country aspect of the panel data. Nevertheless, we find that quite often
the length of conscription (highly significantly for Austria, France and Greece)
and the share of conscripts in the labor force Granger cause growth. However,
in Sweden, growth causes the duration of military service, and in Switzerland,
growth causes the conscripts share. While we observe high statistical significance
from conscription variables (especially the conscripts’ share in the labor force for
Greece and the Netherlands) to income levels, there are also some indications of
reverse causality from income levels to conscription variables, especially to the
duration of conscription (for Italy, Portugal and Sweden). Moreover, in Sweden
income Granger causes the conscripts share.
13Granger causality is appropriate for stationary data. This is somewhat problematic to verify
as the appropriate unit-root tests generally require at least 20 observations. We nevertheless
ran them (alternating between including a constant, a constant and a linear trend, or neither),
and find that the null of non-stationarity is typically rejected for the conscription variables of
most countries. Only for four countries (Austria, Belgium, Greece and the Netherlands) is the
null always accepted. In the remaining cases the null is rejected for the duration of military
service except for Switzerland. The results are highly significant for France, Portugal, Spain
and Turkey. The null is often rejected also for the conscripts share (for Denmark, Norway,
Sweden, Switzerland and Turkey, highly significantly, except for Norway.).
18

As an additional test for causality, we set up the regressions in reverse, re-
gressing conscription variables on past values of income levels and growth, respec-
tively. These regressions have much lower explanatory power, and income and
its growth are generally insignificant to subsequent conscription variables. In the
panel regressions, past income levels show statistical significance to the duration
of conscription at the end of the decade, however, with much reduced adjusted
R-squared (about 30 percent). The statistical significance of income levels on the
conscript shares disappears once inflation is added. Similarly, growth is highly
significant to the conscription dummy until inflation is included, after which it
is significant at the 10 percent level. These regressions explain about 20 percent
of the variation in the conscription variables. In the cross-country regressions,
past values of income and growth are never statistically significant to any of the
conscription variables in 2000.
Sensitivity analysis. In addition to causality tests, we also checked the robust-
ness of our results with an extensive sensitivity analysis. To reduce the influence
of potential outliers, we conducted least median of squares (LMS) regressions
and least absolute value (LAV) (or least absolute deviation) regressions for the
models in Tables 2 to 9. Moreover, to exclude that the effects of conscription
would reflect just the general military situation, we ran regressions that added
military expenditures and the share of military personnel in the total labor force.
Following Nonneman and Vanhoudt (1996), we also extended the model to in-
clude R&D expenditure as a regressor. All additional regressions confirm, at high
levels of statistical significance, our conclusion that military conscription has a
negative and sizeable impact on income and economic growth.14
14Detailed material on the sensitivity analysis and extensions is available upon request.
19

6 Conclusion
Economic theory predicts that military conscription is associated with static in-
efficiencies as well as with dynamic distortions of the accumulation of human and
physical capital. Relative to an economy with an all-volunteer force, output levels
and growth rates are expected to be lower in countries that rely on military draft
to recruit their army personnel. For OECD countries, we show that military
conscription indeed has a statistically significant negative impact on economic
performance. Thus, the losses in individual lifetime earnings, which a number of
microeconometric studies observe for former conscripts, indeed translate into sub-
stantial reductions in income and growth on the macroeconomic level, rendering
military conscription a socially unnecessarily costly way of military recruitment.
The result that military conscription has a negative impact on GDP per
working-age person and on its growth is robust in various specifications. We
measure the impact of conscription by a dummy variable, by the labor force
share of conscripts, and by the duration of conscription or of alternative service.
With all these variables, conscription has a consistently negative and usually
statistically significant effect. In line with previous studies (see Section 3), we
find that military expenditure as such is generally insignificant. The negative
impact of compulsory military service also consistently emerges when the sample
is treated as decade-wise panel data regressions. Granger causality tests indi-
cate that generally causality runs from conscription to income levels and growth,
rather than the other way round. We hope that future research, perhaps being
able to draw from longer time-series data, as well as larger samples, will help to
clarify this complex relationship in greater detail than we have been able to do
with our limited panel data.
Overall, the estimated effects of military draft on income levels and growth
appear quite large (ranging between 4.3 and 4.6 percentage points over a decade).
Even if our estimates suggest that causality is more likely to run from conscription
20

to income levels and growth than the other way round, reverse causality cannot
altogether be excluded. Therefore, and due to the simplicity of our approach,
our estimates should be viewed with some caution. On the other hand, the dy-
namic costs of military conscription indeed seem to be sizeable: In a calibrated
CGE model (that is crafted to be favorably biased towards military draft), Lau
et al. (2004) estimate that conscription may cost an economy up to one percent
of GDP. In an empirical study on Italy, Cippolone and Rosolia (2007) estimate
that the abolition of military draft leads to an increase in male high-school grad-
uation rates by between two and four percentage points – where each point would
permanently raise per capita GDP by about 0.25 percent.
To conclude, as our estimates show that conscription substantially reduces
economic growth, at least OECD countries would be ill advised to rely on a
military draft.15 The main reasons why the benefits to growth appear to be quite
large, are likely because of the misallocations of human and physical capital
rendered especially from conscription taking time away from education.
References
Anderson, Gary M., Dennis Halcoussis, and Robert D. Tollison, 1996. Draft-ing the competition: Labor unions and military conscription. Defense and PeaceEconomics 7, 189 – 202.
Angrist, Josh D., 1990. Lifetime earnings and the Vietnam era draft lottery: Ev-idence from Social Security Administration records. American Economic Review80, 313 – 335.
Benoit, Emile, 1973. Defense and Economic Growth in Developing Countries.Lexington, Lexington Books.
Bernanke, Ben S., and Refet S. Gurkaynak, 2001. Is growth exogenous? Taking
15As with other inefficient policies, inefficiency alone does not imply that the abolition of mili-
tary draft is politically viable. For a discussion of the political economy of military conscription,
see Poutvaara and Wagener (2007).
21

Mankiw, Romer, and Weil seriously. NBER Macroeconomics Annual 16, 11 – 57.
Choi, Seung-Whan, and Patrick James, 2003. No professional soldiers, no mil-itarized interstate disputes? A new question for Neo-Kantianism. Journal ofConflict Resolution 47, 796 – 816.
Cipollone, Piero, and Alfonso Rosolia, 2007. Social interactions in high school:Lessons from an earthquake. American Economic Review 97, 948 – 965.
Crespo-Cuaresma, Jesus, and Gerhard Reitschuler, 2003. A non-linear defence-growth nexus? Evidence from the US economy. Defence and Peace Economics 15,71 – 82.
Deger, Saadet, and Somnath Sen, 1995. Military expenditures and developingcountries. In: Keith Hartley and Todd Sandler (eds.), Handbook of Defense Eco-nomics, Vol. 1. Elsevier, Amsterdam, pp. 275 – 307.
Dunne, J. Paul, Ron P. Smith, and Dirk Willenbockel, 2005. Models of militaryexpenditure and growth: A critical review. Defence and Peace Economics 16,449 – 461.
EBCO, 2001. European Union without compulsary military service: Conse-quences for alternative service - A comparative study on the policies in EU-member states, EU-Study Paper No.1, European Bureau for Conscientious Ob-jection and Heinrich Boll Foundation: Brussels. Online at http://www.ebco
-beoc.org/Documents/boell study2001.PDF
FINLEX, 2006. Asevelvollisuuslaki(Finnish law on conscription), 1950 and 1998.Online at http://www.finlex.fi/fi/laki/alkup/1950/19500452 andhttp://www.finlex.fi/fi/laki/alkup/1998/19980019 (in Finnish).
Fisher, Anthony C., 1969. The cost of the draft and the cost of ending the draft.American Economic Review 59, 239 – 254.
Gilroy, Curtis L., and Cindy Williams (eds.), 2006, Service to Country: PersonnelPolicy and the Transformation of Western Militaries. MIT Press, Cambridge etc.
Haltiner, Karl W., 2003. The decline of the European mass armies. In: GuiseppeCaforio (ed.), Handbook of the Sociology of the Military. Kluwer Academic/PlenumPublishers, New York etc., pp. 361 – 384.
Hansen, W. Lee, and Burton A. Weisbrod, 1967. Economics of the military draft.Quarterly Journal of Economics 81, 395 – 421.
22

Heo, Uk, 1998. Modeling the defense-growth relationship around the globe. Jour-nal of Conflict Resolution 47, 637 – 657.
Heston, Alan, Robert Summers, and Bettina Aten, 2000. Penn World Table Ver-sion 6.1.Center for International Comparisons at the University of Pennsylvania(CICUP).
Holmlund, Bertil and Qian Liu, 2006. Mind the gap? Estimating the effects ofpostponing higher education. CESifo Working Paper 1792.
Hooker, Mark A., and Michael M. Knetter, 1997. The effect of military spendingon economic activity: Evidence from state procurement spending. Journal ofMoney, Credit, and Banking 29, 400 – 421.
Imbens, Guido, and Wilbert van der Klaauw, 1995. Evaluating the cost of con-scription in The Netherlands. Journal of Business and Economic Statistics 13,207 – 215.
IISS, 1985. The Military Balance: 1985-1986. International Institute for Strate-gic Studies, London.
Irish Defence Forces, 2006. History. Online at http://www.military.ie/intro-duction/history.htm.
Islam, Nazrul, 1995. Growth empirics: A panel data approach. Quarterly Jour-nal of Economics 110, 1127 – 1170.
Kerstens, Kristiaans, and Eric Meyermans, 1993. The draft versus an all-volunteerforce: Issues of efficiency and equity in the Belgian draft. Defence Economics 4,271 – 284.
Kiker, B.F., 1969. Von Thunen on human capital. Oxford Economic Papers 21,339 – 343.
Knight, Malcolm, Norman Loayza, and Delano Villanueva, 1996. The peace div-idend: Military spending cuts and economic growth. IMF Staff Papers 43, 1 – 37.
Lau, Morten I., Panu Poutvaara, and Andreas Wagener, 2004. Dynamic costs ofthe draft. German Economic Review 5, 381 – 406.
Lee, Dwight R., and Richard B. McKenzie, 1992. Reexamination of the relativeefficiency of the draft and the all-volunteer army. Southern Economic Journal
23

59, 646 – 654.
Lutz, Dieter S., 1996. Ist eine Freiwilligen-Streitkraft billiger? (Are all-volunteerforces cheaper?) in: Gross, Jurgen and Dieter S. Lutz (eds.), Hamburger Beitragezur Friedensforschung und Sicherheitspolitik. Hamburg. 39 – 54.
Mankiw, N. Gregory, David Romer, and David N. Weil, 1992. A contribution tothe empirics of economic growth. Quarterly Journal of Economics 107, 407–437.
Mulligan, Casey and Andrei Shleifer, 2005. Conscription as regulation. AmericanLaw and Economics Review 7, 85 – 111.
Nonneman, Walter, and Patrick Vanhoudt, 1996. A further augmentation of theSolow model and the empirics of economic growth for OECD countries. Quar-terly Journal of Economics 111, 943 – 953.
OMHROI.gr, 2005. Conscription in Europe. Online at http://www.omhroi.gr/.
Poutvaara, Panu, and Andreas Wagener, 2007. Conscription: Economic costsand political allure. Economics of Peace and Security Journal 2, 6 – 15.
Ram, Rati, 1995. Defense expenditure and economic growth. In: Keith Hartleyand Todd Sandler (eds.). Handbook of Defense Economics, Vol. 1, Elsevier, Am-sterdam, pp. 251 – 273.
Ross, Thomas W., 1994. Raising an army: A positive theory of military recruit-ment. Journal of Law and Economics 37, 109 – 131.
Sandler, Todd, and Keith Hartley, 1995. The Economics of Defense, CambridgeUniversity Press, Cambridge.
Smith, Adam, 1976 [1776]. An Inquiry into the Nature and Causes of the Wealthof Nations. Clarendon Press, Oxford.
Spencer, Daniel L., and Alexander Woroniak, 1969. Valuing transfer of military-acquired skills to civilian employment. Kyklos 22, 467 – 492.
Stroup, Michael D., and Jack C. Heckelman, 2001. Size of the military sector andeconomic growth: A panel data analysis of Africa and Latin America. Journalof Applied Economics 4, 329 – 360.
Thunen, Johann Heinrich von, 1875. Der isolierte Staat in Beziehung auf Land-wirtschaft und Nationalokonomie. 3rd edition, Wiegandt, Hempel & Parey,
24

Berlin.
United Nations, 2003. World population prospects: The 2002 revision, popula-tion division, Department of Economic and Social Affairs.
WRI, 2005. Refusing to bear arms: A world survey of conscription and conscien-tious objection to military service, War Resisters’ International, London. Onlineat http://www.wri-irg.org/co/rtba/index.html.
WRI, 1998. Italy (1998 report), War Resisters’ International, London. Online athttp://www.wri-irg.org/co/rtba/archive/italy.htm
Warner, John T., and Beth J. Asch, 1995. The economics of military manpower.In: Keith Hartley and Todd Sandler (eds.), Handbook of Defense Economics, Vol.1, Elsevier, Amsterdam, pp. 348 – 398.
Warner, John T., and Beth J. Asch, 1996. The economic theory of a draft recon-sidered. Defense and Peace Economics 7, 297 – 315.
Warner, John T., and Beth J. Asch, 2000. The record and prospects of the all-volunteer military in the United States. Journal of Economic Perspectives 15,169 – 192.
Warner, John T., and Sebastian Negrusa, 2005. Evasion costs and the theory ofconscription. Defense and Peace Economics 16, 83 – 100.
World Bank, 2003. WDI Online, World Development Indicators, World Bank:Washington D.C.
World Bank, 2004. World Development Indicators 2004 CD-ROM, World Bank:Washington D.C.
25

Appendix: Data Sources
Unless stated otherwise below, data is taken from World Bank (2003).
Variables Source
Real GDP Heston et al. (2000)
Working age population(high school age, 15-19) United Nations (2003)
Military Expendituresas a share of GDP World Bank (2004)
Share of military staffin total labor force World Bank (2004)
Other military variables IISS (1985); and various issues.
Alternative service time OMHROI.gr (2005); Italy: WRI (1998); Belgium,the Netherlands, Spain, France: EBCO (2001).
26

Table 1: Descriptive Statistics (Means)a
With WithoutAll Countries Conscriptionb Conscriptionb
Military Variables:
Length of Military Service: 1965 1.426 ys1975 1.226 ys1985 1.083 ys1995 0.915 ys
Length of Alternative Servicec 1.160 ys
Conscripts/Labor Force: 1965 0.0141975 0.0151985 0.0121995 0.009
Military Staff/LaborForced 0.017 0.020 0.009
Military Expenditures/GDPd 0.026 0.026 0.026
Economic Variables, full period:
GDP/working-age person 1960 12961 11838 15208
2000 34049 32151 37844
Growthe 1960-2000 1.016 1.040 0.967
Investment/GDP 1960-2000 0.236 0.244 0.219
Population Growth + 0.05 1960-2000 0.059 0.057 0.062
Education 1960-2000 0.107 0.102 0.115
Inflation 1960-2000 0.079 0.089 0.058
(continued overleaf)
27
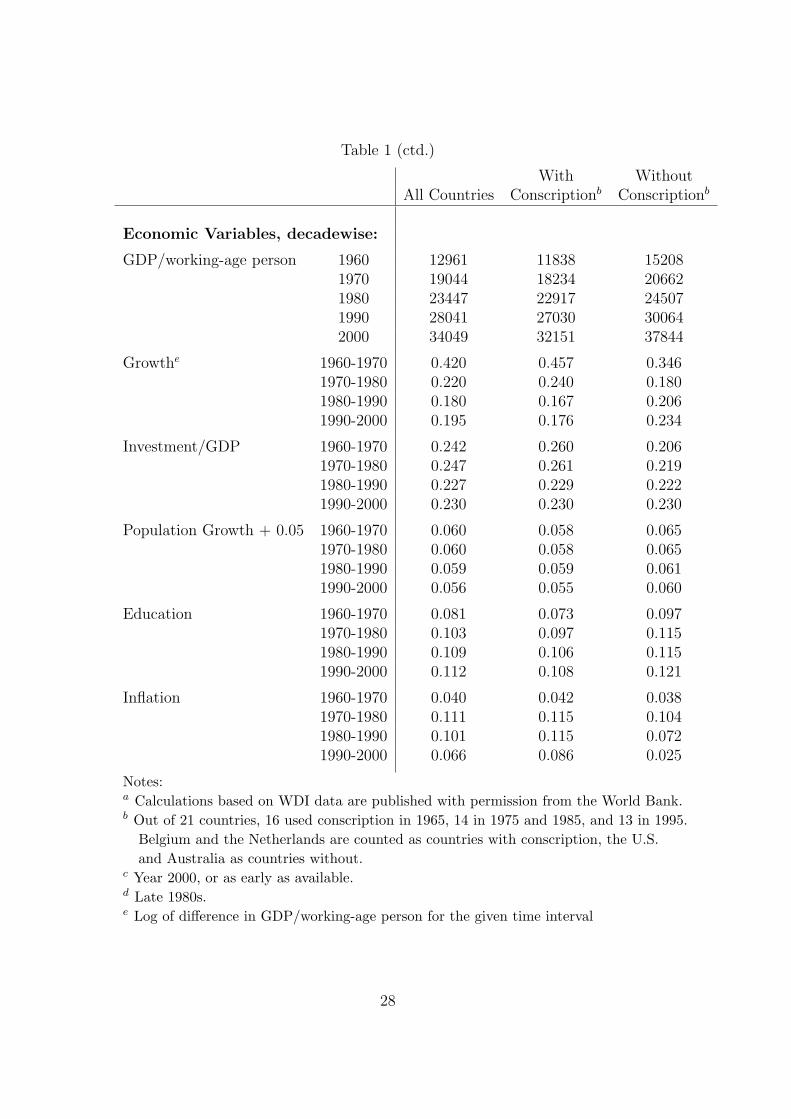
Table 1 (ctd.)
With WithoutAll Countries Conscriptionb Conscriptionb
Economic Variables, decadewise:
GDP/working-age person 1960 12961 11838 152081970 19044 18234 206621980 23447 22917 245071990 28041 27030 300642000 34049 32151 37844
Growthe 1960-1970 0.420 0.457 0.3461970-1980 0.220 0.240 0.1801980-1990 0.180 0.167 0.2061990-2000 0.195 0.176 0.234
Investment/GDP 1960-1970 0.242 0.260 0.2061970-1980 0.247 0.261 0.2191980-1990 0.227 0.229 0.2221990-2000 0.230 0.230 0.230
Population Growth + 0.05 1960-1970 0.060 0.058 0.0651970-1980 0.060 0.058 0.0651980-1990 0.059 0.059 0.0611990-2000 0.056 0.055 0.060
Education 1960-1970 0.081 0.073 0.0971970-1980 0.103 0.097 0.1151980-1990 0.109 0.106 0.1151990-2000 0.112 0.108 0.121
Inflation 1960-1970 0.040 0.042 0.0381970-1980 0.111 0.115 0.1041980-1990 0.101 0.115 0.0721990-2000 0.066 0.086 0.025
Notes:a Calculations based on WDI data are published with permission from the World Bank.b Out of 21 countries, 16 used conscription in 1965, 14 in 1975 and 1985, and 13 in 1995.
Belgium and the Netherlands are counted as countries with conscription, the U.S.and Australia as countries without.
c Year 2000, or as early as available.d Late 1980s.e Log of difference in GDP/working-age person for the given time interval
28
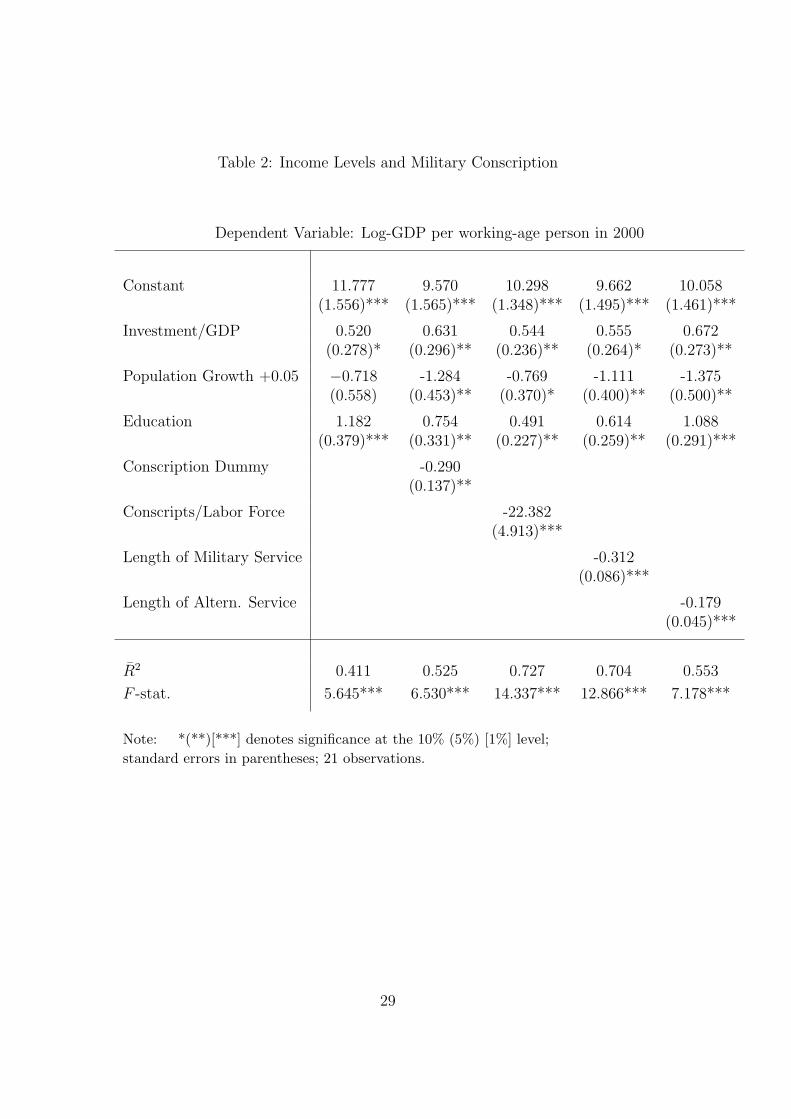
Table 2: Income Levels and Military Conscription
Dependent Variable: Log-GDP per working-age person in 2000
Constant 11.777 9.570 10.298 9.662 10.058(1.556)*** (1.565)*** (1.348)*** (1.495)*** (1.461)***
Investment/GDP 0.520 0.631 0.544 0.555 0.672(0.278)* (0.296)** (0.236)** (0.264)* (0.273)**
Population Growth +0.05 −0.718 -1.284 -0.769 -1.111 -1.375(0.558) (0.453)** (0.370)* (0.400)** (0.500)**
Education 1.182 0.754 0.491 0.614 1.088(0.379)*** (0.331)** (0.227)** (0.259)** (0.291)***
Conscription Dummy -0.290(0.137)**
Conscripts/Labor Force -22.382(4.913)***
Length of Military Service -0.312(0.086)***
Length of Altern. Service -0.179(0.045)***
R2 0.411 0.525 0.727 0.704 0.553
F -stat. 5.645*** 6.530*** 14.337*** 12.866*** 7.178***
Note: *(**)[***] denotes significance at the 10% (5%) [1%] level;standard errors in parentheses; 21 observations.
29

Table 3: Income Levels, Military Variables, Inflation, and Conscription
Dependent Variable: Log-GDP per working-age person in 2000
Constant 9.544 9.055 10.305 9.819 9.706(1.533)*** (1.514)*** (1.233)*** (1.318)*** (1.256)***
Investment/GDP -0.130 -0.019 0.203 0.168 0.175(0.237) (0.270) (0.252) (0.242) (0.212)
Population Growth +0.05 −0.156 -0.404 -0.325 -0.488 -0.613(0.298) (0.333) (0.293) (0.345) (0.376)
Education 0.445 0.362 0.384 0.431 0.595(0.249)* (0.252) (0.235) (0.221)* (0.249)**
Inflation -0.521 -0.476 -0.332 -0.357 -0.426(0.077)*** (0.086)*** (0.104)*** (0.092)*** (0.076)***
Mil. Expenditure/GDP 0.055 0.065 0.126 0.120 0.142(0.073) (0.073) (0.069)* (0.072) (0.072)*
Conscription Dummy -0.108(0.079)
Conscripts/Labor Force -12.958(5.168)**
Length of Military Service -0.170(0.074)**
Length of Altern. Service -0.115(0.042)**
R2 0.831 0.838 0.869 0.866 0.865
F -stat. 20.657*** 18.275*** 23.154*** 22.536*** 22.304***
Note: *(**)[***] denotes significance at the 10% (5%) [1%] level;standard errors in parentheses; 21 observations.
30

Table 4: Growth and Conscription
Dependent Variable: Log-difference in GDP per working-age person; 1960-2000
Constant 6.471 5.573 7.372 6.827 6.283(1.674)*** (1.690)*** (1.147)*** (1.279)*** (1.419)***
Initial GDP 1960 -0.592 -0.634 -0.731 -0.717 -0.649(0.100)*** (0.076)*** (0.076)*** (0.073)*** (0.097)***
Investment/GDP 0.370 0.458 0.436 0.437 0.473(0.230) (0.175)** (0.167)** (0.175)** (0.197)**
Population Growth +0.05 -0.843 -1.199 -0.832 -1.039 -1.177(0.340)** (0.396)*** (0.280)*** (0.347)*** (0.365)***
Education 0.776 0.538 0.492 0.560 0.782(0.265)*** (0.229)** (0.203)* (0.197)** (0.230)***
Conscription Dummy -0.189(0.072)**
Conscripts/Labor Force -13.699(2.242)**
Length of Military Service -0.187(0.043)***
Length of Altern. Service -0.096(0.029)***
R2 0.740 0.789 0.821 0.814 0.771F -stat. 15.227*** 15.976*** 19.291*** 18.483*** 14.484***
Implied λ 0.0224 0.0251 0.0328 0.0316 0.0262
Note: *(**)[***] denotes significance at the 10% (5%) [1%] level;standard errors in parentheses; 21 observations.
31

Table 5: Growth, Military Expenditure, Inflation, and Conscription
Dependent Variable: Log-difference in GDP per working-age person; 1960-2000
Constant 8.042 7.400 9.366 8.860 8.886(1.742)*** (1.890)*** (1.364)*** (1.572)*** (1.775)***
Initial GDP 1960 -0.859 -0.849 -0.919 -0.913 -0.925(0.119)*** (0.133)*** (0.111)*** (0.117)*** (0.115)***
Investment/GDP -0.049 0.077 0.217 0.188 0.185(0.251) (0.272) (0.261) (0.237) (0.216)
Population Growth +0.05 -0.348 -0.629 -0.419 -0.573 -0.664(0.317) (0.404) (0.306) (0.363) (0.385)
Education 0.461 0.374 0.400 0.443 0.587(0.260)* (0.247) (0.250) (0.238)* (0.263)**
Inflation -0.398 -0.340 -0.279 -0.298 -0.371(0.151)** (0.169)* (0.159) (0.145)* (0.131)**
Mil. Expenditure/GDP 0.019 0.028 0.098 0.091 0.114(0.086) (0.084) (0.082) (0.087) (0.095)
Conscription Dummy -0.115(0.077)
Conscripts/Labor Force -11.683(4.419)**
Length of Military Service -0.153(0.071)**
Length of Altern. Service -0.102(0.043)**
R2 0.832 0.844 0.861 0.859 0.855F -stat. 17.528*** 16.454*** 18.705*** 18.336*** 17.848***
Implied λ 0.0490 0.0473 0.0628 0.0610 0.0648
Note: *(**)[***] denotes significance at the 10% (5%) [1%] level;standard errors in parentheses; 21 observations.
32
Table 6: Income Levels and Military Conscription (Panel)
Dependent Variable: Log-GDP per working-age person by decade
Constant 10.198 9.940 10.144 7.785(1.144)*** (1.177)*** (1.165)*** (1.088)***
Investment/GDP 0.358 0.412 0.411 0.375(0.181)* (0.192)** (0.192)** (0.181)**
Population Growth +0.05 −0.823 -0.916 -0.760 -1.319(0.349)** (0.347)** (0.344)** (0.296)***
Education 0.819 0.744 0.624 0.284(0.144)*** (0.151)*** (0.154)*** (0.220)
Conscription Dummy -0.139(0.082)*
Length of Military Service -0.166(0.058)***
Conscripts/Labor Force -17.816(3.167)***
R2 0.443 0.457 0.501 0.510
F -stat. 23.026*** 18.452*** 21.832*** 19.727***
Note: *(**)[***] denotes significance at the 10% (5%) [1%] level;standard errors in parentheses; 84 observations (4 time periods times 21 countries),except for Conscripts/Labor Force (73 observations).
33

Table 7: Income Levels, Conscription, and Inflation (Panel)
Dependent Variable: Log-difference in GDP per working-age person by decade
Constant 10.608 10.512 10.527 8.387(1.082)*** (1.091)*** (1.075)*** (0.903)***
Investment/GDP 0.263 0.283 0.305 0.190(0.165) (0.166)* (0.171)* (0.136)
Population Growth +0.05 -0.398 -0.442 -0.412 -0.772(0.316) (0.313) (0.307) (0.258)***
Education 0.796 0.773 0.683 0.296(0.136)*** (0.139)*** (0.137)*** (0.163)*
Inflation -0.208 -0.202 -0.183 -0.217(0.031)*** (0.031)*** (0.031)*** (0.032)***
Conscription Dummy -0.044(0.070)
Length of Military Service -0.099(0.051)*
Conscripts/Labor Force -6.982(2.646)**
R2 0.585 0.582 0.601 0.664F -stat. 30.238*** 24.073*** 25.980*** 29.494***
Note: *(**)[***] denotes significance at the 10% (5%) [1%] level;standard errors in parentheses; 84 observations (4 time periods times 21 countries),except for Conscripts/Labor Force (73 observations).
34

Table 8: Growth and Military Conscription (Panel)
Dependent Variable: Log-difference in GDP per working-age person by decade
Constant 2.662 2.566 2.869 2.847(0.757)*** (0.640)*** (0.688)*** (0.754)***
Initial GDP -0.259 -0.267 -0.282 -0.269(0.044)*** (0.038)*** (0.042)*** (0.062)***
Investment/GDP 0.2372 0.273 0.258 0.248(0.056)*** (0.0626)*** (0.060)** (0.070)**
Population Growth +0.05 -0.209 -0.276 -0.207 -0.211(0.104)** (0.100)*** (0.102)*** (0.118)*
Education 0.042 0.001 0.001 0.062(0.077) (0.065) (0.065) (0.090)
Conscription Dummy -0.090(0.031)***
Length of Military Service -0.055(0.0243)**
Conscripts/Labor Force -4.987(2.069)**
R2 0.554 0.605 0.590 0.427F -stat. 26.748*** 26.394*** 24.940*** 11.729***
Implied λ 0.0300 0.0311 0.0331 0.0313
Note: *(**)[***] denotes significance at the 10% (5%) [1%] level;standard errors in parentheses; 84 observations (4 time periods times 21 countries),except for Conscripts/Labor Force (73 observations).
35

Table 9: Growth, Conscription, and Inflation (Panel)
Dependent Variable: Log-difference in GDP per working-age person by decade
Constant 3.426 3.287 3.491 3.581(0.655)*** (0.581)*** (0.610)*** (0.690)***
Initial GDP -0.318 -0.317 -0.327 -0.344(0.040)*** (0.036)*** (0.038)*** (0.059)***
Investment/GDP 0.208 0.234 0.222 0.190(0.050)*** (0.054)*** (0.053)*** (0.057)***
Population Growth +0.05 -0.084 -0.139 -0.092 -0.114(0.089) (0.087) (0.085) (0.107)
Education 0.094 0.062 0.066 0.089(0.071) (0.065) (0.065) (0.080)
Inflation -0.085 -0.077 -0.079 -0.083(0.017)*** (0.016)*** (0.016)*** (0.020)***
Conscription Dummy -0.058(0.026)**
Length of Military Service -0.033(0.018)*
Conscripts/Labor Force -2.141(1.704)
R2 0.691 0.709 0.701 0.560F -stat. 38.038*** 34.629*** 33.456*** 16.265***
Implied λ 0.0383 0.0381 0.0396 0.0422
Note: *(**)[***] denotes significance at the 10% (5%) [1%] level;standard errors in parentheses; 84 observations (4 time periods times 21 countries),except for Conscripts/Labor Force (73 observations).
36
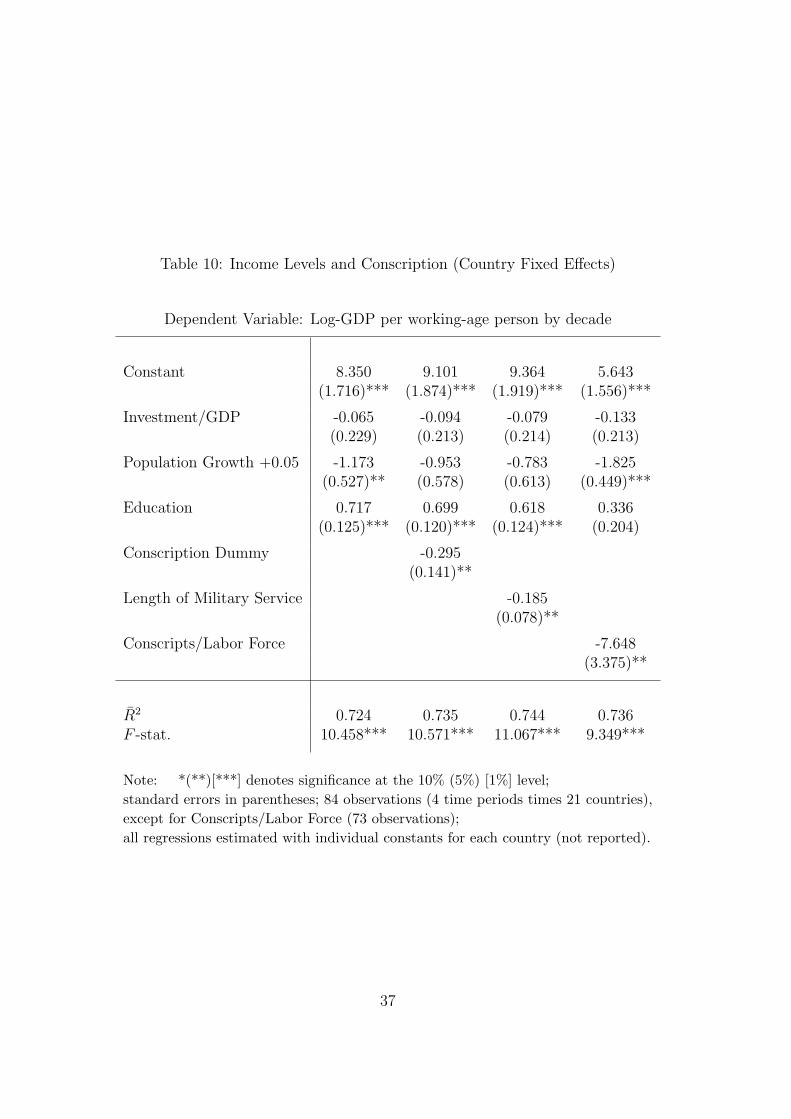
Table 10: Income Levels and Conscription (Country Fixed Effects)
Dependent Variable: Log-GDP per working-age person by decade
Constant 8.350 9.101 9.364 5.643(1.716)*** (1.874)*** (1.919)*** (1.556)***
Investment/GDP -0.065 -0.094 -0.079 -0.133(0.229) (0.213) (0.214) (0.213)
Population Growth +0.05 -1.173 -0.953 -0.783 -1.825(0.527)** (0.578) (0.613) (0.449)***
Education 0.717 0.699 0.618 0.336(0.125)*** (0.120)*** (0.124)*** (0.204)
Conscription Dummy -0.295(0.141)**
Length of Military Service -0.185(0.078)**
Conscripts/Labor Force -7.648(3.375)**
R2 0.724 0.735 0.744 0.736F -stat. 10.458*** 10.571*** 11.067*** 9.349***
Note: *(**)[***] denotes significance at the 10% (5%) [1%] level;standard errors in parentheses; 84 observations (4 time periods times 21 countries),except for Conscripts/Labor Force (73 observations);all regressions estimated with individual constants for each country (not reported).
37
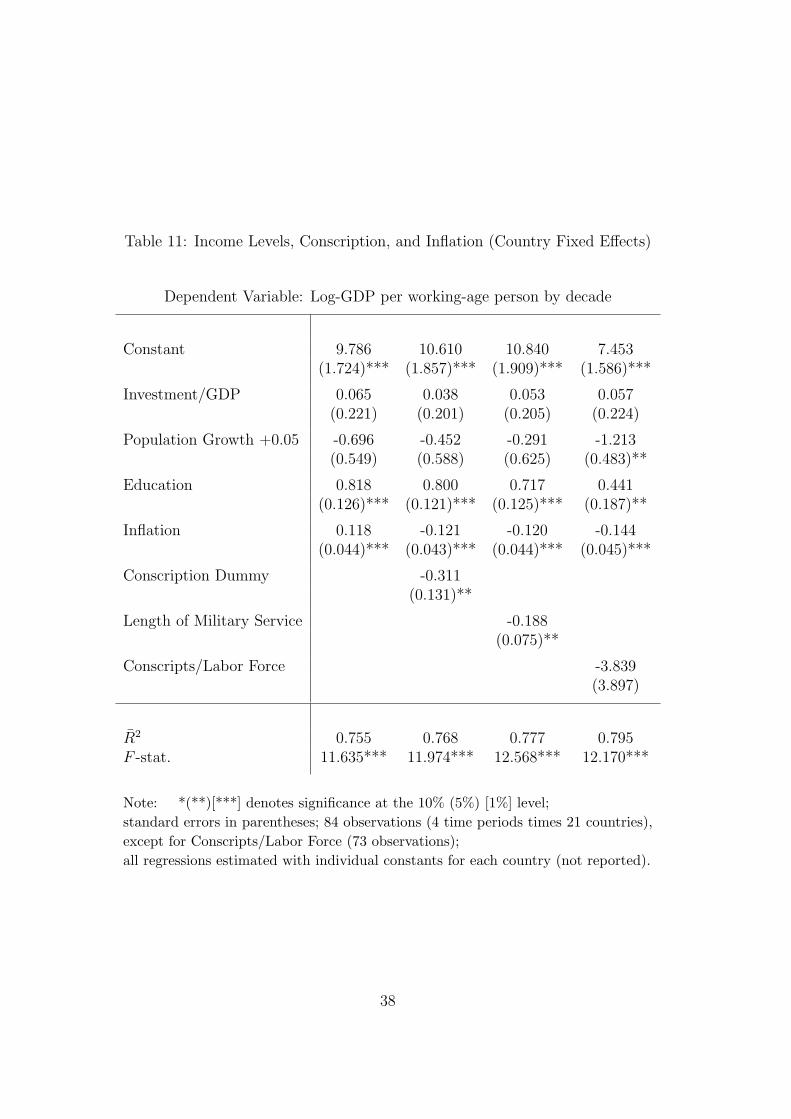
Table 11: Income Levels, Conscription, and Inflation (Country Fixed Effects)
Dependent Variable: Log-GDP per working-age person by decade
Constant 9.786 10.610 10.840 7.453(1.724)*** (1.857)*** (1.909)*** (1.586)***
Investment/GDP 0.065 0.038 0.053 0.057(0.221) (0.201) (0.205) (0.224)
Population Growth +0.05 -0.696 -0.452 -0.291 -1.213(0.549) (0.588) (0.625) (0.483)**
Education 0.818 0.800 0.717 0.441(0.126)*** (0.121)*** (0.125)*** (0.187)**
Inflation 0.118 -0.121 -0.120 -0.144(0.044)*** (0.043)*** (0.044)*** (0.045)***
Conscription Dummy -0.311(0.131)**
Length of Military Service -0.188(0.075)**
Conscripts/Labor Force -3.839(3.897)
R2 0.755 0.768 0.777 0.795F -stat. 11.635*** 11.974*** 12.568*** 12.170***
Note: *(**)[***] denotes significance at the 10% (5%) [1%] level;standard errors in parentheses; 84 observations (4 time periods times 21 countries),except for Conscripts/Labor Force (73 observations);all regressions estimated with individual constants for each country (not reported).
38

Table 12: Growth and Conscription (Country Fixed Effects)
Dependent Variable: Log-difference in GDP per working-age person by decade
Constant 3.278 3.653 3.750 3.705(0.935)*** (0.970)*** (0.959)*** (1.076)***
Initial GDP -0.300 -0.312 -0.318 -0.274(0.068)*** (0.067)*** (0.069)*** (0.100)***
Investment/GDP 0.216 0.200 0.204 0.179(0.113)* (0.114)* (0.113)* (0.118)
Population Growth +0.05 -0.054 0.013 0.049 0.145(0.251) (0.252) (0.244) (0.348)
Education -0.042 -0.037 -0.057 0.032(0.084) (0.078) (0.071) (0.100)
Conscription Dummy -0.115(0.058)*
Length of Military Service -0.062(0.031)**
Conscripts/Labor Force -1.303(2.153)
R2 0.651 0.660 0.663 0.532F -stat. 7.444*** 7.431*** 7.518*** 4.274***Implied λ 0.0357 0.0374 0.0383 0.0320
Note: *(**)[***] denotes significance at the 10% (5%) [1%] level;standard errors in parentheses; 84 observations (4 time periods times 21 countries),except for Conscripts/Labor Force (73 observations);all regressions estimated with individual constants for each country (not reported).
39

Table 13: Growth, Inflation, and Conscription (Country Fixed Effects)
Dependent Variable: Log-difference in GDP per working-age person by decade
Constant 4.438 4.899 4.992 4.959(0.987)*** (1.017)*** (1.024)*** (1.060)***
Initial GDP -0.325 -0.339 -0.346 -0.334(0.059)*** (0.056)*** (0.057)*** (0.081)***
Investment/GDP 0.295 0.279 0.283 0.268(0.096)*** (0.093)*** (0.093)*** (0.105)**
Population Growth +0.05 0.233 0.318 0.355 0.352(0.218) (0.223) (0.225) (0.272)
Education 0.053 0.061 0.039 0.121(0.089) (0.083) (0.076) (0.095)
Inflation -0.081 -0.083 -0.083 -0.087(0.019)*** (0.019)*** (0.019)*** (0.019)***
Conscription Dummy -0.132(0.038)***
Length of Military Service -0.070(0.026)**
Conscripts/Labor Force 0.473(2.238)
R2 0.751 0.767 0.770 0.686F -stat. 11.033*** 11.508*** 11.665*** 7.037***Implied λ 0.0393 0.0414 0.0425 0.0406
Note: *(**)[***] denotes significance at the 10% (5%) [1%] level;standard errors in parentheses; 84 observations (4 time periods times 21 countries),except for Conscripts/Labor Force (73 observations);all regressions estimated with individual constants for each country (not reported).
40


![Downloaded by [University of Defence] at 20:05 09 May 2016opac.lib.idu.ac.id/.../assets/uploads/files/...indonesian-military.pdf · Kesaktian mytical type of power (Javanese, contemporary)](https://static.fdocuments.in/doc/165x107/5c7acbec09d3f236078c3e3d/downloaded-by-university-of-defence-at-2005-09-may-kesaktian-mytical-type.jpg)