Midwest Connect Hyperloop Feasibility Study · ESTIMATED HYPERLOOP FARES* Metro Pair Line Haul...
32
Midwest Connect Hyperloop Feasibility Study February 2020
Transcript of Midwest Connect Hyperloop Feasibility Study · ESTIMATED HYPERLOOP FARES* Metro Pair Line Haul...
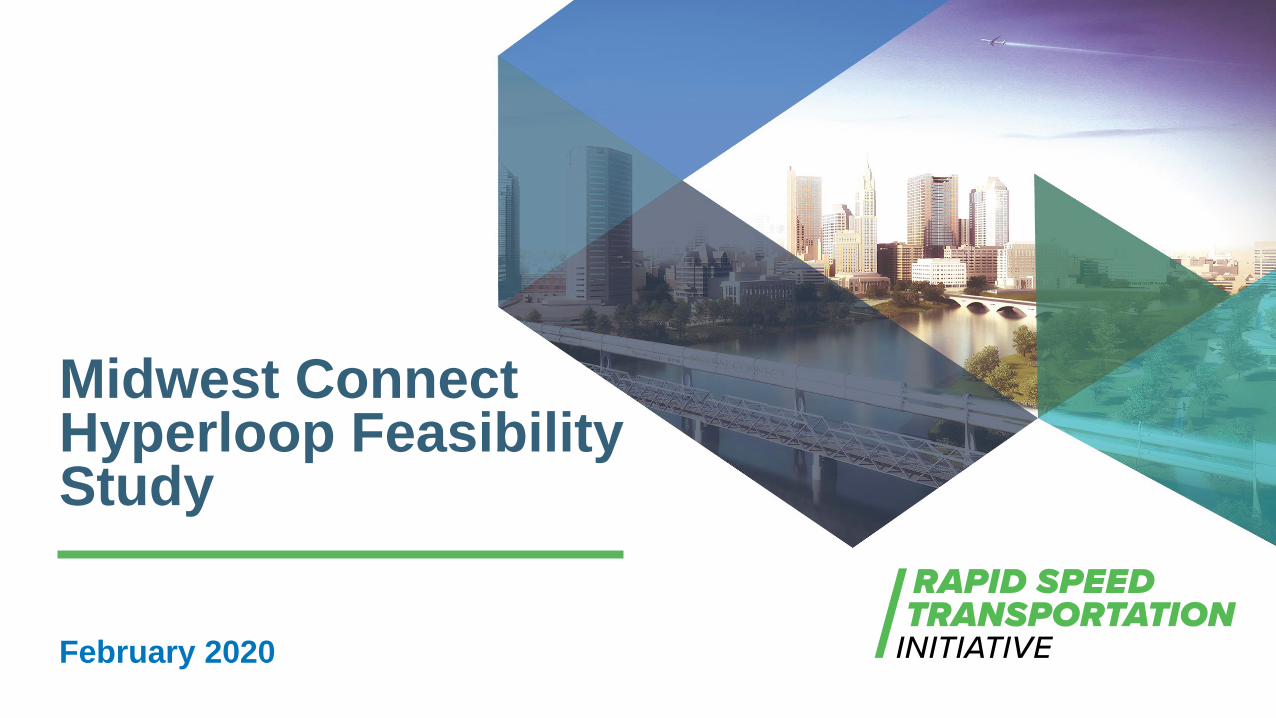
Midwest ConnectHyperloop FeasibilityStudy
February 2020
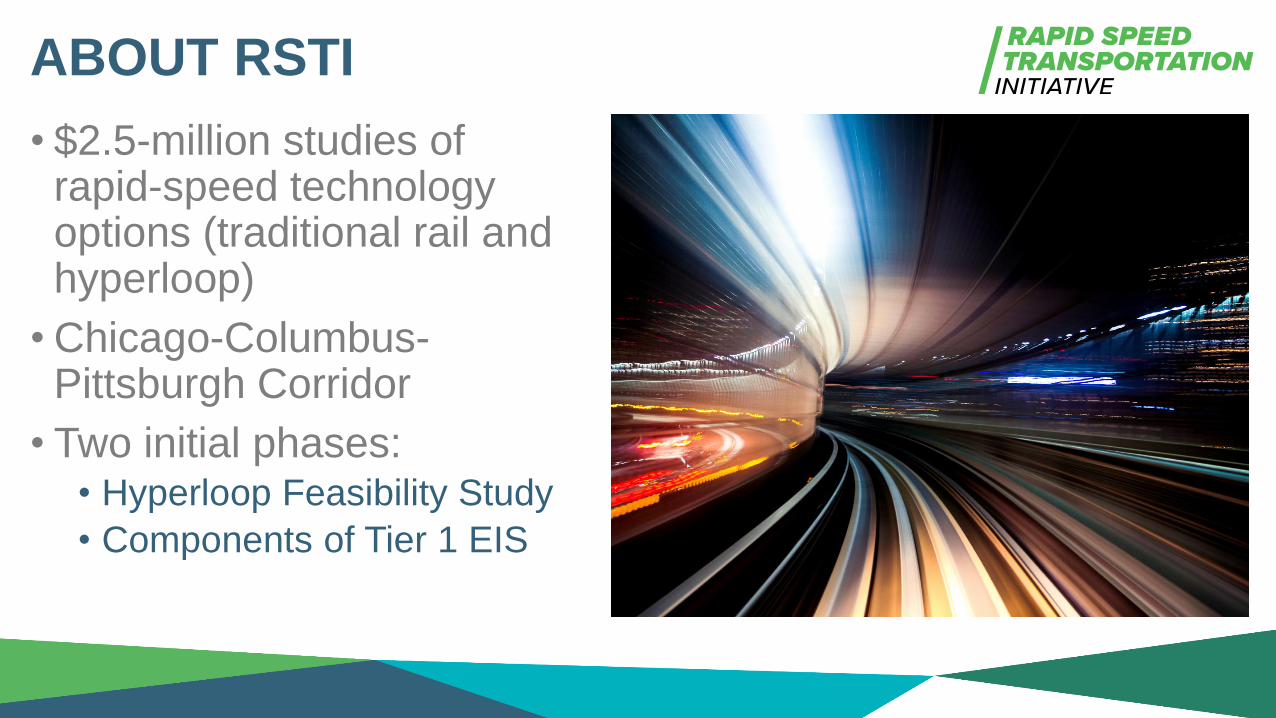
• $2.5-million studies of rapid-speed technology options (traditional rail and hyperloop)
• Chicago-Columbus-Pittsburgh Corridor
• Two initial phases:• Hyperloop Feasibility Study
• Components of Tier 1 EIS
ABOUT RSTI
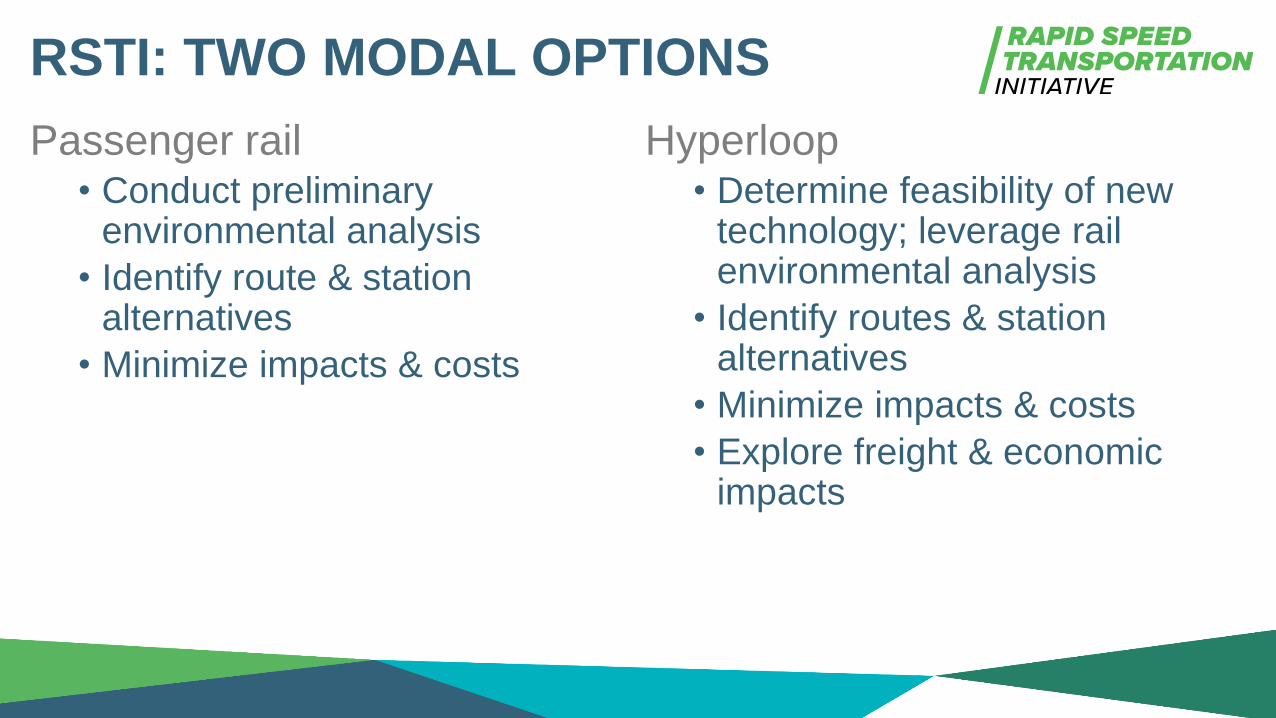
RSTI: TWO MODAL OPTIONS
Passenger rail• Conduct preliminary
environmental analysis
• Identify route & station alternatives
• Minimize impacts & costs
Hyperloop• Determine feasibility of new
technology; leverage rail environmental analysis
• Identify routes & station alternatives
• Minimize impacts & costs
• Explore freight & economic impacts

RAPID SPEED TRANSPORTATION

ROUTE
ALTERNATIVES

ROUTE SCREENING CRITERIA
• For Hyperloop and Rail• Route circuity
• Corridor communities & land use
• Environmental constraints
• Comparative cost
• Engineering complexity
• Right-of-way and railroad
ownership
• Right of way width and availability
• Number of bridge, underpass, or
tunnel structures
• For Rail Only• Track class/speed
• Track ownership
• Train volumes
• Track capacity
• Number of at-grade crossings
• Signaling

ROUTE ALTERNATIVES
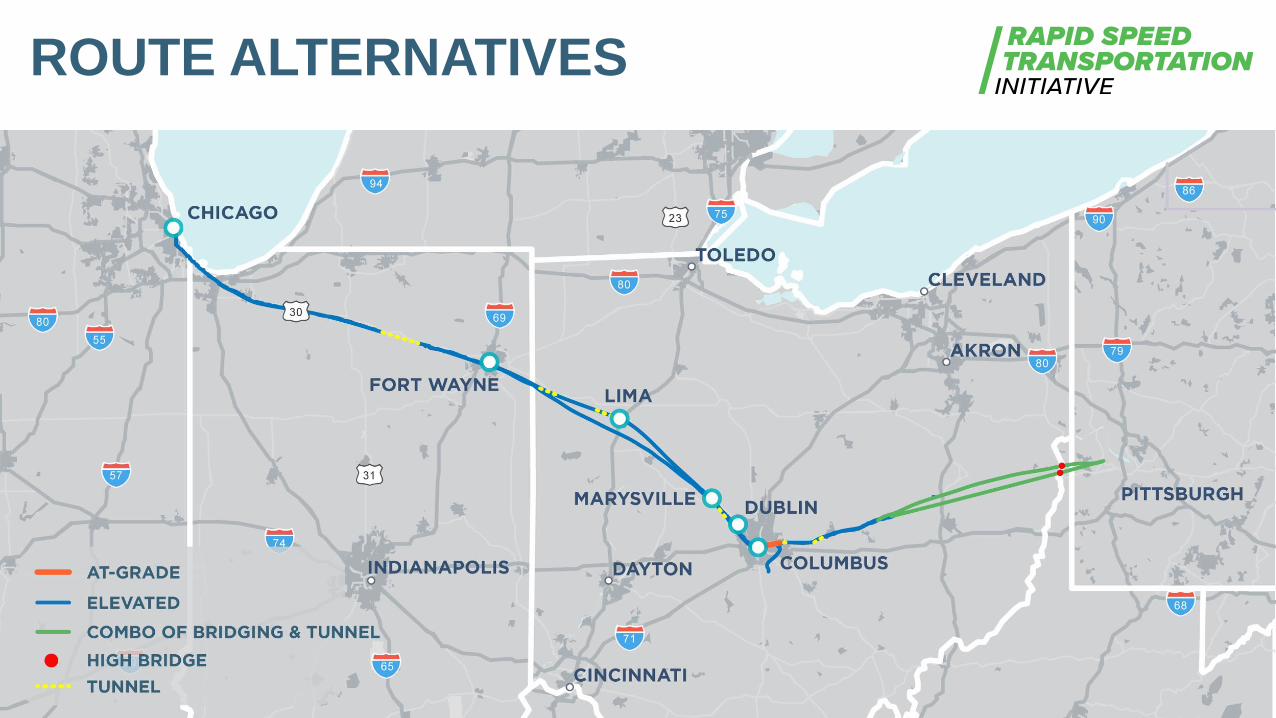
ROUTE ALTERNATIVES

STATION/PORTAL
ALTERNATIVES

STATION/PORTAL CRITERIA
• Market demand
• Local preference
• Former station location and reuse potential
• Tangent (straight) right-of-way/ track
• Adjacent land use
• Distance between portals/ stations
• Population centers and logistics potential
• Access to connecting infrastructure/multimodal potential
• Overall travel time

POTENTIAL STATIONS/PORTALS – COLUMBUS
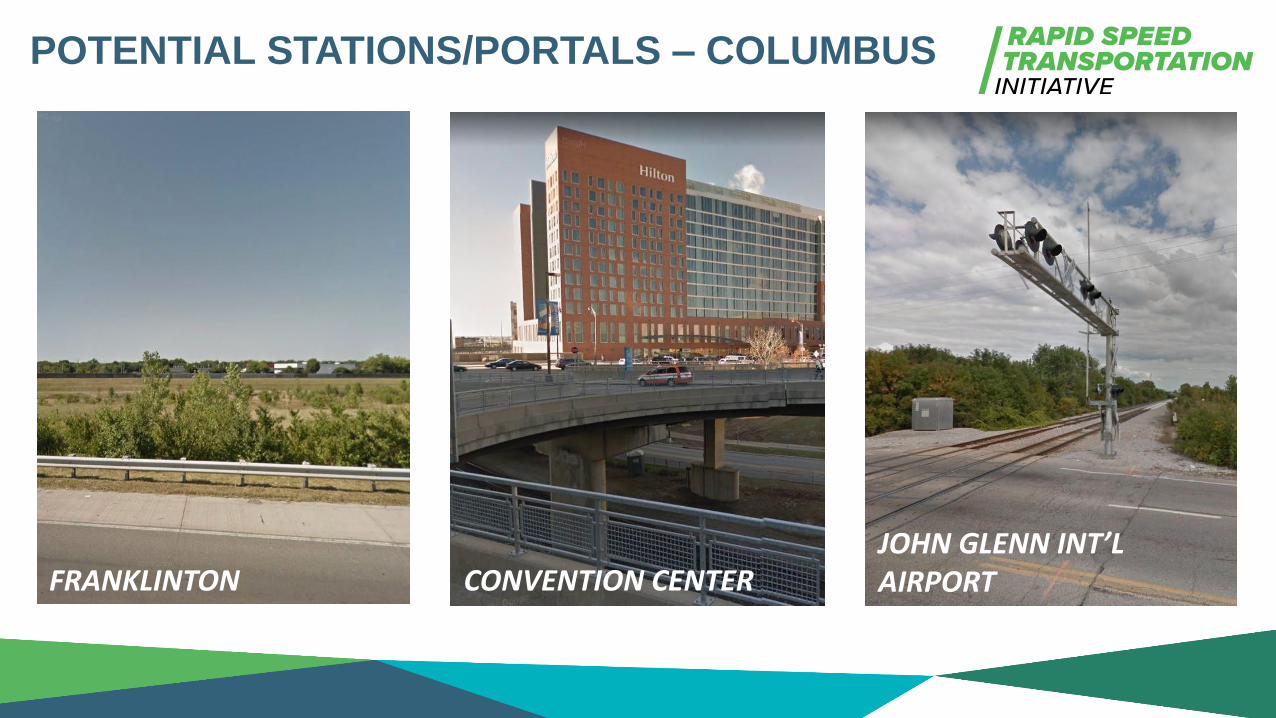
POTENTIAL STATIONS/PORTALS – COLUMBUS
FRANKLINTON CONVENTION CENTERJOHN GLENN INT’L AIRPORT

POTENTIAL STATION – DUBLIN

POTENTIAL STATION – MARYSVILLE WEST
LOOKING SOUTH ALONG N. MAPLE ST Source: Google Maps

POTENTIAL STATION – MARYSVILLE SOUTH
LOOKING NORTH ALONG COLUMBUS AVE Source: Google Maps

KEY HYPERLOOP
STUDY FINDINGS
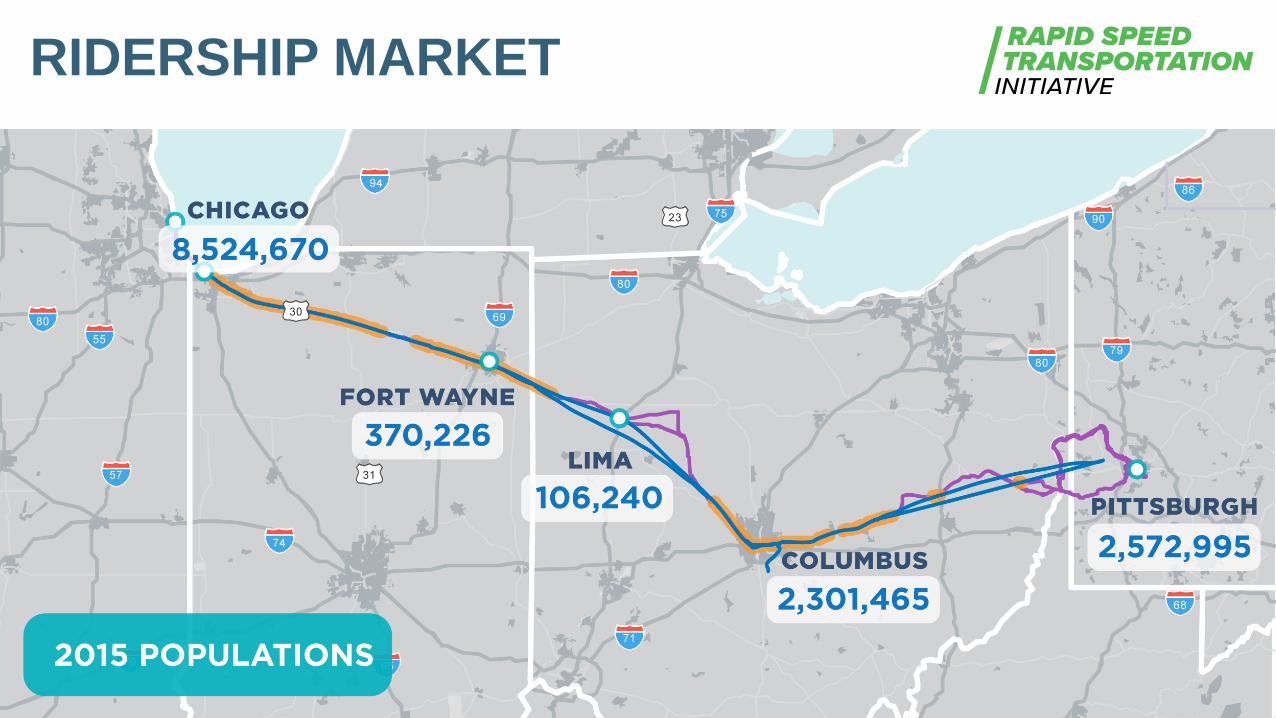
RIDERSHIP MARKET

RIDERSHIP MARKET
Label map with Population 2040

RIDERSHIP MARKET
Label map with Population 2040

RIDERSHIP MARKET

RIDERSHIP MARKET

RIDERSHIP MARKET

TRAVEL TIME AND COST SAVINGS
Auto Air Conventional Rail Hyperloop
Metro Pair
(bi-directional)
Total
Travel
Time
(min.)
Business /
Non-Business
Total Travel
Cost*
Total
Travel
Time
(min.)
Total Fare
(Existing)
Total
Travel
Time
(min.)
Total Fare
(Existing)
Total
Travel
Time
(min.)
Total Fare
(estimated)
Chicago-Fort Wayne 191 $98 / $27 - - - - 22 $33
Chicago-Columbus 336 $198 / $54 249 $171 - - 38 $60
Chicago-Pittsburgh 412 $256 / $69 245 $177 587 $127 55 $93
Columbus-Fort Wayne 205 $96 / $26 - - - - 20 $28
Fort Wayne-Pittsburgh 317 $177 / $48 - - - - 36 $60
Columbus-Pittsburgh 199 $113 / $31 - - - - 20 $33
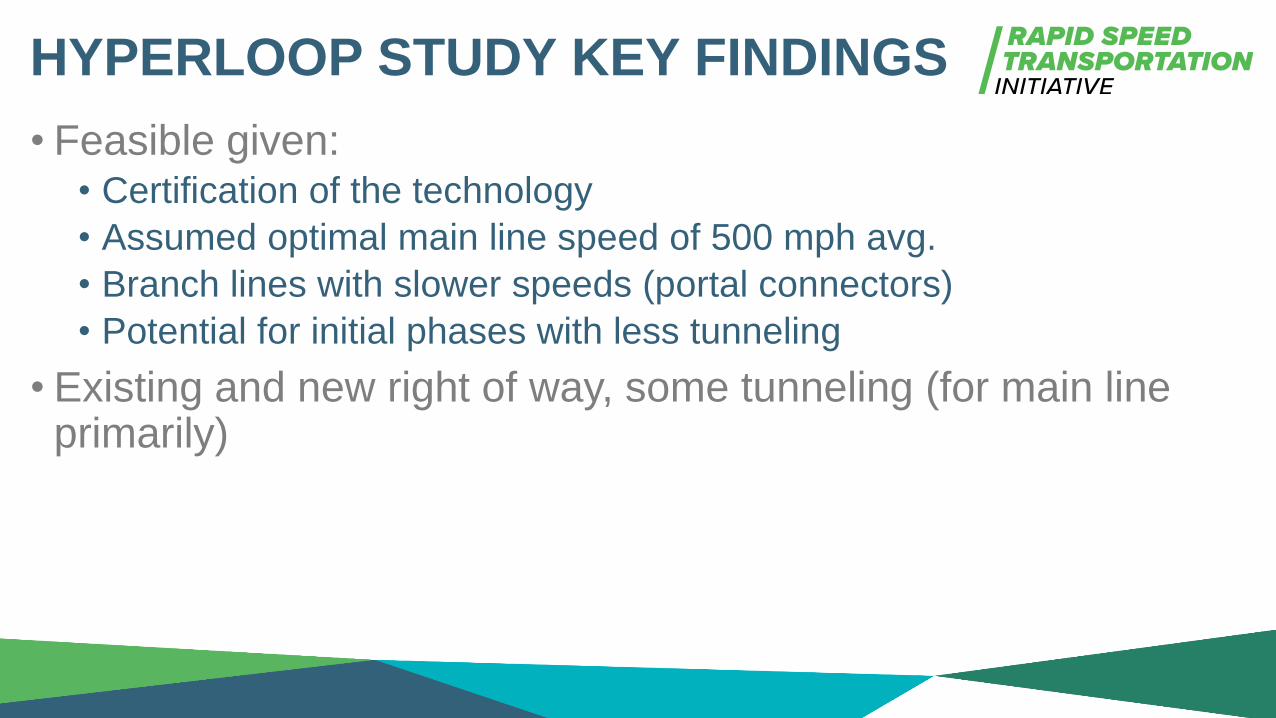
• Feasible given:• Certification of the technology
• Assumed optimal main line speed of 500 mph avg.
• Branch lines with slower speeds (portal connectors)
• Potential for initial phases with less tunneling
• Existing and new right of way, some tunneling (for main line primarily)
HYPERLOOP STUDY KEY FINDINGS

• Once fully operational, over 30 years:• 1.9 billion autos shifted to hyperloop passengers
• 2.4 million tons of reduced CO2 emissions
• $19 billion direct transportation benefit
• Reduction of 450 million commercial truck vehicles hours traveled
HYPERLOOP STUDY KEY FINDINGS

WIDER ECONOMIC BENEFITS
1,400.0
1,900.0
2,400.0
2,900.0
3,400.0
3,900.0
2030 2035 2040 2045 2050 2055 2059
Cu
mu
lative
GR
P (
$B
illio
ns)
Midwest Connect Hyperloop Assessment Corridor GRP - With/Without Hyperloop Enabled Productivity Increases
~$300BMidwest Connect Hyperloop
Assessment Corridor
Build Scenario
Midwest Connect Hyperloop
Assessment Corridor
Baseline Scenario
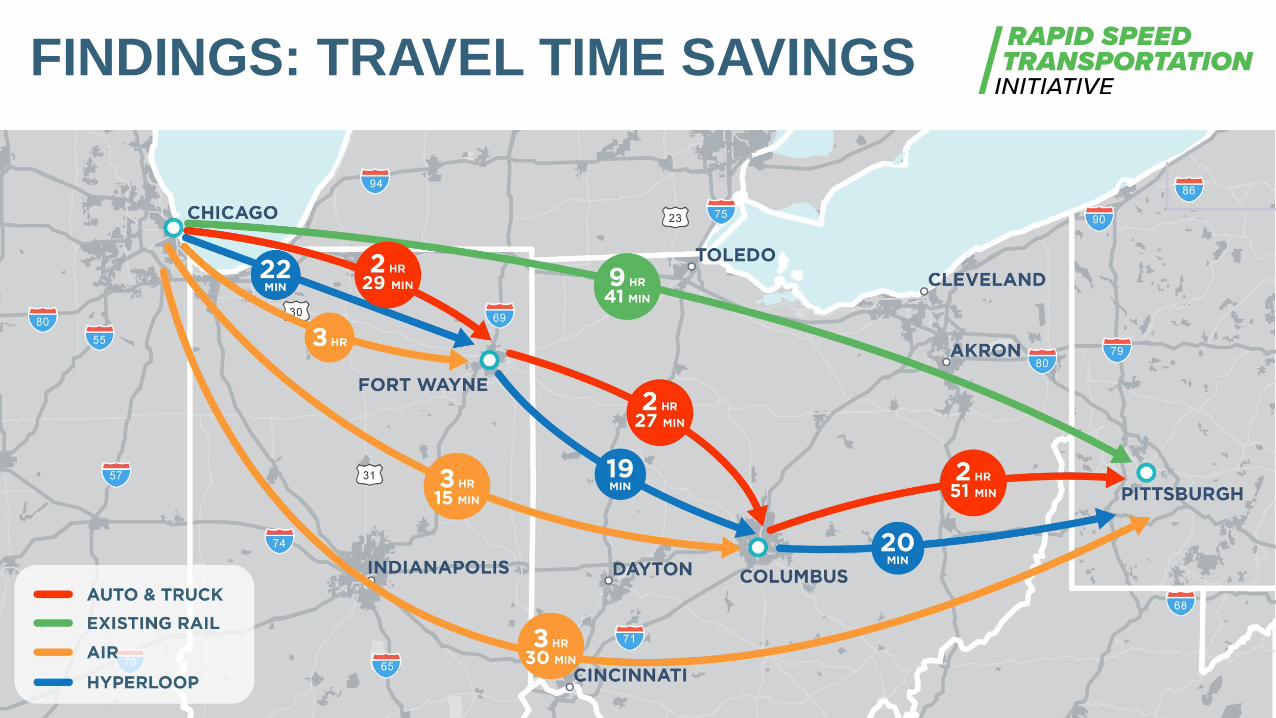
FINDINGS: TRAVEL TIME SAVINGS

ESTIMATED HYPERLOOP FARES*
Metro PairLine Haul Travel
Time (min)Line Haul Distance
(miles)Fare Cost (dollars)
Chicago-Fort Wayne 22 163 $33
Chicago-Columbus 38 302 $60
Chicago-Pittsburgh 58 465 $93
Fort Wayne-Columbus 19 139 $28
Fort Wayne-Pittsburgh 39 302 $60
Columbus-Pittsburgh 22 163 $33
Average Hyperloop Service Characteristics by Metro Pair
* 2019 dollars. Based on an assumed $0.20/mile, as calculated by AECOM with input from Virgin Hyperloop One

EMISSIONS SAVINGS
Environmental Sustainability
Mode Shift Emissions Savings (Auto to Hyperloop) $113.9M
Mode Shift Emissions Savings (Air to Hyperloop) $0.3M
Mode Shift Emissions Savings (Train to Hyperloop) $7.8M
Mode Shift Emissions Savings (Commercial Truck to Hyperloop) $4.6M

• Public meetings
• VHO certification segment – R&D collaboration opportunity
• Create a travel demand advisory panel (public agencies, academic institutions, VHO)
• Monitor NETT Council activities and opportunities to engage in federal regulatory framework
• Advance regulatory framework with appropriate agencies
• Continue to facilitate collaboration
HYPERLOOP NEXT STEPS

• Public meetings
• Secure funding to complete the environmental studies necessary for the federal construction approval process
• Engage and secure the support of communities east of Columbus
• Develop a strategy with other surrounding states to secure regulatory guidance
PASSENGER RAIL NEXT STEPS

DINA LOPEZStrategic Projects Manager
Mid-Ohio Regional Planning Commission
T: 614.233.4149 | M: 614.603.0947
111 Liberty Street, Suite 100
Columbus, OH 43215