Microzooplankton in the food web of the coastal Gulf of Alaska · Microzooplankton in the food web...
18
Microzooplankton in the food web of the coastal Gulf of Alaska Suzanne Strom, Russ Hopcroft Western Washington University University of Alaska Fairbanks NOAA Fisheries
Transcript of Microzooplankton in the food web of the coastal Gulf of Alaska · Microzooplankton in the food web...

Microzooplankton in the food
web of the coastal Gulf of
Alaska
Suzanne Strom, Russ Hopcroft
Western Washington University
University of Alaska Fairbanks
NOAA Fisheries

The setting: dynamic
NOAA Fisheries
HNLC
Cross-shelf exchange
High runoff
NOAA Fisheries
Sampling regions: 2011 & 2013Spring, Summer, Fall (GOA-IERP)
WEST
wide shelfEAST
narrow shelf
Seward Line

NOAA Fisheries
Strong seasonality: phytoplankton
0
50
100
150
200
250
Spring Summer Fall
IntegratedChl-a
(mg/m2)
2013West
East
0
50
100
150
200
250
Spring Summer Fall
IntegratedChl-a
(mg/m2)
2011West
East
Chlo
rophyll
a (
mg m
3)
Waite & Meuter 2013
NOAA Fisheries
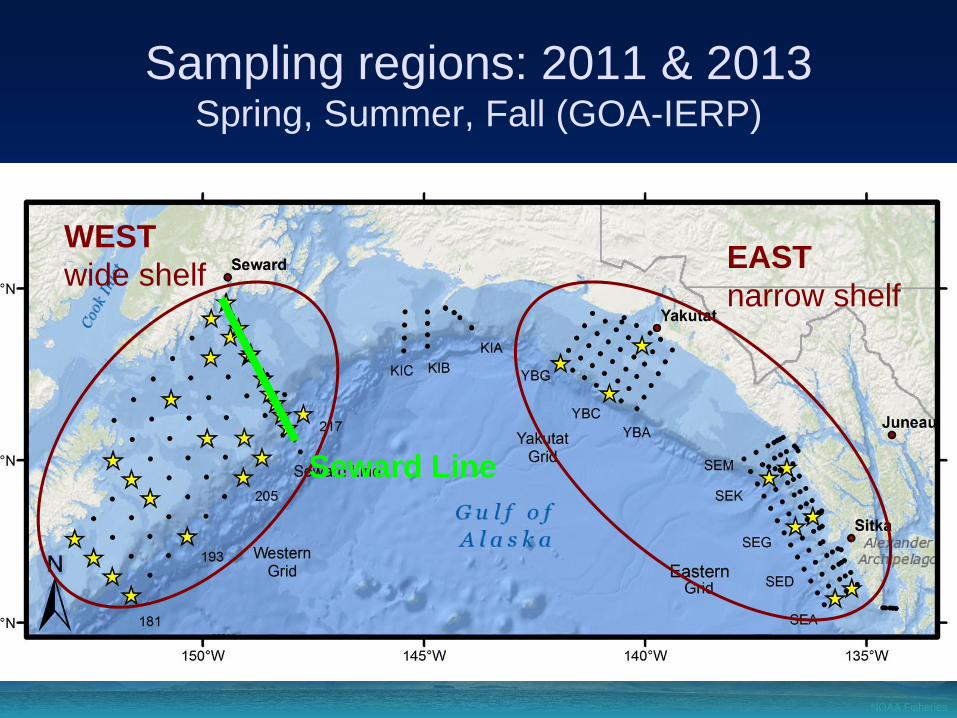
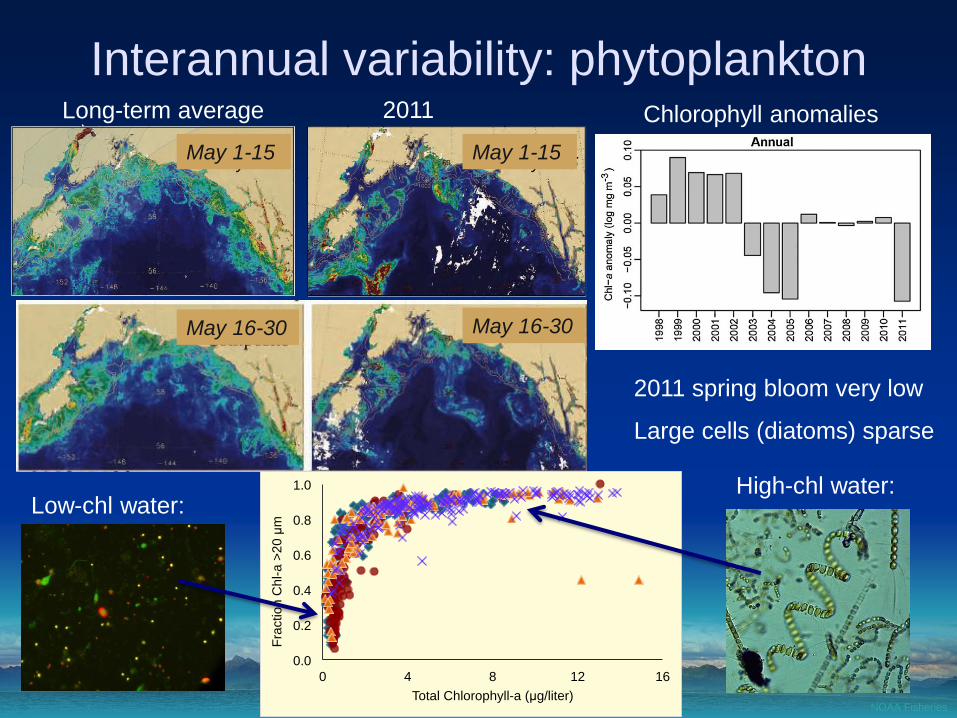
Chlorophyll anomalies
Interannual variability: phytoplankton
May 1-15 May 1-15
May 16-30 May 16-30
Long-term average 2011
0.0
0.2
0.4
0.6
0.8
1.0
0 4 8 12 16
Fra
ctio
n C
hl-
a >
20
µm
Total Chlorophyll-a (µg/liter)
Low-chl water:High-chl water:
2011 spring bloom very low
Large cells (diatoms) sparse
NOAA Fisheries
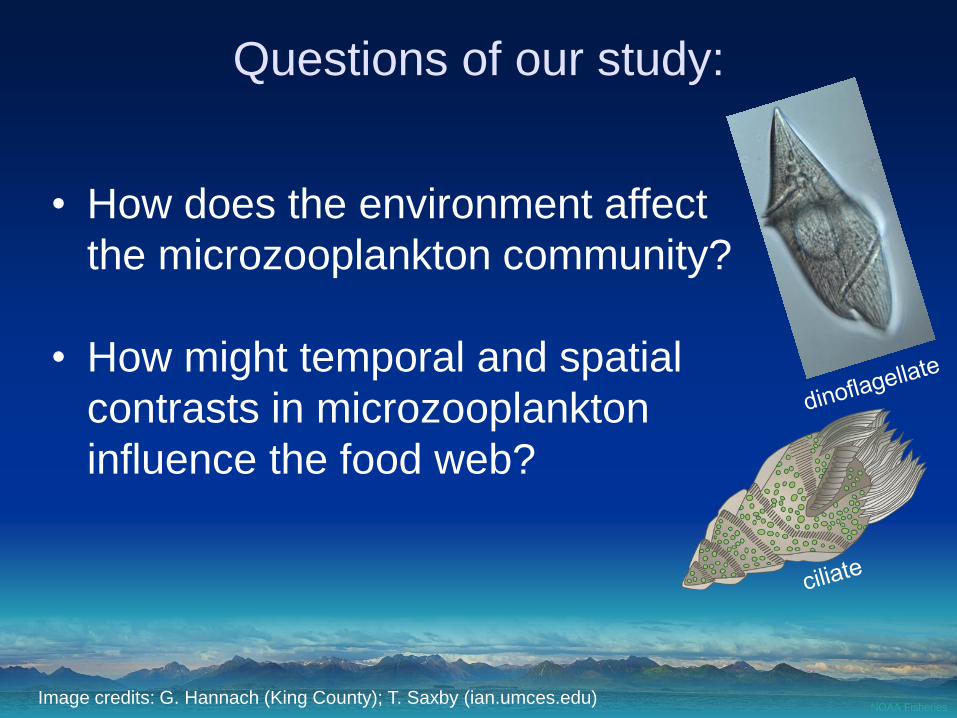
Questions of our study:
• How does the environment affect
the microzooplankton community?
• How might temporal and spatial
contrasts in microzooplankton
influence the food web?
Image credits: G. Hannach (King County); T. Saxby (ian.umces.edu)

NOAA Fisheries
What we know about CGOA microzoo:
1. Cross-shelf gradient in
biomass, composition2. Moderate – high
grazing rates common
Mean c
ell
vol(µ
m3)
Din
oflagella
tes
(% o
f to
tal bio
mass)
Nearshore Offshore
Strom et al. 2007
including microzoo
grazing on diatoms
Gra
zin
g r
ate
(d
-1)
>20 5-20 <5 µm
Chlorophyll size fraction
NOAA Fisheries
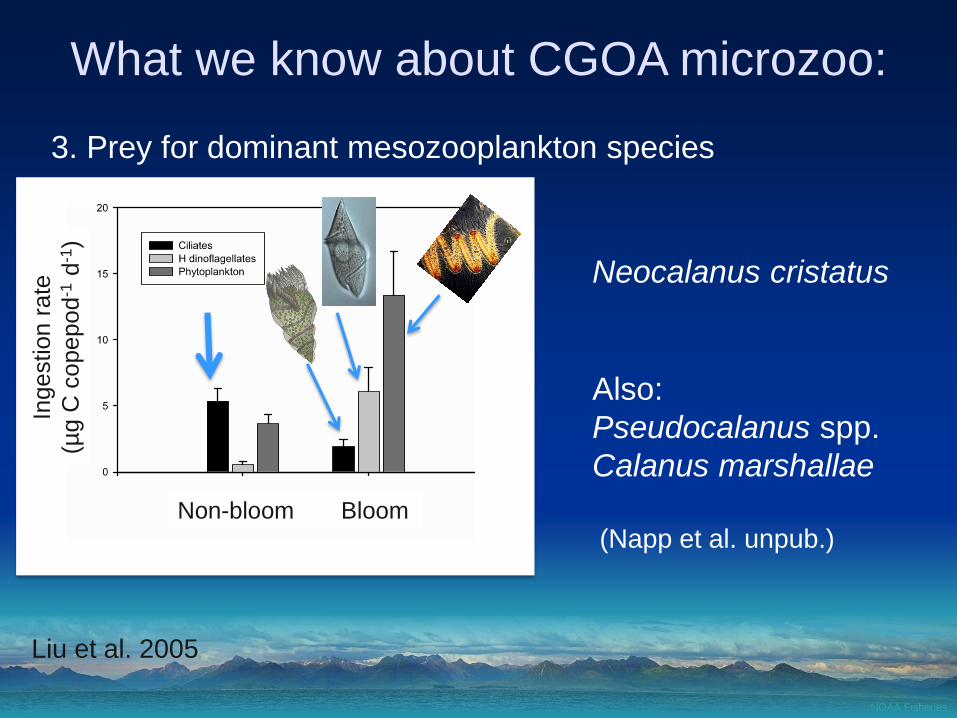
What we know about CGOA microzoo:
3. Prey for dominant mesozooplankton species
Non-bloom Bloom
Ingestion r
ate
(µg C
copepod
-1d
-1)
Neocalanus cristatus
Liu et al. 2005
Also:
Pseudocalanus spp.
Calanus marshallae
(Napp et al. unpub.)

NOAA Fisheries
Taxonomic detail level:
Readily identifiable species/genera
Otherwise, broad size and taxonomic category (functional groups)
All cells sized, converted to C biomass from volume using empirical factors
How are microzoo assessed?DinoflagellatesGymnodinium
Gyrodinium
Ceratium
Polykrikos
Protoperidinium
Amphidinium
Dinophysis
misc (by shape)
CiliatesLaboea
Tontonia
Strombidiniopsis
Strobilidium
Strombidium (var)
Mesodinium
tintinnids (by genus)
misc (by shape)
Increasing distance offshore

NOAA Fisheries
New data: Seasonal cycles in microzoo
0
10
20
30
Spring Summer Fall
Microzoobiomass(µgC/L) 2011
west
east
0
10
20
30
Spring Summer Fall
Microzoobiomass(µgC/L) 2013
west
east
Median values from 10 m samples (n = 6-16)
• Biomass 2-3x higher in spring
• West higher than east
Strom et al. 2016
• Absence of spring phyto bloom seen in 2011 microzoo
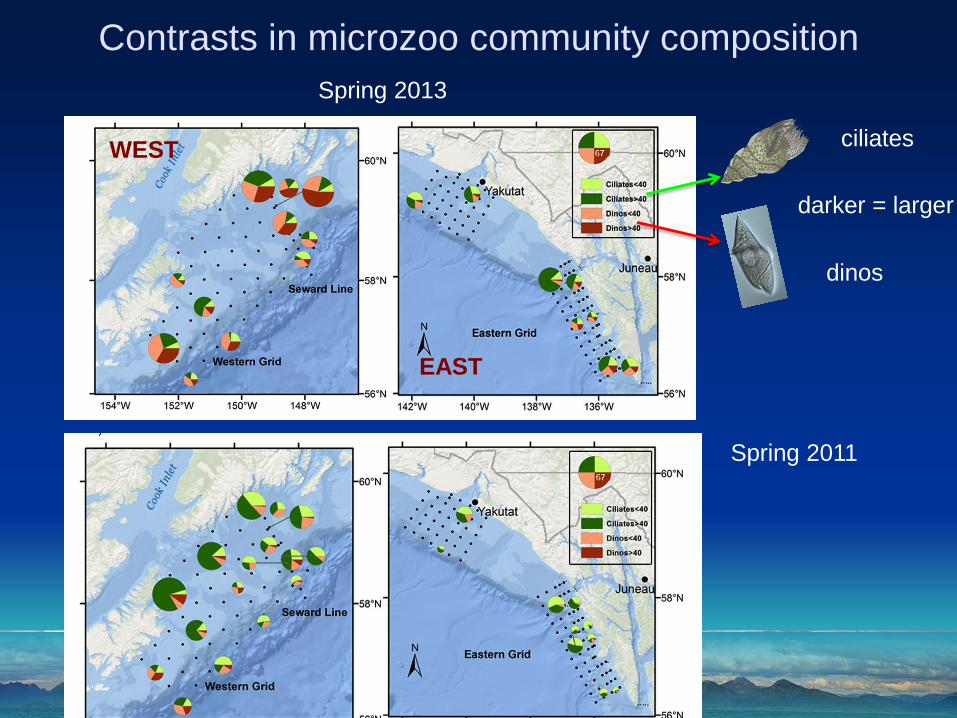
Contrasts in microzoo community composition
WEST
EAST
ciliates
dinos
darker = larger
Spring 2013
Spring 2011

NOAA Fisheries
Contrasts in microzoo community composition
2011 2013
E W E W E W
spring summer fall
E W E W E W
spring summer fall
Cili
ate
: d
ino
bio
mass r
atio
1 : 1
W E W E W E
spring summer fall
W E W E W E
spring summer fall
Fra
ction >
40 µ
mMore ciliates in eastMore ciliates in 2011
Large microzoo during
spring bloom
Not so much. . .
Strom et al. 2016

NOAA Fisheries
That is more ciliates than we expected
Year Season Avg % Dinos Reference
1992 spring 48 - 54 Howell-Kübler et al. 1996
1999 summer ~50 Olson & Strom 2002
2004 summer ~70 Strom & Fredrickson 2008
2008-10 spring 65 - 75 Sherr et al. 2013
2008-10 summer 64 Stoecker et al. 2014
Bering Sea:
From Stoecker et al. 2014
NOAA Fisheries
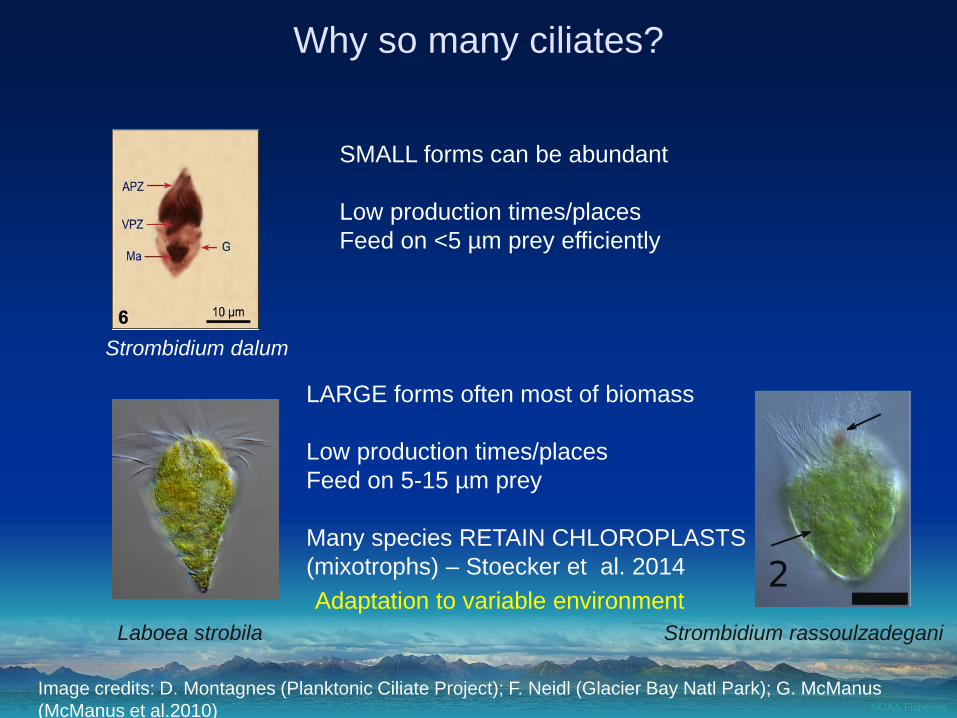
SMALL forms can be abundant
Low production times/places
Feed on <5 µm prey efficiently
Why so many ciliates?
Strombidium dalum
Laboea strobila
Image credits: D. Montagnes (Planktonic Ciliate Project); F. Neidl (Glacier Bay Natl Park); G. McManus
(McManus et al.2010)
Strombidium rassoulzadegani
LARGE forms often most of biomass
Low production times/places
Feed on 5-15 µm prey
Many species RETAIN CHLOROPLASTS
(mixotrophs) – Stoecker et al. 2014
Adaptation to variable environment

NOAA Fisheries
Drivers of microzoo community composition
Biomass
ciliates
dinoflagellates
PC1 related most strongly to largest ciliates and dinoflagellates
PC1 positively correlated with chlorophyll (but not T, S, nutrients)
Strom et al. 2016

NOAA Fisheries
Relationship to mesozooplankton (top down)
SALPS
Unusually
abundant in 2011
Image credits: L. Madin (www.whoi.edu); D. Wrobel (jellieszone.com)
MAX CLEARANCE
(% water column d-
1)
20 1
5 1
Li et al. 2016
Salpa aspera Cyclosalpa bakeri

NOAA Fisheries
Relationship to mesozooplankton (top down)
Neocalanus spp. (spring dominant) similar between regions and years
Calanus marshallae
higher in east
56°
57°
58°
59°
60°
61°
62°
Summer 2011
-155° -150° -145° -140° -135°
56°
57°
58°
59°
60°
61°
62°
Fall 2011
Summer 2013
-155° -150° -145° -140° -135°
Fall 2013
56°
57°
58°
59°
60°
61°
62°
Spring 2011300
30
3
Spring 2013
Summer 2011 Summer 2013
56°
57°
58°
59°
60°
61°
62°
Summer 2011
-155° -150° -145° -140° -135°
56°
57°
58°
59°
60°
61°
62°
Fall 2011
Summer 2013
-155° -150° -145° -140° -135°
Fall 2013
56°
57°
58°
59°
60°
61°
62°
Spring 201150
5
0.5
Spring 2013
Summer 2011
Spring 2011
Summer 2013
Spring 2013
Euphausiids usually
higher in east
Hopcroft et al. 2016
Narrow shelf in east =
MORE OCEANIC =
large-bodied zoop =
larger prey
NOAA Fisheries
Conclusions
• Microzooplankton in the CGOA show seasonal, regional and
interannual variation that reflects the underlying production
regime
• Ciliates made up a large proportion of the community,
especially in lower production seasons and locations
• Large ciliates likely a key functional group in the ecosystem
due to chloroplast retention (mixotrophic life style) and
importance as prey
• Predation by mesozooplankton likely affects microzoo
abundance and community composition
Thank you very much – Tusen takk!