Relative Abundance of Gulf of Alaska Sablefish and Other ......Sigler, M. F., and H. H. Zenger, Jr....
89
NOAA Technical Memorandum NMFS-AFSC-40 U.S. DEPARTMENT OF COMMERCE National Oceanic and Atmospheric Administration National Marine Fisheries Service Alaska Fisheries Science Center May 1994 Relative Abundance of Gulf of Alaska Sablefish and Other Groundfish Based on the Domestic Longline Survey, 1989 by M. F. Sigler and H.H. Zenger, Jr.
Transcript of Relative Abundance of Gulf of Alaska Sablefish and Other ......Sigler, M. F., and H. H. Zenger, Jr....

NOAA Technical Memorandum NMFS-AFSC-40
U.S. DEPARTMENT OF COMMERCENational Oceanic and Atmospheric Administration
National Marine Fisheries ServiceAlaska Fisheries Science Center
May 1994
Relative Abundance of Gulf of AlaskaSablefish and Other Groundfish Basedon the Domestic Longline Survey, 1989
byM. F. Sigler and H.H. Zenger, Jr.

NOAA Technical Memorandum NMFS
The National Marine Fisheries Service's Alaska Fisheries Science Centeruses the NOAA Technical Memorandum series to issue informal scientific andtechnical publications when complete formal review and editorial processingare not appropriate or feasible. Documents within this series reflect soundprofessional work and may be referenced in the formal scientific and technicalliterature.
The NMFS-AFSC Technical Memorandum series of the Alaska FisheriesScience Center continues the NMFS-F/NWC series established in 1970 by theNorthwest Fisheries Center. The new NMFS-NWFSC series will be used bythe Northwest Fisheries Science Center.
This document should be cited as follows:
Sigler, M. F., and H. H. Zenger, Jr. 1994. Relative abundance of Gulfof Alaska sablefish and other groundfish based on the domesticlongline survey, 1989. U.S. Dep. Commer., NOAA Tech. Memo.NMFS-AFSC-40, 79 p.
Reference in this document to trade names does not imply endorsement bythe National Marine Fisheries Service, NOAA.

by
M. F. Sigler and H.H. Zenger, Jr
May 1994
NOAA Technical Memorandum NMFS-AFSC-40
Relative Abundance of Gulf of Alaska
Sablefish and Other Groundfish Based
on the Domestic Longline Survey, 1989
U.S. DEPARTMENT OF COMMERCE
Ronald H. Brown, Secretary
National Oceanic and Atmospheric Administration
D. James Baker, Under Secretary and Administrator
National Marine Fisheries Service
Rolland A. Schmitten, Assistant Administrator for Fisheries
1 2
1
2
Auke Bay Laboratory
Alaska Fisheries Science Center
11305 Glacier Highway
Juneau AK 99801-8626
Resource Assessment and Conservation Engineering Division
Alaska Fisheries Science Center
7600 Sand Point Way N.E., BIN C-15700
Seattle, WA 98115-0070

This document Is available to the public through:
National Technical Information ServiceU.S. Department of Commerce5285 Port Royal RoadSpringfield, VA 22161

Notice to Users of this Document
This document is being made available in .PDF format for the convenience of users; however, the accuracy and correctness of the document can only be certified as was presented in the original hard copy format.


iii
ABSTRACT
The Alaska Fisheries Science Center has conducted anannual longline survey of sablefish (Anoplopoma fimbria) andother groundfish in the Gulf of Alaska since 1987. Thissurvey replicates as closely as practical the Gulf of Alaskaportion of a Japan-U.S. cooperative longline survey conductedfrom 1979 to 1994 and also samples gullies not sampled duringthe cooperative longline survey. In 1989, 73 stations weresampled from 26 June to 12 September. Each day, 16 km ofgroundline containing 7,200 hooks baited with squid was setfrom the chartered fishing-vessel Ocean Prowler.
Sablefish relative population numbers (RPN) on the uppercontinental slope decreased significantly: 18% from 1988 to1989. Most of the decrease was observed in the western andcentral areas of the Gulf of Alaska; the RPN remained -aboutthe same in the eastern areas. The strong 1984 year classexpected to recruit in 1989 was not apparent in the surveyresults, nor was there evidence for later strong yearclasses. The rougheye (Sebastes aleutianus)- and shortraker(S. borealis) rockfish RPN increased 35% from 1988 to 1989;this increase was not statistically significant. Thethornyhead [Sebastolobus alascanus) RPN increased.significantly (77%).
Preceding Page Blank

THIS PAGE INTENTIONALLY LEFT BLANK
V
C O N T E N T S
INTRODUCTION . . . . . . . . . . .
METHODS . . . . . . . . . . . . . .Vessel and Gear . . . . . . .Survey Area and Operations . .Data Collection . . . . . .Analytical Method: . . . . . .
ANALYSIS OF THE CATCH . . . . . . .Sablefish . . . . . . . . . .
. . . . .
. . . . .
. . . . .
. . . . .
. . . . .
. . . . .
. . . . .
. . . . .Rougheye and Shortraker Rockfish . . . .Thornyheads . . . . . . . . . . . . . .Other Species . . . . . . . . . . .Year-Class Strength of Sablefish . . . .Possible Reasons for Changes in Sablefish RPN .
. .
. .
. .
. .
. .
. .
. .
. .
. .
. .
. .
. .
. .
. .
. .
. .
. .
. .
. .
. .
. .
. .
. .
. .
Relationship Between Changes in Sablefish,Thornyhead, and Grenadier RPNs . .
ACKNOWLEDGMENTS . . . . . . . . . . . . . . .
CITATIONS . . . . . . . . . . . . . . . . . .
TABLES . . . . . . . . . . . . . . . . . . .
FIGURES . . . . . . . . . . . . . . . . . . .
. .
. .
. .
. .
. .
. .
. .
. .
. .
. .
. .
. .
. .
. .
. .
. .
. .
. .
. .
. .
. .
. .
. .
. .
. .
. .
. .
. .
Preceding Page Blank

From 1979 to 1994, Japan and the United States annuallyconducted a cooperative longline survey covering the uppercontinental slope of the eastern Bering Sea, the AleutianIslands, and the Gulf of Alaska. The research has suppliedinformation needed to estimate the abundance of sablefish(Anoplopoma fimbria) and other groundfish species (Lowe andSigler 1989; Yoshimura and Sasaki 1989; Clausen and Sigler inpress).
Since 1987, the National Oceanic and AtmosphericAdministration's (NOAA) Alaska Fisheries Science Center hasconducted an additional annual longline survey designed tocontinue the time series of the Gulf of Alaska portion of theJapan-U.S. cooperative longline survey. The domesticlongline survey covers the same stations, (Fig. 1) and season,and uses similar sampling gear as used on the Gulf of Alaskaportion of the cooperative longline survey. The primarypurpose of the domestic longline survey is to determineannually the relative abundance and size composition ofsablefish, shortspine thornyhead (Sebastolobus alascanus),rougheye rockfish (Sebastes aleutianus), and shortrakerrockfish (Sebastes borealis) in the Gulf of Alaska.
This report presents results of the 1989 domesticlongline survey and updates the 1987 and 1988 surveys (Siglerand Zenger 1989; Zenger et al. 1992). The analysis ofsablefish for the 1989 Japan-U.S. cooperative longlinesurvey is reported in Fujioka (1991) for the Gulf of Alaskaand in Lowe (1991) for the eastern Bering Sea and AleutianIslands. A comparison of the catch rates of sablefishbetween the domestic and cooperative longline surveys will bereported in a separate document (Zenger 1992).
METHODS
Vessel and Gear
The survey vessel was the chartered fishing vesselOcean Prowler (47 m, 155 ft). Each day, 16 km (8.6 nauticalmiles) of groundline was set. The groundline consisted of160 sections called skates;long and included 45 Mustad1
each skate was 100 m (55 fathoms)size 13/0 circle hooks spaced
2 m (6.5 ft) apart. The groundline was weighted with 3.2-kg(7-1b) lead balls snapped on at the end of every skate. Eachhook was baited by hand with chopped squid (Illex spp.) at arate of about 5.5 kg (12.0 lb) per 100 hooks.
1Reference to trade names does not imply endorsement by the NationalMarine Fisheries Service, NOAA.
2
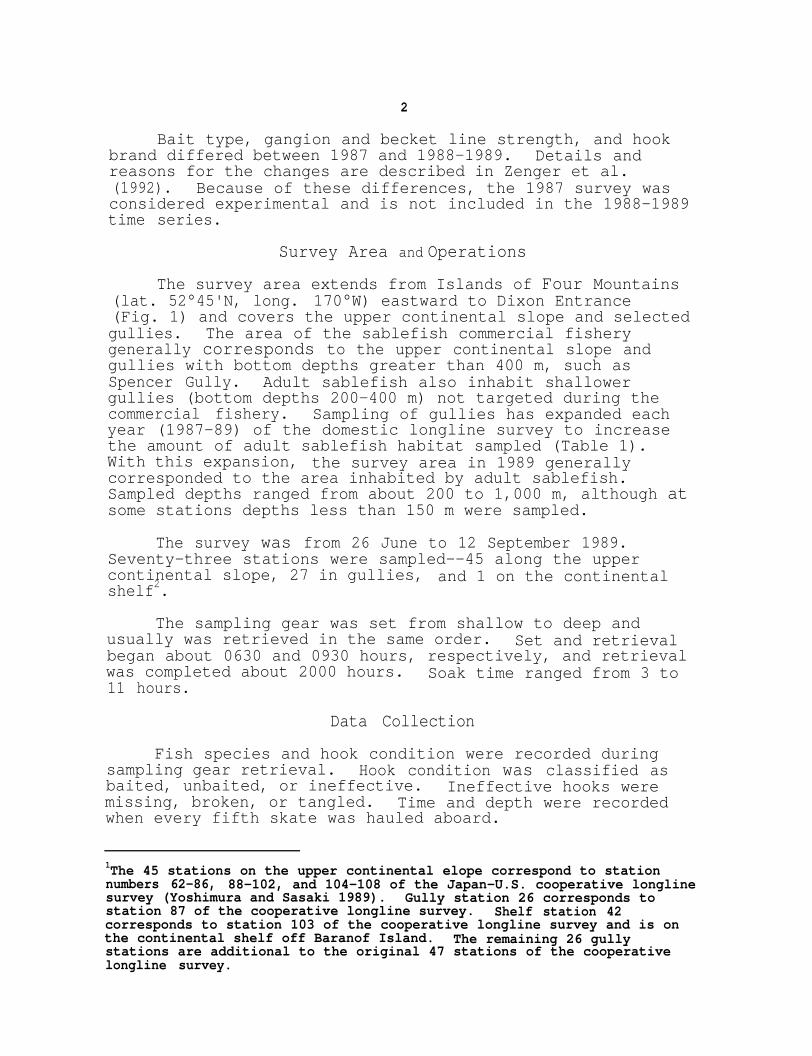
Bait type, gangion and becket line strength, and hookbrand differed between 1987 and 1988-1989. Details andreasons for the changes are described in Zenger et al.(1992). Because of these differences, the 1987 survey wasconsidered experimental and is not included in the 1988-1989time series.
Survey Area and Operations
The survey area extends from Islands of Four Mountains(lat. 52°45'N, long. 170°W) eastward to Dixon Entrance(Fig. 1) and covers the upper continental slope and selectedgullies. The area of the sablefish commercial fisherygenerally corresponds to the upper continental slope andgullies with bottom depths greater than 400 m, such asSpencer Gully. Adult sablefish also inhabit shallowergullies (bottom depths 200-400 m) not targeted during thecommercial fishery. Sampling of gullies has expanded eachyear (1987-89) of the domestic longline survey to increasethe amount of adult sablefish habitat sampled (Table 1).With this expansion, the survey area in 1989 generallycorresponded to the area inhabited by adult sablefish.Sampled depths ranged from about 200 to 1,000 m, although atsome stations depths less than 150 m were sampled.
The survey was from 26 June to 12 September 1989.Seventy-three stations were sampled--45 along the uppercontinental slope, 27 in gullies,shelf2.
and 1 on the continental
The sampling gear was set from shallow to deep andusually was retrieved in the same order. Set and retrievalbegan about 0630 and 0930 hours, respectively, and retrievalwas completed about 2000 hours.11 hours.
Soak time ranged from 3 to
Data Collection
Fish species and hook condition were recorded duringsampling gear retrieval. Hook condition was classified asbaited, unbaited, or ineffective. Ineffective hooks weremissing, broken, or tangled. Time and depth were recordedwhen every fifth skate was hauled aboard.
1The 45 stations on the upper continental elope correspond to stationnumbers 62-86, 88-102, and 104-108 of the Japan-U.S. cooperative longlinesurvey (Yoshimura and Sasaki 1989). Gully station 26 corresponds tostation 87 of the cooperative longline survey. Shelf station 42corresponds to station 103 of the cooperative longline survey and is onthe continental shelf off Baranof Island. The remaining 26 gullystations are additional to the original 47 stations of the cooperativelongline survey.

3
Sablefish, Pacific cod (Gadus macrocephalus), arrow-tooth-flounder (Atheresthes stomias), rockfish (Sebastes spp.), andthornyhead (Sebastolobus spp.) fork lengths were measured.Vent length--the length from snout to vent (SV)--was measured,for grenadiers (Macrouridae). Sablefish and Pacific cod weresorted into eight depth strata (Table 2) for measuring lengthand determining sex, whereas other species were not.
Analytical Methods
The number of fish caught per skate (catch per uniteffort, CPUE) was calculated by species for each stratum at astation. The CPUE for each stratum of a station wasmultiplied by the area of the stratum (Table 3) to computerelative population numbers (RPN, an index of relativeabundance in numbers) (Gulland 1969; Quinn et al. 1982;Sasaki 1985). The resultant values were averaged within thearea to obtain an RPN for each stratum and area. Relativepopulation numbers were calculated only for depths201-1,000 m because this range generally corresponds to thedepths sampled. Relative population numbers were notcalculated for shallower depths because depths less than200 m were sampled at only some stations (see Survey Area andOperations).
Relative population number weighted length frequencies(RPN LF) were computed for depths 201-1,000 m to examine thesize compositions of the species. Catch per unit effortweighted length frequencies (CPUE LF) of sablefish werecomputed for depths 101-200 m for evidence of relativelystrong year classes. Length compositions for depths101-200 m from previous Japan-U.S. cooperative longlinesurveys were used to document the relatively strong 1977 and1980 year classes of sablefish (Sigler and Fujioka 1988). ACPUE LF was calculated instead of an RPN LF because RPNs werenot estimated for these depths for the reason noted in theprevious paragraph. Relative population weights (RPW, anindex of relative abundance in weight) were computed from theRPN LF and length-weight equations to assess relativebiomass. Computation of the RPN, RPW, and lengthcompositions is described in more detail in Sigler and Zenger(1989)3.
3All stations established by the cooperative longline survey (stations1-47) previously were classified as upper continental slope stations,although this classification was incorrect for two stationa. These twostations, 26 in Amatuli Gully and 42 off Baranof Island, have beenreclassified now that the domestic longline survey extensively samplesgully areas. As a result, the RPNs and RPWs for 1980 presented in Zengerand Sigler (unpubl. manuscr.) differ slightly from those presented inthis report:
4
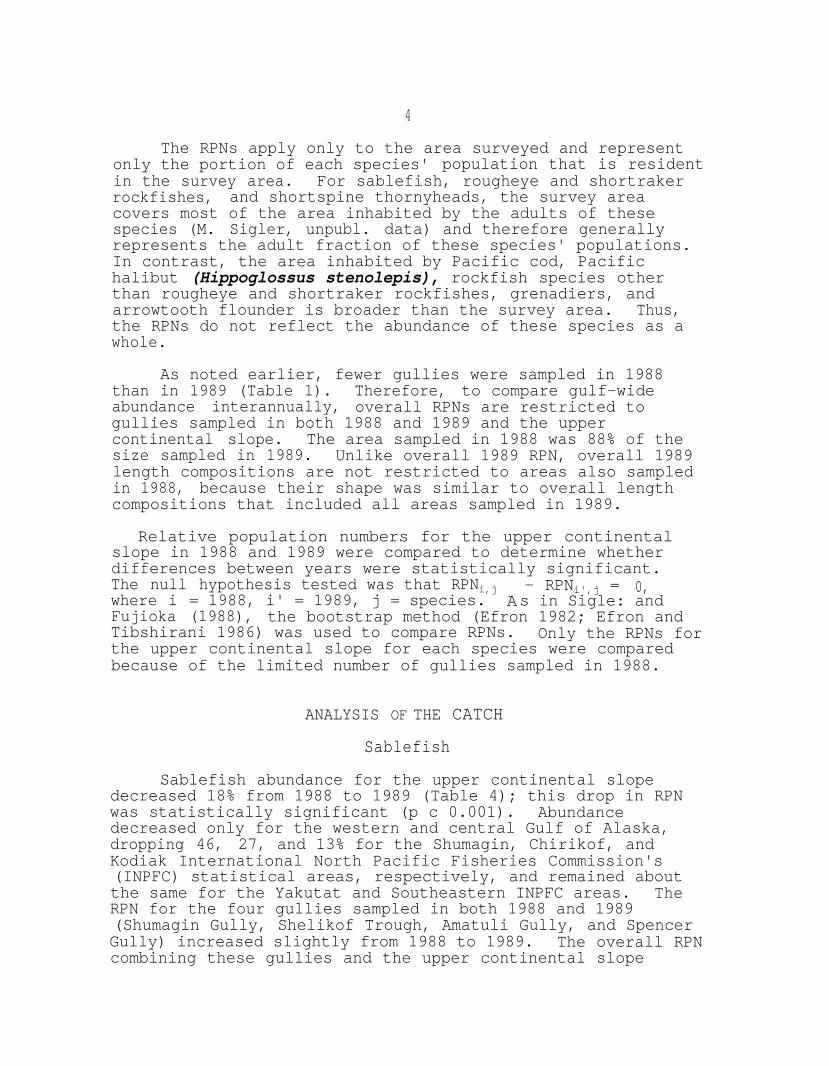
The RPNs apply only to the area surveyed and representonly the portion of each species' population that is residentin the survey area. For sablefish, rougheye and shortrakerrockfishes, and shortspine thornyheads, the survey areacovers most of the area inhabited by the adults of thesespecies (M. Sigler, unpubl. data) and therefore generallyrepresents the adult fraction of these species' populations.In contrast, the area inhabited by Pacific cod, Pacifichalibut (Hippoglossus stenolepis), rockfish species otherthan rougheye and shortraker rockfishes, grenadiers, andarrowtooth flounder is broader than the survey area. Thus,the RPNs do not reflect the abundance of these species as awhole.
As noted earlier, fewer gullies were sampled in 1988than in 1989 (Table 1). Therefore, to compare gulf-wideabundance interannually, overall RPNs are restricted togullies sampled in both 1988 and 1989 and the uppercontinental slope. The area sampled in 1988 was 88% of thesize sampled in 1989. Unlike overall 1989 RPN, overall 1989length compositions are not restricted to areas also sampledin 1988, because their shape was similar to overall lengthcompositions that included all areas sampled in 1989.
Relative population numbers for the upper continentalslope in 1988 and 1989 were compared to determine whetherdifferences between years were statistically significant.The nullwhere i
hypothesis tested was that RPNi,j= 1988, i' = 1989, j = species. A
- RPNi',j = 0,s in Sigle: and
Fujioka (1988), the bootstrap method (Efron 1982; Efron andTibshirani 1986) was used to compare RPNs. Only the RPNs forthe upper continental slope for each species were comparedbecause of the limited number of gullies sampled in 1988.
ANALYSIS OF THE CATCH
Sablefish
Sablefish abundance for the upper continental slopedecreased 18% from 1988 to 1989 (Table 4); this drop in RPNwas statistically significant (p c 0.001). Abundancedecreased only for the western and central Gulf of Alaska,dropping 46, 27, and 13% for the Shumagin, Chirikof, andKodiak International North Pacific Fisheries Commission's(INPFC) statistical areas, respectively, and remained aboutthe same for the Yakutat and Southeastern INPFC areas. TheRPN for the four gullies sampled in both 1988 and 1989(Shumagin Gully, Shelikof Trough, Amatuli Gully, and SpencerGully) increased slightly from 1988 to 1989. The overall RPNcombining these gullies and the upper continental slope

5
decreased slightly (10%) from 668,186 in 1988 to 601,517 in1989.
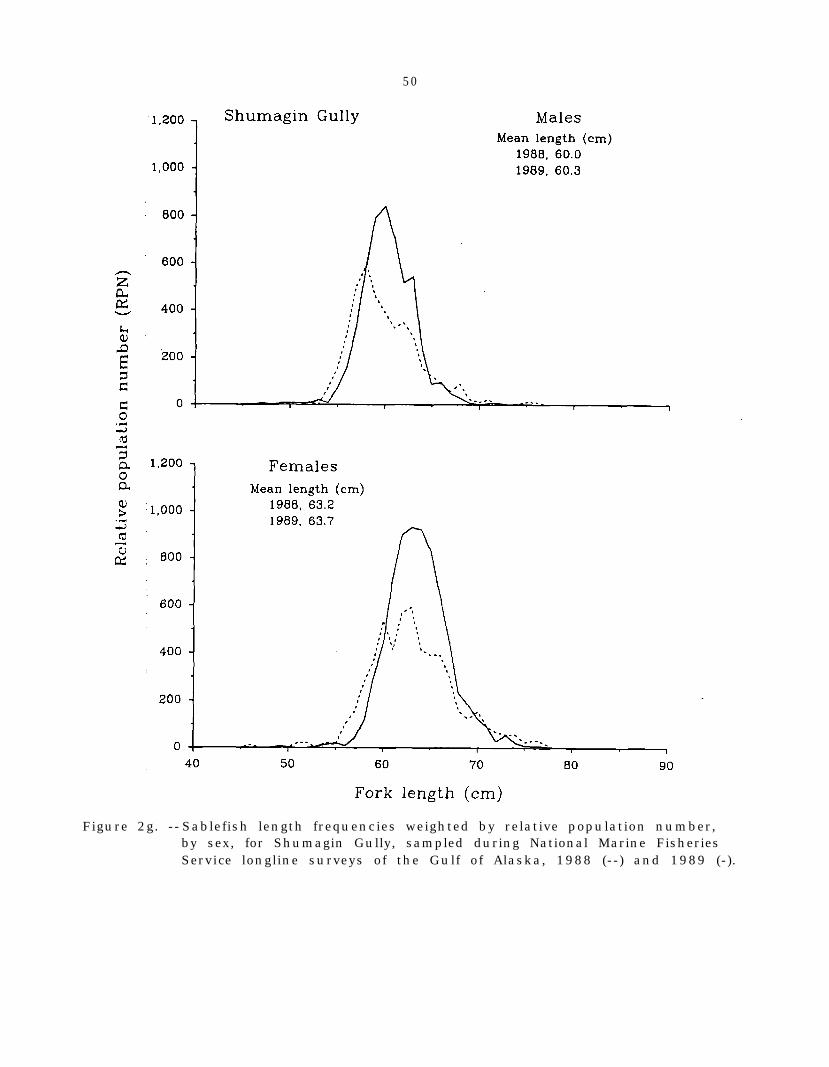
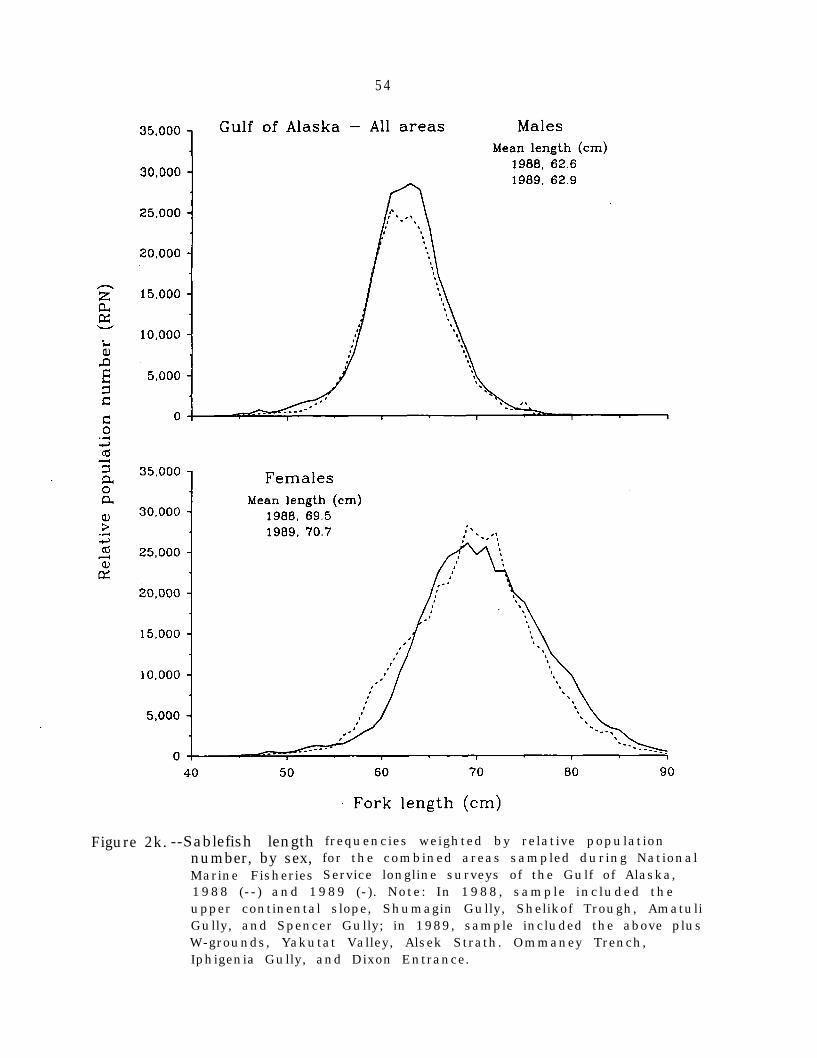
Mean length increased from 1988 to 1989 in several areas(Fig. 2): females and males in the Kodiak (Fig. 2c) andYakutat INPFC areas (Fig. 2d), Shumagin Gully (Fig. 2g),Shelikof Trough (Fig. 2h), Amatuli Gully (Fig. 2i), andSpencer Gully (Fig. 2j). This increase in mean length wasdue to an increase in the proportion of relatively largefish. In the remaining INPFC areas--females and males inShumagin (Fig. 2a), Chirikof (Fig. 2b), and Southeastern(Fig. 2e) --length compositions were similar in shape andlocation in 1988 and 1989. Overall, from 1988 to 1989, thenumber of relatively small fish decreased for females and wassimilar for males, and the number of relatively large fishincreased for both females and males (Fig. 2k).
From 1988 to 1989, RPW decreased (12%) for the uppercontinental slope and increased (8%) for the four gulliessampled both years (Table 5). The percentage changes differ'from those for the corresponding RPNs because of an increasedproportion of larger sablefish from 1988 to 1989 (i.e.,although there were fewer sablefish in 1989 than in 1988,they were larger; therefore, the RPW did not decrease as muchas the RPN).
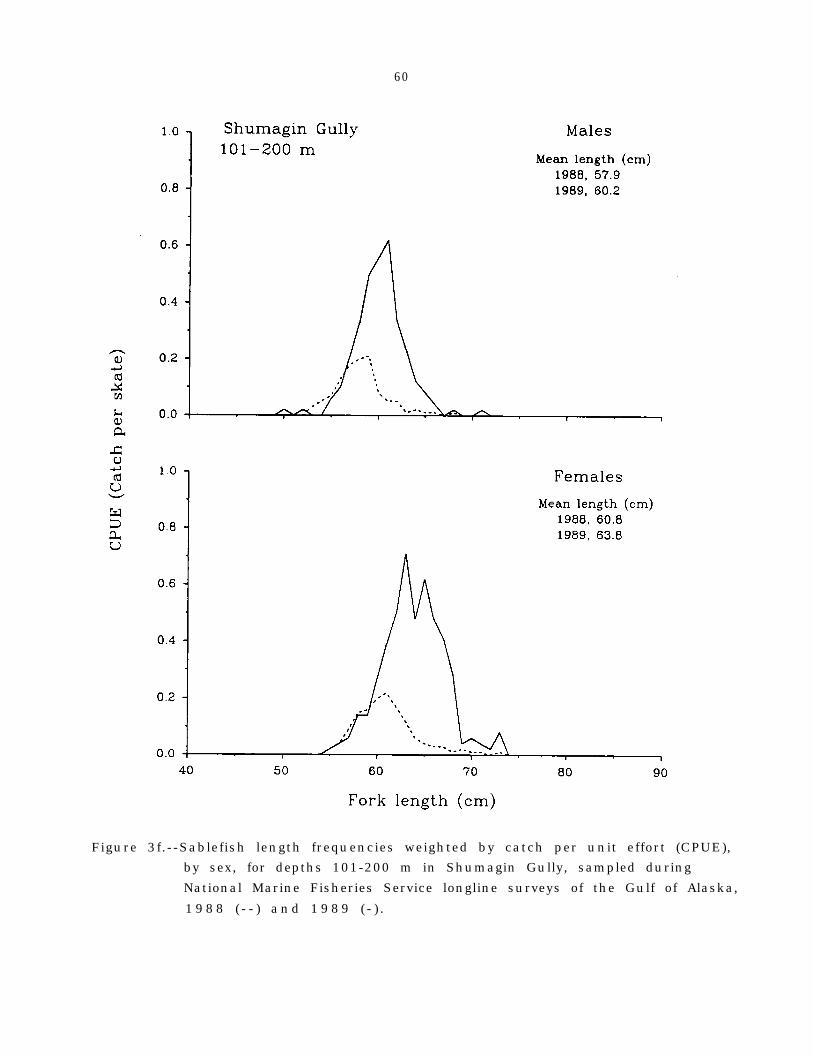
There was no evidence from the length compositions for101-200 m of any upcoming strong year classes in 1985 orlater. Length-at-age distributions for sablefish in the Gulfof Alaska sampled previously in the cooperative longlinesurvey showed age-4 males were mostly 46-54 cm fork length(FL) (mean 51.7 cm) and age-4 females 46-58 cm FL (mean 54.6cm) (Clausen and Sigler in press). There were no distinctmodes at or below these length ranges in 1988 or 1989 (Fig.3) except for a mode about 54 cm FL in 1988 for both malesand females in the Yakutat INPFC area (Fig. 3d).
The length compositions for 101-200 m changed somewhatfrom 1988 to 1989, probably due to a year class originatingbefore 1985. From 1988 to 1989, the proportion of fish55-65 cm FL often decreased (Shumagin (Fig. 3a) and YakutatINPFC areas (Fig. 3d)), whereas the proportion of fish60-70 cm FL often increased (Chirikof (Fig. 3b) and YakutatINPFC areas (Fig. 3d), Shumagin Gully (Fig. 3f) and ShelikofTrough (Fig. 3g)). In the Shumagin and Chirikof INPFC areasand in Shelikof Trough and Shumagin Gully, the FL modeprogressed from 57-59 cm in 1988 to 60-62 cm in 1989 formales, and from 59-61 cm to 63 cm for females. Based on thelength-at-age data from the cooperative longline survey (Fig.4), the modes represent 4- or 5-year-old fish in 1988 (1984or 1983 year class) and 5-year-old fish in 1989 (1984 yearclass).

6
Rougheye and Shortraker Rockfish
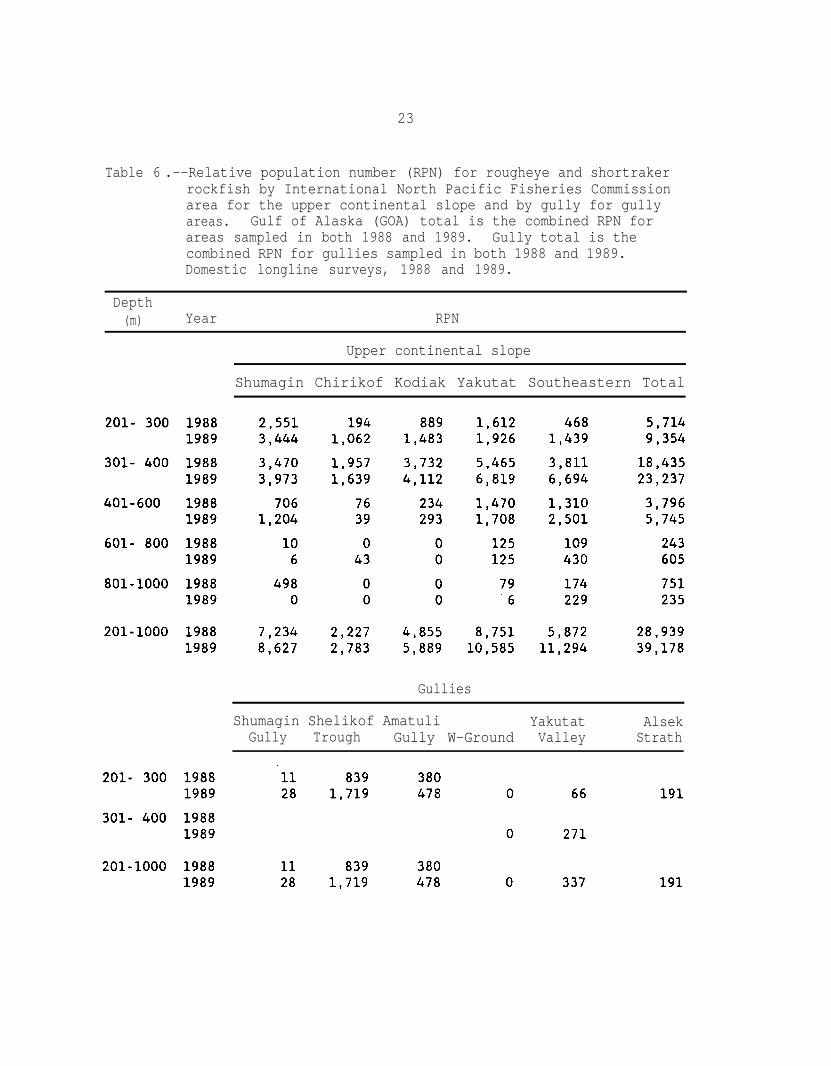
The combined RPN for rougheye and shortraker rockfish onthe upper continental slope increased 35% from 1988 to 1989(Table 6); however, this increase in the RPN was notstatistically significant (p = 0.064). The PPN increased inall areas of the upper continental slope. The RPN for theSoutheastern INPFC area increased the most (92%).
The number of rougheye and shortraker rockfish ingullies is relatively unimportant compared to the number onthe upper continental slope and accounted for only 9% of thetotal rougheye and shortraker rockfish PPN in 1989. Anotable change in population size was observed for ShelikofTrough, where abundance increased 105%. This change issuspect, however, because the RPNs are based on catches ofonly 38 rockfish in 1988 and 85 rockfish in 1989. (The RPNappears relatively large because of the large area ofShelikof Trough.)
The combined RPW for rougheye and shortraker rockfishfor the upper continental slope also increased markedly from1988 to 1989 (Table 7). The increase is due to increasedrougheye rockfish RPW (81%). Shortraker rockfish RPWremained about the same.
From 1988 to 1989, the length composition was similarfor rougheye rockfish (Fig. 5) and dissimilar for shortrakerrockfish (Fig. 6a). The change for shortraker rockfish wasdue to differences in the length compositions at lengths lessthan 55 cm FL. (At larger sizes, the length compositionswere similar.) A distinct mode (composed of two smallermodes) at 35-50 cm FL was observed in 1988, but not in 1989.This mode and subsequent change is attributable to the lengthcompositions observed in the Shumagin INPFC area (Fig. 6b).
Thornyheads
Thornyhead abundance on the upper continental slopeincreased 77% from 1988 to 1989 (Table 8); this increase inthe RPN was significant (p < 0.001). The gully RPN accountedfor 21% of the total RPN in 1989. Thus, the gully fractionis an important part of the thornyhead population. In 1989,relatively large numbers of thornyheads were found in AmatuliGully, Yakutat Valley, Ommaney Trench, and Dixon Entrance.Of these areas, only Amatuli Gully was sampled in both 1988and 1989. The RPN increased 95% in Amatuli Gully.
Like the RPN, the thornyhead RPW for the uppercontinental slope increased markedly (69%) (Table 9). TheRPW increased in all areas of the upper continental slope and

7
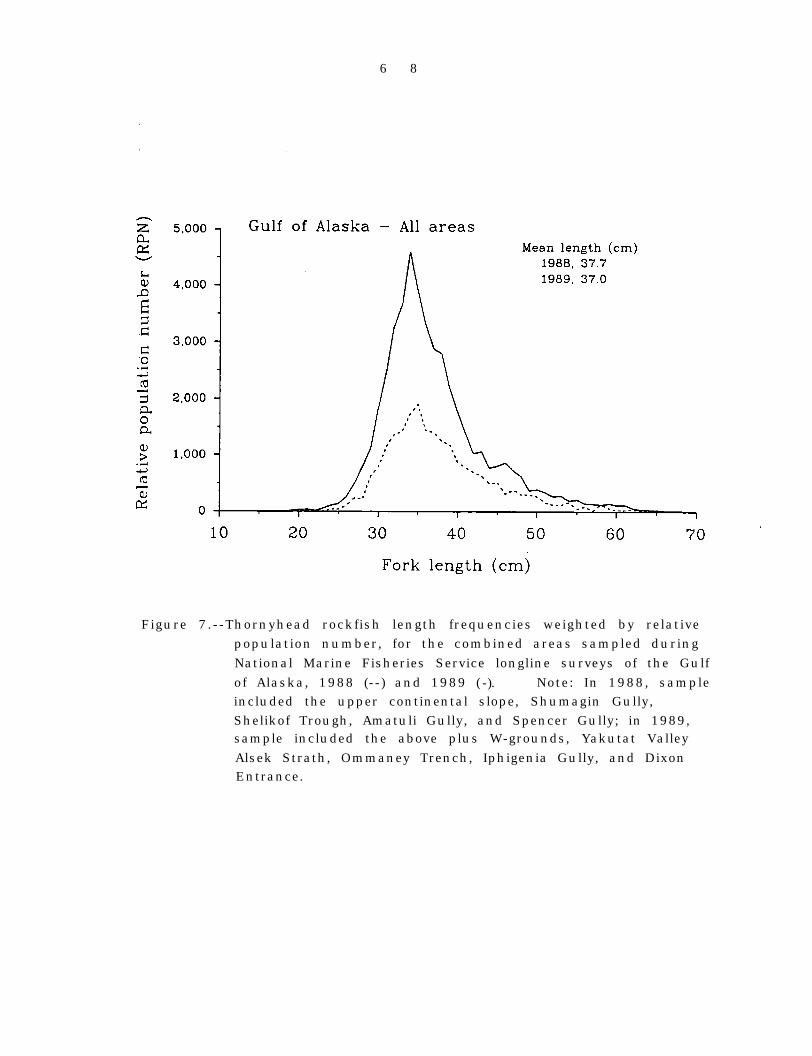
also in Amatuli Gully. The size composition was similar in1988 and 1989 (Fig. 7). The mean length decreased slightly.
Other Species
As mentioned in the Analytical Methods section, only anunknown fraction of the following species' populations wassampled. Thus, these results do not represent thepopulations as a whole.
Grenadier abundance on the upper continental slopeincreased 87% from 1988 to 1989 (Table 10); this increase inthe RPN was significant (p < 0.001). Greatest increases werein the Shumagin, Chirikof, and Kodiak areas, accounting for96% of the change. In contrast to the large numbers ofgrenadier on the upper continental slope, the number in thegullies was trivial, less than 1% of the total grenadier RPN.
The proportion of giant grenadiers (Albatrossiapectoralis) shorter than 31 cm SV increased from 1988 to 1989(Fig. 8), and, as a result, the mean length decreased 1 cm.This change was apparent in the Shumagin and Chirikof areas,but not in the remaining INPFC areas of the upper continentalslope. Unlike giant grenadiers, the length composition forpopeye grenadier (Coryphaenoides cinereus) was similar from1988 to 1989 (Fig. 9). (Popeye grenadier were caughtprimarily in the Kodiak, Yakutat, and Southeastern INPFCareas.)
Pacific cod abundance on the upper continental slopedecreased 28% from 1988 to 1989 (Table 11); this change inthe RPN was not statistically significant (p = 0.182).Abundance decreased in all INPFC areas of the uppercontinental slope except the Kodiak area, where abundanceremained about the same.
The gully fraction was an important part of the sampledPacific cod population, 82% of the total RPN for 1989. Themost important area was Shelikof Trough, which comprised 76%of the total RPN in 1989. The RPN for sampled gulliesdecreased 13% from 1988 to 1989 (Table 11).
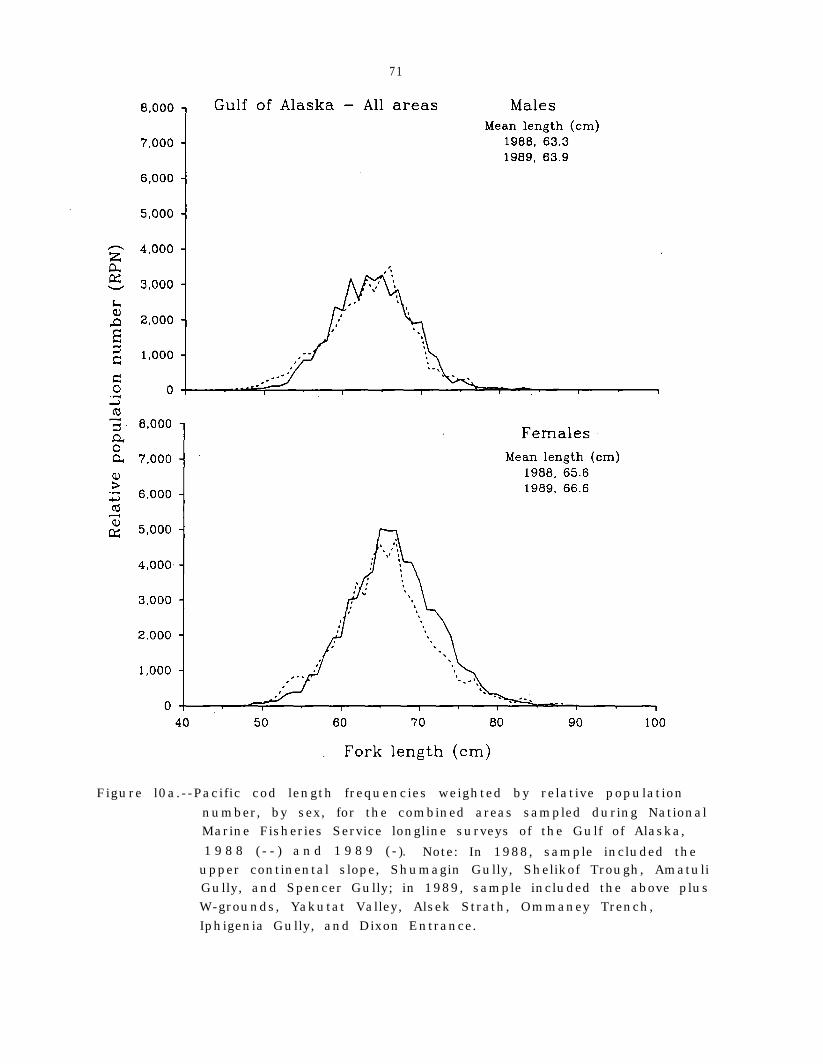
The length composition was similar in 1988 and 1989,except the proportion of females at 65-77 cm FL increased(Fig. 10). The mean length increased 1 cm as a result ofthis change. The additional females at 65-77 cm FL wereapparent only in Shelikof Trough (Fig., 10b).
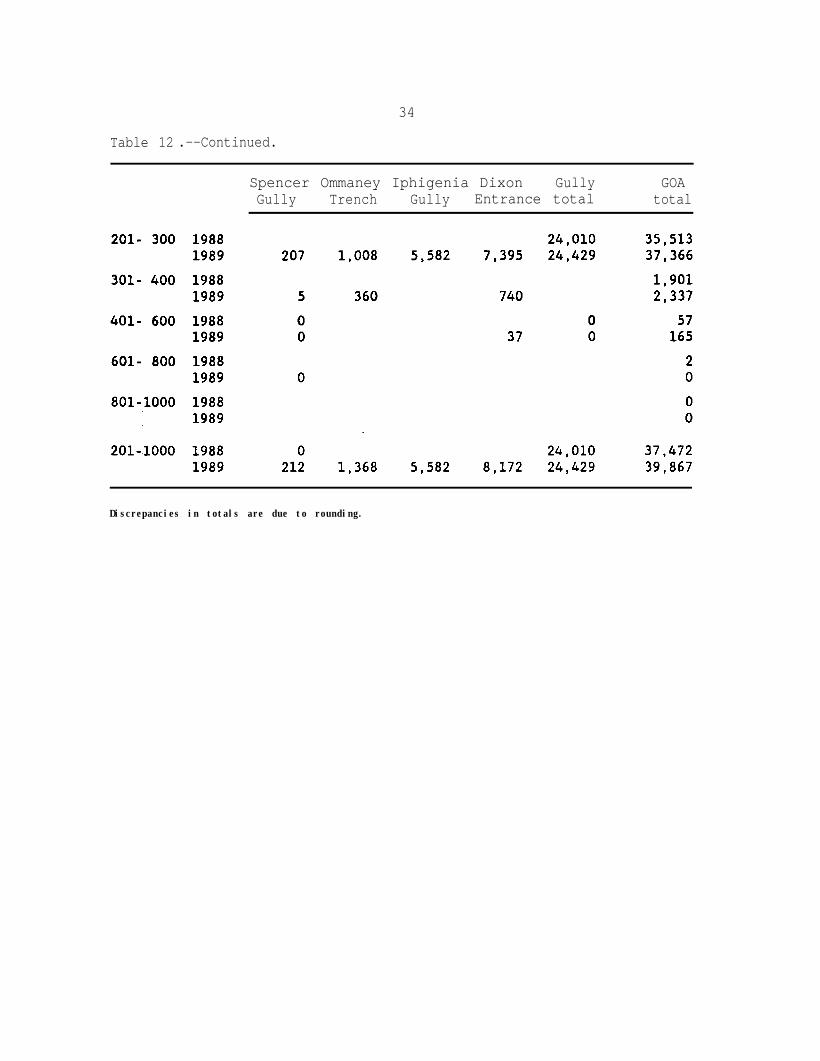
Pacific halibut abundance on the upper continental slopeincreased 15% from 1988 to 1989 (Table 12); this change inthe RPN was not significant (p = 0.366). The RPN increasedin the Shumagin and Chirikof INPFC areas, remained about the

8
same in the Kodiak INPFC area, and decreased in the Yakutatand Southeastern INPFC areas. The gully fraction was animportant part of the sampled Pacific halibut population, 73%of the total Pacific halibut RPN in 1989. The RPN forgullies sampled both years was similar.
Arrowtooth flounder abundance for the upper continentalslope increased 13% from 1988 to 1989 (Table 13); thisincrease in the RPN was not significant (p = 0.400). The RPNincreased in the Shumagin and Kodiak INPFC areas, remainedabout the same in the Chirikof and Southeastern INPFC areas,and decreased in the Yakutat INPFC area. The gully fractionwas an important part of the sampled arrowtooth flounderpopulation, 69% of the total arrowtooth flounder RPN in 1989.
The arrowtooth flounder size composition for 1988 wasbimodal with modes at 55 and 70 cm FL (Fig. 11a). In 1989,the number of arrow-tooth flounder 55-70 cm FL increased and asingle mode at 58 cm FL was observed. Mean length increasedfrom 59.6 to 62.3 cm FL from 1988 to 1989. The change in thesize composition was due to increased numbers of 55-70 cm FLfish in the Shumagin, Chirikof (Fig. 11b), Kodiak, andYakutat INPFC areas, Amatuli Gully, and a shift in the modefrom 55 to 59 cm FL in Shelikof Trough (Fig. 11c).
Skate abundance on the upper continental slope increased14% from 1988 to 1989 (Table 14); this increase in RPN wasnot significant (p = 0.715).population was important,
The gully fraction of the skate86% of the total skate RPN in 1989.
Two gullies (Shelikof Trough and Amatuli Gully) accounted for68% of the total skate RPN in 1989. The RPN increased 77% inShelikof Trough and decreased 21% in Amatuli Gully.
Forty-seven additional species (or species groups) werecaught during the survey (Table 15). They were a minorcomponent of the catch: less than 2% of the total RPN in1989.
Year-Class Strength of Sablefish
There was no evidence from 1988 or 1989 lengthcompositions for the 101-200 m depth stratum of a strong yearclass of sablefish originating in 1985 or later (Fig. 3a-i).These length compositions indicate a distinct, though notnecessarily strong, year class originating in 1983 or 1984.Previous evidence for a strong 1984 year class is conflicting(Clausen and Sigler in press). Supporting informationincludes an observed abundance of age-l sablefish in theinside waters of Southeast Alaska in 1985 (Fujioka 1987), andlength compositions from the 1986 trawl survey of the easternBering Sea (McDevitt 1987), the cooperative longline surveyin 1986-87 (Sigler 1987, 1989), and the domestic longline

9
survey in 1987 (Sigler and Zenger 1989). More recentevidence does not support the presence of a strong 1984 yearclass and includes length compositions from the 1987 trawlsurvey in the eastern Bering Sea (McDevitt 1988) and thecooperative longline survey in 1988 (Clausen and Sigler inpress) and sampling in inside waters of Southeast Alaska in1988 (Bracken 1988).
Further evidence contrary to the presence of a strong1984 year class is the decrease from 1988 to 1989 in thenumbers of relatively small females and the absence of changein the numbers of relatively small males in the lengthcompositions for 201-1,000 m (Fig. 2k). These observationsindicate the lack of substantial recruitment to the uppercontinental slope in 1989. Previous strong year classes in1977 and 1980 fueled sharp jumps in sablefish abundance in1980-82 and 1984-85, respectively (Sigler and Fujioka 1988),which led to the expectation that the 1984 year class wouldprimarily recruit to the upper continental slope in 1989(Sigler 1989). The lack of substantial recruitment in 1989indicates that the 1984 year class is not strong. Further,the absence of substantial recruitment to replace fish lostto fishing and natural mortality probably accounts for thedecline in sablefish abundance from 1988 to 1989.
Possible Reasons for Changes in Sablefish RPN
The number of relatively large fish increased from 1988to 1989 (Fig. 2k), perhaps due to growth in length ormigration of sablefish into the Gulf of Alaska. A recentmigration study concludes that a nontrivial number ofsablefish migrate in and out of the Gulf of Alaska each year(Heifetz and Fujioka 1991). A similar unexplained increasein the number of relatively large sablefish was observed in1985 (Fujioka 1987).
The Shumagin INPFC area RPN decreased sharply from 1988to 1989. There is some concern that the commercial fishery,which was in progress at the time of the survey, may havedepressed survey catch rates. A "season effect" is unlikelyto account for the entire drop because the fishery and surveyalso co-occurred in the Shumagin INPFC area in 1988 (Table16) and because the RPN also dropped sharply in the adjacentChirikof INPFC area, where most commercial fishing finishedmore than 4 weeks before the 1989 survey began.
Relationship Between Changes in Sablefish,Thornyhead, and Grenadier RPNs
Grenadier RPN nearly doubled from 1988 to 1989. Theircatch rates (Fig. 12) increased primarily in areas wheresablefish catch rates declined (Fig. 13), indicating 'that the

10
two changes are related. One scenario is that as sablefishnumbers decreased, the number of baited hooks available togrenadiers increased. (We believe that sablefish canoutcompete grenadiers for baited hooks, although thishypothesis has not been tested.) Under this scenario, theincrease in the grenadier RPN reflects the increasedavailability of baited hooks and not a change in the numberof grenadiers in the survey area. Another scenario is thatgrenadiers, whose range extends deeper than the surveyeddepths, moved upslope into the survey area as sablefishabundance decreased. This theory is reasonable because thedistance to move upslope is relatively short--less thanseveral kilometers. Under this scenario, the number ofgrenadiers within the survey area increased.
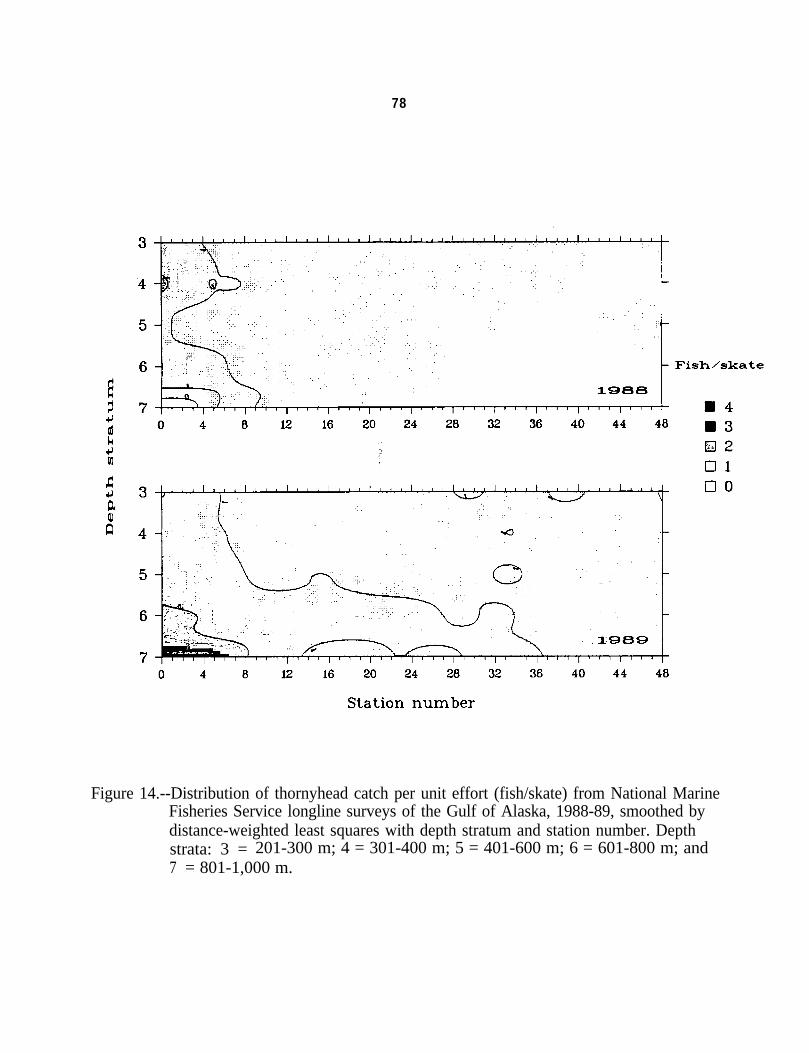
Thornyhead RPN also increased from 1988 to 1989; again,the change may reflect the decrease in sablefish abundance.Thornyhead RPN increased in all areas of the Gulf of Alaska(Table 8), whereas sablefish RPN decreased only in thewestern and central areas of the gulf (Table 4); thornyheadcatch rates generally increased where sablefish catch ratesdeclined (e.g., stations 2-16, especially at depths greaterthan 401 m; stations 37-40, depths less than 400 m)(Fig. 14). Unlike grenadiers, however, the increased numbersof thornyheads are not due to immigration because the surveygenerally covers the adult thornyhead range in the Gulf ofAlaska. Instead, increased availability of baited hooks dueto decreased sablefish numbers may be the cause of theincreased thornyhead RPN.4
Rockfish RPN also increased from 1988 to 1989. Theincreased rockfish RPN is due primarily to increased catchrates at stations 34-38 (Yakutat INPFC area) at depths201-400 m and stations 39-47 (Southeastern INPFC area) atdepths 201-800 m (Fig. 15). These increased rockfish catchesare not related to decreased sablefish catches. Further, thesurvey area generally covers the extent of rougheye andshortraker rockfish habitat in the Gulf of Alaska; thus, thechanges in RPN are probably not because of immigration.
The increases in the grenadier and thornyhead RPN(Tables 8, 10) were statistically significant, whereas theRPN increases for rockfish (Table 7) were not. Thus the
4We assume that sablefish can outcompete grenadiers, thornyheads, androckfish for baited hooks, but do not know among these latter threespecies which is the best competitor. In this discussion, we areassuming that they are equal competitors, thus implying that increasednumbers of baited hooks will result in increased RPN for all threespecies.

11
change in the rockfish RPN may be due to inherent variabilityin the index rather than a real change in abundance.
Alternatively, the increased RPN for grenadiers,thornyheads, and rockfish may be due to recruitment of youngfish. The lack of change in the length compositions forthornyhead and rockfish (except for shortrakers in theShumagin INPFC area) (Figs. 5-7) indicates that recruitmentwas not responsible for the RPN changes for these twospecies. For giant grenadiers, the proportion of fishshorter than 31 cm SV increased (Fig. 8), indicating thatrecruitment might be responsible for the increased RPN. Thelikelihood of this scenario cannot be differentiated from theother two scenarios previously discussed for grenadiers,however.
The apparent connection between changes in thegrenadier, thornyhead, and sablefish RPN indicates the dangerof simply, interpreting longline catch rate changes asreflecting real changes in abundance. The previousdiscussion indicates that the changes in grenadier andthornyhead RPN do not reflect changes in their abundance.Experiments with hook timers, electromechanical devices whichmeasure the arrival time of fish to the hook, imply thatsablefish longline catch rate is a linear function ofsablefish density (Sigler 1993). Similar experiments couldbe completed to examine the functional form of thisrelationship for grenadiers and thornyheads.
ACKNOWLEDGMENTS
We thank the crews of the FV Prowler and FV OceanProwler and thank their experienced and extraordinarilyhelpful skipper Jerry Kennedy, captain of FV Prowler in1987-1988 and of FV Ocean Prowler in 1989. We also thankDave King and his crew at the Net Loft for building thefishing gear.

12
CITATIONS
Bracken, B. E. 1988. Report to the Board of Fisheries:1988 Southeastern-Yakutat groundfish fisheries. Unpubl.manuscr., 40 p. Alaska Dep. Fish and Game, Div. ofCommer. Fish., P.O. Box 667, Petersburg, AK 99833.
Clausen, D. M., and M. F. Sigler. In press. Relativeabundance of sablefish in the Gulf of Alaska, based onthe Japan-U.S. cooperative longline survey, 1988. InT. K. Wilderbuer (editor), Condition of groundfishresources of the Gulf of Alaska in 1989. NOAA Tech.Memo. NMFS F/NWC-000.Mar. Fish. Serv.,
Alaska Fish. Sci. Cent., Natl.NOAA, 7600 Sand Point Way NE, Bin
C15700, Seattle, WA 98115-0070.
Efron, B. 1982. The jackknife, the bootstrap, and otherresampling plans.Math. 38.
CBMS-NSF Regional Conf. Ser. AppliedSoc. Ind. and Appl. Math., Philadelphia,
92 p.
Efron, B., and R. Tibshirani. 1986.standard errors,
Bootstrap methods forconfidence intervals, and other
measures of statistical accuracy. Stat. Sci. 1:54-77.
Fujioka, J. T. 1987. Sablefish. In R. L. Major (editor),Condition of groundfish resources of the Gulf of Alaskaas assessed in 1986, p. 51-83.Tech. Memo.
U.S. Dep. Commer., NOAANMFS F/NWC-119.
Natl. Mar. Fish. Serv.,Alaska Fish. Sci. Cent.,
Bin C15700,NOAA, 7600 Sand Point Way NE,
Seattle, WA 98115-0070.
Fujioka, J. T. 1991. Sablefish. In Stock assessment andfishery evaluation report for the 1992 Gulf of Alaskagroundfish fishery, section 4. N. Pac.Council,
Fish. Manage.P.O. Box 103136, Anchorage, AK 99510.
Gulland, J. A. 1969. Manual of methods for fish stockassessment. Part 1. Fish population analysis. FAO,Rome. St. Paul's Press Ltd., Malta, Italy, 154 p.
Heifetz, J., and J. T. Fujioka. 1991. Movement dynamics oftagged sablefish in the northeastern Pacific. Fish.Res. 11:355-374.
Lowe, S. A. 1991. Sablefish. In Stock assessment andfishery evaluation report for the groundfish resourcesof the Bering Sea/Aleutian Islands region as projectedfor 1992, section 8. Pac. Fish. Manage. Council, P.O.Box 103136, Anchorage, AK 99510.

13
Lowe, S. A., and M. F. Sigler. 1989. Relative abundance ofsablefish in the eastern Bering Sea and Aleutian Islandsregion based on the 1988 Japan-U.S. cooperative longlinesurvey. Unpubl. manuscr., 26 p. Alaska Fish. Sci.Cent., NMFS, NOAA, 7600 Sand Point Way NE, BIN C15700,Seattle WA 98115-0070.
McDevitt, S. A. 1987. Sablefish. In R. G. Bakkala andJ. W. Balsiger (editors), Condition of groundfishresources of the eastern Bering Sea and Aleutian Islandsregion in 1986, p. 97-115. U.S. Dep. Commer., NOAATech,. Memo. NMFS F/NWC-117. Alaska Fish. Sci. Cent.,Natl. Mar. Fish. Serv., NOAA, 7600 Sand Point Way NE,Bin C15700, Seattle, WA 98115-0070.
McDevitt, S. A. 1988. Sablefish. In R. G. Bakkala(editor), Condition of groundfish resources of theeastern Bering Sea and Aleutian Islands region in 1987,p. 101-115. U.S. Dep. Commer., NOAA Tech. Memo. NMFSF/NWC-139. Alaska Fish. Sci. Cent., Natl. Mar. Fish.Serv., NOAA, 7600 Sand Point Way NE, Bin C15700,Seattle, WA 98115-0070.
Quinn, T. J. II, S. H. Hoag, and G. M. Southward. 1982.Comparison of two methods of combining catch-per-unit-effort data from geographic regions. Can. J. Fish.Aquat. Sci. 39:837-846.
Sasaki, T. 1985. Studies on the sablefish resources in theNorth Pacific Ocean. Bull. 22, Far Seas Fish. Res. Lab.(Shimizu), 108 p.
Sigler, M. F. 1987. Preliminary assessment of the Gulf ofAlaska sablefish population based on the Japan-U.S.cooperative longline survey, 1986. NWAFC Processed Rep.87-14, 28 p. Northwest and Alaska Fish. Cent., Natl.Mar. Fish. Serv., NOAA, Auke Bay Lab., 11305 GlacierHwy., Juneau, AK 99801-8626.
Sigler, M. F. 1989. Assessment of Gulf of Alaska sablefishbased on the Japan-U.S. cooperative longline survey,1987. In T. K. Wilderbuer (editor), Condition ofgroundfish resources of the Gulf of Alaska in 1988.U.S. Dep. Commer., NOAA Tech. Memo. NMFS F/NWC-165, p.243-273. Alaska Fish. Sci. Cent., Natl. Mar. Fish.Serv., NOAA, 7600 Sand Point Way NE, Bin C15700,Seattle, WA 98115-0070.
Sigler, M. F. 1993. Stock assessment and management ofsablefish Anoplopoma fimbria in the Gulf of Alaska.Doctoral dissertation, University of Washington,Seattle, 205 p.

14
Sigler, M. F., and J. T. Fujioka. 1988. Evaluation ofvariability in sablefish, Anoplopoma fimbria, abundanceindices in the Gulf of Alaska using the bootstrapmethod. Fish. Bull., U.S. 86:445-452.
Sigler, M. F., and H. H. Zenger, Jr. 1989. Assessment ofGulf of Alaska sablefish and other groundfish based onthe domestic longline survey, 1987. U.S. Dep. Commer.,NOAA Tech. Memo. NMFS F/NWC-169, 54 p. Alaska Fish.Sci. Cent., Natl. Mar. Fish. Serv., NOAA, Auke Bay Lab.,11305 Glacier Hwy., Juneau, AK 99801-8626.
Yoshimura, T., and T. Sasaki. 1989. Preliminary report onJapan-U.S. joint longline survey by the Tomi maru no. 88in 1988. Unpubl. manuscr., 19 p. (Document submittedto the annual meeting of the International North PacificFisheries Commission, Seattle, Washington, 1989
October.) Fisheries Agency of Japan, Far Seas FisheriesResearch Laboratory, 5-7-l Orido, Shimizu, Shizuoka,
Japan 424.
Zenger, H. H., Jr. 1992. A comparison of the catch rates ofsablefish between the domestic and cooperative longlinesurveys. Unpubl. manuscr., 30 p. Available AlaskaFish. Sci. Cent., NMFS, NOAA, 7600 Sand Point Way NE,Bin C15700, Seattle, WA 98115-0070.
Zenger, H. H., Jr., M. F. Sigler, and E. R. Varosi. 1994.Assessment of Gulf of Alaska sablefish and other
groundfish species based on the 1988 National MarineFisheries Service longline survey. U.S. Dep. Commer.,
NOAA Tech. Memo. NMFS-AFSC-39, 55 p.

TABLES

THIS PAGE INTENTIONALLY LEFT BLANK
17
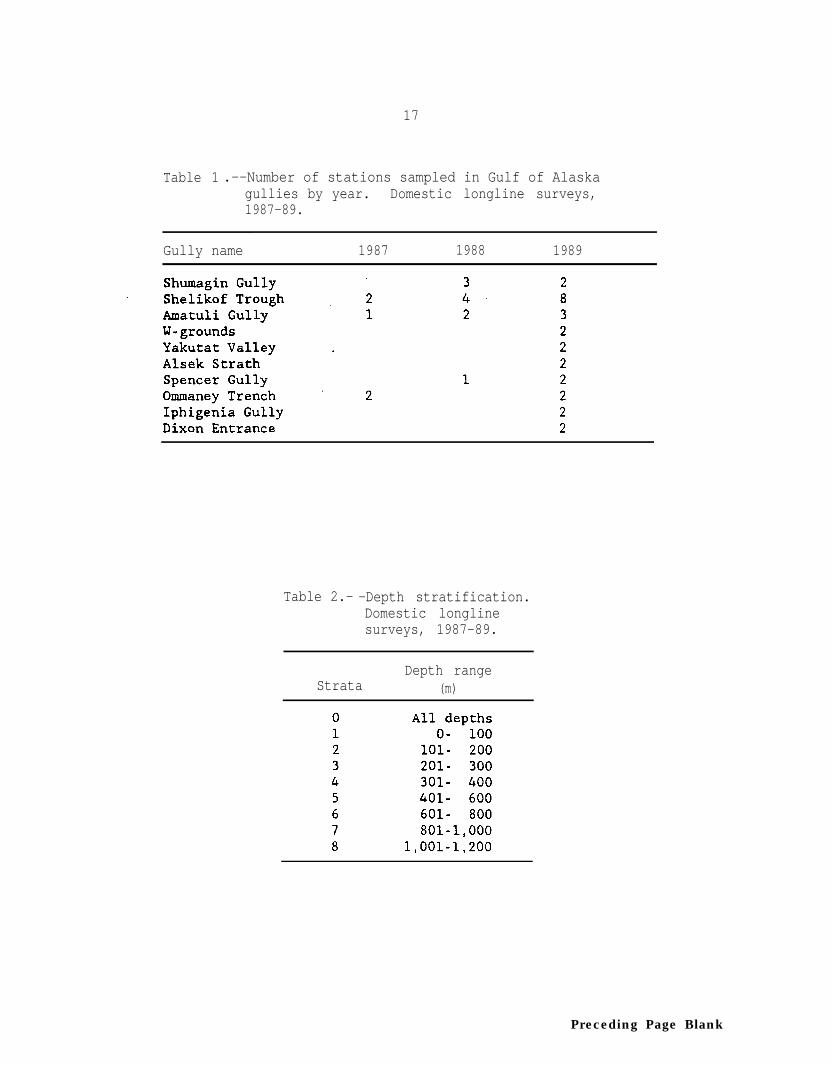
Table 1 .--Number of stations sampled in Gulf of Alaskagullies by year. Domestic longline surveys,1987-89.
Gully name 1987 1988 1989
Table 2.- -Depth stratification.Domestic longlinesurveys, 1987-89.
Depth rangeStrata (m)
Preceding Page Blank

18
Table 3 .--Area (km2) of the Gulf of Alaska for depths 201-1,000 m.
Area is listed by International North Pacific FisheriesCommission area for the upper continental slope and by gullyfor the gully areas.
Sampledsite
Area (km2)
Depth: 201- 301- 401- 601- 801- 201-(m) 300 400 600 800 1,000 1,000
Upper continental slope
Gullies
Sources: E. Brown, Alaska Fisheries Science Center, RACE Division, Seattle, WA, pers. commun.,1985; R. Haight, Alaska Fisheries Science Center, Auke Bay Laboratory, pers. commun., 1986.
Discrepancies in totals are due to rounding.

19
Table 4 .--Relative population number (RPN) for sablefish by InternationalNorth Pacific Fisheries Commission area for the uppercontinental slope and by gully for gully areas. Gulf of Alaska(GOA) total is the combined RPN for areas sampled in both 1988and 1989. Gully total is the combined RPN for gullies sampledin both 1988 and 1989. Domestic longline surveys, 1988 and1989.
Depth(m) Year RPN
Upper continental slope
Shumagin Chirikof Kodiak Yakutat Southeastern Total
Gullies
Shumagin Shelikof Amatuli Yakutat AlsekGully Trough Gully W-Ground Valley Strath

20
Table 4.--Continued.
Spencer Ommaney Iphigenia Dixon Gully GOAGully Trench Gully Entrance total total
Discrepancies in totals are due to rounding.

21
Table 5 .-&Relative population weight (RPW) for sablefish by InternationalNorth Pacific Fisheries Commission area for the uppercontinental slope and by gully for gully areas. Gulf of Alaska(GOA) total is the combined RPW for areas sampled in both 1988and 1989. Gully total is the combined RPW for gullies sampledin both 1988 and 1989. Domestic longline surveys, 1988 and1989.
Depth(m) -Year RPW
Upper continental slope
Shumagin Chirikof Kodiak Yakutat Southeastern Total
Gullies
Shumagin Shelikof Amatuli Yakutat Alsek‘Gully Trough Gully W-Ground Valley Strath

22
Table 5 .--Continued.
Spencer Ommaney Iphigenia Dixon Gully GOAGully Trench Gully Entrance total total
Discrepancies in totals are due to rounding.
23
Table 6 .--Relative population number (RPN) for rougheye and shortrakerrockfish by International North Pacific Fisheries Commissionarea for the upper continental slope and by gully for gullyareas. Gulf of Alaska (GOA) total is the combined RPN forareas sampled in both 1988 and 1989. Gully total is thecombined RPN for gullies sampled in both 1988 and 1989.Domestic longline surveys, 1988 and 1989.
Depth(m) Year RPN
Upper continental slope
Shumagin Chirikof Kodiak Yakutat Southeastern Total
Gullies
Shumagin Shelikof Amatuli Yakutat AlsekGully Trough Gully W-Ground Valley Strath

24
Table 6 .--Continued.
Spencer Ommaney Iphigenia Dixon Gully GOAGully Trench Gully Entrance total total
Discrepancies in totals are due to rounding.

25
Table 7 .--Relative population weight (RPW) forrougheye and shortraker rockfish byInternational North Pacific FisheriesCommission area for the uppercontinental slope and by gully forgully areas. Gulf of Alaska (GOA)total is the combined RPW for areassampled in both 1988 and 1989. Gullytotal is the combined RPW for gulliessampled in both 1988 and 1989.Domestic longline surveys, 1988 and1989.
RPW
Rougheye Shortraker
1988 1989 1988 1989
Upper continental slope
Gullies

26
Table 8 .--Relative population number (RPN) for thornyheads byInternational North Pacific Fisheries Commission area for theupper continental slope and by gully for gully areas. Gulf ofAlaska (GOA) total is the combined RPN for areas sampled inboth 1988 and 1989. Gully total is the combined RPN forgullies sampled in both 1988 and 1989. Domestic longlinesurveys, 1988 and 1989.
Depth(m) Year RPN
Upper continental slope
Shumagin Chirikof Kodiak Yakutat Southeastern Total
Gullies
Shumagin Shelikof Amatuli Yakutat AlsekGully Trough Gully W-Ground Valley Strath
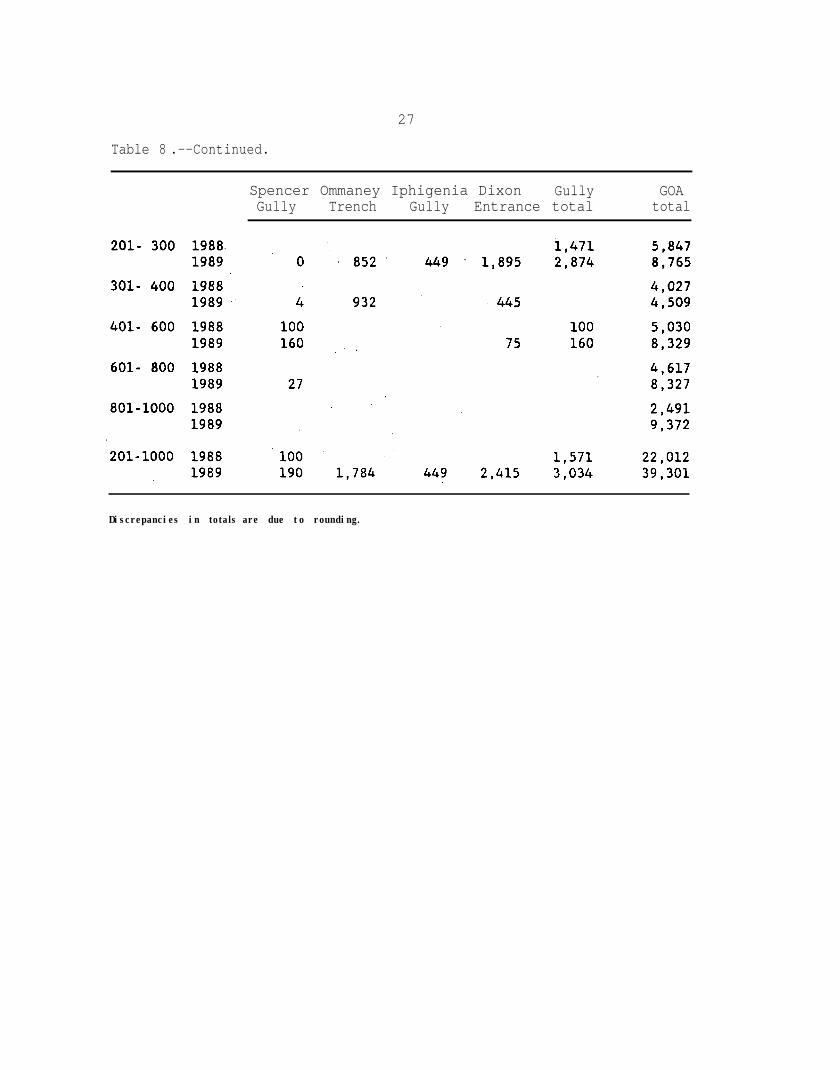
27
Table 8 .--Continued.
Spencer Ommaney Iphigenia Dixon Gully GOAGully Trench Gully Entrance total total
Discrepancies in totals are due to rounding.

28
Table 9 .--Relative population weight (RPW) forthornyheads by International North PacificFisheries Commission area for the uppercontinental slope and by gully for gullyareas. Gulf of Alaska (GOA) total is thecombined RPW for areas sampled in both 1988and 1989. Gully total is the combined RPWfor gullies sampled in both 1988 and 1989.Domestic longline surveys, 1988 and 1989.
Thornyhead RPW1988 1989
Upper continental slope
Gullies

29
Table 10 .--Relative population number (RPN) for grenadiers byInternational North Pacific Fisheries Commission area for theupper continental slope and by gully for gully areas. Gulf ofAlaska (GOA) total is the combined RPN for areas sampled inboth 1988 and 1989. Gully total is the combined RPN forgullies sampled in both 1988 and 1989. Domestic longlinesurveys, 1988 and 1989.
Depth(m) Year RPN
Upper continental slope
Shumagin Chirikof Kodiak Yakutat Southeastern Total
Gullies
Shumagin Shelikof Amatuli Yakutat AlsekGully Trough Gully W-Ground Valley Strath

30
Table 10 .--Continued.
Spencer Ommaney Iphigenia Dixon Gully GOAGully Trench Gully Entrance total total
Discrepancies in totals are due to rounding.

31
Table 11 .--Relative population number (RPN) for Pacific cod byInternational North Pacific Fisheries Commission area for theupper continental slope and by gully for gully areas. Gulf ofAlaska (GOA) total is the combined RPN for areas sampled inboth 1988 and 1989. Gully total is the combined RPN forgullies sampled in both 1988 and 1989. Domestic longlinesurveys, 1988 and 1989.
Depth(m) Year RPN
Upper continental slope
Shumagin Chirikof Kodiak Yakutat Southeastern Total
Gullies
Shumagin Shelikof Amatuli Yakutat AlsekGully T r o u g hGully W-Ground Valley Strath

32
Table 11 .--Continued.
Spencer Ommaney Iphigenia Dixon Gully GOAGully Trench Gully Entrance total total
Discrepancies in totals are due to rounding.

33
Table 12 .--Relative population number (RPN) for Pacific halibut byInternational North Pacific Fisheries Commission area for theupper continental slope and by gully for gully areas. Gulf ofAlaska (GOA) total is the combined RPN for areas sampled inboth 1988 and 1989. Gully total is the combined RPN forgullies sampled in both 1988 and 1989. Domestic longlinesurveys, 1988 and 1989.
Depth(m) Year RPN
Upper continental slope
Shumagin Chirikof Kodiak Yakutat Southeastern Total
Gullies
Shumagin Shelikof Amatuli Yakutat AlsekGully Trough Gully W-Ground Valley Strath
34
Table 12 .--Continued.
Spencer Ommaney Iphigenia Dixon Gully GOAGully Trench Gully Entrance total total
Discrepancies in totals are due to rounding.

35
Table 13 .--Relative population number (RPN) for arrowtooth flounder byInternational North Pacific Fisheries Commission area for theupper continental slope and by gully for gully areas. Gulf ofAlaska (GOA) total is the combined RPN for areas sampled inboth 1988 and 1989. Gully total is the combined RPN forgullies sampled in both 1988 and 1989. Domestic longlinesurveys, 1988 and 1989.
Depth(m) Year RPN
Upper continental slope
Shumagin Chirikof Kodiak Yakutat Southeastern Total
Gullies
Shumagin Shelikof Amatuli Yakutat AlsekGully Trough Gully W-Ground Valley Strath

36
Table 13 .--Continued.
Spencer Ommaney Iphigenia Dixon Gully GOAGully Trench Gully Entrance total total
Discrepancies in totals are due to rounding.

37
Table 14 .--Relative population number (RPN) for skates by InternationalNorth Pacific Fisheries Commission area for the uppercontinental slope and by gully for gully areas. Gulf ofAlaska (GOA) total is the combined RPN for areas sampled inboth 1988 and 1989. Gully total is the combined RPN forgullies sampled in both 1988 and 1989. Domestic longlinesurveys, 1988 and 1989.
Depth(m) Year RPN
Upper continental slope
Shumagin Chirikof Kodiak Yakutat Southeastern Total
Gullies
Shumagin Shelikof Amatuli Yakutat AlsekGully Trough Gully W-Ground Valley Strath

38
Table 14 .--Continued.
Spencer Ommaney Iphigenia Dixon Gully GOAGully Trench Gully Entrance total total
Discrepancies in totals are due to rounding.

39
Table 15.- -Numbers of each species caught during the 1989 domesticlongline survey that are not discussed in the text.
Common name Scientific name Number caught

40
Table 16 .--Sablefish commercial fishing seasonstart and end dates, 1988-1989, in theGulf of Alaska for the Central andWestern North Pacific FisheryManagement Council (NPFMC) managementareas" and survey dates.
SurveyYear Area Fishery Dates dates
aRon Berg, National Marine Fisheries Service, Alaska RegionalOffice, P.O. Box 21668, Juneau, AK 99802. Pers. commun., July 1990.

F I G U R E S

THIS PAGE INTENTIONALLY LEFT BLANK

Figure 1 .--Station locations for the 1989 NMFS longline survey of the Gulf of Alaska and boundaries ofInternational North Pacific Fisheries Commission statistical arcas.

44
Figure 2a. - -Sablefish length frequencies weighted by relative population number,by sex, for the International North Pacific Fisheries CommissionShumagin statistical area, upper continental slope, sampled duringNational Marine Fisheries Service longline surveys of the Gulf ofAlaska, 1988 (--) and 1989 (-).

45
Figure 2b.--Sablefish length frequencies weighted by relative population number,by sex, for the International North Pacific Fisheries CommissionChirikof statistical area, upper continental slope, sampled during
‘National Marine Fisheries Service longline surveys of the Gulf ofAlaska, 1988 (--) and 1989 (-).

46
Figure 2c. - -Sablefish length frequencies weighted by relative population number,by sex, for the International North Pacific Fisheries CommissionKodiak statistical area, upper continental slope, sampled duringNational Marine Fisheries Service longline surveys of the Gulf ofAlaska, 1988 (--) and 1989 (-).

47
Figure 2d.--Sablefish length frequencies weighted by relative population number,by sex, for the International North Pacific Fisheries CommissionYakutat statistical area, upper continental slope, sampled duringNational Marine Fisheries Service longline surveys of the Gulf ofAlaska, l988 (-- ) and 1989 (- ) .

48
Figure 2e.--Sablefish length frequencies weighted by relative population number,by sex, for the International North Pacific Fisheries CommissionSoutheastern statistical area, upper continental slope, sampledduring National Marine Fisheries Service longline surveys of theGulf of Alaska, 1988 (--) and 1989 (-).

49
Figure 2f . - - Sablefish length frequencies weighted by relative populationnumber, by sex, for the upper continental slope of the combinedareas sampled during National Marine Fisheries Service longlinesurveys of the Gulf of Alaska, 1988 (--) and 1989 (-).
50
Figure 2g. -- Sablefish length frequencies weighted by relative population number,by sex, for Shumagin Gully, sampled during National Marine FisheriesService longline surveys of the Gulf of Alaska, 1988 (--) and 1989 (-).

51
Figure 2h. --Sablefish length, frequencies weighted by relative population number,by sex, for Shelikof Trough, sampled during National Marine FisheriesService longline surveys of the Gulf of Alaska, 1988 (--) and 1989 (-).

52
Figure 2i.--Sablefish length frequencies weighted by relative population number,by sex, for Amatuli Gully, sampled during National Marine FisheriesService longline surveys of the Gulf of Alaska, 1988 (--) and1989 ( - ) .

53
Figure 2j.--Sablefish length frequencies weighted by relative population number,by sex, for Spencer Gully, sampled during National Marine FisheriesService longline surveys of the Gulf of Alaska, 1988 (--) and 1989 (-),Depth interval 401-600 m, only.
54
Figure 2k. --Sablefish length frequencies weighted by relative populationnumber, by sex, for the combined areas sampled during NationalMarine Fisheries Service longline surveys of the Gulf of Alaska,1988 (--) and 1989 (-). Note: In 1988, sample included theupper continental slope, Shumagin Gully, Shelikof Trough, AmatuliGully, and Spencer Gully; in 1989, sample included the above plusW-grounds, Yakutat Valley, Alsek Strath. Ommaney Trench,Iphigenia Gully, and Dixon Entrance.

55
Figure 3a.--Sablefish length frequencies weighted by catch per unit effort (CPUE),
by sex, for depths 101-200 m in the International North Pacific
Fisheries Commission Shumagin statistical area, sampled along the
outer continental shelf during National Marine Fisheries Service
longline surveys of the Gulf of Alaska, 1988 (--) and 1989 (-).

56
Figure 3b.--Sablefish length frequencies weighted by catch per unit effort (CPUE),
by sex, for depths 101-200 m in the International North Pacific
Fisheries Commission Chirikof statistical area, sampled along the
outer continental shelf during National Marine Fisheries Service
longline surveys of the Gulf of Alaska, 1988 (--) and 1989 (-).

57
Figure 3c.--Sablefish length frequencies weighted by catch per unit effort (CPUE),
by sex, for depths 101-200 m in the International North Pacific
Fisheries Commission Kodiak statistical area, sampled along the outer
continental shelf during National Marine Fisheries Service longline
surveys of the Gulf of Alaska, 1988 (--) and 1989 (-).

58
Figure 3d.--Sablefish length frequencies weighted by catch per unit effort (CPUE),
by sex, for depths 101-200 m in the International North Pacific
Fisheries Commission Yakutat statistical area, sampled along the
outer continental shelf during National Marine Fisheries Service
longline surveys of the Gulf of Alaska, 1988 (--) and 1989 ( -).

59
Figure 3e.--Sablefish length frequencies weighted by catch per unit effort (CPUE),
by sex, for depths 101-200 m in the International North Pacific
Fisheries Commission Southeastern statistical area, sampled along the
outer continental shelf during National Marine Fisheries Service
longline surveys of the Gulf of Alaska, 1988 (--) and 1989 (-).
60
Figure 3f.--Sablefish length frequencies weighted by catch per unit effort (CPUE),
by sex, for depths 101-200 m in Shumagin Gully, sampled during
National Marine Fisheries Service longline surveys of the Gulf of Alaska,
1 9 8 8 ( - - ) a n d 1 9 8 9 ( - ) .

61
3g.--Sablefish length frequencies weighted by catch per unit effort (CPUE),
by sex, for depths 101-200 m in Shelikof Trough, sampled during
National Marine Fisheries Service longline surveys of the Gulf of
Alaska, 1988 (-- ) and 1989 (- ) .

62
Figure 3h.--Sablefish length frequencies weighted by catch per unit effort (CPUE),
by sex, for depths 101-200 m in Amatuli Gully, sampled during
National Marine Fisheries Service longline surveys of the Gulf of
Alaska, 1988 (-- ) and 1989 (- ) .

63
Figure 3i. -- Sablefish length frequencies weighted by catch per unit effort (CPUE),
by sex, for depths 101-200 m on the W-grounds, sampled during the
1989 National Marine Fisheries Service longline survey of the Gulf of
Alaska.

64
Figure 4.--Length-at-age distribution of sablefish for the upper continental slope of theGulf of Alaska (201- 1,000 m depth), based on samples collected during the 1984Japan-U.S. cooperative longline survey. “n” refers to the number of fish aged.(Ages determined by the “break-and-burn” method, a technique that is beingreevaluated. Thus changes in the above ages may result. From Clausen andSigler 1989).

65
Figure 5.--Rougheye rockfish length frequencies weighted by relativepopulation number, for the combined areas sampled during
National Marine Fisheries Service longline surveys of the Gulf of
A laska , 1988 ( - - ) and 1989 ( -). Note: In 1988, sample
included the upper continental slope, Shumagin Gully, Shelikof
Trough, Amatuli Gully, and Spencer Gully; in 1989, sample
included the above plus W-grounds, Yakutat Valley, AlsekStrath. Ommany Trench, Iphigenia Gully, and Dixon Entrance.

66
Figure 6a.--Shortraker rockfish length frequencies weighted by relative
population number, for the combined areas sampled during
National Marine Fisheries Service longline surveys of the Gulf of
Alaska, 1988 (--) and 1989 (-). Note: In 1988, sampleincluded upper continental slope, Shumagin Gully, Shelikof
Trough, Amatuli Gully, and Spencer Gully; in 1989, sampleincluded the above plus W-grounds, Yakutat Valley, Alsek Strath,Ommaney Trench, Iphigenia Gully, and Dixon Entrance.

67
Figure 6b.--Shortraker rockfish length frequencies weighted by relativepopulation number for the International North Pacific FisheriesCommission Shumagin and Chirikof statistical areas, sampledduring National Marine Fisheries Service longline surveys of theGulf of Alaska, 1988 (-- ) and 1989 (- ) .
6 8
Figure 7.--Thornyhead rockfish length frequencies weighted by relative
population number, for the combined areas sampled during
National Marine Fisheries Service longline surveys of the Gulf
of Alaska, 1988 (--) and 1989 ( -). Note: In 1988, sampleincluded the upper continental slope, Shumagin Gully,
Shelikof Trough, Amatuli Gully, and Spencer Gully; in 1989,sample included the above plus W-grounds, Yakutat Valley
Alsek Strath, Ommaney Trench, Iphigenia Gully, and DixonEntrance.

69
Figure 8.--Giant grenadier length frequencies weighted by relativepopulation number, for the combined areas sampled during
National Marine Fisheries Service longline surveys of the Gulfof Alaska, 1988 (-- ) and 1989 (- ) .

70
Figure 9.--Popeye grenadier percent length frequencies for the combinedareas sampled during National Marine Fisheries Service longline
surveys of the Gulf of Alaska, 1988 (--) and 1989 (-).
71
Figure l0a.--Pacific cod length frequencies weighted by relative population
number, by sex, for the combined areas sampled during NationalMarine Fisheries Service longline surveys of the Gulf of Alaska,
1 9 8 8 ( - - ) a n d 1 9 8 9 ( - ). Note: In 1988, sample included theupper continental slope, Shumagin Gully, Shelikof Trough, AmatuliGully, and Spencer Gully; in 1989, sample included the above plusW-grounds, Yakutat Valley, Alsek Strath, Ommaney Trench,
Iphigenia Gully, and Dixon Entrance.

72
Figure 10b. --Pacific cod length frequencies weighted by relative population
number, by sex, for Shelikof Trough, sampled during NationalMarine Fisheries Service longline surveys of the Gulf of Alaska,
1 9 8 8 ( - - ) a n d 1 9 8 9 ( - ) .

73
Figure 1 la.--Arrowtooth flounder length frequencies weighted by relativepopulation number, for the combined areas sampled during
National Marine Fisheries Service longline surveys of the Gulfo f A laska , 1988 ( - - ) and 1989 ( - ). Note: In 1988. sample
included the upper continental slope, Shumagin Gully. ShelikofTrough, Amatuli Gully, and Spencer Gully; in 1989, sample
included the above plus W-grounds, Yakutat Valley, Alsek
Strath, Ommaney Trench, Iphigenia Gully, and Dixon Entrance.
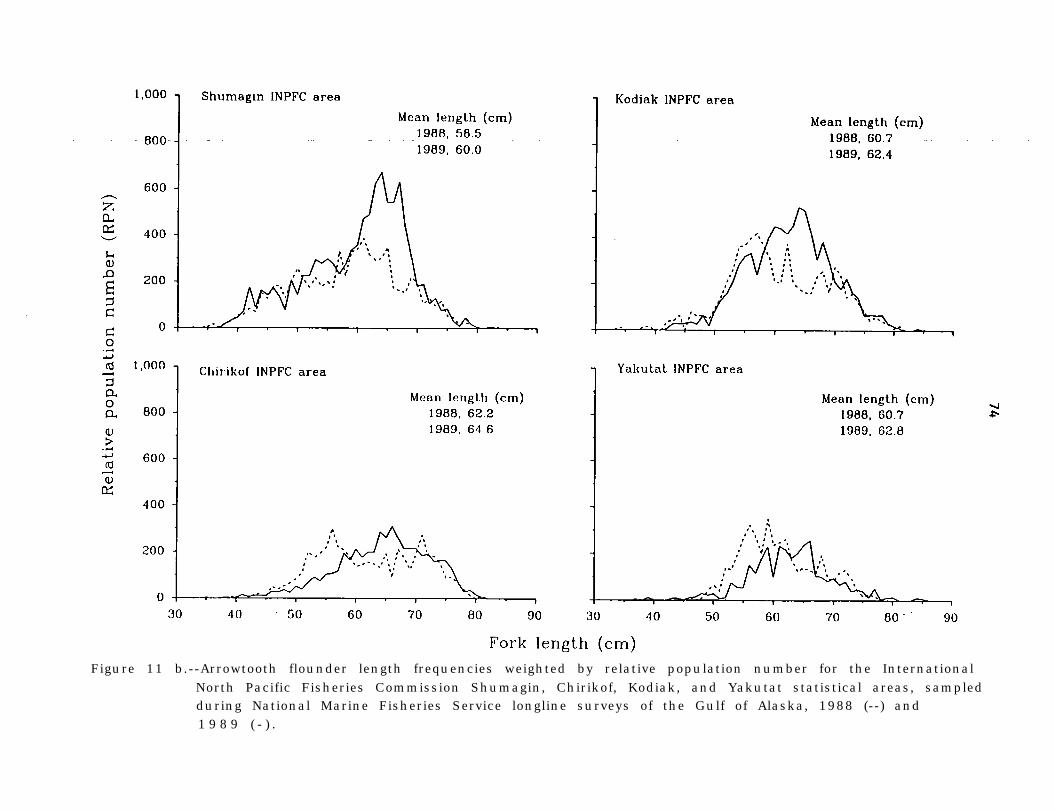
Figure 11 b.--Arrowtooth flounder length frequencies weighted by relative population number for the InternationalNorth Pacific Fisheries Commission Shumagin, Chirikof, Kodiak, and Yakutat statistical areas, sampledduring National Marine Fisheries Service longline surveys of the Gulf of Alaska, 1988 (--) and1 9 8 9 ( - ) .

75
Figure 1lc.--Arrowtooth flounder length frequencies weighted by relativepopulation number for Shelikof Trough and Amatuli Gully,sampled during National Marine Fisheries Service longline surveysof the Gulf of Alaska, 1988 (--) and 1989 (-).

76
Figure 12.--Distribution of giant grenadier catch per unit effort (fish/skate) from NationalMarine Fisheries Service longline surveys of the Gulf of Alaska, 1988-89,smoothed by distance-weighted least squares with depth stratum and stationnumber. Depth strata: 3 = 201-300 m; 4 = 301-400 m; 5 = 401-600 m;6 = 601-800 m; and 7 = 801-1,000 m.

77
Figure 13.--Distribution of sablefish catch per unit effort (fish/skate) from National MarineFisheries Service longline surveys of the Gulf of Alaska, 1988-89, smoothed bydistance-weighted least squares with depth stratum and station number. Depthstrata: 3 = 201-300 m; 4 = 301-400 m; 5 = 401-600 m; 6 = 601-800 m; and7 = 801-1,000 m.
78
Figure 14.--Distribution of thornyhead catch per unit effort (fish/skate) from National MarineFisheries Service longline surveys of the Gulf of Alaska, 1988-89, smoothed bydistance-weighted least squares with depth stratum and station number. Depthstrata: 3 = 201-300 m; 4 = 301-400 m; 5 = 401-600 m; 6 = 601-800 m; and7 = 801-1,000 m.

79
Figure 15.--Distribution of combined shortraker and rougheye rockfish catch per unit effort(fish/skate) from National Marine Fisheries Service longline surveys of the Gulf
of Alaska, 1988-89, smoothed by distance-weighted least squares with depthstratum and station number. Depth strata: 3 = 201-300 m; 4 = 301-400 m;5 = 401-600 m; 6 = 601-800 m; and 7 = 801-1,000 m.

RECENT TECHNICAL MEMORANDUMS
Copies of this and other NOAA Technical Memorandums are available from theNational Technical Information Service, 5285 Port Royal Road, Springfield, VA 22167(web site: www.ntis.gov). Paper and microfiche copies vary in price.
AFSC-
39 ZENGER, H. H., Jr., M. F. SIGLER, and E. R. VAROSI. 1994. Assessment of Gulf of Alaska sablefishand other groundfish species based on the 1988 National Marine Fisheries Service longline survey, 79p. NTIS No. PB94-204872.
38 LOWRY, L. F., K. J. FROST, R. DAVIS, R. S. SUYDAM, and D. P. DEMASTER. Movements and
behavior of satellite-tagged spotted seals (Phoca largha) in the Bering and Chukchi Seas, 71 p. NTIS No.PB94-180684.
37 BUCKLEY, T. W., and P. A. LIVINGSTON. 1994. A bioenergetics model of walleye pollock (Theragrachalcogramma) in the eastern Bering Sea: Structure and documentation, 55 p. NTIS No. PB94-181831.
36 YANG, M-S., and P. A. LIVINGSTON. 1994. Variations in mean stomach content weights of walleyepollock, Theragra chalcogramma, in the eastern Bering Sea, 32 p. NTIS No. PB94-178084.
35 PARKS, N. B., and F. R. SHAW. 1994. Relative abundance and size composition of sablefish(Anoplopoma fimbria) in the coastal waters of California and Southern Oregon, 1984-1991. NTISnumber pending.
34 SAMPLE, T. M., and D. G. NICHOL. 1994. Results of the 1990 U.S.-U.S.S.R. cooperative bottomtrawl survey of the eastern and northwestern Bering Sea continental shelf, 183 p. NTIS No. PB94-181849.
33 WEINBERG, K. L., M. E. WILKINS, R. R. LAUTH, and P. A. RAYMORE, JR. 1994. The 1989Pacific west coast bottom trawl survey of groundfish resources: Estimates of distribution, abundance, andlength and age composition, 168 p. plus Appendices. NTIS No. PB94-173796.
32 PEREZ, M. A. 1994. Calorimetry measurements of energy value of some Alaskan fishes andsquids, 32 p. NTIS No. PB94-152907.
31 RONHOLT. L. L., K. TESHIMA, and W. D. KESSLER. 1994. The groundfish resources of theAleutian Islands region and southern Bering Sea 1980, 1983, and 1986, 351 p. NTIS No. PB94-152915
30 LORENZ, J. M. 1994. Distribution and habitat of adult salmon in the Situk River, Alaska: Potentialimpacts of flooding from Russell Fiord, 27 p. NTIS No. PB94-151859.
29 IGNELL, S. E., L. J. SIMON, and M. L. DAHLBERG. 1994. Estimation of salmonid bycatch in the1989 Japanese squid driftnet fishery, 45 p. NTIS No. PB94-152105.
28 MORTENSEN, D. G., and H. SAVIKKO. 1993. Effects of water temperature on growth of juvenilepink salmon (Oncorhynchus gorbuscha), 12 p. NTIS No. PB94-145349.
27 LOW, L-L. (coordinator). 1994. Status of living marine resources off Alaska, 1993, 110 p. NTIS No.PB94-149846.
26 LOW, L-L. (coordinator). 1993. Status of living marine resources off the Pacific coast of the UnitedStates for 1993, 90 p. NTIS No. PB94-133733.
25 KINOSHITA, R. K., A. GREIG, J. D. HASTIE, and J. M. TERRY. 1993. Economic status of thegroundfish fisheries off Alaska, 1992, 102 p. PB94-142759.