Microelettrovalvola per Bioprinting - unipv · Biomedical Engineering Università degli Studi di...
17
Microelettrovalvola per Bioprinting: prove e misure preliminari Candidato: Veronica Marafioti Docente tutore: Dott. Michele Conti Anno Accademico: 2014/2015 Laurea in Bioingegneria Università degli studi di Pavia
Transcript of Microelettrovalvola per Bioprinting - unipv · Biomedical Engineering Università degli Studi di...

Biomedical Engineering
Università degli Studi di Pavia - Structural Mechanics Department
Microelettrovalvola per Bioprinting: prove e misure preliminari
Candidato: Veronica Marafioti
Docente tutore: Dott. Michele Conti
Anno Accademico: 2014/2015
Laurea in Bioingegneria
Università degli studi di Pavia

Based on the three “B”:
Bioink:
Biopaper:
Bioprinter:
What is Bioprinting?
Bioprinting can be defined as the use of computer-aided transfer processes for
patterning and assembling living and non-living materials with a prescribed 2D or
3D organization in order to produce bio-engineered structures serving in
regenerative medicine, pharmacokinetic and basic cell biology studies. (International Conference about Bioprinting and Bio Manufacturing - Bordeaux 2009)

Bioprinting workflow

Bioprinters
NovoGen MMX 3D Bioplotter 3D Discovery
Not marketed $ 200000 $200000
$ 180000 £ 12000/18000 $ 10000 $ 5000/9000
BioScaffolder 2.1 Alpha and Omega BioBots Inkredible
Refs: https://replicatore.wordpress.com/2015/09/06/top-10-biostampanti-commerciali-2/
BioPrinting project – Lee’s bioplotter
Lee’s Bioplotter: modular tissue
printing platform
1. 4 syrynges as “cartridges” to
load cell suspensions and
hydrogel precursors
2. An array of 4-channel
dispensers
3. Target substrate
4. Horizontal stage
5. Vertical stage
6. Range finder
7. Vertical stage heater/cooler
8. Optional indipendent
heating/cooling for the
dispenser
BioPrinting project’s Goal:
Fig. Lee 2008, Multi-layered culture of human skin fibroblasts and keratinocytes through three-dimensional
freeform fabrication

BioPrinting project – Our approach
Develop a simple work plan, not
automated
Integrate the dispenser in a 3D
printer
printing proofs
(with cells)
Inspiring by Lee’s bioplotter, this is our purpose:

BioPrinting project
Global setup: the following material was necessary for the development of the
project
1. Acquisition of pressure signal whit 0Psi to 15Psi Gauge Honey-Well sensor, DAQ
National Instrument, computer
2. Acquisition of the piston position signal, to control the valve opening / closing
3. Air pressurization system
4. Control Box’s valve
5. Power supply
6. Microelectrovalve
6

Microelectrovalve - Features
Dolphin Fluidics’ DFD-Smart
Technical Data
Nozzle Diameter Ø 0.8 mm
Pressure Range 0 – 4.0 bar
Operating Temperature -10° C - +65° C
Current Range 150 mA – 240 mA
Response Time @ 0.6 W 180 ms
Holding Power 0.1 W
Implementation Power 0.4 – 0.6 W
Life-time Million of cycles
Control On/Off and Analogic
The DFD-Smart is a modular system with 2-way valves, total isolation, ideal for
controlling fluid flows at high hygienic nature and not be contaminated. Each valve can
be single, double or coupled in a fluidic block. Each channel can be controlled on-off or
proportional independently.

Microelectrovalve - Measurements
The purpose of the setup is to measure the performance of the first prototype
of the microelectrovalve DFD-Smart (Dolphin Fluidics) by drawing a graph
of the flow rate Q [ml/min] as a function of working pressure P [mmHg].
Steps of measurement process:
Pressure
signal P
[mmHg]
Valve
calibration
Voltage
Valve
opening time
T [s] Piston
position
signal
Dispensing
volume V [ml]
Plot of Flow
rate Q
[ml/min]
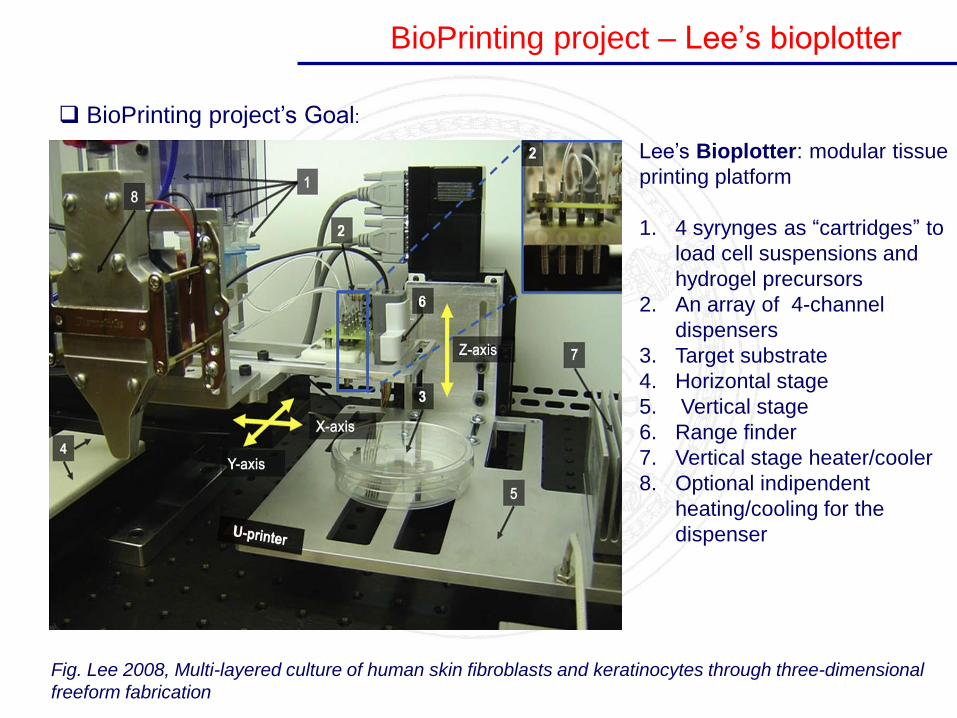
First setup - Results
Testing conditions:
Range pressure from 60 to 150 mmHg
Constant voltage of 3.3V (100% of the valve opening)
Conclusion:
1. Low accuracy and precision of the measurements
2. Leakage phenomenon for pressure under 150 mmHg
3. Channel 2 was clogged
y = 0,0611x + 0,2872 R² = 0,6687
3,00
4,00
5,00
6,00
7,00
8,00
9,00
10,00
50 70 90 110 130 150
Flo
w R
ate
[m
l/m
in]
Pressure [mmHg]
Channel 1
FlowRate [ml/min] VS Pressure [mmHg]
Lineare (FlowRate [ml/min] VS Pressure [mmHg])

Second setup - Results
Dolphin Fluidics
UniPV
@ P = 120 mmHg: plot of the Flow rate as a function of the valve opening
percentage
Conclusion:
1. The measures do not reproduce the sigmoid curve
2. Low repeatability
3. Both channels dispensed less than what we expected, because they were
clogged
0,0
5,0
10,0
15,0
20,0
25,0
30,0
35,0
10,0 20,0 30,0 40,0 50,0 60,0 70,0
Flo
w r
ate
[m
l/m
in]
% Opening
Channels’ characteristic
CH1
CH2
5,50
6,00
6,50
7,00
7,50
8,00
8,50
9,00
30,0 50,0 70,0 90,0 110,0
Flo
w r
ate
[m
l/m
in]
% Opening
CH1 flow rate [ml/min]
Misure 25/02/16
Misure 26/02/16 #1
Misure 26/02/16 #2

Third setup – Results (I)
0,0
5,0
10,0
15,0
20,0
25,0
95 105 115 125 135
Flo
w R
ate
[m
l/m
in]
Mean Pressure [mmHg]
Pressure Test
Channel 2 16/03/2016
Channel 1 16/03/2016
Channel 1 17/03/2016
Channel 2 17/03/2016
The flow rate was measured by pressurizing a 10 ml syringe, containing H2O
Conclusion:
1. Channel 1 presents more accuracy and repeatability than channel 2
2. Channel 2 dispensed less than channel 1
3. It’s often necessary to clean the channels
CH2 tends to clog easily
1 2
1. Microelectrovalve 2. Syringe
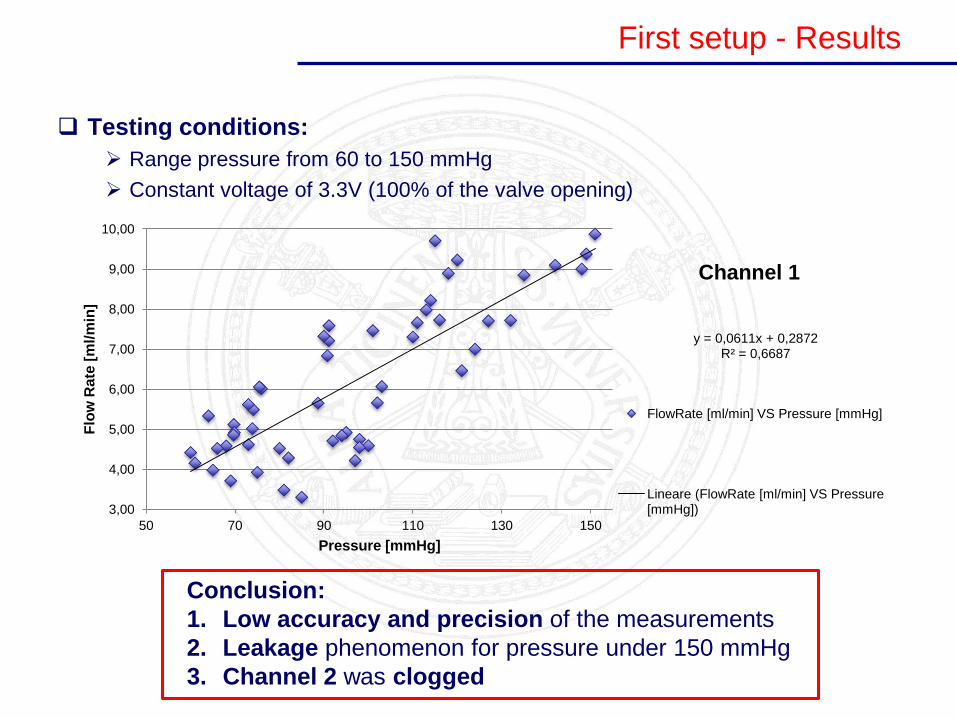
Third setup – Results (II)
Testing conditions for the characteristic of the channels:
Average working pressure: 120 mmHg
Valve opening time: 30 s
Variation of the voltage and of the valve opening percentage
Conclusion:
1. Both channels present a sigmoid curve
2. CH1 dispensed from 0.3V, while CH2 from 0.9V
3. CH1 dispensed more than CH2
0,0
2,0
4,0
6,0
8,0
10,0
12,0
14,0
16,0
18,0
0 0,2 0,4 0,6 0,8 1 1,2 1,4 1,6
Flo
w R
ate
[m
l/m
in]
Voltage[V]
CH2
CH1

Third setup – Results (III)
There is a real possibility of making printing tests
with silk-based solution
A step forward: the valve was tested with
glycerol solution to simulate silk hydrogel
Constant pressure of 120 mmHg
100% of the valve opening
Conclusion: 1. Flow rate decreases with increasing
viscosity
2. Channel 2 dispenses less than
channel 1
3. Both channels tend to become
clogged, so a frequently clean was
necessary
4. The valve is able to dispense up to
25 cP 0,0
5,0
10,0
15,0
20,0
25,0
30,0
35,0
0 10 20 30
Flo
w R
ate
[m
l/m
in]
Viscosity [cP]
Viscosity Test
Channel 2 18/03/2012
Channel 1 18/03/2016

Limitations and future developments
Improvements:
Digital control of the pressure
signal (constant pressure of 1 - 3
Psi)
Syringes washing system
New support for the syringes, to
minimize the distance between
syringes and the valve
Automated control of the
dispensing
Ackn.: Mr. Pierangelo Bergamaschi
Limitations:
The accuracy decreases under
100 mmHg of pressure
Low precision beacuse of the
manual control of the dispensing
Channels tend to clog easily

GRAZIE PER L’ATTENZIONE