Microdevices for Realisation of Coaxial Sheath Flows
66
Technische Universit¨ at Wien DIPLOMARBEIT Microdevices for Realisation of Coaxial Sheath Flows Simulation, Fabrication and Characterisation Ausgef¨ uhrt als Student der Fakult¨ at Technische Physik am Institut f¨ ur Sensor- & Aktuatorsysteme der Fakult¨ at Elektrotechnik und Informationstechnik unter der Anleitung von Univ. Prof. Dipl.-Ing. Dr. techn. Michiel J. Vellekoop durch G¨ unter P¨ arr Brauhausstr. 3/2/2 2351-Wr.Neudorf AUSTRIA [email protected] Wien, im Mai 2007 Die approbierte Originalversion dieser Diplom-/Masterarbeit ist an der Hauptbibliothek der Technischen Universität Wien aufgestellt (http://www.ub.tuwien.ac.at). The approved original version of this diploma or master thesis is available at the main library of the Vienna University of Technology (http://www.ub.tuwien.ac.at/englweb/).
Transcript of Microdevices for Realisation of Coaxial Sheath Flows

Technische Universitat Wien
DIPLOMARBEIT
Microdevices for Realisation ofCoaxial Sheath Flows
Simulation, Fabrication and Characterisation
Ausgefuhrt als Student der FakultatTechnische Physik
am Institut fur
Sensor- & Aktuatorsystemeder Fakultat
Elektrotechnik und Informationstechnik
unter der Anleitung von
Univ. Prof. Dipl.-Ing.Dr. techn. Michiel J. Vellekoopdurch
Gunter Parr
Brauhausstr. 3/2/22351-Wr.Neudorf
AUSTRIA
Wien, im Mai 2007
Die approbierte Originalversion dieser Diplom-/Masterarbeit ist an der Hauptbibliothek der Technischen Universität Wien aufgestellt (http://www.ub.tuwien.ac.at). The approved original version of this diploma or master thesis is available at the main library of the Vienna University of Technology (http://www.ub.tuwien.ac.at/englweb/).

Abstract
This master thesis describes the development and design of microfluidic de-vices which use sheath flows to align and focus sample flows within a microchannel. The measurement of diluted particles (e.g. cells, molecules) in aMEMS device for analytical purposes for example in life science and biotech-nology makes it necessary to deal with detailed problems in microfluidics.Especially when it comes to single particle detection or manipulation it isimportant to ensure that the particles are passing the transducer area onlyone by one. This requires sharp focusing techniques.
One elegant solution is to use hydrodynamic focusing in combination withsheath flows like in the work of Jeroen H. Nieuwenhuis [1]. This techniqueis used for the devices described within this thesis.In the past various efforts have been made to characterize and describe fo-cusing abilities in micro channels, e.g. see ”Hydrodynamic Focusing in Mi-crochannels Under Consideration of Diffusive Dispersion: Theories and Ex-periments” [2] or the work of Gwo-Bin Lee in [3]. Some published conceptswere constructed in a quite complex way, requiring many fabrication steps asit can be seen in the research of Narayan Sundararajan in [4]. Beside this,in former articles little experimental information is given on how the shapeof the formed sample flow is influenced by the related parameters.
The contribution in this thesis deals with the design and simple realiza-tion of microfluidic devices for focusing and 3D-alignment of coaxial andnon-coaxial micro scale sample flows. The main design criteria is that thechannel sections are all larger than 50 ∗ 50 µm2 (to prevent e.g. cloggingeffects) together with the aim to minimize the coaxial sample diameter tomicrometer scale, which will allow to analyse very small particles. Withinthis thesis preliminary focusing limits for the tested coaxial devices could besuccessfully predicted and verified by experiments. They are in the range ofabout 2.5 ± 1 µm in the horizontal and 10 ± 2 µm in the vertical dimension.It was predicted through experiment that one of the designs will be ableto give limits down to almost 1µm in the horizontal dimension and as the
i

ii
work of my colleague Gabriel Hairer shows, this could be proved, too. Forthe experimental verification confocal laser microscope measurements wereused. This technique allowed to prove excellent correlation of the simulatedscenarios with the experimental data. It revealed detailed information onthe sample flow profile and its size.
The developed devices could be used for the investigations by Gabriel Hairerwhich were published in [5].

To my family

Acknowledgement
Always, when somebody wants to achieve a desired goal, curiosity and en-thusiasm comes up. But, there are also those moments on the long way tosuccess and glory that are not that bright. When everything seems to beconfusing and impossible, it is good in those moments to have a family youcan rely on, to have friends and people taking care and helping you out.Spending innumerable hours of empathy, work, mental support and after alllove helped me to reach my desired goal and is something I do not want toforget about them.Special thanks I am owing to the research group and the team of the ISASdepartment, especially to Univ. Prof. Michiel Vellekoop who supervised thework. Last but not least I want to thank Dipl. Ing. (FH) Gabriel Hairerwho was coaching me, offered me support on technical issues and gave mefeedback about my work and the thesis.
Vienna, May 2007
iv
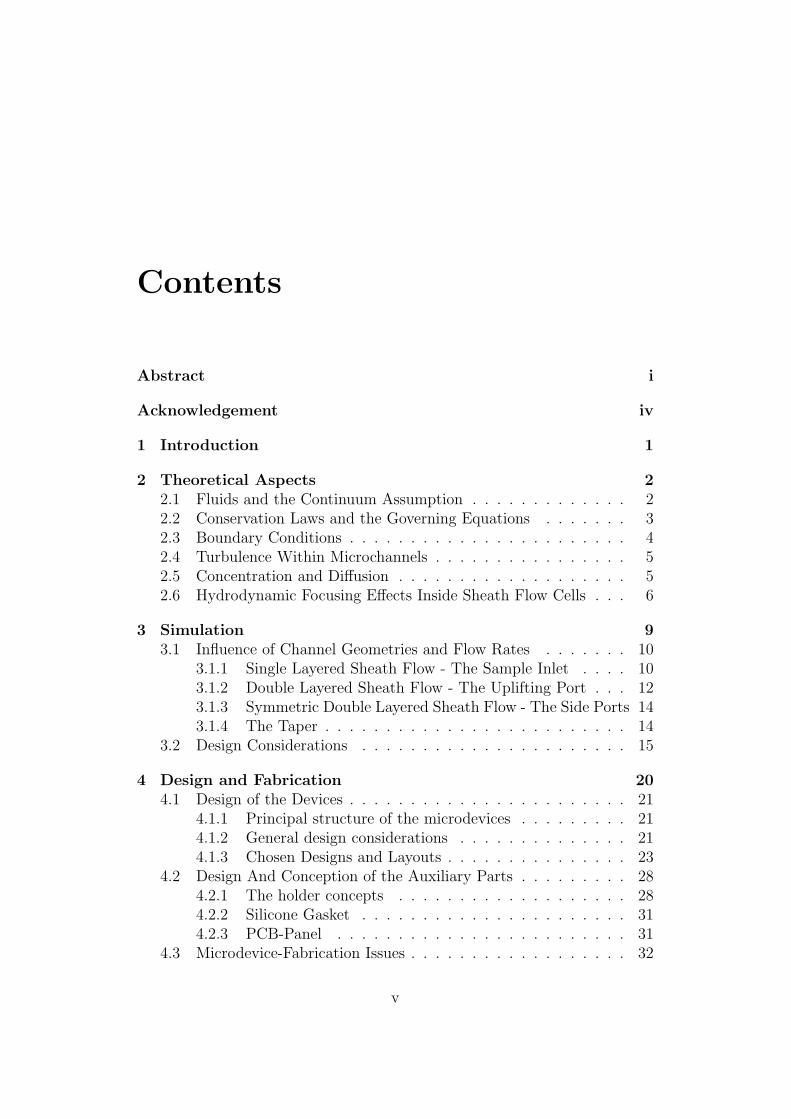
Contents
Abstract i
Acknowledgement iv
1 Introduction 1
2 Theoretical Aspects 2
2.1 Fluids and the Continuum Assumption . . . . . . . . . . . . . 22.2 Conservation Laws and the Governing Equations . . . . . . . 32.3 Boundary Conditions . . . . . . . . . . . . . . . . . . . . . . . 42.4 Turbulence Within Microchannels . . . . . . . . . . . . . . . . 52.5 Concentration and Diffusion . . . . . . . . . . . . . . . . . . . 52.6 Hydrodynamic Focusing Effects Inside Sheath Flow Cells . . . 6
3 Simulation 9
3.1 Influence of Channel Geometries and Flow Rates . . . . . . . 103.1.1 Single Layered Sheath Flow - The Sample Inlet . . . . 103.1.2 Double Layered Sheath Flow - The Uplifting Port . . . 123.1.3 Symmetric Double Layered Sheath Flow - The Side Ports 143.1.4 The Taper . . . . . . . . . . . . . . . . . . . . . . . . . 14
3.2 Design Considerations . . . . . . . . . . . . . . . . . . . . . . 15
4 Design and Fabrication 20
4.1 Design of the Devices . . . . . . . . . . . . . . . . . . . . . . . 214.1.1 Principal structure of the microdevices . . . . . . . . . 214.1.2 General design considerations . . . . . . . . . . . . . . 214.1.3 Chosen Designs and Layouts . . . . . . . . . . . . . . . 23
4.2 Design And Conception of the Auxiliary Parts . . . . . . . . . 284.2.1 The holder concepts . . . . . . . . . . . . . . . . . . . 284.2.2 Silicone Gasket . . . . . . . . . . . . . . . . . . . . . . 314.2.3 PCB-Panel . . . . . . . . . . . . . . . . . . . . . . . . 31
4.3 Microdevice-Fabrication Issues . . . . . . . . . . . . . . . . . . 32
v

CONTENTS vi
5 Experiment and Measurements 35
5.1 The Experimental Setup . . . . . . . . . . . . . . . . . . . . . 355.2 Measurement Methods . . . . . . . . . . . . . . . . . . . . . . 375.3 Measurement Results . . . . . . . . . . . . . . . . . . . . . . . 37
5.3.1 The Sample Inlet . . . . . . . . . . . . . . . . . . . . . 375.3.2 The Taper . . . . . . . . . . . . . . . . . . . . . . . . . 405.3.3 The Uplifting Port . . . . . . . . . . . . . . . . . . . . 415.3.4 The Side Ports . . . . . . . . . . . . . . . . . . . . . . 43
6 Conclusions 44
6.1 Discussion . . . . . . . . . . . . . . . . . . . . . . . . . . . . . 446.1.1 Accomplishments . . . . . . . . . . . . . . . . . . . . . 446.1.2 Unexpected facts . . . . . . . . . . . . . . . . . . . . . 456.1.3 Improvable aspects . . . . . . . . . . . . . . . . . . . . 46
6.2 Outlook . . . . . . . . . . . . . . . . . . . . . . . . . . . . . . 47
7 Appendix 48
7.1 Lithographic Masks . . . . . . . . . . . . . . . . . . . . . . . . 487.2 Technical Drawings . . . . . . . . . . . . . . . . . . . . . . . . 53
List of Figures 54
Bibliography 58
Chapter 1
Introduction
The research objective of this diploma thesis was to develop designs for hy-drodynamically focusing microfluidic devices and characterize them with therelated parameters. In addition to this the limiting factors to focus samplestreams in such devices had to be evaluated. The main design criterion wasto achieve small sample flows whereas the channels geometries are relativelylarge. The technological limits for fabrication and practical use with decreas-ing size of the device were of interest, too.
Before discussing details a brief outline about the content of this thesis isgiven here. To ensure a general insight into microfluidic sheath flow devicesand physical aspects in fluidics Chapter 2 explains the theoretical modelsand their background. Chapter 3 deals with the finite element simulationswhich were necessary to find the right parameters to achieve the desired per-formance of the devices. The issues about experimental setup and practicaldesign of the devices and their fabrication are discussed in Chapter 4. Chap-ter 5 is about the measurement techniques, the results of the experimentsand their interpretation. The thesis is concluded with Chapter 6 . A discus-sion about the results and problems is presented and an outlook on futureperspectives is given.
1

Chapter 2
Theoretical Aspects
The microdevices presented in this thesis use hydrodynamic principles toform sample fluids to a desired shape and to define their position inside amicrochannel. Developing and designing such devices require mathematicalmodels that enable to predict the behaviour of the fluids.Before details about the design of fluidic microdevices are discussed, a back-ground is given for the reader about the theoretical aspects. Beginning withthe definition of fluids and characterising their behaviour from a classical andmacroscopic point of view, limits are shown for the validity of these theoriesusing them at smaller scales. A detailed approach in analytical models isgiven in the publications by Zhigang Wu [2] and Gwo-Bin Lee [3]. A morephenomenological approach is given by James Knight in [6].
2.1 Fluids and the Continuum Assumption
Several definitions can be found on what a fluid is and how it behaves. Someare given in [7]. One of them, [8], gives here a good starting point for furtherconsiderations refering to smaller scales:
“A fluid is a substance that deforms continuously under the applicationof shear (tangential) stress, no matter how small that stress may be.”
It is well known that in any of the three states of matter (solid, liquid andgaseous) molecules and atoms are the elementary building blocks. Inter-molecular forces as they are described by the well known Lennard Jonespotential are responsible for their physical behaviour. To describe the phys-ical properties on the macroscopic scale good results are achieved with using
2

CHAPTER 2. THEORETICAL ASPECTS 3
models that are based on the continuum assumption (all quantities of inter-est are assumed to be defined everywhere in space and vary continuously).If the total number of particles gets small, for example if the density is low(in case of gases) or the observed volume is small (for example fluids withina micro- and nano-structure) then the continuum assumption is not validanymore to describe such a system. More sophisticated models have to beused that include the particle motion and the particle interaction itself. Theposition and velocity of every single molecule of particle ensemble, togetherwith the evolution of these parameters in time have to be considered, at leastin a statistical way. This makes such models extremely complex. To avoidunnecessary investigations a lower limit for the size of systems where the con-tinuum assumption is still valid has to be found. An approximation is givenin [7] where the authors suggest length scales for fluids of 10 nm as a limitfor the use of the continuum assumption. The microdevices presented in thiswork are systems with fluidic structures that are several times larger thanthe suggested limit. Therefore the continuum assumption can be assumedas acceptable. The table below allows the reader to develop a feeling for thephysical characteristics of a common liquid (taken from Table 2.3 in [7]):
Property Liquid H2O
Molecular diameter 0.3 nmNumber density 2 · 1028 m−3
Intermolecular spacing 0.4 nm
Table 2.1: Typical Properties of H2O
2.2 Conservation Laws and the Governing
Equations
Based on the continuum assumption three primary conservation laws can bedefined that are able to model thermofluid dynamic problems. Consideringflows that are incompressible, isotropic, Newtonian (see further below) andbelong to Fourier’s law of heat conduction (heat flow is directly proportionalto the temperature gradient), the conservation laws for mass, momentumand energy can be written as:
∂vi
∂xi
= 0 (2.1)

CHAPTER 2. THEORETICAL ASPECTS 4
ρ
(
∂vi
∂t+ vj
∂vi
∂xj
)
= ρFi −∂p
∂xi
+∂
∂xi
[
η
(
∂vi
∂xj
+∂vj
∂xi
)]
(2.2)
ρ cv
(
∂T
∂t+ vi
∂T
∂xi
)
=∂
∂xi
(
κ∂T
∂xi
)
(2.3)
Where vi represents the flow velocities, ρ is the local density, p the pressure,Fi the body force, η the dynamic viscosity and cv is the specific heat at aconstant volume. The repeated indices indicate a summation according tothe Einstein summation convention.As the introduction implies thermal influences are not of interest due tothe assumption of constant temperature conditions for the microdevices theequations can be further simplified to:
∂vi
∂xi
= 0 (2.4)
ρ
(
∂vi
∂t+ vj
∂vi
∂xj
)
= ρFi −∂p
∂xi
+ η∂2vi
∂x2
j
(2.5)
The limit for the validity of these equations is given by the Newtonian as-sumption. For Newtonian fluids is the shear stress directly proportional tostrain rate γ. This behaviour breakes down when the strain rate exceedsapproximately twice the molecular frequency τ :
γ =∂v
∂y≥
2
τ(2.6)
Therefore this defines the limit for the maximum shear stress γ and furtherthe maximum fluid velocity v inside microchannels.
2.3 Boundary Conditions
Obviously for solving the governing equations, initial and boundary condi-tions are required. For the length scales where the continuum assumptioncan be used, the boundary conditions are based on the argument that thevelocity of the fluid shows at any point in the system always finite gradients.This implies that the fluid velocity drops to zero when reaching walls.As the investigation about boundary conditions by P. A. Thompson [9]shows, the boundary conditions are valid until the shear rates get relativelyhigh. Already at 0.3 % of the limit for the shear stress, where Newtonianbehaviour breaks down, a deviation is noticeable.

CHAPTER 2. THEORETICAL ASPECTS 5
2.4 Turbulence Within Microchannels
For simple geometries the Reynolds number Re is useful to estimate thelaminar-turbulent transition for flow velocities:
Re =ρDh v
µ(2.7)
The dynamic viscosity is represented by µ. To compare fluid flows in channelsand pipes of different geometries it is necessary to use the so called hydraulicdiameter Dh. It represents an equivalent diameter for non-circular channelshapes, using the cross sectional area A and the wetted perimeter U as thefollowing:
Dh =4 A
U(2.8)
The transition velocity from laminar to turbulence flows depends on severalparameters (e.g aspect ratio and the surface roughness). In the range ofRe = 1000 - 2000, turbulences start to take place together with a deforma-tion of the parabolic flow profile within the channel. For the microchannelspresented in this thesis the Reynolds number is always far below 50. Ac-cording to this, the flow within the channels can be considered as strictlylaminar. For Reynolds numbers below Re = 1, the governing equations canbe further simplified to the Stokes equations. The use of these equationsresults in better finite element simulations (reduced computing time) and inallowing to simulate hydrodynamic models with higher complexity.
2.5 Concentration and Diffusion
In biotechnology the sample fluids are for example blood cells or bacteriain a buffer fluid and are in contact with other fluids. The miscibility andthe interaction (diffusion) of fluids are therefore of certain interest. For thedevices that were studied in this thesis, the sample fluid consists of dilutedfluorescent dye which gets manipulated and guided with sheath flows of purede-ionized water. The use of such a diluted dye single phase system as asurrogate for biological substances allows a tremendous simplification duringthe experiments (e. g. atoxic, durable and stable). Beside the hydrodynamicequations, the mathematical models for the concentration and diffusion arethe second group of equations that is required to describe the focusing effectswithin the sheath flow cells in the microdevices to full extend. Basically due
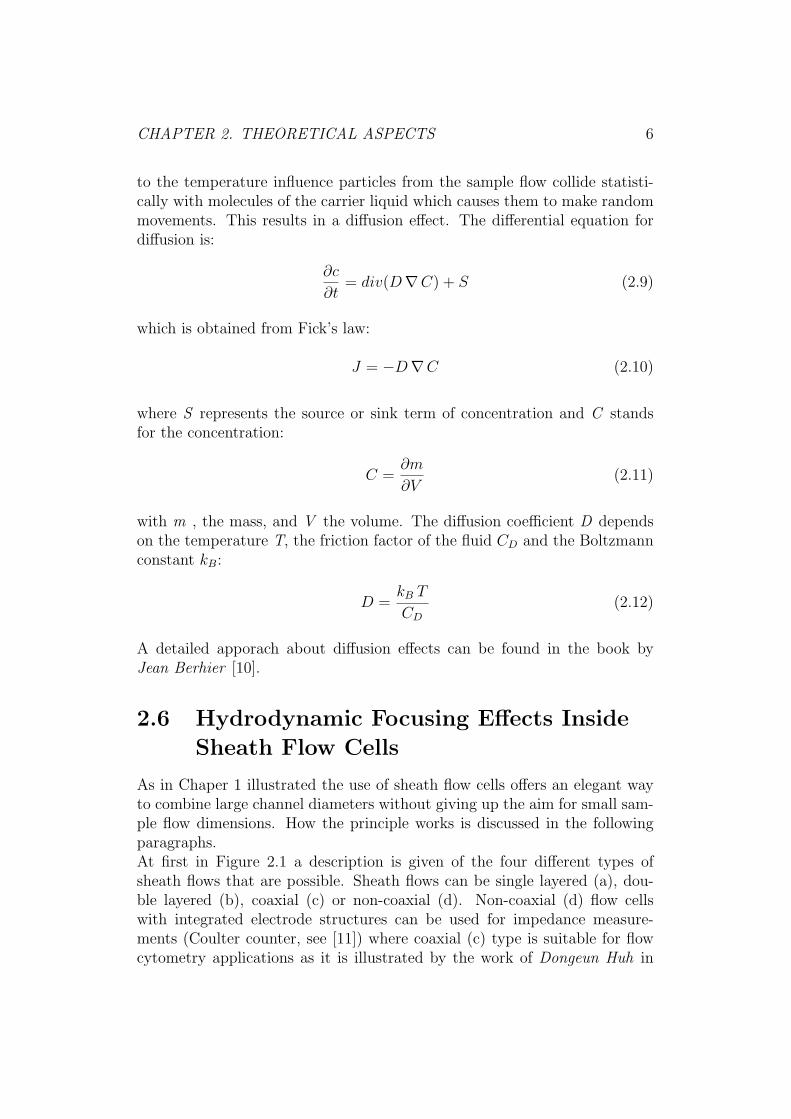
CHAPTER 2. THEORETICAL ASPECTS 6
to the temperature influence particles from the sample flow collide statisti-cally with molecules of the carrier liquid which causes them to make randommovements. This results in a diffusion effect. The differential equation fordiffusion is:
∂c
∂t= div(D∇C) + S (2.9)
which is obtained from Fick’s law:
J = −D∇C (2.10)
where S represents the source or sink term of concentration and C standsfor the concentration:
C =∂m
∂V(2.11)
with m , the mass, and V the volume. The diffusion coefficient D dependson the temperature T, the friction factor of the fluid CD and the Boltzmannconstant kB:
D =kB T
CD
(2.12)
A detailed apporach about diffusion effects can be found in the book byJean Berhier [10].
2.6 Hydrodynamic Focusing Effects Inside
Sheath Flow Cells
As in Chaper 1 illustrated the use of sheath flow cells offers an elegant wayto combine large channel diameters without giving up the aim for small sam-ple flow dimensions. How the principle works is discussed in the followingparagraphs.At first in Figure 2.1 a description is given of the four different types ofsheath flows that are possible. Sheath flows can be single layered (a), dou-ble layered (b), coaxial (c) or non-coaxial (d). Non-coaxial (d) flow cellswith integrated electrode structures can be used for impedance measure-ments (Coulter counter, see [11]) where coaxial (c) type is suitable for flowcytometry applications as it is illustrated by the work of Dongeun Huh in

CHAPTER 2. THEORETICAL ASPECTS 7
Sample liquid Sheath liquid
a b c d
Figure 2.1: Four different types of sheath flow: single layered (a), double layered(b), coaxial (c), non-coaxial (d)
[12] and Ren Yang in [13]. The aim of this thesis work is to find proper
Sampleinlet
Sheath inlet
Outlet
Focusing section
Horizontalcontrol
port
Figure 2.2: Concept for creating a non-coaxial sheath flow inside a microchanneland controlling the shape of the sample flow with the side ports.
coaxial and non-coaxial designs for sheath flow cells that are able to achievethe smallest possible sample flows within a microchannel of a certain dimen-sion. In principle the shape of the sample flow is formed when the flow passessections with inlets, so called ports, which are additional sources of carrierfluid. The relative pressure of the currents through the ports defines howstrong the influence is on the shape. For the sake of completeness one hasto mention that the use of a taper in the channel is an additional focusingtechnique that is used in our devices to achieve even better focusing results(see Chapter 3.1.4). All designs presented in this work are based on a cross-like structure as the non-coaxial device shown in Figure 2.2 (taken from [1]).For coaxial sheath flow cells the following principle was used. The sampleflow joins through an inlet in the bottom of the device the carrier fluid and

CHAPTER 2. THEORETICAL ASPECTS 8
a non-coaxial flow is created. After passing a taper another inlet in the bot-tom raises the sample flow and a coaxial flow is formed. In the last steptwo symmetric sheath flow inlets from the side focus the sample flow to evensmaller dimensions. In addition to the influence on the shape, the positionof the coaxial flow can be controlled by the pressures and flow velocities ofthe ports, too.
Chapter 3
Simulation
Prior to the beginning of this thesis non-coaxial sheath flow devices whichwere fabricated for detailed investigations by Jeroen Nieuwenhuis [1] wereavailable for experiments. Based on this work und using these devices GabrielHairer (see [14]) pushed the knowledge even further, especially in the fieldof the focusing limits. These devices and results gave the starting pointfor the conception of the new designs. The software FEMLAB 3.1 fromCOMSOL (see www.comsol.com, [15]) was used to carry out the numericalfinite element simulations. COMSOL-Multiphysics allows modeling, simulat-ing and solving physical phenomena in an interactive environment. From theso called MODEL-LIBRARIES the FLUID-DYNAMICS- and the CONVEC-TION/DIFFUSION modules were chosen to model the fluids. For simulat-ing laminar Stokes-flows (Reynolds-number < 1, see Chapter 2) the MEMS-MICROFLUIDCS module was used.The process of modeling starts with drawing the geometrical structure withthe implemented CAD tool. Defining the physics of the sub-domains andsetting the boundary conditions allow to generate the necessary mesh for thefinite element simulation. Solving the model takes place in two steps. At firstthe complete fluidic problem and after this the diffusion problem is solved.The software allows to take full control over all simulation parameters, forexample, correcting the automatically generated mesh, the type of solver andtheir parameters.The simulations were carried out with the following assumption. Sample flowand sheath flow can be interpreted as the same liquid. It is assumed that theonly difference between them is a notional concentration. The sheath flowcarries 0% and the sample 100% as initial conditions. As it will be shown inthe next chapter the simulation results that are based on such a model givesatisfying results in comparison with experimental data (see Chapter 5).Due to the fact that boundary conditions cause the fluid to form a hydrody-
9

CHAPTER 3. SIMULATION 10
namic flow profile the given flow rates represent always the mean values overthe channel width.
3.1 Influence of Channel Geometries and Flow
Rates
In this paragraph case studies are presented which illustrate the purposeand the parameters of the focusing and aligning techniques using sheathflows. The results of these simulated basic experiments allow evaluation ofthe design of the microfluidic devices where several sheath flow techniquesare used at once. The simulations were done using a diffusion constant ofD = 1 ∗ 10−9 m2/s. This value seems to represent the experimental sam-ple liquid (diluted 50 mg Acridin-Orange diluted in 80 mL de-ionised water)quite well. Several different kinds of approaches were done to simulate thephysical behaviour. Even if 3D simulations allow to include the dynamic ofall involved parameters the influence of those does not have to be significant.After comparing equivalent simple scenarios simulated in 2D and 3D, it wasconcluded as not necessary for characterising the influence of the main flowparameters to investigate further into 3D simulations. Especially in Chap-ter 3.1.4 several assumptions of simplifications were necessary to simulatein 2D the rather complex scenario. In the critical area of interest (furtherdetails in Chapter 3.1.4) the simulated results show no significant deviationfrom the experimental data. Therefore the simplifications can be assumedas valid. Based on this work further analysis and 3D modeling was done bymy colleage Gabriel Hairer.
3.1.1 Single Layered Sheath Flow - The Sample Inlet
Sheath liquid streams with a flow rate of qsh and with the flow velocity vsh
through a straight channel section that has the cross section dimensions of50 ∗ 50 µm2. The sample fluid (with a certain qsa and vsa) is joining this flowthrough a rectangular inlet of the channel bottom (etched pyramid geometryof the side walls in silicon due to the lattice structure, see 5.6). The ascendingheight hx of the non-coaxial sample flow in relation to the channel height is ofinterest. The varied parameters in the simulations were the ratio of qsh/qsa,the vsh/vsa and the absolute value of qsh. The velocity ratio was defined bythe length of the sample inlet (channel width was kept fixed at 50 µm). Oneof the 2D simulations together with all variables shows Figure 3.1. In thesimulation the varying concentration was measured across the channel. Themeasurements were taken at position A, around 50µm after the rear sample

CHAPTER 3. SIMULATION 11
vsa
vsh
z
x
y
zinlet
H
xh
qsa
qsh
A
Figure 3.1: Lateral 2D simulation ofthe sample inlet (qsh = 1µL/min andqsh/qsa = 1). The measurements, like
in Fig. 3.2 were taken at position A.
0 10 20 30 40 500
0.2
0.4
0.6
0.8
1
x / µ m
C /
% (c)
(b)(a)
(d)
Figure 3.2: Cross section plots ofthe varying concentration at positionA with flow ratios of qsh/qsa =(a) 0.1, (b) 1, (c) 10, (d) 25 and qsh =
1 µL/min
inlet edge. Several simulations were done, each one with different sample inletgeometry (sample inlet length varied from 25 % to 200 % of 50µm channelheight) and a varied flow rate qsh = 0.1, 1, 10 µ L/min). For each specificqsh simulations the ratio of the flow rates qsh/qsa were varied (between 0.1and 30 µL/min). Each simulation gave an array of curves showing how theconcentration varies across the channel height (Figure 3.2). The height hx
was then determined by the distance from the channel bottom to the pointwhere the concentration drops to 50 % of the maximum. As an examplethe simulated heights hx for a sheath flow rate of 1µ L/min is represented inFigure 3.3. It shows how high the sample flow ascends and how it depends onthe different parameters. The simulations indicate that hx depends also onthe absolute value of the flow rates. That means that increasing the ratio ofthe flow rate qsh results in a decreased sample height (downward shift of thecurves). Therefore higher absolute flow rates (around 1 to 10µ L/min) seemto improve the focusing quality (minimal sample height at lowest flow rateratio). Also the aspect ratio of the inlet (rectangular or square) influencedthe results slightly. At lower flow rates this effect is more noticeable likeit is shown by in Figure 3.4. The effect of the inlet dimension can be seenas a splitting up of the curves at higher flow ratios. Large lateral aspectratios in the 2D-simulations show that the sheath liquid tends to flow intothe sample inlet and causes noticeable deformation of the sample flow in thisarea (see Figure 3.5 and the confocal fluorescent images, Figure 5.9, too). On
CHAPTER 3. SIMULATION 12
0 5 10 15 20 25 300
5
10
15
20
25
30
35
40
45
50
q sh
/ q sa
h x / µ
m
zinlet
= 25%
zinlet
= 100%
zinlet
= 200%
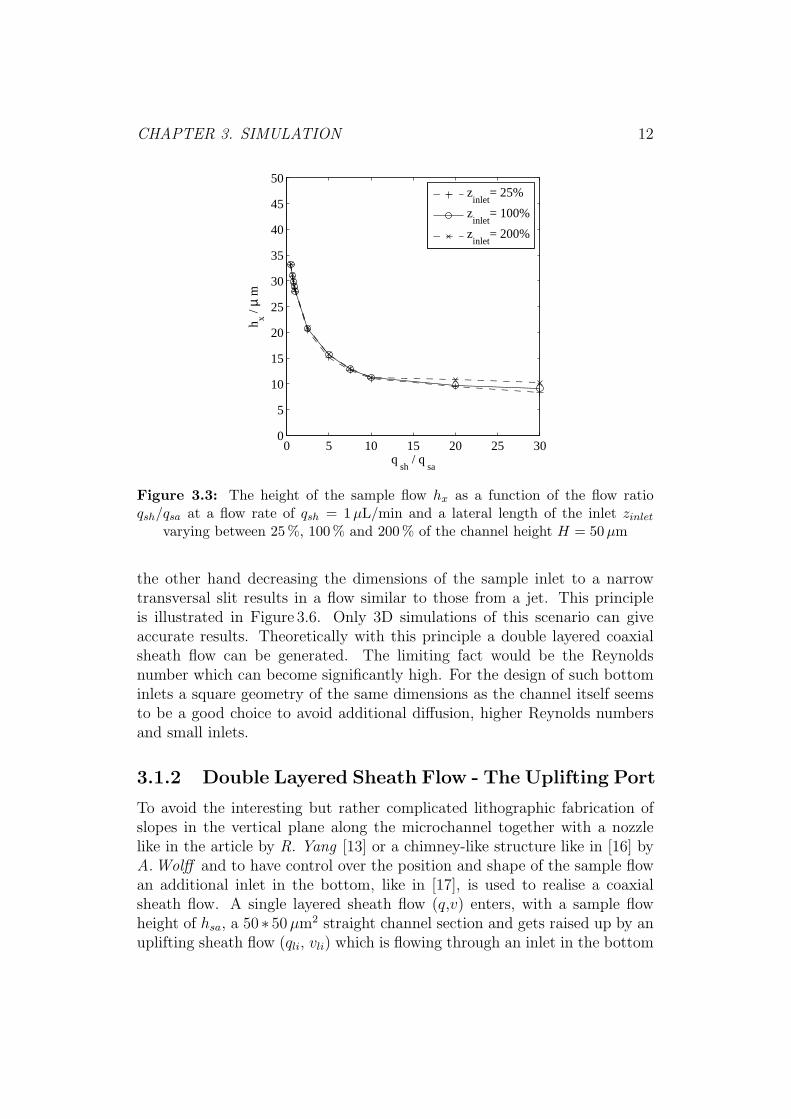
Figure 3.3: The height of the sample flow hx as a function of the flow ratioqsh/qsa at a flow rate of qsh = 1µL/min and a lateral length of the inlet zinlet
varying between 25 %, 100 % and 200 % of the channel height H = 50µm
the other hand decreasing the dimensions of the sample inlet to a narrowtransversal slit results in a flow similar to those from a jet. This principleis illustrated in Figure 3.6. Only 3D simulations of this scenario can giveaccurate results. Theoretically with this principle a double layered coaxialsheath flow can be generated. The limiting fact would be the Reynoldsnumber which can become significantly high. For the design of such bottominlets a square geometry of the same dimensions as the channel itself seemsto be a good choice to avoid additional diffusion, higher Reynolds numbersand small inlets.
3.1.2 Double Layered Sheath Flow - The Uplifting Port
To avoid the interesting but rather complicated lithographic fabrication ofslopes in the vertical plane along the microchannel together with a nozzlelike in the article by R. Yang [13] or a chimney-like structure like in [16] byA.Wolff and to have control over the position and shape of the sample flowan additional inlet in the bottom, like in [17], is used to realise a coaxialsheath flow. A single layered sheath flow (q,v) enters, with a sample flowheight of hsa, a 50 ∗ 50 µm2 straight channel section and gets raised up by anuplifting sheath flow (qli, vli) which is flowing through an inlet in the bottom

CHAPTER 3. SIMULATION 13
0 10 20 300
5
10
15
20
25
30
35
40
45
50
q sh
/ q sa
h x
qsh
= 0.1µ L/min
qsh
= 1µ L/min
qsh
= 10µ L/min
Figure 3.4: The influence of the absolute qsh-value on hx as a function at a fixedlateral length of the inlet xinlet of 100 % of the channel height H = 50µm
of the channel, the so called up-lifting port (same dimensions). The upliftedheight of the sample flow centre and its thickness wx after passing the port isof interest and was measured. The varied parameters are first, the height ofthe sample flow hsa at the entrance (varied between 25%, 50% and 75% of thechannel height) and second the ratio of the flow rates q/qli. Figure 3.7 showsa 2D-simulation with all variables and dimensions. Concentration measure-ments reveal figures like in Figure 3.8. The position of the sample flow hx
is determined by the position of the concentration-peak, the width wx is de-fined by the values on the abscissa where the concentration drops below 50%.Drawing for a certain q the position and the width wx of the sample flow overthe flow rate ratio qli, vli gives graphs like Figure 3.9 and Figure 3.10 (hsa isthe free parameter).Comparing such graphs with those of different absolute flow rates show thathigher flow rates result in smaller focused sample flows. Combining theseconclusions together with the diagrams and the information of the last para-graph allows now to characterize microdevices which combine these two prin-ciples. These results allow now to determine, at least for the vertical plane,the achievable sample flow position and width in a combination of a sampleflow inlet together with an uplifting inlet in the bottom of a channel withcertain flow rates and velocities.

CHAPTER 3. SIMULATION 14
vsa
vsh
z
x
y qsa
qsh
Figure 3.5: Noticeable back flow intothe sample inlet with increased flow ra-tio of qsh/qsa = 25 at qsh = 1µL/min
vsa
vsh
z
x
y qsa
qsh
Figure 3.6: Coaxial-like sheath flowat a low flow ratio of qsh/qsa = 0.8 and
qsh = 10µL/min
3.1.3 Symmetric Double Layered Sheath Flow - The
Side Ports
To achieve in a simple way horizontally plane and symmetrically focusedsample flows the following principle is quite common. Sample liquid is flowing(qsa, vsa) in a straight channel (50∗50 µm2) that passes an intersection. Fromthe so called side ports flows sheath liquid (qpo, vpo) symmetrically (to achievea centered flow) toward the sample flow. The mass conservation principleforces now the sample flow to reduce its lateral width accordingly to the ratioof qpo/qsa. An illustration is given in Figure 3.11 and the concentration alongthe channel cross section is shown in Figure 3.12.In the simulations the flow ratio of qsa/qpo was varied from 0, 01 to 100 for flowrates between 0, 1−20 µL/min. Figure 3.13 shows the influence of qsa/qpo andqsa on the achievable sample width. It shows that in the simulations samplewidths of less than 1 µm can be achieved in a single focusing step. But suchresults require a flow rate ratio of around 40 and more. Practically, this wouldmean a tremendous stress inside the channels of the microdevice which wouldlikely result in damaging the device. Therefore it can not be assumed thepossibility to achieve a sample width less than 5% by only a simple focusingstep. As it will be discussed later this is the reason why a combination ofseveral focusing techniques has to be used to reach even smaller limits.
3.1.4 The Taper
Considering laminar flows inside a microchannel allow the use of a taper (de-creasing channel width) to reduce the width of a sample flow, too. The den-sity of the streamlines inside a laminar flow is therefore strictly proportionalto the channel width. Considering the aspects of simplification discussed in

CHAPTER 3. SIMULATION 15
vli
v
z
x
y
H
xhqli
q
B
w
hsa
x
Figure 3.7: Lateral 2D simulation ofthe uplifting port. The measurementswere taken at position B (q/qli = 5, q =
1 µL/min).
0 10 20 30 40 500
0.2
0.4
0.6
0.8
1
x / µ m
C /
%
(d)(b)
(a)
(c)
Figure 3.8: Varying concentration in-fluenced by the uplifting inlet at posi-tion B and q = 1µL/min : q/qli =(a)
0.1, (b) 1, (c) 5 and (d) 25
Chapter 3.1 the following 2D model was used. Assuming a setup as illus-trated in Figure 3.14 which shows a top view of a taper where a sheath flow(qsh, v) and a sample flow (qsa, v) enter a channel from the left. The channelwidth w gets decreased to a final width w′. The lateral dimension of thesample inlet wsa gets projected to the size w′
sa. The sample size is reducedby the same factor as the channel changes its dimensions from wsa to w′
sa.Allowing diffusion of the sample flow results in slightly different behaviour,especially when it comes to low ratios of qsh/qsa and low absolute flow rates.An illustration is given in Figure 3.15 showing a sequence of 2D simulationswith varying parameter qsh.Measurements of the concentration across the channel show the minimal ra-tio of the flow rates where the sample width gets compressed by the samefactor like the channel decreases its size (Figure 3.16). Flow ratios higherthan qpo/qsa = 5 give the best performance of the taper.
3.2 Design Considerations
Based on the results of the previous paragraphs it can be estimated howthese focusing techniques have to be used and the microchannels have tobe designed to achieve sample flow dimensions that are desired. To achievea coaxial sheath flow within such a microdevice a certain combination offocusing and aligning techniques has to be used. The aim is to produce asample flow inside a microchannel that is only in contact with the sheath
CHAPTER 3. SIMULATION 16
0 5 10 15 20 25 300
5
10
15
20
25
30
35
40
45
50
q / q li
h x / µ
m
hsa
= 25%
hsa
= 50%
hsa
= 75%
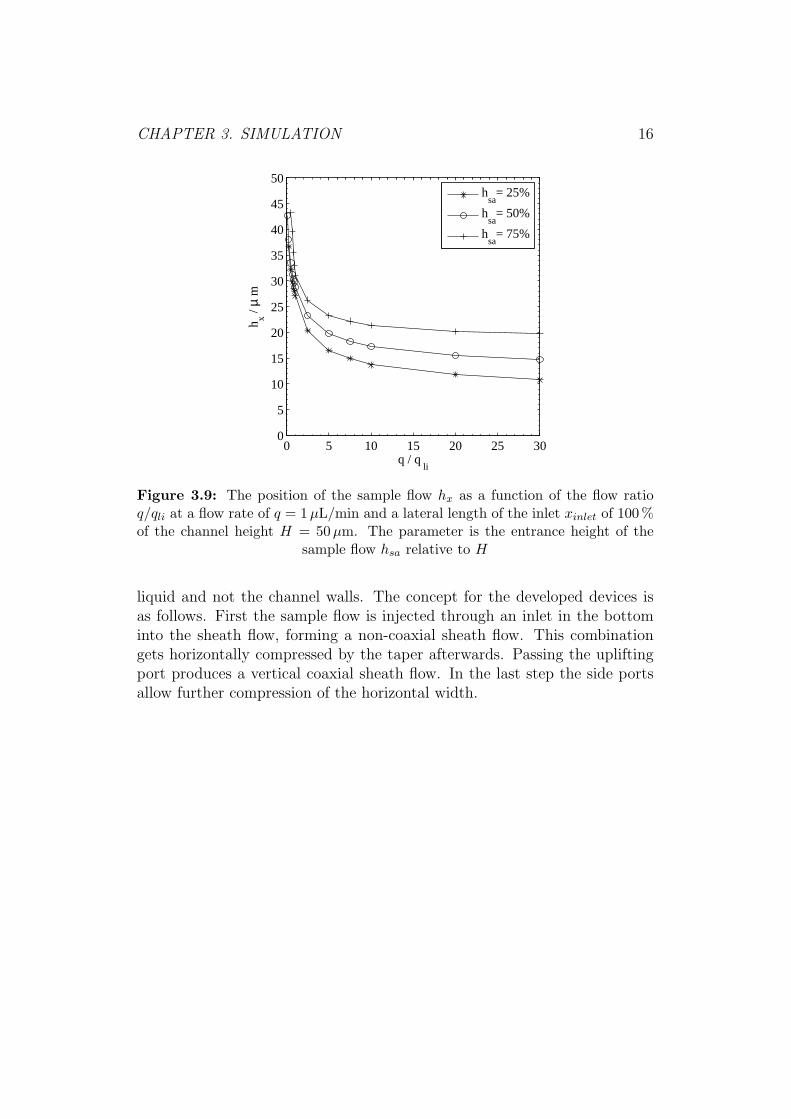
Figure 3.9: The position of the sample flow hx as a function of the flow ratioq/qli at a flow rate of q = 1µL/min and a lateral length of the inlet xinlet of 100 %of the channel height H = 50µm. The parameter is the entrance height of the
sample flow hsa relative to H
liquid and not the channel walls. The concept for the developed devices isas follows. First the sample flow is injected through an inlet in the bottominto the sheath flow, forming a non-coaxial sheath flow. This combinationgets horizontally compressed by the taper afterwards. Passing the upliftingport produces a vertical coaxial sheath flow. In the last step the side portsallow further compression of the horizontal width.

CHAPTER 3. SIMULATION 17
0 5 10 15 20 25 300
5
10
15
20
25
30
35
40
45
50
q / q li
wx /
µ m
hsa
= 25%
hsa
= 50%
hsa
= 75%
Figure 3.10: The width of the sample flow wx after passing the uplifting port.Parameters similar to Figure 3.9.
vpo
v
z
-y
x
qpo
q
C
wy
sa
sa
vpoqpo
Figure 3.11: The influence of sym-metric side ports (qsa = 1µL/min and
qpo/qsa = 1)
0 10 20 30 40 50
0
0.2
0.4
0.6
0.8
1
x / µ m
C /
%
(d)
(b)(a)
(c)
Figure 3.12: Varying concentrationat position C and qsa = 1µL/min:qpo/qsa =(a) 0.1, (b) 1, (c) 10 and (d)
100

CHAPTER 3. SIMULATION 18
10−2
10−1
100
101
102
100
101
q po
/ q sa
wy /
µ m
q = 0.1µ L/minq = 1µ L/minq = 10µ L/min
Figure 3.13: The correlation between the achievable width of the sample flowwy and the flow ratio qpo/qsa
zx
-y
v w’
saw’qsaqsh
D
wwsa
Figure 3.14: Top view of a taper (qsa = 1µL/min and qpo/qsa = 1, w = 800µm,wsa = 80µm, channel height 50µm)

CHAPTER 3. SIMULATION 19
(a) (c)(b)
Figure 3.15: Increasing the flow ratio qsh/qsa = (a) 0.5, (b) 5 illustrates how theinfluence of diffusion gets less. (c) Shows a streamline plot without the influence
of diffusion. Sample flow rate qsa = 1µL/min.
0 5 10 15 20 25 300
5
10
15
20
25
30
35
40
45
50
qsa
/ qsh
wsa
’ / µ
m
(a)(b)(c)
Figure 3.16: The sample width w′
sa influenced by varying absolute values ofqsh and the diffusion constant D, measured at position D. (a)qsh = 0.1 µL/min,D = 1 ∗ 10−9 m2/s, (b)qsh = 1µL/min, D = 1 ∗ 10−9 m2/s, (c)qsh = 10µL/min,
D = 1 ∗ 10−10 m2/s

Chapter 4
Design and Fabrication
Based on the preliminary considerations and the results of the theoreticalsimulations, discussed in the former chapter, the following designs have beendeveloped (see Table 4.1) and two device holder concepts for the experimen-tal setup, as shown in Fig. 4.9 and Fig. 4.10, were realised.
Figure 4.1: Size comparison of deviceNo. 1, 6 ∗ 9 mm chip size and 900 µm
thickness.
Figure 4.2: The fabricated 100 mmwafer, showing the relative size of the
two chip sizes.
Compared to the rather complex conception used in the work of Narajan Sun-darajan [4] the microdevices presented in this thesis consist of three parts: Asilicon body, a glass cover and polymer-based thick resist layer (SU-8) whichdefines the shape of the channels. The technology of SU-8 based lithographyand low temperature wafer bonding is used as discribed in [18]. For tak-ing measurements the microdevice is mounted onto a disposable supportingpanel (see 4.2.3). This unit is fixed onto a, so called, holder that represents
20

CHAPTER 4. DESIGN AND FABRICATION 21
the connection to the pipes, which are fed by several syringe-pumps deliver-ing the fluids. The panel and the holder allow comfortable handling of themicrodevice during the experiments.
4.1 Design of the Devices
4.1.1 Principal structure of the microdevices
The bottom of the microchannel is made of silicon (360µm thickness) and thechannel top is defined by a 500µm thick Pyrex glass plate. The connectionholes to the outside are KOH-etched into the silicon. The microchannels aremade of SU-8, see [18]. The height of the SU-8 layer of 50µm defines theoverall channel height.
4.1.2 General design considerations
To maximize the output and to increase the research possibilities it wasconsidered as an asset to develop several different types of devices and toput them onto the same wafer. The designs differ in their channel geometry,the hydrodynamic principle and in the holder concept they use. The generaldesign criteria were:� minimum dimensions of the formed sample flow, goal 2µm� inlet and channel dimensions, as large as possible to avoid clogging
effects. The inlet dimensions were chosen to be mainly 50 µm in square.� chip dimensions as small as possible� a holder concept, constructed in a simple way and easy to handle
A list of all designs that could be realised is given in 4.1. For the sake ofcompleteness the missing device No. IV is explained by the fact that this de-sign was not considered worth to be fabricated and therefore left out.The total number of different designs is five and they were arranged in amixed pattern on the silicon-wafers to eliminate the risk of the total loss of adesign due to fabrication mistakes. The position on the wafer of the differentdevices and their arrangement shows Figure 7.1. To make the arrangementof the different designs easier and, under the aspect of minimum space re-quirements, more efficient, their surface dimensions had to be identical orin multiples. It was found that chip dimensions of 6 ∗ 9 mm and 9 ∗ 13 mmare the best choice from the technological point of view (diameter of the

CHAPTER 4. DESIGN AND FABRICATION 22
Design Name Hydrodynamic Principle Holder Concept
# Wafer Label COAXIAL NON-COAXIAL 6 x 9 mm 9 x 13 mm
I I.COAX X - X -II II.COAX X - - XIII III.COAX-S X - X -V V.N-COAX - X - XVI VI.N-COAX - X X -
Table 4.1: Names and labels of the fabricated designs together with their maincharacteristics
available hoses, fabrication efforts of the silicone gasket and the mountingand handling of O-rings). These dimensions include some extra space to theedges for the sealings and space for bonding pats for electrical connections,if needed. The plain lateral dimensions of the microfluidic system are just4 ∗ 7 mm and 7 ∗ 12 mm. 60 devices could be placed onto the 100 mm wafers,46 small and 14 large devices.Due to the fabrication technique the channel height is the same for all designson the same wafer. For future batches it could be worth to try to producechips with a channel height of, for example, the half of the value of the firstbatch. This would result, for the device No. III in a square cross section ofthe main channel and would allow further studies of the influence on theshape of the sample flow.If the designs are distinguished by their hydrodynamical principle then thereare two groups: The coaxial and the non-coaxial devices. The first are thecoaxial sheath flow devices (three different designs), which also representthe novel and more interesting ones. The second group uses the non-coaxialprinciples (two designs). The non-coaxial devices represent some kind of”rescue”-designs. They are designed in a simple way with dimensions thatare not too critical to fabricate and have no inlets which are too small (clog-ging can not that easily occur). These designs are not able to deliver suchsmall sample flow dimensions like the others are expected to give. On theother hand these ”rescue”-designs will give guaranteed evaluable data, forthe case fabrication of the more critical designs fails.As it is discussed in the next chapter, a novel sealing technique was usedfor the connection between the microchip and the holder. To get a clearcomparison to the conventional sealing technique, with standard O-rings, itwas decided to fabricate both. This resulted in two different chip sizes andtherefore the realised designs have to be distinguished by their chip size andthe type of holder that has to be used in the experimental setup (see nextchapter for further details).

CHAPTER 4. DESIGN AND FABRICATION 23
Figure 4.3: ACAD layout of the 100 mm wafer. The layouts of the single litho-graphic masks can be found in the Appendix 7.1.
The measurement technique for the analysis are optical methods (opticalfluorescent microscopy and confocal laser-microscopy). If required, there isalways the opportunity for doing impedance measurements (Coulter counter)with the non-coaxial devices, as well. For this, electrodes can be easily in-tegrated by simply including an additional mask for the silicon wafer in thefabrication process.
4.1.3 Chosen Designs and Layouts
The purpose of this part is to give a description of the designs which werefabricated. Together with the desired purpose, the design characteristics arelisted. The overall height of the channel structures was 50µm . This resultsin an aspect ratio of one and a square cross section of the main channel forall designs, except for the design No. III.

CHAPTER 4. DESIGN AND FABRICATION 24
Device No. I
Desired purpose: This device gives a sample-flow diameter in the rangeof 2 µm and represents the device on which the main focus of interest washeld. It can be used as an alignment tool for example to position Escherichiacoli bacteria for optical detection and analysis.
Figure 4.4: Coaxial device No. I, small chip size. The double hatched area indi-cates the hardened SU-8, the single hatched soft SU-8 for improving the tightness
and strength. The dashed lines represent the etched cavities.
Design characteristics: The sheath liquid passes the inlet (330∗330 µm2)in the bottom of the channel and is led toward the sample inlet (80∗80 µm2).The inlet area has a channel width of 400µm and expands to 800µm. Thesample is led through an 80 ∗ 80 µm2 inlet. The transversal compression ofthe taper is from 800µm to 50µm which gives a factor of 16. The upliftinginlet in the bottom of the channel is 50∗50 µm2 large and the two side ports,following from the side, have a cross section of 50 ∗ 50 µm2. For analysis analmost 1 mm long straight section (50µm width ) after the sample formingtook place follows before the channel expands again to 160µm width. Thissection is also of 1 mm length and gives further space for taking measure-ments. This broader channel section gives the possibility to measure the

CHAPTER 4. DESIGN AND FABRICATION 25
expanded sample flow diameter with less resolution requirements for the op-tical detection equipment but accepting the drawback of a lowered contrast.Finally the channel expands to 400µmm channel width and leads to thedrain of the device (330∗330 µm2). The device is connected via the mouldedsilicon-packing to the holder.
Device No. II
Desired purpose: From the hydrodynamical principle this device is de-signed similar to the first and differs only in the chip dimensions. This deviceto Holder B, the holder with the O-ring gasket.
Figure 4.5: Coaxial device No. II, large chip size.
Design characteristics: The fluids pass the same sections as in the firstdesign, mentioned above. Only the distances are extended. As a drawbackof this design one could mention that diffusion takes place more significantlyin the longer channel sections especially between the sample inlet and theup-lifting port. This results in an increased sample diameter caused by thediffusion process and depends therefore strongly on the diffusion constant ofthe sample liquid.

CHAPTER 4. DESIGN AND FABRICATION 26
Device No. III
Desired purpose: The purpose is to minimize the sample flow diameterto technological and detectable limits. A channel width of only 25 µm wasconsidered from the technological point of view as the minimum (aspect ratioof 2 : 1).
Figure 4.6: Coaxial device No. III, small chip size. 25 µm width of the mainchannel.
Design characteristics: The design will offer the opportunity to achieveeven smaller sample flow dimensions than with the other designs due to thesmaller channel geometries. It gives also the opportunity to experiment withthe fabrication parameters and to optimize them. Design characteristics: Thehydrodynamic principle is like the one of devices No. I, illustrated above. Thechannel width is about 25µm. The factor of the taper is 16 (from 400µmto 25µm) and the sample inlet is about 25µm in square. The fabricationtolerances are the limiting factors for the smallness of the inlet holes in thebottom of the microdevice.

CHAPTER 4. DESIGN AND FABRICATION 27
Device No. V
Desired purpose: This design should bring measurable results in anycase with even smaller sample flow dimension limits than those which wereachieved in previous studies. To be prepared for the worst case that thenovel sealing of the new holder concept fails, too, it uses the holder with theconventional O-rings (HolderB).
Figure 4.7: Non-coaxial device No. V, large chip size.
Design characteristics: Simple non-coaxial design, similar to the oneused in [14]. It gives the opportunity to integrate electrodes easily by adding alithographic mask to the fabrication process.with integrated Coulter counter.The device is supported by the device holder with O-rings. After the sideports three channel sections, each 1 mm long, are available for taking mea-surements (50, 160 and 400µm wide).
Device No. VI
Design characteristics: Non-coaxial design, similar to the device No. Vbut supported by the device holder with the silicone gasket.

CHAPTER 4. DESIGN AND FABRICATION 28
Figure 4.8: Non-coaxial device No. VI, small chip size.
4.2 Design And Conception of the Auxiliary
Parts
4.2.1 The holder concepts
The purpose of the so called holder is to provide a tight, rigid and stableconnection between the microdevice, the pipes and the rest of the periph-ery. To avoid any leakage, a gasket is in between. As illustrated in previousworks, e.g. of [1], O-rings are the standard way to achieve a proper connec-tion. These gaskets need to be snaped into a notch to keep them in the rightposition. As it is the aim of this work to scale down the chip size as far aspossible, it was necessary to think about the limits of this type of sealing andpossible alternatives.The starting point for the design process of the holder was evaluating the min-imal radial separation of the inlets. The criterion was to keep them as closeas possible to avoid diffusion between the different focusing stages. It wasfound that, in general, the limiting factors for holders of such microdevicesare first, the outer tube diameter and second, the thickness of the used siliconwafer. The fact that only Si wafers of certain thickness where available madethe second argument the dominant one. That is because, as described in
CHAPTER 4. DESIGN AND FABRICATION 29
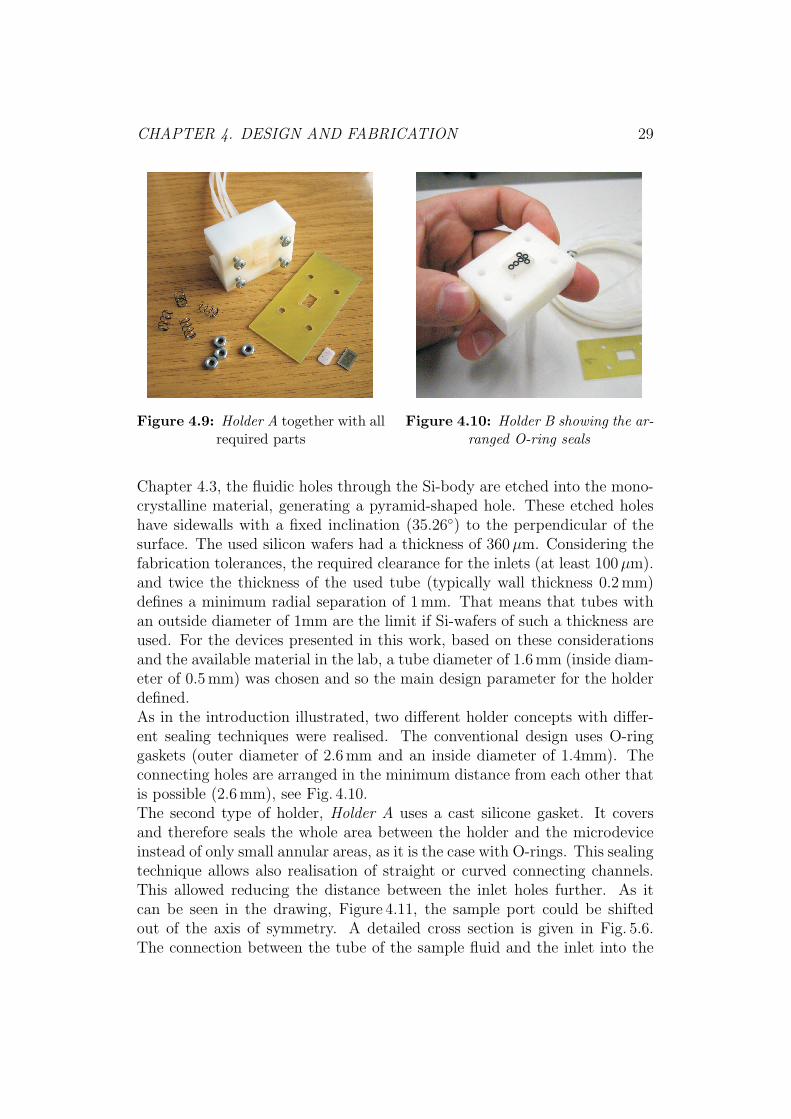
Figure 4.9: Holder A together with allrequired parts
Figure 4.10: Holder B showing the ar-
ranged O-ring seals
Chapter 4.3, the fluidic holes through the Si-body are etched into the mono-crystalline material, generating a pyramid-shaped hole. These etched holeshave sidewalls with a fixed inclination (35.26◦) to the perpendicular of thesurface. The used silicon wafers had a thickness of 360µm. Considering thefabrication tolerances, the required clearance for the inlets (at least 100µm).and twice the thickness of the used tube (typically wall thickness 0.2 mm)defines a minimum radial separation of 1 mm. That means that tubes withan outside diameter of 1mm are the limit if Si-wafers of such a thickness areused. For the devices presented in this work, based on these considerationsand the available material in the lab, a tube diameter of 1.6 mm (inside diam-eter of 0.5 mm) was chosen and so the main design parameter for the holderdefined.As in the introduction illustrated, two different holder concepts with differ-ent sealing techniques were realised. The conventional design uses O-ringgaskets (outer diameter of 2.6 mm and an inside diameter of 1.4mm). Theconnecting holes are arranged in the minimum distance from each other thatis possible (2.6 mm), see Fig. 4.10.The second type of holder, Holder A uses a cast silicone gasket. It coversand therefore seals the whole area between the holder and the microdeviceinstead of only small annular areas, as it is the case with O-rings. This sealingtechnique allows also realisation of straight or curved connecting channels.This allowed reducing the distance between the inlet holes further. As itcan be seen in the drawing, Figure 4.11, the sample port could be shiftedout of the axis of symmetry. A detailed cross section is given in Fig. 5.6.The connection between the tube of the sample fluid and the inlet into the

CHAPTER 4. DESIGN AND FABRICATION 30
Figure 4.11: ACAD drawing of Holder A. See also the detailed cross section(indicated by Detail Z) and the object description in Fig. 5.6.

CHAPTER 4. DESIGN AND FABRICATION 31
microdevice is defined by the straight slit in the silicone gasket (see drawingin Figure 7.5).
4.2.2 Silicone Gasket
The gasket was fabricated with a custom build mould. Metal pins and milledstructures define the shape of the silicone gasket. Figure reffig:mould showsthe technical drawing of the mould and the Picture reffig:BILD-silicone showsinjecting the liquid silicone into the closed mould. Liquid silicone rubber fromWacker Chemie AG was used. The liquid silicone is mixed to homogeneityin a ratio of 9 : 1 with a curing liquid. The mould is closed and the mixedcomposite is pumped into the injection hole with a conventional syringe. Themould has to be kept in vertical position to allow air bubbles finding the wayto the outlet. This type of silicone rubber cures at room temperature. Thistakes several days but can be accelerated to less than a hour by heating upto 60◦C.
Figure 4.12: Top view of the dissem-bled mould. The PMMA cover, themilled Al-body and metal pins definethe geometry of the Silicone gasket. Amoulded gasket lies in front of the other
parts. See also Fig. 7.5.
Figure 4.13: Injecting the liquid sil-icone mixture by means of a conven-tional medical-syringe into the mould.The mould is kept in an upright posi-tion for curing to allow air bubbles leav-
ing the mould through the drain.
4.2.3 PCB-Panel
Due to the small dimensions of the silicon microdevices and their sensitivityagainst mechanical stress it is necessary to mount the device on a disposable

CHAPTER 4. DESIGN AND FABRICATION 32
supporting panel. Additional onboard electronic equipment and connectionsbetween the chip and its peripheral parts can be mounted onto this panel ifrequired. It is made from a printed circuit board (PCB for short). Figure 4.15shows the fabricated panels for the holders. The microdevice gets mountedonto the PCB-panel with cyanoacryl glue and connected via a screw-spring-nut combination with the holder body (see Chapter 5.1 for the detailed setupprocedure).
Figure 4.14: The table of the mi-croscope together with the mountedholder, panel and the connecting pipes.
Figure 4.15: The micro devices andthe milled disposable panels, made from
conventional epoxy-resin glass fiber.
Figure 4.14 illustrates how the panel allows the holder to be fixed onto thetable of the microscope with conventional slide-brackets. The detailed crosssection of the assembled setup is given in Figure 5.6.
4.3 Microdevice-Fabrication Issues
The details about the fabrication process of the microdevice itself are pre-sented in this section. The fabrication technique of using thick resist lithogra-phy is described in the book Fundamentals and Applications of Microfuidics[7]. Prior to this work several investigations were done using the SU-8 and lowtemperature bonding technique by Peter Svasek like for example in [18]. Thefabrication of MEMS-devices is technologically and historically based on thesemiconductor microchip production. Therefore the fabrication techniquesfor coating, structuring and handling are under excellent control. The wholefabrication and clean-room logistics were carried out on 100mm wafers. Sil-icon wafers of 360µm thickness, with a standard {100} lattice orientation,
CHAPTER 4. DESIGN AND FABRICATION 33
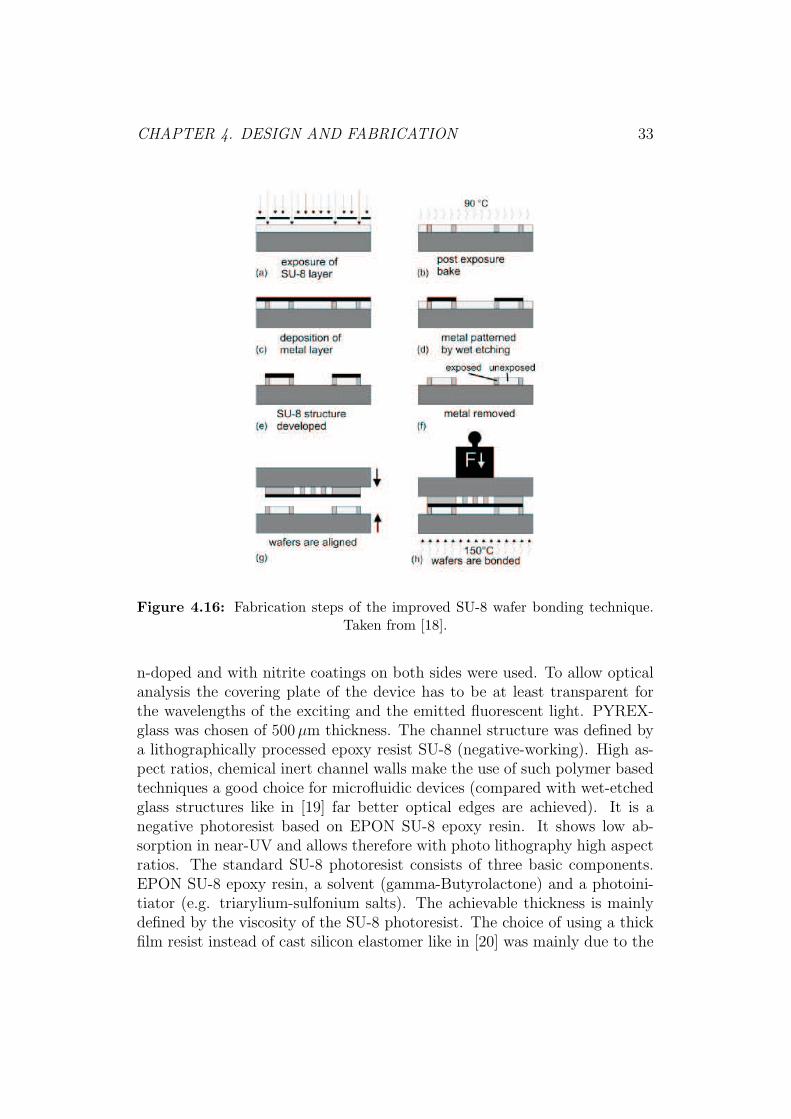
Figure 4.16: Fabrication steps of the improved SU-8 wafer bonding technique.Taken from [18].
n-doped and with nitrite coatings on both sides were used. To allow opticalanalysis the covering plate of the device has to be at least transparent forthe wavelengths of the exciting and the emitted fluorescent light. PYREX-glass was chosen of 500µm thickness. The channel structure was defined bya lithographically processed epoxy resist SU-8 (negative-working). High as-pect ratios, chemical inert channel walls make the use of such polymer basedtechniques a good choice for microfluidic devices (compared with wet-etchedglass structures like in [19] far better optical edges are achieved). It is anegative photoresist based on EPON SU-8 epoxy resin. It shows low ab-sorption in near-UV and allows therefore with photo lithography high aspectratios. The standard SU-8 photoresist consists of three basic components.EPON SU-8 epoxy resin, a solvent (gamma-Butyrolactone) and a photoini-tiator (e.g. triarylium-sulfonium salts). The achievable thickness is mainlydefined by the viscosity of the SU-8 photoresist. The choice of using a thickfilm resist instead of cast silicon elastomer like in [20] was mainly due to the

CHAPTER 4. DESIGN AND FABRICATION 34
experience of the department in that field. Of course physical facts like forexample the better biocompatibility is also working to ones favour by usingthe SU-8 technique. The process flow of the microdevice fabrication was asfollows and illustrated in Figure 4.16.
1. The Si wafer gets coated with a titanium layer to improve the bondingbetween the Si wafer and the SU-8 afterwards.
2. An anisotropic wet etching technique (KOH as an alkali hydroxideetchant) is used to process the connecting holes.
3. The glass wafer is spin coated with SU-8 50, soft baked at 95 ◦C, on ahot plate with flat surface, and exposed through a lithographic maskby near-UV (a).
4. The exposed area gets selectively cross-linked by a following post ex-posure bake (b) at 90 ◦C (avoids stress and damage of the film). After-wards the polymer photoresist is developed.
5. A sacrificial silver layer is applied (c) and patterned by an wet etchingprocess (d) to cover selectively unexposed parts of the SU-8 photoresistof the next step.
6. The SU-8 gets hard baked to give the resist its final mechanical strengthand chemical stability.
7. The unexposed and unprotected photoresist gets removed (e). Onlythe polymerized SU-8 and the covered SU-8 remains.
8. The sacrificial layer gets removed (f).
9. The Si and the PYREX wafer are aligned (g) and connected by anadhesive bonding process (h) at 150 ◦C as described in [18].
10. The bonded wafer gets cut.

Chapter 5
Experiment and Measurements
5.1 The Experimental Setup
The setup can be divided mainly into four groups. It consists of the microde-vice itself, the fluid-pumps (Fig. 5.2 and syringes, a unit that connects them(panel, holder, pipes and filter, see Fig. 5.3) and an analytical unit (opticalmicroscope, Fig. 5.1). The used microscope, Nikon Digital Eclipse C1, al-lows conventional and confocal fluorescent laser microscopy. The setup withholder A is shown in Figure 5.1.
Figure 5.1: The confocal laser microscope Nikon Digital Eclipse C1.
Figure 4.14 and Figure 5.5 illustrate that it is necessary to mount the mi-crochip headlong onto the table of the microscope. The connection be-tween the holder body and the syringe pumps was achieved via conventionalpolymer-silicone pipes (inner diameter 0.5 mm, outer diameter 1.6 mm) with
35
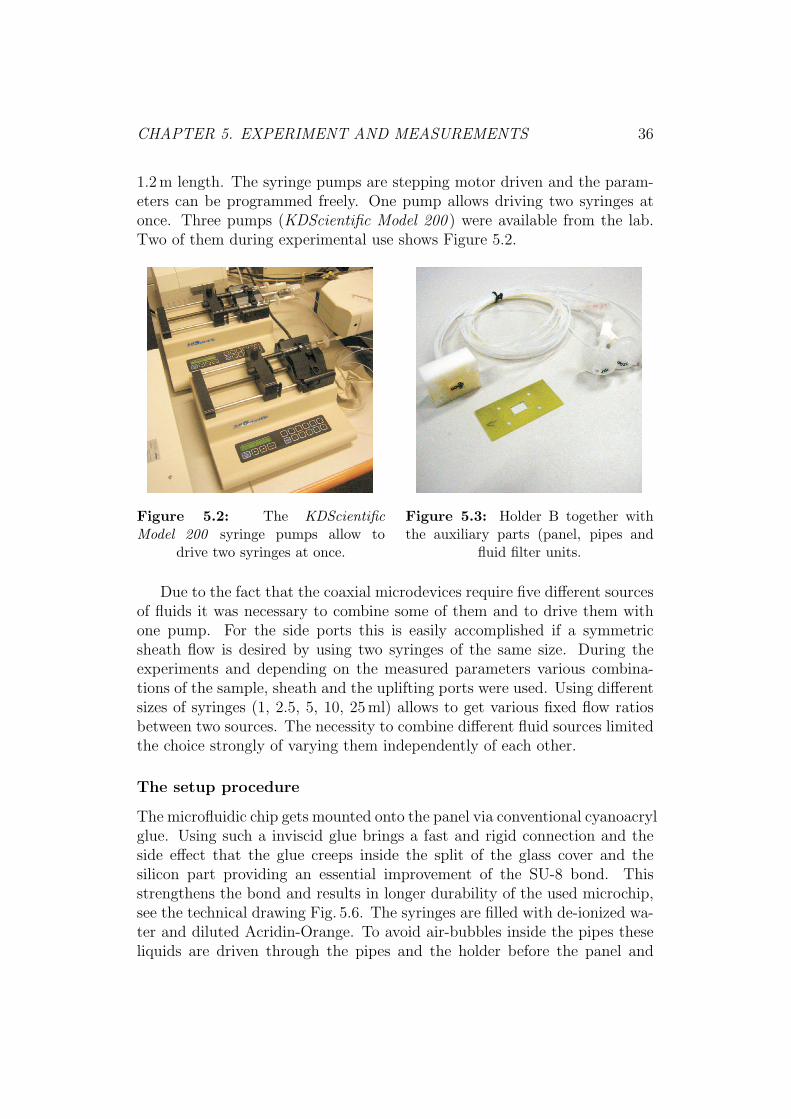
CHAPTER 5. EXPERIMENT AND MEASUREMENTS 36
1.2 m length. The syringe pumps are stepping motor driven and the param-eters can be programmed freely. One pump allows driving two syringes atonce. Three pumps (KDScientific Model 200 ) were available from the lab.Two of them during experimental use shows Figure 5.2.
Figure 5.2: The KDScientific
Model 200 syringe pumps allow todrive two syringes at once.
Figure 5.3: Holder B together withthe auxiliary parts (panel, pipes and
fluid filter units.
Due to the fact that the coaxial microdevices require five different sourcesof fluids it was necessary to combine some of them and to drive them withone pump. For the side ports this is easily accomplished if a symmetricsheath flow is desired by using two syringes of the same size. During theexperiments and depending on the measured parameters various combina-tions of the sample, sheath and the uplifting ports were used. Using differentsizes of syringes (1, 2.5, 5, 10, 25 ml) allows to get various fixed flow ratiosbetween two sources. The necessity to combine different fluid sources limitedthe choice strongly of varying them independently of each other.
The setup procedure
The microfluidic chip gets mounted onto the panel via conventional cyanoacrylglue. Using such a inviscid glue brings a fast and rigid connection and theside effect that the glue creeps inside the split of the glass cover and thesilicon part providing an essential improvement of the SU-8 bond. Thisstrengthens the bond and results in longer durability of the used microchip,see the technical drawing Fig. 5.6. The syringes are filled with de-ionized wa-ter and diluted Acridin-Orange. To avoid air-bubbles inside the pipes theseliquids are driven through the pipes and the holder before the panel and

CHAPTER 5. EXPERIMENT AND MEASUREMENTS 37
the microchip is mounted onto the holder. After rinsing the auxiliary partsthe microchip is fixed onto the holder. Bolts that are supported by springsensure a soft contact pressure for the brittle Silicon microchip. In the laststep the panel is strapped onto the table of the microscope with conventionalslide-brackets.
5.2 Measurement Methods
Confocal laser scanning microscopy is a microscopic technique that allows toobtain high resolution images and 3-D reconstructions of thick specimens atvarious depths. The computer controlled microscope focuses onto a specificfocal plane and scans and detects the fluorescent area of interest point-by-point. Doing this for several neighbouring focal planes allows reconstructionof the vertical information and generating volume-render models of the col-lected data. The picture in Figure 5.4 illustrates the principle of confocalmicroscopy. The confocal laser microscopy in use shows Fig. 5.5. A moredetailed insight into the confocal laser scanning microscopy can be found atthe online-dictionary Wikipedia [21].
5.3 Measurement Results
The detailed measurements presented in this chapter were done with thecoaxial and non-coaxial microdevices No. 1, No. 2 and No. 6. on holder A(see Table 4.1).
5.3.1 The Sample Inlet
The confocal measurements reveal 3D insights into how the sample flow en-ters through the bottom of the microchannel. The longitudinal flow profileshows the same lateral shape and size as in the theoretical models (see 3.1.1).At higher flow ratios qsh/qsa it seems that no stable flows can be achievedand that no further sample flow is emitted. Explanations for this could bethe back flowing sheath liquid (see Fig. 3.5) or either missing balance of theflows, caused by flushing processes as described below.The etched holes in monocrystalline substrates bear a pyramid-shaped cavitywith a huge volume of several cubic millimetres below the surface, see thetechnical drawing in Fig. 5.6. To remove air bubbles and small particles likedust it is necessary to flush the device from time to time during the experi-ment. This causes the cavity below the sample inlet to be filled completelywith sheath liquid. Continuing an experiment after this and considering high

CHAPTER 5. EXPERIMENT AND MEASUREMENTS 38
Figure 5.4: The principle of confocal laser scanning microscopy. The pin-holeensures that only beams from a certain focal plane reach the detector.
Figure 5.5: The microfluidic chip mounted headlong onto the table of the micro-scope. Seen from below, showing the objective lens and the scanning laser light
reflected by the microchip.

CHAPTER 5. EXPERIMENT AND MEASUREMENTS 39
flow ratios of qsh/qsa at low absolute values, like qsa = 0.01 µL/min results inthe effect that no sample liquid seems to be emitted at those values. In realitysample liquid is emitted, but before entering the microchannel it has to passthe tube and the cavity and to fill these volumes again with sample liquid.At the part with the largest cross section of the cavity the sample velocity ismuch slower than in the area where the flow enters the microchannel. Thefactor between the flow velocities is in the range of 50. Strong diffusion takesplace between the sample liquid and the sheath liquid in the cavity.
Figure 5.6: Cross section drawing of holder A showing the etched cavities.(1) cover glass, (2) Silicon, (3) silicone gasket, (4) cyanoacryl glue, (6) PMMAholder body and a (7) silicone pipe (shown with only one silicone pipe mounted) .
For further description see Fig. 4.11.
This results in long dead-times before stable flow comes back. In the exper-imental situation it requires relatively long time to get well balanced flows.Figure 5.7 shows a 3D perspective view of the sample inlet. The sample flowenters from the rectangular inlet (80∗80 µm2) the microchannel and is formedby the sheath flow, flowing from right to the left side. The sample flow inletin the horizontal plane (y-z) show the pictures in Figure 5.8.

CHAPTER 5. EXPERIMENT AND MEASUREMENTS 40
sample inlet
z
-y
Figure 5.7: Perspective view of the sample flow streaming through the sampleinlet into the microchannel (qsh/qsa = 40, qsa = 0.1 µL/min). The box marks the
image area of the confocal measurement.
5.3.2 The Taper
Measurements of the taper compression illustrates the sequence in Figure 5.8.The sequence shows the influence of diffusion and how the shape of thesample width wy is effected by the flow ratio qsh/qsa above the found limitqpo/qsa = 80 (scaled by the factor of 16, according to the different channelgeometry), described in Section 3.1.4. Direct comparison with the streamlineplot in Figure 3.15 (c) shows that the flow ratio is already high enough toassume the smallest sample width w′
y after passing the taper. Increasing theratio even further has almost no effect on w′
y, only the contrast gets lowertogether with reducing wx.
(a) (b) (c)(a) (b) (c)
Figure 5.8: Influence of increasing qsh/qsa above the limit of qpo/qsa = 80(qpo/qsa = (a) 200, (b) 400 and (c) 800)

CHAPTER 5. EXPERIMENT AND MEASUREMENTS 41
5.3.3 The Uplifting Port
The use of an uplifting port which raises the non-coaxial sample flow to acoaxial one made it necessary to have analytical equipment that can giveadditional information about the fluids in the vertical axis. Figure 5.9 showsa lateral cross section oof the uplifting port together with the side ports.Together with Figure 5.10 and 5.11 they illustrate the process of sampleforming in the coaxial microdevice No. 1.
side ports{
uplifting port{
Figure 5.9: Lateral cross section: The influence of the uplifting port on a non-coaxial flow (qsh/qsa = 25, qsa = 1µL/min and qli = 12.5 µL/min).
sideports
uplifting port{
Figure 5.10: Top view (see also Figure 5.9).
Due to the fact that high resolution confocal images with good contrastconsist of 100 - 1000 single frames, stable hydro dynamical flows for up toone hour were necessary. Stochastic interruptions caused the noticeable darklines in the images. The use of the 500 µm thick covering glass made it

CHAPTER 5. EXPERIMENT AND MEASUREMENTS 42
uplifting inlet
z
-y
Figure 5.11: Perspective view (see also Figure 5.9).
impossible to use high power objective-lenses. A magnifying power of x 40was the maximum that could be used and therefore the confocal resolutionin the vertical dimension was always a bit low. In addition to this shadowingand mirror effects made it always difficult to catch to right focal planes andto interpret the data correctly, especially at the areas below the sample flowand close to the walls of the channel. The analysis of the sheath flow profilesafter each step of sample forming are shown in Figure 5.12.
(a) (b) (c)
Figure 5.12: Sample flow profiles: (a) before and (b) after the uplifting port.(c) shows the compression of the symmetrically flow of the side ports (qsh/qsa =XXX, qsa = XXX µL/min). The dotted line marks the border where in the
digital data the contrast drops down to 50%.

CHAPTER 5. EXPERIMENT AND MEASUREMENTS 43
5.3.4 The Side Ports
The measurements of the focusing limits that are achievable with the sideports were done in two steps. First, the input flow of the channel was 100%sample liquid without any sheath flow. Second the input flow was a non-coaxial sample flow. Figure 5.13 shows the influence of the side ports with
Figure 5.13: Side port pressureforming a double layered sheath flow(qpo/qsa = 10, qsa = 0.4 µL/min).Compression to a width of wy = 10µm.
Figure 5.14: A non-coaxial sampleflow compressed by the side ports, sam-ple width wy = 2.5 µm (qpo/qsh = 4,
qsh = 2µL/min, qsa = 0.1 µL/min).
flow rates of qsa = 0.4 µL/min and qpo/qsa = 10 which resulted in a samplewidth of around 10µm. The use of a non-coaxial sample flow prior to the sideports results in a sample width of 3µm (qsa = 0.1 µL/min, qsh = 2 µL/minand qpo/qsa = 80), see Figure 5.14. The ratio of qsh/qsa and the taper form anon-coaxial sample flow which has a width of around 17µm. Therfore usinga taper helps to reduce the sample width by the factor of 2.5.

Chapter 6
Conclusions
To summarize the output of this work and to conclude this thesis, a shortdiscussion and an outlook is given.
6.1 Discussion
6.1.1 Accomplishments
The primary idea of this work was to develop new microfluidic devices, basedon the ideas and devices from J. H. Nieuwenhuis, [1], with the aim to analysethe size limitations for the sample flow and the chip size as well. This workshows that five different devices could be developed, fabricated and tested.Prior knowledge could be proved and extended. In addition to this thefollowing things were done:� To increase the experimental possibilities non-coaxial and coaxial de-
vices were designed and analysed. The decision to add coaxial flu-idic devices opened up the opportunities to analyse idle streamingsample flows too. The developed non-coaxial devices could be usedto make detailed analysis of the flow profile and uniformity of thesample flow by Gabriel Hairer in [5] and will allow (with an addi-tional mask) impedance spectroscopy like it is described in the work ofS. Gawad [11].� The realised coaxial devices are able to focus and align sample streamsto the size of several micrometers. In addition to this the deviceswere realised under the design criteria of minimum sample dimensionsachieved with maximum channel dimensions.
44

CHAPTER 6. CONCLUSIONS 45� The focusing limits of the coaxial device No. I is about 2.5 ± 1 µm inthe horizontal and 10 ± 2 µm in the vertical dimension. Preliminaryexperimental results with the coaxial device No. III showed that thisdevice will be capable to push these limits easily. As the investigationsby Gabriel Hairer show, limits of 1.5 ± 1 µm in the horizontal and12 ± 2 µm vertical were achieved.� The theoretical study and the experimental verification of these coax-ial devices gave the know-how to characterize the sample flow by therelated parameters. The collected data showed how the size and shapeof the channel inlet have influence on the sample and at which ratiosthe used focusing techniques show the best performance to get the bestresults.� The need to analyse even the flow profile of the sample streams madeit necessary to find an alternative to conventional fluorescent photog-raphy. The most promising technique was the confocal laser scanningmicroscopy. To our knowledge, detailed confocal laser microscopic mea-surements and work methodology for microfluidic streams could beachieved for the first time at the department of this University.� The different designs were chosen under the aspect to give a lot offurther applications to future analysis and experiments, such as forflow cytometers and coulter counters, see Chapter 6.2 . Therefore thedeveloped devices still offer a lot of research potential which could bepartly used in recent investigations like in [5] .� Two different holder concepts were realised. One of them, Holder Auses a new way of sealing with a moulded silicone gasket. The directcomparison of the two holder concepts showed some significant practicaladvantages in fabrication and its use.� The total chip size could be reduced from 14 x 20 mm to only 6 x 9 mmwhich resulted in higher number of devices per wafer (4 inch size) andtherefore in reduced costs per fabricated device.
6.1.2 Unexpected facts� It seems that sample streams below 5% of the channel width are notpossible to achieve. There are at least two different reasons for that:First due to fast sample flow diffusion and second due to high flow rateswhich are related to focusing to small dimensions. Flow instabilitiesand oscillations from the syringe pumps, the pipes and unavoidable

CHAPTER 6. CONCLUSIONS 46
micro bubbles inside the channels and especially in the zones of theconnections make it difficult to achieve the theoretical limits that havebeen obtained by the finite element simulations.� The image quality of the microscope is at least negatively influencedby the covering glass-plate of the microdevice which has a thickness of500µm. This weakens the contrast in general and the ability to achievehigh resolution in the depth. For the investigations by Gabriel Hairerthe new batch of wafers were fabricated with covering glass-plates of200µm thickness. As it can be seen in the illustrations of the work andthe results a much better contrast and resolution could be achieved.� The holder concept, Holder B, with the conventional O-ring seals couldnot compete with Holder A at those small dimensions of the devices:The small O-ring seals showed very little elasticity and therefore onlylittle chances to compensate small gaps. The attempt to avoid largergaps would result in unreasonably small fabrication tolerances for aproper sealing. In practical use it was sometimes quite difficult toget sealed connections with this holder. The major drawback was thefact that the device was fixed via the PCB-panel onto the table of themicroscope. The bunch of six pipes generates always a torque thatforces the holder to tilt. Even if the O-ring seals are still tight thisresults in e.g. unpredictable unsymmetrical flow pressures from the sideports. Of course there are possibilities to support the pipes properly orto fix the microchip via the holder body instead via the PCB-panel, butthere are still the high requirements on the tolerances and the problemsof O-rings that jump out of their notches during setup. After all, theonly advantage of the higher surface pressure can not compete with thecomfort of simplicity and effectiveness of the holder concept with thesilicone gasket especially if smaller chip dimensions are desired.
6.1.3 Improvable aspects� In this work the total number of three pumps made it necessary todrive e.g. two syringes with one pump. In such a case only one flowparameter could be directly defined and the second was given by thesize-ratio of the used syringes. Beside this the size-ratio could onlybe chosen out of a small set of different syringes. This gave stronglimitations to the verification of the experimental part. To give evidencefor detailed aspects and to make general conclusions it is necessary todo measurements with equipment where all flow-parameters can be

CHAPTER 6. CONCLUSIONS 47
defined and controlled independently. This will result in more detailedperformance diagrams of the characterized devices.� To push the limit of the focused sample dimensions it will be usefulto analyse the characteristics of the pumps e.g. under the aspects oflimitations of the pressure they can drive. Maybe it will be necessaryto replace the pumps by a real pressure driven system like in [6] insteadof a flow rate driven system.� As experimental results by Gabriel Hairer show, who used the deviceswith a 200µm thin covering glass, thinner covering glasses increase theoptical resolution and the contrast of the confocal microscopic mea-surements a lot. The ideally thickness is of about 170µm thickness.This thickness will allow the use of high power microscope objectivelenses which are corrected to the standard cover slip of 170µm.
6.2 Outlook
The different designs were chosen to give a lot of further applications tofuture analysis and experiments. For example, the device No. III will allowto reduce the lower limits for the achievable sample limits even further dueto the smaller channel geometries. This is proven by the work of GabrielHairer, who used the device No. III to push these limits. Fabricating thewafers with an SU-8 layer of different thickness offers the opportunity tostudy the influence of the channel geometry on the shape of the sample flowmore detailed. In the case of the non-coaxial devices additional masks can bedesigned and added to the process flow to integrate, for example a Coulter-counter (see [11]). The designs allow further studies of focusing and aligningsample streams within a microchannel. The next possible step could be touse the technique of coaxial sheath flows for the purpose to align asymmetricparticles, e.g. long bacteria strings or proteins axial within the microchannel.

Chapter 7
Appendix
7.1 Lithographic Masks
48

CHAPTER 7. APPENDIX 49
Figure 7.1: Position and arrangement of the different devices on the wafer surface.The index numbers refer to Table 4.1.

CHAPTER 7. APPENDIX 50
Figure 7.2: ACAD layout of the lithographic mask for etching the holes into thesilicon wafer with KOH.

CHAPTER 7. APPENDIX 51
Figure 7.3: ACAD layout of the lithographic mask for the silver sacrificial layer.
CHAPTER 7. APPENDIX 52
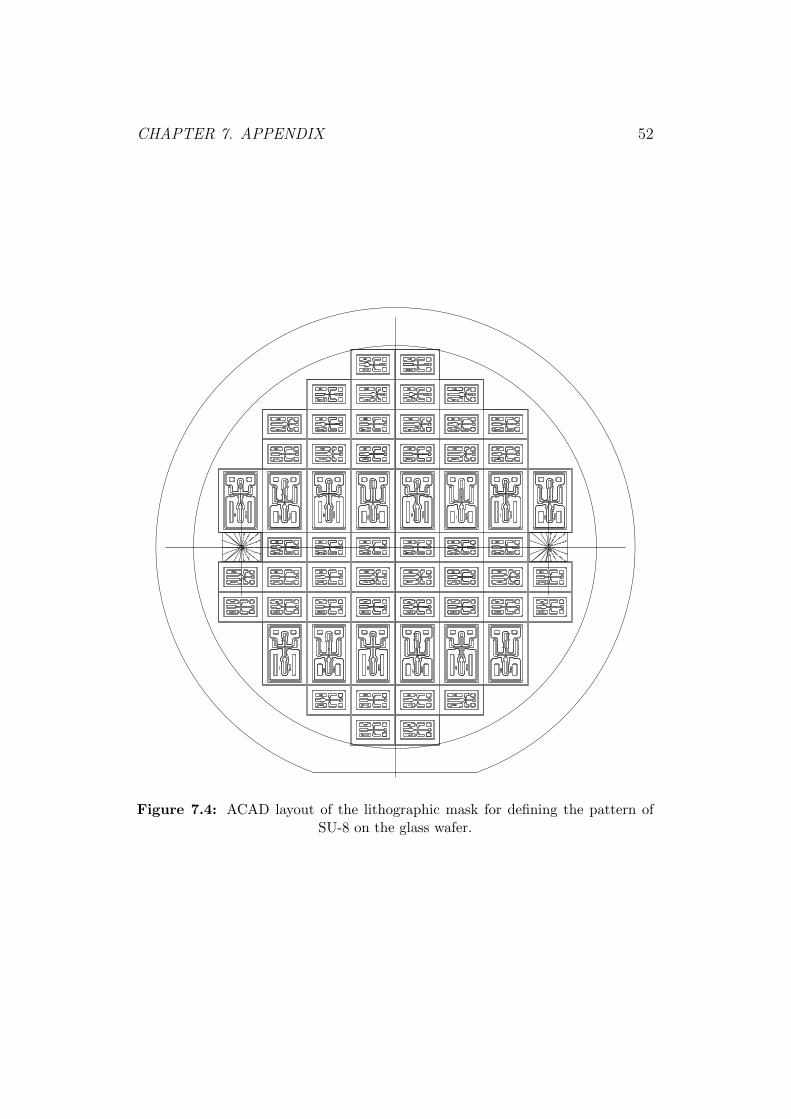
Figure 7.4: ACAD layout of the lithographic mask for defining the pattern ofSU-8 on the glass wafer.

CHAPTER 7. APPENDIX 53
7.2 Technical Drawings
Figure 7.5: ACAD drawing for fabrication of the mould.

List of Figures
2.1 Four different types of sheath flow: single layered (a), doublelayered (b), coaxial (c), non-coaxial (d) . . . . . . . . . . . . . 7
2.2 Concept for creating a non-coaxial sheath flow inside a mi-crochannel and controlling the shape of the sample flow withthe side ports. . . . . . . . . . . . . . . . . . . . . . . . . . . . 7
3.1 Lateral 2D simulation of the sample inlet (qsh = 1 µL/min andqsh/qsa = 1). The measurements, like in Fig. 3.2 were taken atposition A. . . . . . . . . . . . . . . . . . . . . . . . . . . . . . 11
3.2 Cross section plots of the varying concentration at positionA with flow ratios of qsh/qsa = (a) 0.1, (b) 1, (c) 10, (d) 25 andqsh = 1 µL/min . . . . . . . . . . . . . . . . . . . . . . . . . . 11
3.3 The height of the sample flow hx as a function of the flow ratioqsh/qsa at a flow rate of qsh = 1 µL/min and a lateral length ofthe inlet zinlet varying between 25 %, 100 % and 200 % of thechannel height H = 50 µm . . . . . . . . . . . . . . . . . . . . 12
3.4 The influence of the absolute qsh-value on hx as a function ata fixed lateral length of the inlet xinlet of 100 % of the channelheight H = 50 µm . . . . . . . . . . . . . . . . . . . . . . . . . 13
3.5 Noticeable back flow into the sample inlet with increased flowratio of qsh/qsa = 25 at qsh = 1 µL/min . . . . . . . . . . . . . 14
3.6 Coaxial-like sheath flow at a low flow ratio of qsh/qsa = 0.8and qsh = 10 µL/min . . . . . . . . . . . . . . . . . . . . . . . 14
3.7 Lateral 2D simulation of the uplifting port. The measurementswere taken at position B (q/qli = 5, q = 1 µL/min). . . . . . . 15
3.8 Varying concentration influenced by the uplifting inlet at po-sition B and q = 1 µL/min : q/qli =(a) 0.1, (b) 1, (c) 5 and(d) 25 . . . . . . . . . . . . . . . . . . . . . . . . . . . . . . . 15
54

LIST OF FIGURES 55
3.9 The position of the sample flow hx as a function of the flowratio q/qli at a flow rate of q = 1 µL/min and a lateral lengthof the inlet xinlet of 100 % of the channel height H = 50 µm.The parameter is the entrance height of the sample flow hsa
relative to H . . . . . . . . . . . . . . . . . . . . . . . . . . . 163.10 The width of the sample flow wx after passing the uplifting
port. Parameters similar to Figure 3.9. . . . . . . . . . . . . . 173.11 The influence of symmetric side ports (qsa = 1 µL/min and
qpo/qsa = 1) . . . . . . . . . . . . . . . . . . . . . . . . . . . . 173.12 Varying concentration at position C and qsa = 1 µL/min:
qpo/qsa =(a) 0.1, (b) 1, (c) 10 and (d) 100 . . . . . . . . . . . . 173.13 The correlation between the achievable width of the sample
flow wy and the flow ratio qpo/qsa . . . . . . . . . . . . . . . . 183.14 Top view of a taper (qsa = 1 µL/min and qpo/qsa = 1, w =
800µm, wsa = 80µm, channel height 50µm) . . . . . . . . . . . 183.15 Increasing the flow ratio qsh/qsa = (a) 0.5, (b) 5 illustrates how
the influence of diffusion gets less. (c) Shows a streamline plotwithout the influence of diffusion. Sample flow rate qsa =1 µL/min. . . . . . . . . . . . . . . . . . . . . . . . . . . . . . 19
3.16 The sample width w′
sa influenced by varying absolute valuesof qsh and the diffusion constant D, measured at position D.(a)qsh = 0.1 µL/min, D = 1 ∗ 10−9 m2/s, (b)qsh = 1 µL/min,D = 1 ∗ 10−9 m2/s, (c)qsh = 10 µL/min, D = 1 ∗ 10−10 m2/s . . 19
4.1 Size comparison of device No. 1, 6∗9 mm chip size and 900µmthickness. . . . . . . . . . . . . . . . . . . . . . . . . . . . . . 20
4.2 The fabricated 100 mm wafer, showing the relative size of thetwo chip sizes. . . . . . . . . . . . . . . . . . . . . . . . . . . 20
4.3 ACAD layout of the 100 mm wafer. The layouts of the singlelithographic masks can be found in the Appendix 7.1. . . . . . 23
4.4 Coaxial device No. I, small chip size. The double hatched areaindicates the hardened SU-8, the single hatched soft SU-8 forimproving the tightness and strength. The dashed lines rep-resent the etched cavities. . . . . . . . . . . . . . . . . . . . . 24
4.5 Coaxial device No. II, large chip size. . . . . . . . . . . . . . . 254.6 Coaxial device No. III, small chip size. 25µm width of the
main channel. . . . . . . . . . . . . . . . . . . . . . . . . . . . 264.7 Non-coaxial device No. V, large chip size. . . . . . . . . . . . . 274.8 Non-coaxial device No. VI, small chip size. . . . . . . . . . . . 284.9 Holder A together with all required parts . . . . . . . . . . . . 294.10 Holder B showing the arranged O-ring seals . . . . . . . . . . 29

LIST OF FIGURES 56
4.11 ACAD drawing of Holder A. See also the detailed cross section(indicated by Detail Z) and the object description in Fig. 5.6. . 30
4.12 Top view of the dissembled mould. The PMMA cover, themilled Al-body and metal pins define the geometry of the Sili-cone gasket. A moulded gasket lies in front of the other parts.See also Fig. 7.5. . . . . . . . . . . . . . . . . . . . . . . . . . . 31
4.13 Injecting the liquid silicone mixture by means of a conven-tional medical-syringe into the mould. The mould is kept inan upright position for curing to allow air bubbles leaving themould through the drain. . . . . . . . . . . . . . . . . . . . . . 31
4.14 The table of the microscope together with the mounted holder,panel and the connecting pipes. . . . . . . . . . . . . . . . . . 32
4.15 The micro devices and the milled disposable panels, made fromconventional epoxy-resin glass fiber. . . . . . . . . . . . . . . . 32
4.16 Fabrication steps of the improved SU-8 wafer bonding tech-nique. Taken from [18]. . . . . . . . . . . . . . . . . . . . . . . 33
5.1 The confocal laser microscope Nikon Digital Eclipse C1. . . . 355.2 The KDScientific Model 200 syringe pumps allow to drive two
syringes at once. . . . . . . . . . . . . . . . . . . . . . . . . . 365.3 Holder B together with the auxiliary parts (panel, pipes and
fluid filter units. . . . . . . . . . . . . . . . . . . . . . . . . . . 365.4 The principle of confocal laser scanning microscopy. The pin-
hole ensures that only beams from a certain focal plane reachthe detector. . . . . . . . . . . . . . . . . . . . . . . . . . . . . 38
5.5 The microfluidic chip mounted headlong onto the table of themicroscope. Seen from below, showing the objective lens andthe scanning laser light reflected by the microchip. . . . . . . . 38
5.6 Cross section drawing of holder A showing the etched cavities.(1) cover glass, (2) Silicon, (3) silicone gasket, (4) cyanoacrylglue, (6) PMMA holder body and a (7) silicone pipe (shownwith only one silicone pipe mounted) . For further descriptionsee Fig. 4.11. . . . . . . . . . . . . . . . . . . . . . . . . . . . . 39
5.7 Perspective view of the sample flow streaming through thesample inlet into the microchannel (qsh/qsa = 40, qsa = 0.1 µL/min).The box marks the image area of the confocal measurement. . 40
5.8 Influence of increasing qsh/qsa above the limit of qpo/qsa = 80(qpo/qsa = (a) 200, (b) 400 and (c) 800) . . . . . . . . . . . . . 40
5.9 Lateral cross section: The influence of the uplifting port ona non-coaxial flow (qsh/qsa = 25, qsa = 1 µL/min and qli =12.5 µL/min). . . . . . . . . . . . . . . . . . . . . . . . . . . 41

LIST OF FIGURES 57
5.10 Top view (see also Figure 5.9). . . . . . . . . . . . . . . . . . 415.11 Perspective view (see also Figure 5.9). . . . . . . . . . . . . . 425.12 Sample flow profiles: (a) before and (b) after the uplifting
port. (c) shows the compression of the symmetrically flow ofthe side ports (qsh/qsa = XXX, qsa = XXX µL/min). Thedotted line marks the border where in the digital data thecontrast drops down to 50%. . . . . . . . . . . . . . . . . . . . 42
5.13 Side port pressure forming a double layered sheath flow (qpo/qsa =10, qsa = 0.4 µL/min). Compression to a width of wy = 10 µm. 43
5.14 A non-coaxial sample flow compressed by the side ports, sam-ple width wy = 2.5 µm (qpo/qsh = 4, qsh = 2 µL/min, qsa =0.1 µL/min). . . . . . . . . . . . . . . . . . . . . . . . . . . . . 43
7.1 Position and arrangement of the different devices on the wafersurface. The index numbers refer to Table 4.1. . . . . . . . . . 49
7.2 ACAD layout of the lithographic mask for etching the holesinto the silicon wafer with KOH. . . . . . . . . . . . . . . . . . 50
7.3 ACAD layout of the lithographic mask for the silver sacrificiallayer. . . . . . . . . . . . . . . . . . . . . . . . . . . . . . . . . 51
7.4 ACAD layout of the lithographic mask for defining the patternof SU-8 on the glass wafer. . . . . . . . . . . . . . . . . . . . . 52
7.5 ACAD drawing for fabrication of the mould. . . . . . . . . . . 53

Bibliography
[1] J. H. Nieuwenhuis et al., “Integrated flow-cells for novel adjustablesheath flows,” Lab Chip, vol. 3, pp. 56–61, 2003.
[2] Z. Wu et al., “Hydrodynamic focusing in microchannels under considera-tion of diffusive dispersion: Theories and experiments,” Sens. ActuatorsB, vol. 107, pp. 965–974, 2005.
[3] G.-B. Lee et al., “The hydrodynamic focusing effect inside rectangularmicrochannels,” J. Micromech. and Microeng., vol. 16, pp. 1024–1032,2006.
[4] N. Sundarajan et al., “Three-dimensional hydrodynamic focusing inpolydimethylsiloxane (pdms) microchannels,” JMEMS, vol. 13-4, pp.9559–567, 2004.
[5] G. Hairer et al., “Analysis of micrometer sample flows in a non coaxialsheath flow device,” Transducers 2007 and Eurosensors XXI (acceptedfor publication).
[6] J. B. Knight et al., “Hydrodynamic focusing on a silicon chip: Mixingnanoliters in microseconds,” Physical Review Letters, vol. 80, pp. 3863–3866, 1998.
[7] N.-T. Nguyen et al., Fundamentals and Applications of Microfluidics,1st ed. Norwood, MA02062, USA: Artech house, Inc., 2002.
[8] Fox and McDonald, Introduction to Fluid Mechanics. New York, USA:Wiley, 1999.
[9] P. A. Thompson et al., “A general boundary condition for liquid flow atsolid surfaces,” Nature, vol. 389, pp. 360–362, 1997.
[10] J. Berthier and P. Silberzahn, Microfluidics for Biotechnology. Nor-wood, MA02062, USA: Artech house, Inc.
58

BIBLIOGRAPHY 59
[11] S. Gawad et al., “Micromachined impedance spectroscopy flow cytome-ter for cell analysis and particle sizing,” Lab Chip, vol. 1, pp. 76–82,2001.
[12] D. Huh et al., “Microfluidics for flow cytometric analysis of cells andparticles,” IOP Publishing Ltd., vol. 26, pp. R73–R98, 2005.
[13] R. Yang et al., “Microfabrication and test of a three-dimensional poly-mer hydro-focusing unit for flow cytometry applications,” Sens. Actua-tors A, vol. 118, pp. 259–267, 2005.
[14] G. Hairer et al., “Experiments on hydrodynamic focusing of non coaxialsheath flows,” Proceedings of IEEE Sensors 2006, pp. 431–434.
[15] (2007) The COMSOL website. [Online]. Available: http://www.comsol.com/
[16] A. Wolff et al., “Integrating advanced functionality in a microfabricatedhigh-throughput fluorescent-activated cell sorter,” Lab Chip, vol. 3, pp.22–27, 2003.
[17] S. Shoji et al., “Design and fabrication of micromachined chemi-cal/biochemical systems,” RIKEN Review, vol. 36, pp. 8–11, 2001.
[18] P. Svasek et al., “Fabrication of miniaturized fluidic devices using su-8 based on lithographic and low temperature wafer bonding,” Sens.Actuators A, vol. 115, pp. 591–599, 2004.
[19] W. Wu et al., “Mems-based flow cytometry: Microfluidics-based cellidendification system by fluorescent imaging,” 26th Annual Interna-tional Conference of the IEEE EMBS, pp. 2579–2581, 2004.
[20] C. Simonnet et al., “Two-dimensional hydrodynamic focusing in a simplemicrofluidic device,” Applied Physics Letters, vol. 87, p. 114104, 2005.
[21] (2007) The Wikipedia website. [Online]. Available: http://www.wikipedia.com/


![THERMAL BONDING OF POLYMER MICRODEVICES … · · 2013-02-27THERMAL BONDING OF POLYMER MICRODEVICES USING A PRESSURE -ASSISTED BOILING POINT CONTROL SYSTEM Taehyun Park 1, ... [Pa]](https://static.fdocuments.in/doc/165x107/5abf715d7f8b9aa15e8e0473/thermal-bonding-of-polymer-microdevices-bonding-of-polymer-microdevices-using.jpg)