Microarray and NGS data analysis with Chipster › gpcf › fileadmin › downloads ›...
17
1 12.-14.6.2013 Eija Korpelainen, Massimiliano Gentile [email protected] Microarray and NGS data analysis with Chipster Course outline Introduction to Chipster Microarray data analysis • Importing microarray data to Chipster • Normalization • Quality control (inc. clustering) • Filtering • Statistical testing, including linear modeling • Pathway analysis • Saving and sharing workflows NGS data analysis • Quality control • Preprocessing • Alignment • Differential expression analysis
Transcript of Microarray and NGS data analysis with Chipster › gpcf › fileadmin › downloads ›...

1
12.-14.6.2013Eija Korpelainen, Massimiliano Gentile
Microarray and NGS data analysis with
Chipster
Course outlineIntroduction to ChipsterMicroarray data analysis • Importing microarray data to Chipster• Normalization• Quality control (inc. clustering)• Filtering• Statistical testing, including linear modeling• Pathway analysis• Saving and sharing workflows
NGS data analysis• Quality control• Preprocessing• Alignment• Differential expression analysis

2
Introduction to Chipster
Open source software with emphasis on usabilityEnables life scientists with no programming skills to• analyse and integrate high-throughput data• visualize data efficiently• save and share automatic workflows
Chipster

3
Analysis functionality, overview110 NGS tools for• ChIP-seq• RNA-seq• miRNA-seq• MeDIP-seq• CNA-seq• DNA-seq
140 microarray tools for• gene expression• miRNA expression• protein expression• aCGH• SNP• integration of different data
Tools served in a user-friendly manner• Vocabulary, parameter selection• ”Bigger” tools to avoid unnecessary steps

4
Interactive visualizations
Technical aspectsClient-server system• Enough CPU and memory for NGS jobs• Centralized maintenance
Easy to install• Client uses Java Web Start• Server available as a virtual machine

5
What can I do with Chipster?
Life scientist• Analyze, visualize and integrate your data• Share workflows and analysis sessions with colleagues
Bioinformatician• Offload routine tasks to biologists • Prepare workflows for them• Customize Chipster for your users by adding new tools
Analysis method developer• Easy way to provide a biologist-friendly GUI for your tool,
thereby enlarging the user community
More info
http://chipster.csc.fi
http://chipster.sourceforge.net/
BMC Genomics 2011, 12:507

6
Using Chipster: general aspects
Chipster start and info page: chipster.csc.fi

7
Select dataSelect tool categorySelect tool (set parameters if necessary) and click runView results
Mode of operation
Workflow view
Shows the relationships of the data sets
Right clicking on the data file allows you to • Save an individual result file (”Export”) • Delete• Link to another data file• Save workflow
You can move the boxes around, and zoom in and out.
Select several files by keeping the Ctrl key down

8
Analysis sessions
In order to continue your work later, you have to save the analysis session. Saving the session will save all the files and their relationships. The session is packed into a single .zip file and saved on your computer• in the next Chipster version you can also save it on the server
Session files allow you to continue the work on another computer, or share it with a colleague.You can have multiple analysis sessions saved separately, and combine them later if needed.
Workflow – reusing and sharing your analysis pipeline
You can save your analysis steps as a reusable automatic ”macro”, which you can apply to another dataset
When you save a workflow this way, all the analysis steps and their parameters are saved as a script file, which you can share with other users

9
Saving and using workflowsSelect the starting point for your workflow and click”Workflow/ Save starting fromselected”
You can save the workflowfile anywhere on yourcomputer and change itsname, but the ending must be.bsh.
To run a workflow select• Workflow->Open and run• Workflow->Run recent (if
you saved the workflow recently).
Automatic tracking of analysis history

10
You can run many analysis jobs at the same timeYou don’t need to wait that one task finishes before submitting another oneUse Task manager to
• view status• cancel jobs• view time, parameters
Data visualizations

11
Visualizing the dataData visualization panel• Maximize and redraw for better viewing• Detach = open in a separate window, allows you to view several
images at the same time
Two types of visualizations
1. Interactive visualizations produced by the client program• Select the visualization method from the pulldown menu• Save by right clicking on the image
2. Static images produced by analysis tools• Select from Analysis tools/ Visualisation• View by double clicking on the image file• Save by right clicking on the file name and choosing ”Export”
Interactive visualizations by the clientSpreadsheetHistogramVenn diagramScatterplot3D scatterplotVolcano plotExpression profilesClustered profilesHierarchical clusteringSOM clusteringGenome browser
Available actions:• Select genes and create a gene list• Change titles, colors etc• Zoom in/out
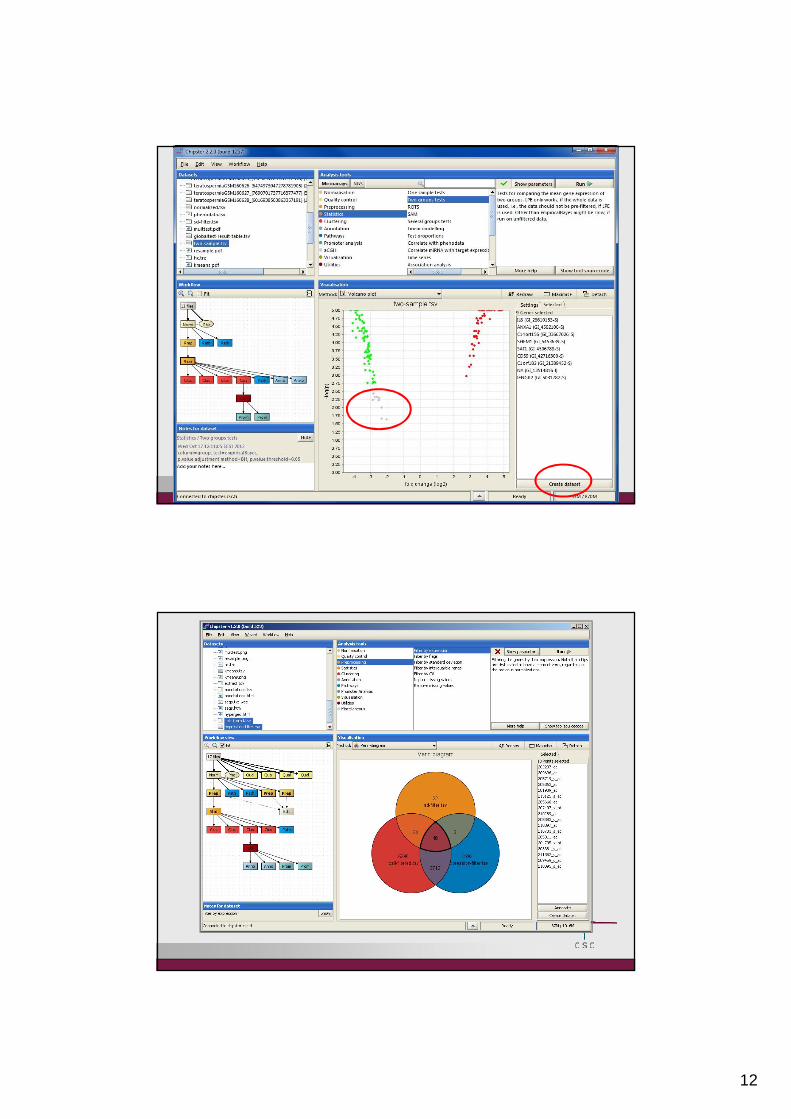
12

13
Static images produced by R/Bioconductor
Box plotHistogramHeatmapIdiogramChromosomal positionCorrelogramDendrogramNMDS plotQC stats plotRNA degradation plotK-means clusteringSOM-clusteringetc
14
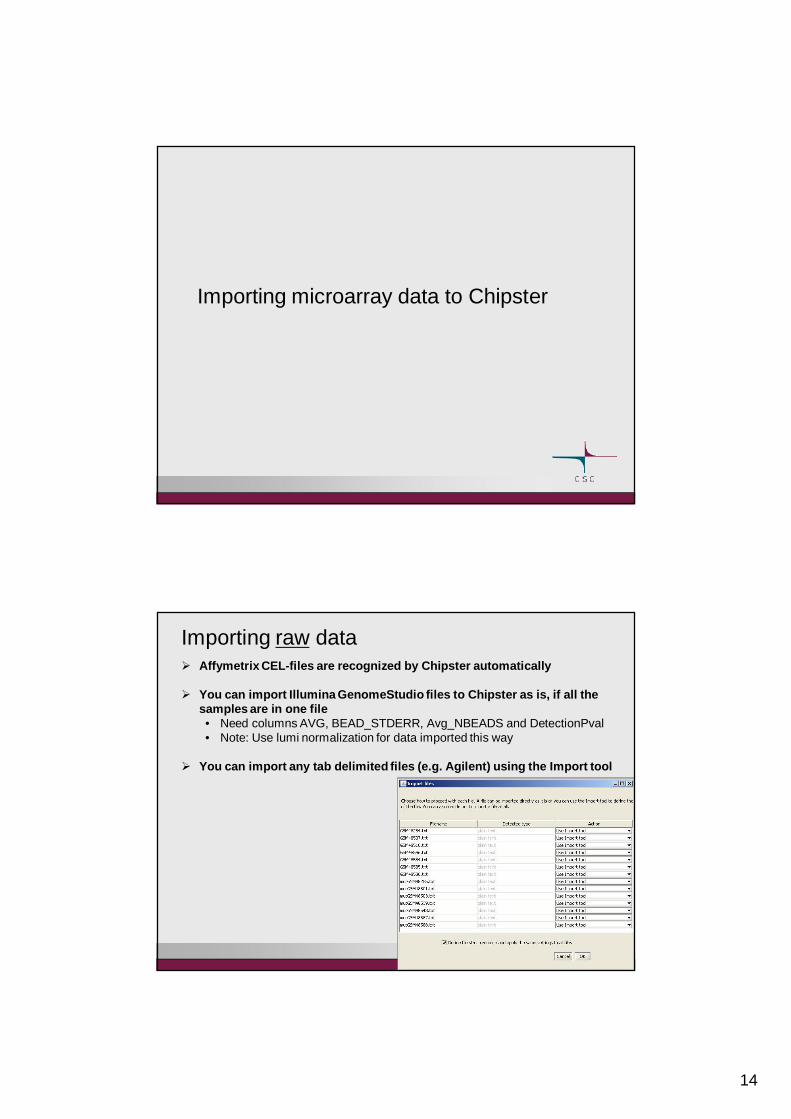
Importing microarray data to Chipster
Importing raw dataAffymetrix CEL-files are recognized by Chipster automatically
You can import Illumina GenomeStudio files to Chipster as is, if all the samples are in one file • Need columns AVG, BEAD_STDERR, Avg_NBEADS and DetectionPval• Note: Use lumi normalization for data imported this way
You can import any tab delimited files (e.g. Agilent) using the Import tool
15
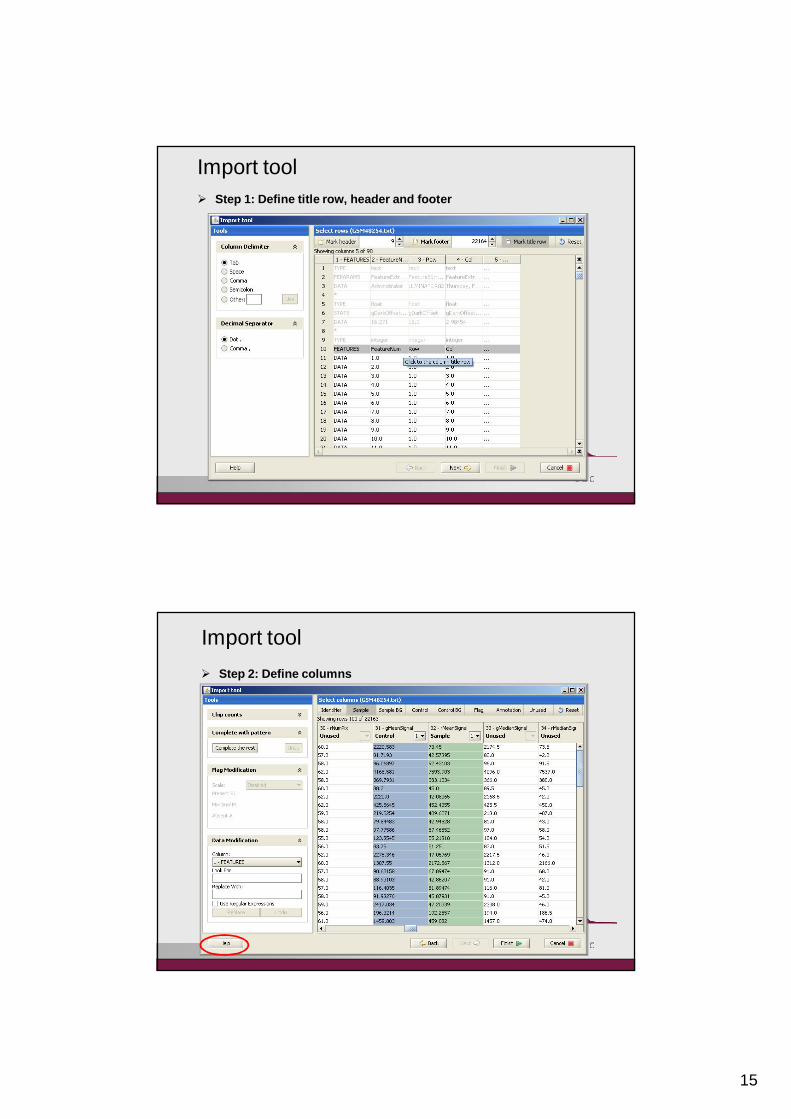
Import tool Step 1: Define title row, header and footer
Import toolStep 2: Define columns

16
Which columns to mark in Import tool?
http://chipster.csc.fi/manual/import-help.html
Agilent• Identifier (ProbeName)• Sample (rMeanSignal or rMedianSignal) • Sample background (rBGMedianSignal) • Control (gMeanSignal or gMedianSignal) • Control background (gBGMedianSignal)• Flag (Control type)
Illumina BeadStudio version 3 file and GenomeStudio files• Identifier (ProbeID)• Sample (text “AVG”)
Illumina BeadStudio version 1-2 file• Identifier (TargetID)• Sample (text “AVG”)
1-color2-color
1. Practise importing Illumina data in two ways Import Illumina data directly and normalize with the lumi tool• Select File / Import files. • Select the file IlluminaHuman6v1_BS1.tsv. • In the Import files -window choose the action "Import directly“• Select the file and the tool Normalization/ Illumina – lumi pipeline.
Set the chiptype parameter to Human and click Run.
Import the same file using the Import tool and normalize • In the Import files -window choose the action “Use Import tool”• Click the Mark title row –button and click on the title row of the data.• Click Next. Click the Identifier –button and click on the TargetID
column. Click the Sample –button and click on all the AVG columns.• Select the 6 files and tool Normalization/ Illumina. Set parameters so
that Illumina software version = BeadStudio1, identifier type = TargetID and chiptype = Human-6v1.

17
Importing normalized data
The data should be tab delimited and preferably log-transformed• If your data is not log-transformed, you can transform it with the tool
“Change interpretation”
Bring the data file in using the Import tool. Mark the identifier column and all the sample columns.
Run the tool Normalize / Process prenormalized. This• Converts data to Chipster format by adding ”chip.” to expression
column names• Creates the phenodata file. Indicate chiptype using names given at
http://chipster.csc.fi/manual/supported-chips.html
Microarray data analysis flow chart