NGS data analysis and visualization with Chipster - Prace … · · 2012-07-19NGS data analysis...
37
1 Eija Korpelainen, Massimiliano Gentile [email protected] NGS data analysis and visualization with Chipster Program, day 1 Introduction to Chipster Quality control • FastQC, PRINSEQ Filtering and trimming reads • PRINSEQ, FastX Mapping (= aligning) reads to reference genome • Bowtie, BWA, TopHat Manipulation of alignment files (BAM) • SAMtools: Statistics, sorting, indexing, making subsets Matching sets of genomic regions • HTSeq, BEDtools: counting reads per gene, etc Visualization of reads and results in their genomic context • Chipster genome browser
-
Upload
trinhthuan -
Category
Documents
-
view
224 -
download
2
Transcript of NGS data analysis and visualization with Chipster - Prace … · · 2012-07-19NGS data analysis...

1
Eija Korpelainen, Massimiliano Gentile
NGS data analysis and visualization with
Chipster
Program, day 1
Introduction to Chipster
Quality control
• FastQC, PRINSEQ
Filtering and trimming reads
• PRINSEQ, FastX
Mapping (= aligning) reads to reference genome
• Bowtie, BWA, TopHat
Manipulation of alignment files (BAM)
• SAMtools: Statistics, sorting, indexing, making subsets
Matching sets of genomic regions
• HTSeq, BEDtools: counting reads per gene, etc
Visualization of reads and results in their genomic context
• Chipster genome browser

2
Program, day 2
RNA-seq
• Finding differentially expressed genes (Cufflinks)
• Pathway analysis
miRNA-seq
• Finding differentially expressed miRNAs, both known and novel
(edgeR, DESeq)
• Retrieving target genes, pathway analysis
ChIP-seq
• Peak detection
• Retrieving nearby genes, pathway analysis
• Motif finding and matching to known TF database
Introduction to Chipster

3
Goal of Chipster is to enable biologists to
analyse and integrate high-throughput data
visualize results efficiently
save and share automatic workflows
Chipster: User-friendly software for high throughput data - with interactive visualizations and workflow functionality

4
Chipster 1.4 140 microarray analysis tools for
• gene expression
• miRNA expression
• protein expression
• aCGH
• SNP
• integration of different data types
Chipster 2.0 >60 analysis tools for
• ChIP-seq
• RNA-seq
• miRNA-seq
• MeDIP-seq
• CNA-seq
Integrated genome browser
+
Chipster: Client-server system - centralized maintenance, more CPU and memory

5
Chipster: Free, open source, easy to install - Finnish universities can use CSC’s Chipster server free of charge
- Others can buy access to CSC’s server, or set up their own server for free
Chipster: Easy to add analysis tools - Command line, R-based, Web services,..

6
What can I do with Chipster?
Biologist
• Analyze, visualize and integrate your data
• Share workflows and analysis sessions with colleagues
Bioinformatician
• Offload routine tasks to biologists
• Prepare workflows for them
• Customize Chipster for your users by adding new tools
Analysis method developer
• Easy way to provide a GUI for your tool, thereby enlarging the
user community
More info
http://chipster.csc.fi
http://chipster.sourceforge.net/
BMC Genomics 2011, 12:507

7
Chipster NGS functionality – part I Quality control, filtering, trimming
• FastX
• FastQC
• PRINSEQ
Mapping (alignment)
• Bowtie
• BWA
• Tophat
Processing
• Picard, SAMtools (also used for variant calling)
Visualization of reads and results in their genomic context
Genomic region matching
• BEDTools
• HTSeq
• In-house tools
NGS data analysis functionality – part II
ChIP-seq
• Peak detection and filtering (MACS)
• Motif detection and matching to JASPAR (MotIV, rGADEM)
• Retrieve nearby genes, pathway analysis (GO, ConsensusPathDB)
miRNA-seq
• Differential expression (edgeR, DESeq)
• Retrieve target genes (PicTar, miRBase,TargetScan, miRanda,..)
• Pathway analysis (GO, KEGG)
RNA-seq
• Differential expression (Cufflinks, edgeR, DESeq)
MeDIP-seq
• Methylation analysis, comparison of two conditions (MEDIPS)
CNA-seq

8
Chipster start and info page: chipster.csc.fi
Select data
Select tool category
Select tool (set parameters if necessary) and click run
View results
Chipster: mode of operation

9
Workflow view
Shows the relationships of the data sets
Right clicking on the data file allows you to
• Save an individual result file (”Export”)
• Delete
• Link to another data file
• Save workflow
Zoom in/out or fit to the panel. You can also
move the boxes around
Select several datasets by keeping the Ctrl
key down
Automatic tracking of analysis history

10
Analysis sessions
In order to continue your work later on, you have to save the
analysis session
Saving the session will save all the datasets and their
relationships. The session is packed into a single .zip file and
saved on your computer.
Session files allow you to continue the work later, on another
computer, or share it with a colleague.
You can have multiple analysis sessions saved separately, and
combine them later if needed.
Workflow – reusing and sharing your
analysis pipeline
Chipster allows you to save your analysis workflow as a
reusable automatic ”macro”, which can be applied to another
dataset
All the analysis steps and their parameters are saved as a
script file, which you can share with other users

11
Saving and using workflows
After completing your
analysis, select the starting
point for your workflow and
click ”Workflow/ Save starting
from selected”
You can save the workflow
file anywhere on your
computer and change its
name, but the ending must be
.bsh.
To run a workflow select
• Workflow->Open and run
• Workflow->Run recent (if
you saved the workflow
recently).
Importing data to Chipster

12
Different ways of importing data to Chipster
Import a file
• Go to Files / Import files (note that you can select several files by
keeping the Crtl key down)
• FASTQ, BAM, BED, VCF and GTF files are recognized automatically
• SAM/BAM and BED files can be preprocessed at the import stage
(sort and index BAM, sort BED)
If all your files are in the same folder, you can import the whole
folder
• Go to Files / Import folder
If you want to continue an existing analysis session
• Go to Files / Open session
File formats: FASTQ (.fastq / .fq / .txt)
Four lines per read:
• Line 1 begins with a '@' character and is followed by a sequence identifier.
• Line 2 is the sequence.
• Line 3 begins with a '+' character and can be followed by the sequence identifier.
• Line 4 encodes the quality values for the sequence, encoded with a single ASCII
character for brevity.
• Example:
@SEQ_ID
GATTTGGGGTTCAAAGCAGTATCGATCAAATAGTAAATCCATTTGTTCAACTCACAGTTT
+
!''*((((***+))%%%++)(%%%%).1***-+*''))**55CCF>>>>>>CCCCCCC65
http://en.wikipedia.org/wiki/FASTQ_format
13
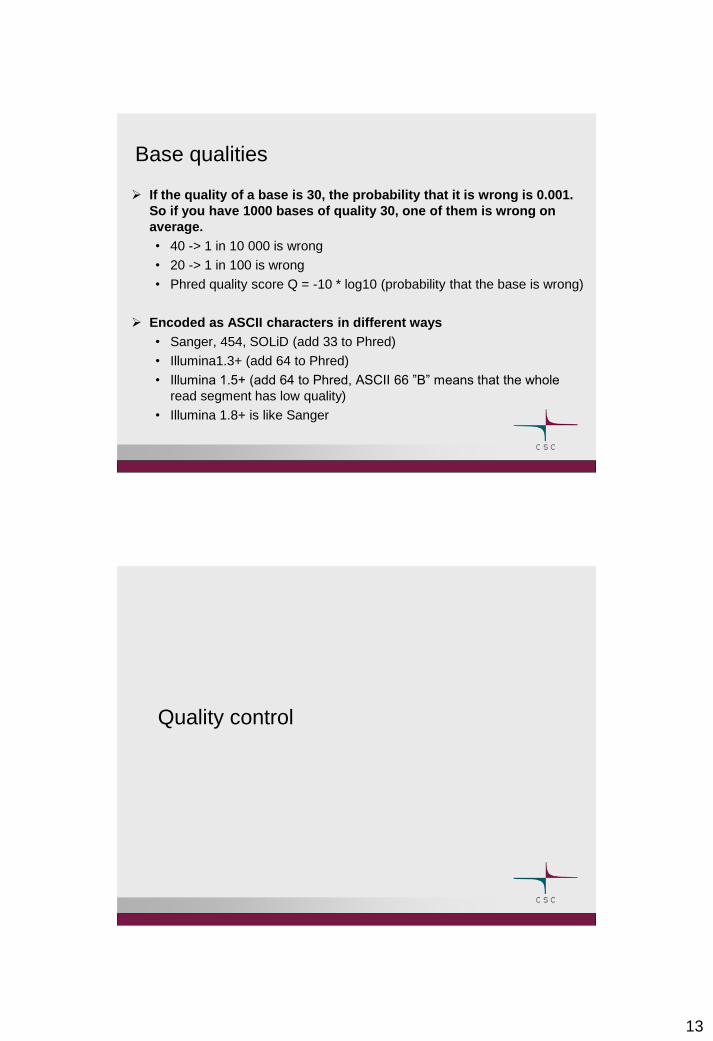
Base qualities
If the quality of a base is 30, the probability that it is wrong is 0.001.
So if you have 1000 bases of quality 30, one of them is wrong on
average.
• 40 -> 1 in 10 000 is wrong
• 20 -> 1 in 100 is wrong
• Phred quality score Q = -10 * log10 (probability that the base is wrong)
Encoded as ASCII characters in different ways
• Sanger, 454, SOLiD (add 33 to Phred)
• Illumina1.3+ (add 64 to Phred)
• Illumina 1.5+ (add 64 to Phred, ASCII 66 ”B” means that the whole
read segment has low quality)
• Illumina 1.8+ is like Sanger
Quality control
14
What and why?
Potential problems
• low-quality sequences
• sequence artifacts
• sequence contamination
• Examples: low confidence bases, Ns, duplicate reads,
location bias, adapters, another organism…
Knowing about potential problems in your data allows you to
correct for them before you spend a lot of time on analysis
take them into account when interpreting results
Software packages for quality control
FastQC (available in Chipster)
FastX (available in Chipster)
PRINSEQ (available in Chipster, excellent for 454 data)
• Memory issues: use a subset of FASTQ file for this tool
HTSeq QC scripts
SolexaQA
TagDust

15
Quality control measurements
Quality plots
• Per base
• Per sequence
Composition plots
• Per base composition
• GC content and profile
Contaminant identification
• Overrepresented sequences and k-mers
• Duplicate levels
Per base sequence quality plot (FastQC)
Green = good
Orange = sus
Red = bad

16
Mean of quality scores plot (PRINSEQ)
Per base sequence content plot (FastQC)

17
RNA-seq with Illumina
“Random” primers, enzyme preferences?
Correct sequence but biases your reads -> keep in mind
Occurence of Ns plot (PRINSEQ)

18
Duplicate reads plot (PRINSEQ)
Low complexity plots (PRINSEQ)

19
Filtering and trimming low quality reads
Filter and trim low quality reads: FastX
Filter sequences based on quality
• Decide what is the minimum quality value allowed (often 20)
• Decide what percentage of bases in a read are required to have
this quality value or higher
Trim a certain number of bases from all reads
• Decide how many bases should be trimmed and from which end
Filter reads for adapters, ambiguous nucleotides (N) and length
• Give the adapter sequence and decide what is the minimum
allowed sequence length after clipping

20
Filter low quality reads: PRINSEQ
Filter sequences based on quality scores
• Min/ max quality score per base, mean of quality scores
Filter for low complexity
• DUST (score 1-100, > 7 means low complexity)
• Entropy (score 1-100, < 70 means low complexity)
Filter for Ns
• Maximum count/ percentage of Ns that a read is allowed to have
Filter for length
• Min/ max length of a read
Filter for duplicates
• Exact, reverse complement, or 5’/3’ duplicates
Filter for several criteria
• All above, and possibility to get filtered pairs for paired end data
Trim low quality reads: PRINSEQ
Trim based on quality scores
• Min, mean
• In a sliding window
• From 3’ or 5’ end
Trim polyA/T tails
• Minimum number of A/Ts
• From left or right
Trim based on several criteria
• All above
• Trim x bases from left/ right
• Trim to length x

21
Map (=align) reads to reference genome
Why?
Most NGS applications (apart from de novo assembly)
require mapping the reads to a reference
• RNA-seq
• Re-sequencing, variant detection
• ChIP-seq
• Assembly by mapping
• Methyl-seq
• CNA-seq
Mapping can seriously affect the analysis results
22
Software packages for mapping
Bowtie (available in Chipster)
TopHat (available in Chipster)
BWA (available in Chipster)
Stumpy, Novoalign
MAQ
...
Differences in speed, memory consumption, handling indels
and spliced reads
Bowtie (v1, note that Bowtie v2 is different)
Fast and memory efficient (Burrows-Wheeler index)
Does not support gapped alignments (for indels, use BWA)
Two modes
• Limit mismatches across the whole read (v).
• Limit mismatches only in a user-specified seed region (n). The sum
of qualities of all mismatch positions is not allowed to exceed a
user-specified number.
Bowtie’s own default parameters give the first alignment found,
even if it is not the best one. Chipster uses the “best” and
“strata” options to get the best class alignments

23
Best and strata – what do they do?
Best
• If a read has several alignments, “-best” forces Bowtie to report
them in the best-to-worst order (best is the one with least
mismatches).
Strata
• Forces Bowtie to classify alignments to different categories
(stratum) based on the number of mismatches. Only the
alignments of the best category are considered.
• Example: Allowing two mismatches, a read has three alignments:
• A: 0 mismatches, B: 2 mismatches, C: 2 mismatches
• A belongs to the best category, B and C form the second category
• If you ask Bowtie to report reads which have only one best category hit, this
read will be reported (even if it has three alignments)
Bowtie tools in Chipster
If your reference genome is publicly available, use
• Bowtie for single end reads
• Bowtie for paired end reads
• Please email [email protected] if a genome needs to be added
If your reference genome is private, use
• Bowtie for single end reads and own genome
• Bowtie for paired end reads and own genome
Note that Chipster’s Bowtie tools give you sorted and indexed
BAM files (as we have included SAMtools processing in them)
• This way alignments are ready to be viewed in the Chipster
genome browser
24
Bowtie for single end reads - parameters
Genome or transcriptome (human, mouse, rat,…)
Number of mismatches allowed (0, 1, 2, 3)
Consider mismatches only in the seed region (yes, no)
• Length of the seed region (5-50) [28]
• Allowed total of mismatch qualities (10-100) [70]
• Quality value format used (Sanger, Illumina GA v1.3-1.5)
How many best category hits is a read allowed to have (1, 2, no limit)
How many valid alignments are reported per read (1, 2, 3)
Put multireads to a separate file (yes, no)
Put unaligned reads to a separate file (yes, no)
Bowtie for paired end reads - parameters
As in Bowtie for single end reads, but in addition
• Minimum insert size (0-1000) [0]
• Maximum insert size (50-1500) [250]
• Upstream-downstream mate orientation (mate1 upstream of reverse
complement of mate2 or vice versa, upstream mate1 reverse-
complemented and mate2 forward-oriented)
Note that Bowtie doesn’t use the -best and -strata options in the
paired end mode. However, the orientation and distance
requirements bring additional constraint against random hits.
• ”How many places is a read allowed to align to” (instead of best
category hits)
25
TopHat
Aligns RNA-Seq reads to genome to identify splice junctions.
Supports both single and paired end reads. Optimized for reads
longer than 75bp.
Identifies potential exons by mapping the reads against a
reference genome with Bowtie.
• All input reads are first split into 25 b segments, which are mapped
independently (because reads are often longer than exons)
Builds a database of possible splice junctions using this initial
mapping. Junctions are then confirmed by mapping spliced
reads against them.
Evidence for possible splice junctions
• Pairings of coverage islands
• Two segments from the same read are mapped far apart
• Subsequences which have the same length as the expected
distance between mates (only for paired end reads)
TopHat parameters
Genome to align against
Minimum anchor length [8]
• How many bases need to be on each side of a junction
Maximum number of mismatches in the anchor [0]
Minimum isoform fraction [0.15]
• How many reads should support a junction and what is the relative
amount of them if compared to the nearby exon coverage
Minimum intron length
Maximum intron length
Expected inner distance between mate pairs
When GTF is supplied, ignore novel junctions [yes]
• Note that GTF is automatically supplied from the server for human,
mouse and rat

26
TopHat junctions.bed file
Blocks specify the regions on either side of the junction
Columns
• 1 = start position of the leftmost read that contain the junction
• 4 = number of reads that contain that junction
• 9 = block count
• 10 = block sizes (how large the region is)
• 11 = block location (where the two blocks occur)
BWA
Performs gapped alignments
Two aligning algorithms available:
BWA for short ( < 200 bp) good quality reads (error rate <3%)
BWA-SW for longer reads (for single-end reads only)

27
BWA parameters Strict seed region matching during the first alignment cycle
seed length (starts from the beginning of the read)
max number of seed region differences
this step is ignored if the seed length is longer than the read
Gapped alignment is computed during the second cycle
Normal alignment parameters: mismatch, gap opening, gap
extension, total number of gaps
Quality based trimming
Disallowed regions for gaps
Only good enough alignments are reported
maximum edit distance
maximum number of gaps and gap extensions
mismatch penalty threshold
max. number of alignments for a read
BWA in Chipster
Separate tools for single-end and paired end-data
Reference genome indexes currently for human, mouse and rat
Let us know if other reference genomes need to be added
You can use your own reference too, but indexing may take
some hours
Reference genome in FASTA format

28
Manipulating BAM files
SAM file format (.sam)
SAM (Sequence Alignment/Map) is a tab-delimited text file containing
read alignment data
Contains a header (optional) and an alignment section. Each alignment
line has 11 mandatory fields:
• read name, flag, reference name, position, mapping quality, CIGAR,
mate name, mate position, fragment length, sequence, base qualities
CIGAR reports match (M), insertion (I), deletion (D), intron (N), etc
Example:
• Alignment
Ref AGCATGTTAGATAA**GATAGCTGTGCTAGTAGGCAGTCAGCGCCAT
r001 TTAGATAAAGGATA*CTG
• The corresponding SAM file
@HD VN:1.3 SO:coordinate
@SQ SN:ref LN:45
r001 163 ref 7 30 8M2I4M1D3M = 37 39 TTAGATAAAGGATACTG *
29
BAM file format (.bam) and index (.bai)
BAM (Binary Alignment/Map) is the binary representation of
SAM. Chipster allows you to view BAM files with BAM viewer.
BAM files can be indexed by genomic position to efficiently
retrieve reads for a given region. The index file must have the
same name. Genome browser requires both files.
The alignment tools of Chipster automatically produce sorted
and indexed BAMs.
When you import BAM files, Chipster asks if you would like to
preproces them (convert SAM to BAM, sort and index BAM).
Manipulating BAM files (SAMtools, Picard)
Convert SAM to BAM, sort and index BAM
• ”Preprocessing” when importing SAM/BAM, runs on your computer.
• The tool available in the ”Utilities” category runs on the server.
Index BAM
Statistics for BAM
• How many reads align to the different chromosomes.
Count alignments in BAM
• How many alignments does the BAM contain.
• Includes an optional mapping quality filter.
Retrieve alignments for a given chromosome/region
• Makes a subset of BAM, e.g. chr1:100-1000, inc quality filter.
Create consensus sequence from BAM
Call SNPs and short indels from BAM

30
Matching sets of genomic regions
Why?
Useful for many questions, for example:
Do my mapped reads match to positions of known genes?
Does my SNP list contain known SNPs?
Give me only the reads which do not match known genes / SNPs
What genes are closest upstream to my ChIP-seq peaks?
Do the peaks overlap with transcription start sites?
….

31
Software packages for region matching
BEDTools
• Supports BED, GTF, VCF, BAM
• Rich functionality
HTSeq
• Supports GTF
• Good gene models for mapping reads to genes
Chipster’s own region matching tools
• Support BED
• Tolerant for chromosome naming (chr1 vs 1)
Region file formats: BED
5 columns: chr, start, end, name, score
0-based, like BAM

32
Region file formats: GFF/GTF
9 obligatory columns: chr, source, name, start, end, score,
strand, frame, attribute
1-based, like VCF
Software packages for counting aligned reads
per gene / transcript
HTSeq (available in Chipster)
BEDTools (available in Chipster)
...
Different handling of gene models and reads which overlap
several genes

33
HTSeq count
Given a BAM file and a list of genomic features, counts how
many reads map to each feature.
• For RNA-seq the features are typically genes, where each
gene is considered as the union of all its exons.
• Also exons can be considered as features, e.g., in order to
check for alternative splicing.
Features need to be supplied in GTF file
• Note that the chromosome naming has to be the same as in
BAM
3 modes to handle reads which overlap several genes
• Union
• Intersection-strict
• Intersection-nonempty
HTSeq count modes
34
Intersect BED (BEDTools)
Looks for overlapping regions between two BED/GFF/VCF files.
• One of the files can also be BAM.
• Option for strand-awareness
Reporting options
• Only the overlapping region
• Original region in file A or B
• Region in A so that the overlapping part is removed
• Remove the portion of a region that is overlapped by another
region
The B file is loaded to memory
• So the smaller one should be B (e.g. BAM = A, exons = B)
Closest BED (BEDTools)
Looks for overlapping regions between two BED/GFF/VCF files
and if no overlap is found, the closest region is reported.
Reports a region in A region followed by its closest region in B.
Option for strand-awareness
E.g. What is the nearest gene to this SNP?

35
Window BED (BEDTools)
Looks for overlapping regions between two BED/GFF/VCF files
after adding a given number of bases upstream and
downstream of regions in A.
• One of the files can be BAM
Reports the regions in A which overlap with regions in B.
Option for strand-awareness
Visualization

36
Why?
Nothing beats the human eye in detecting potentially
interesting patterns in the data
Software packages for visualization
Chipster genome browser
IGV
UCSC genome browser
Tablet
....
Differences in memory consumption, interactivity, ability to
edit, annotations, contiq view,...

37
Chipster Genome Browser
Integrated with Chipster analysis environment
Automatic sorting and indexing of BAM and BED
Automatic coverage calculation
Zoom in to nucleotide level
Highlight SNPs
View spliced reads
Jump to locations using a BED file
Several views (reads, coverage profile, density graph)
Low memory requirements