ENTERPRISE PROGRAMME BACKGROUND INFORMATION FOR TRAVEL AGENTS.

Micro-Enterprise Development Programme (MEDEP) (GON/MOI/UNDP – NEP/08/006)
Pulchowk, Lalitpur P.O. Box 107 Kathmandu, Nepal
IMPACT ASSESSMENT OF
MICRO-ENTERPRISE DEVELOPMENT PROGRAMME
December 2010
2
Acknowledgement The first phase of Micro-Enterprise Development Programme (MEDEP) implemented by the Ministry of Industry (MOI) and funded by UNDP focused on ten districts. Based on learning from the first phase, the second phase refined the definition of the programme’s beneficiaries by targeting a significant percentage of the ultra poor and the socially excluded, while maintaining its target of having 70 percent women recipients. This phase expanded the geographical coverage of the programme to an additional ten districts with the financial support from Department for International Development (DFID) and New Zealand AID (NZAID). In 2006, MEDEP’s focus on forest-based micro-enterprises was further strengthened with the support of AusAID. In the mid 2007, as a part of the direct support to peace building efforts, UNDP added additional funding to implement enterprise development in six districts under the ‘Quick Impact for Peace Support Initiative’ (QIPSI). The third phase of MEDEP (2008-2010) started in April 2008 to support national programme on micro-enterprise development in the Three Years Interim Plan (2008-2010) with UNDP and AusAID funding and continued emphasis on supporting micro-enterprise development. Overall the geographic coverage by MEDEP expanded to 36 districts and succeeded creating 47,664 micro-entrepreneurs (68% women, 25% Dalits and 69% youth). It has been 11 years since the initial commencement of the MEDEP. During this period, many lessons have been learnt and best practices have been identified informally through the implementation of the programme, and formally through the conduct of various independent evaluations. These reports show that MEDEP impacts on beneficiaries’ livelihood and businesses in a variety of ways, including increasing livelihood assets, and generating employment in communities. In recognition to these positive results of MEDEP, the Government of Nepal (GON) has initiated internalization of the “Micro-Enterprise Development for Poverty Alleviation (MED-PA)” by allocating central government resources for implementation in 18 districts since 2009/10. Furthermore, the GON has planned to implement gradually the MED-PA in all 75 districts for poverty alleviation through employment creation. MEDEP has conducted this ‘Impact Assessment’ to measure the impact of MED-PA on targeted beneficiaries, and to consolidate learning and experiences regarding the transfer of knowledge and sustainability of the overall MED-PA. This study has provided suggestions regarding strategies for the GON’s capacity building, incorporation of financial services and the composite enterprise promotion. For this, MEDEP would like to acknowledge the contribution made by NARMA Consultancy Private Limited in conducting this study. We hope this study will be useful to the GON and all the concerned stakeholders to further contribute towards enhancing delivery of services for micro-enterprise development in Nepal. Dr. Lakshman Pun Mr. Dhundi Raj Pokhrel National Programme Manager National Programme Director/ MEDEP MEDEP Joint Secretary, Ministry of Industry

3
Study Team Members of the NARMA Consultancy Pvt. Ltd.
Dr Smita Premchander Team Leader/International Consultant
Dr. Birendra Bir Basnyat Deputy team leader / Enterprise Development Specialist
Mr. Tulsi Upreti Micro-Finance Specialist
Ms. Kanchan Lama Gender and Social Inclusion Specialist
Dr. Janardan K C Statistician
Mr Bijendra Basnyat Livelihoods Specialist/Data Analyst

i
Abbreviations
ADB/N Agricultural Development Bank of Nepal APSO Area Programme Support Office AUSAID Australian Aid for International Development BCTS Brahmin, Chettri, Thakuri, Sanyasi BDS Business Development Services BDSPO Business Development Service Provider Organization CFC Common Facility Centre CSIDB Cottage and Small Industry Development Board DCCI District Chamber of Commerce and Industries DCSI Department of Cottage and Small Industries DCSIO District Cottage and Small Industry Office DDC District Development Committee DEDC District Enterprise Development Committee DFID Department for International Development (UK) DMEGA District Micro Entrepreneurs Group Association DPIO District Programme Implementation Office EDF Enterprise Development Facilitator EDO Enterprise Development Officer EDU Enterprise Development Unit FI-NGO Financial Intermediary NGO FNCCI Federation of Nepalese Chamber of Commerce and Industries FNCSI Federation of Nepalese Cottage and Small Industries FSP Financial Service Provider HHs Households IGA Income Generating Activities ILO International Labour Organization MDG Millennium Development Goal MECD Micro Enterprise Creation and Development MEDEP Micro Enterprise Development Programme MEDF Micro Enterprise Development Fund MEG Micro Entrepreneurs Group MEr Micro Entrepreneurs MEGA Micro Enterprise Group Association MEP Micro Enterprise Policy MFI Microfinance Institution MFP Micro Finance Policy MOI Ministry of Industry MOU Memorandum of Understanding NGO Non-Governmental Organization NMEGA National Micro Entrepreneurs’ Group Association NPD National Programme Director NPM National Programme Manager NPSO National Programme Support Office NZAID New Zealand Aid PRA Participatory Rural Appraisal PSC Programme Steering Committee QIPSI Quick Impact for Peace Support Initiative SIYB Start and Improve Your Business TOPE Training of Potential Entrepreneur TOSE Training of Selected Entrepreneur TOEE Training of Existing Entrepreneur TOGE Training of Growing Entrepreneur UNDP United Nations Development Programme VDC Village Development Committee

ii
Table of Contents
1 INTRODUCTION ................................................................................................. 1
1.1 BACKGROUND ........................................................................................................ 1 1.2 OBJECTIVES OF THE STUDY .................................................................................... 2 1.3 SCOPE OF THE STUDY ............................................................................................. 2 1.4 ORGANIZATION OF THE REPORT .............................................................................. 3
2 MEDEP MODALITY OF MICRO-ENTERPRISE DEVELOPMENT ..................... 4
3 STUDY METHODOLOGY ................................................................................... 8
3.1 STUDY COVERAGE .................................................................................................. 8 3.2 STUDY METHOD...................................................................................................... 8
3.2.1 Quantitative method .............................................................................................. 9 3.2.2 Qualitative method ............................................................................................... 11
3.3 SURVEY EXECUTION ............................................................................................. 11 3.4 DATA ANALYSIS ................................................................................................... 12 3.5 LIMITATIONS ......................................................................................................... 13
4 PROFILE OF RESPONDENTS ......................................................................... 14
4.1 RESPONDENTS CHARACTERISTICS ........................................................................ 14 4.1.1 Sex, ethnicity and age group .............................................................................. 14 4.1.2 Literacy and educational status ......................................................................... 15 4.1.3 Occupation............................................................................................................ 15
4.2 HOUSEHOLD CHARACTERISTICS ............................................................................ 16 4.2.1 Household size ..................................................................................................... 16 4.2.2 Household population by age groups ............................................................... 17 4.2.3 Literacy status ...................................................................................................... 18 4.2.4 Occupational structure ........................................................................................ 18
4.3 PROFILE OF PARTICIPANTS ................................................................................... 19 4.3.1 Enterprise categories .......................................................................................... 20 4.3.2 Nature of involvement ......................................................................................... 20 4.3.3 Involvement in enterprises prior to MEDEP’s intervention/support ............... 21
5 ENTERPRISE ANALYSIS AND ITS IMPACTS ................................................ 23
5.1 MEDEP ASSISTANCE ........................................................................................... 23 5.1.1 Training ................................................................................................................. 23 5.1.2 Other support ....................................................................................................... 25
5.2 ENTERPRISE MANAGEMENT .................................................................................. 27 5.2.1 Management of raw materials ............................................................................. 27 5.2.2 Technology ........................................................................................................... 29 5.2.3 Investment and sources of finances .................................................................. 30 5.2.4 Borrowing ............................................................................................................. 31 5.2.5 Linkages and networking .................................................................................... 32 5.2.6 Support of other agencies ................................................................................... 34 5.2.7 Marketing of products ......................................................................................... 35
5.3 PERFORMANCE OF ENTERPRISES .......................................................................... 38 5.3.1 Status of Operation .............................................................................................. 38 5.3.2 Capacity of Operation .......................................................................................... 38 5.3.3 Profit analysis ....................................................................................................... 39
5.4 IMPACT OF MEDEP INTERVENTIONS ...................................................................... 42 5.4.1 Utilization of income ............................................................................................ 42 5.4.2 Diversification of enterprises ............................................................................. 43 5.4.3 Contribution to employment and improvement in labor productivity ............ 45 5.4.4 Networking and social capital............................................................................. 46
6 IMPACT OF THE PROGRAMME ON THE LIVELIHOODS: HOUSEHOLD LEVEL SOCIO-ECONOMIC CHANGES ........................................................... 48
6.1 LIVING CONDITIONS .............................................................................................. 48 6.1.1 Ownership of houses ........................................................................................... 48

iii
6.1.2 Roofing materials ................................................................................................. 49 6.1.3 Flooring ................................................................................................................. 50 6.1.4 Access to drinking water ..................................................................................... 51 6.1.5 Sanitation .............................................................................................................. 51 6.1.6 Energy sources for cooking................................................................................ 52 6.1.7 Source of energy for lighting .............................................................................. 53
6.2 LIVELIHOODS CAPITALS/ASSETS ........................................................................... 54 6.2.1 Physical Assets .................................................................................................... 54 6.2.2 Natural Capital ...................................................................................................... 57 6.2.3 Social Capital ........................................................................................................ 60 6.2.4 Financial Capital ................................................................................................... 62 6.2.5 Human capital ....................................................................................................... 65
6.3 LIVELIHOOD OUTCOMES ........................................................................................ 65 6.3.1 Income ................................................................................................................... 66 6.3.2 Household food security ..................................................................................... 68 6.3.3 Migration ............................................................................................................... 72
6.4 VULNERABILITY ASSESSMENT ............................................................................... 72
7 IMPACT AT INDIVIDUAL LEVEL: ECONOMIC, SOCIAL AND POLITICAL EMPOWERMENT ............................................................................................. 74
7.1 STATUS WITHIN THE HOUSEHOLD .......................................................................... 74 7.1.1 Involvement in decisions regarding HHs affairs .............................................. 74 7.1.2 Involvement in economic decisions .................................................................. 74
7.2 STATUS OUTSIDE THE HOUSEHOLDS ...................................................................... 75 7.3 EMPOWERMENT .................................................................................................... 77
7.3.1 Economic empowerment ..................................................................................... 77 7.3.2 Social empowerment ........................................................................................... 78 7.3.3 Political empowerment ........................................................................................ 78
8 CONTRIBUTION TO GENDER EQUALITY AND SOCIAL INCLUSION .......... 81
8.1 OWNERSHIP/ENTITLEMENT TO PRODUCTIVE RESOURCES ....................................... 84 8.1.1 Access to assets/resources (HHs) ..................................................................... 84 8.1.2 Reorganization as the income earner ................................................................ 85 8.1.3 Decisions making roles ....................................................................................... 85 8.1.4 Access to public services and resources ......................................................... 87
8.2 PARTICIPATION IN COMMUNITY/PUBLIC INSTITUTIONS ............................................. 88 8.2.1 Confidence ............................................................................................................ 88 8.2.2 Holding decision making positions ................................................................... 88
8.3 IMPROVEMENTS IN CAPABILITY .............................................................................. 89 8.3.1 Capacity to influence decisions at community/public institutions ................ 89 8.3.2 Capacity to act against gender violence and social discriminations ............. 90 8.3.3 Capacity to understand and utilize rights ......................................................... 91
9 CONTRIBUTION TO MILLENNIUM DEVELOPMENT GOALS ........................ 92
9.1 POVERTY REDUCTION ........................................................................................... 92 9.2 PRIMARY EDUCATION ........................................................................................... 94 9.3 GENDER EQUALITY AND WOMEN EMPOWERMENT .................................................. 96 9.4 HIV/AIDS, MALARIA AND OTHER DISEASES .......................................................... 99 9.5 ENVIRONMENTAL SUSTAINABILITY ....................................................................... 101
10 ASSESSMENT OF MEDEP MODALITY ........................................................ 104
10.1 KEY ASPECTS OF THE MODALITY ........................................................................ 104 10.2 EFFECTIVENESS ................................................................................................. 106
10.2.1 Success factors .................................................................................................. 107 10.2.2 Drop-outs and their reasons ............................................................................. 107 10.2.3 Performance of components ............................................................................ 110 10.2.4 Entrepreneurs’ responses to their challenges and constraints.................... 114
10.3 EFFICIENCY ........................................................................................................ 114 10.4 SUSTAINABILITY ................................................................................................. 115
10.4.1 Sustainability elements in the model ............................................................... 115

iv
10.4.2 Internalization of the model by partner organizations ................................... 116 10.4.3 Use of MEDEP modality by other development partners .............................. 117
10.5 IMPACT .............................................................................................................. 118 10.5.1 Policy influence .................................................................................................. 118 10.5.2 Institutional impact ............................................................................................ 119 10.5.3 Contribution to peace and conflict mitigation ................................................ 119
11 SUMMARY, CONCLUSIONS AND RECOMMENDATIONS........................... 122
11.1 SUMMARY OF FINDINGS ...................................................................................... 122 11.2 CONCLUSIONS .................................................................................................... 127 11.3 RECOMMENDATIONS ........................................................................................... 130 REFERENCES .............................................................................................................. 134
v
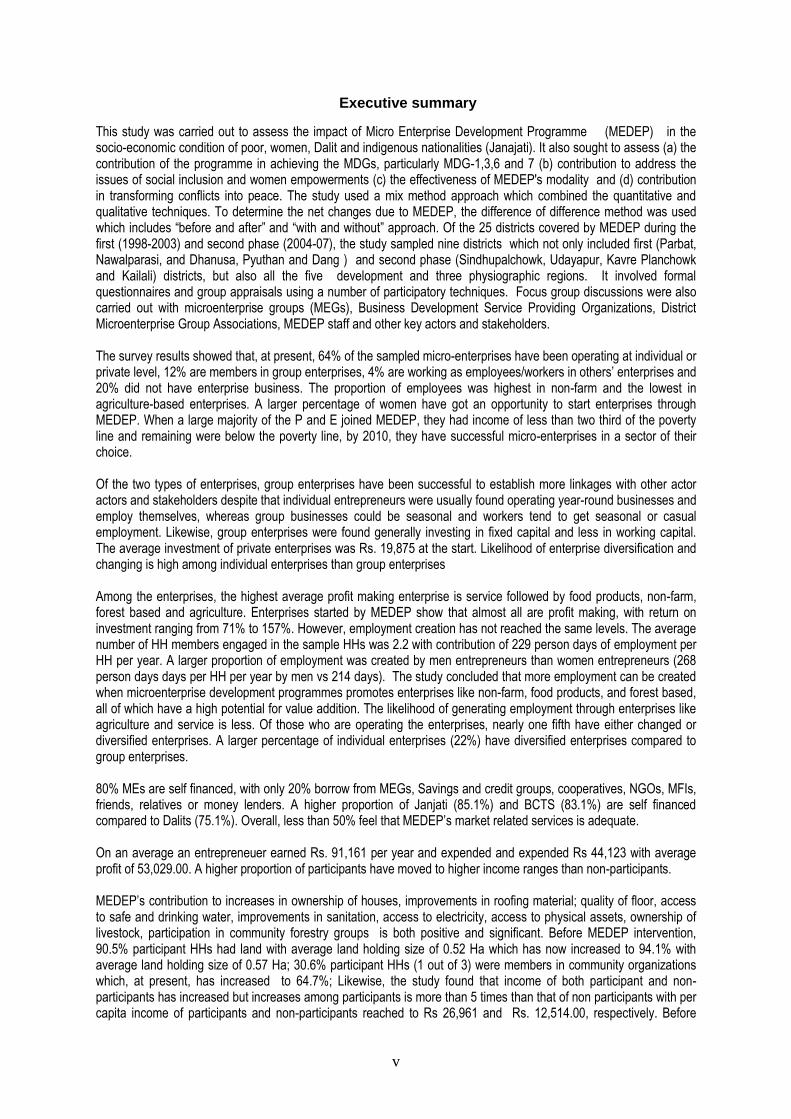
Executive summary
This study was carried out to assess the impact of Micro Enterprise Development Programme (MEDEP) in the socio-economic condition of poor, women, Dalit and indigenous nationalities (Janajati). It also sought to assess (a) the contribution of the programme in achieving the MDGs, particularly MDG-1,3,6 and 7 (b) contribution to address the issues of social inclusion and women empowerments (c) the effectiveness of MEDEP's modality and (d) contribution in transforming conflicts into peace. The study used a mix method approach which combined the quantitative and qualitative techniques. To determine the net changes due to MEDEP, the difference of difference method was used which includes “before and after” and “with and without” approach. Of the 25 districts covered by MEDEP during the first (1998-2003) and second phase (2004-07), the study sampled nine districts which not only included first (Parbat, Nawalparasi, and Dhanusa, Pyuthan and Dang ) and second phase (Sindhupalchowk, Udayapur, Kavre Planchowk and Kailali) districts, but also all the five development and three physiographic regions. It involved formal questionnaires and group appraisals using a number of participatory techniques. Focus group discussions were also carried out with microenterprise groups (MEGs), Business Development Service Providing Organizations, District Microenterprise Group Associations, MEDEP staff and other key actors and stakeholders. The survey results showed that, at present, 64% of the sampled micro-enterprises have been operating at individual or private level, 12% are members in group enterprises, 4% are working as employees/workers in others’ enterprises and 20% did not have enterprise business. The proportion of employees was highest in non-farm and the lowest in agriculture-based enterprises. A larger percentage of women have got an opportunity to start enterprises through MEDEP. When a large majority of the P and E joined MEDEP, they had income of less than two third of the poverty line and remaining were below the poverty line, by 2010, they have successful micro-enterprises in a sector of their choice. Of the two types of enterprises, group enterprises have been successful to establish more linkages with other actor actors and stakeholders despite that individual entrepreneurs were usually found operating year-round businesses and employ themselves, whereas group businesses could be seasonal and workers tend to get seasonal or casual employment. Likewise, group enterprises were found generally investing in fixed capital and less in working capital. The average investment of private enterprises was Rs. 19,875 at the start. Likelihood of enterprise diversification and changing is high among individual enterprises than group enterprises Among the enterprises, the highest average profit making enterprise is service followed by food products, non-farm, forest based and agriculture. Enterprises started by MEDEP show that almost all are profit making, with return on investment ranging from 71% to 157%. However, employment creation has not reached the same levels. The average number of HH members engaged in the sample HHs was 2.2 with contribution of 229 person days of employment per HH per year. A larger proportion of employment was created by men entrepreneurs than women entrepreneurs (268 person days days per HH per year by men vs 214 days). The study concluded that more employment can be created when microenterprise development programmes promotes enterprises like non-farm, food products, and forest based, all of which have a high potential for value addition. The likelihood of generating employment through enterprises like agriculture and service is less. Of those who are operating the enterprises, nearly one fifth have either changed or diversified enterprises. A larger percentage of individual enterprises (22%) have diversified enterprises compared to group enterprises.
80% MEs are self financed, with only 20% borrow from MEGs, Savings and credit groups, cooperatives, NGOs, MFIs, friends, relatives or money lenders. A higher proportion of Janjati (85.1%) and BCTS (83.1%) are self financed compared to Dalits (75.1%). Overall, less than 50% feel that MEDEP’s market related services is adequate. On an average an entrepreneuer earned Rs. 91,161 per year and expended and expended Rs 44,123 with average profit of 53,029.00. A higher proportion of participants have moved to higher income ranges than non-participants. MEDEP’s contribution to increases in ownership of houses, improvements in roofing material; quality of floor, access to safe and drinking water, improvements in sanitation, access to electricity, access to physical assets, ownership of livestock, participation in community forestry groups is both positive and significant. Before MEDEP intervention, 90.5% participant HHs had land with average land holding size of 0.52 Ha which has now increased to 94.1% with average land holding size of 0.57 Ha; 30.6% participant HHs (1 out of 3) were members in community organizations which, at present, has increased to 64.7%; Likewise, the study found that income of both participant and non-participants has increased but increases among participants is more than 5 times than that of non participants with per capita income of participants and non-participants reached to Rs 26,961 and Rs. 12,514.00, respectively. Before

vi
MEDEP, on average, participants had sufficient food for 3.6 months which increased to 5.8 months with net increase of 2.2 months and increases in number of food sufficient months have been largest among Janajatis followed by Dalits. Similarly, the survey results found increases in economic, social and political empowerments of participants compared to non-participants. Evidence reveals that the proportion of participants raising voices against social evils and discriminations is higher than non-participants. The study found increases in the participation of women in households and economic decisions including access of women and socially excluded people such a Dalits, Janajatis and other Terai caste to all public services and resources after participation in MEDEP. Empowerment level of Dalits and other caste Terai persons, especially women, have been improved as a result of their participation in MEDEP and that they have been able to seek services from others. MEDEP’s intervention has changed the rules of the game by increasing the proportion of women in decision making positions in forestry, water related groups and community organizations. With regard to the contribution of MEDEP to MDGs, the survey results show that nearly three fourth of the participants households have moved out of the poverty (73.1%). Poverty impact has been larger for BCTS (80.5%) and women. Likewise, the survey results showed net enrollment rate in primary education increased among participants irrespective of ethnicity and gender while there was mixed results among non-participants. The share of women in the wage employment in the non-agricultural sector has increased among both the groups, with a higher increase among MEDEP participants. The awareness on HIV/AIDs has increased among both participants and non-participants across different ethnic/caste groups and gender. The study indicated that MEDEP, as a stand-alone micro-enterprise development programme, can be considered highly successful when its economic, social and empowerment impacts are considered. It identified several success factors and also identified some short-comings, which, among others, included lack of institution building and inadequate access to financial services. Key success factors of MEDEP modality are (a) focused on assisting people to identify latent entrepreneurial skills by themselves (entrepreneurship development, rather than enterprise development/establishment) (b) Targeting and selection of the poor (c) focus on individualized enterprise promotion, 64% of entrepreneurs are individual enterprises (d) initiating and making a group approach to enterprise promotion successful through elements such as provision of technical support and common facility centres (e) No rush and no pressure and (f) high professional/ technical advice and supervision of the grass roots service providers from APSOs and MEDEP. The study indicated that the results would have been further invigorating if the programme would not have been constrained by conflicts, difficulties in delivering technical services and withdrawal of the ADB/N to provide financial services. When MEDEP’s total cost looked over a period of ten years and the annual income earned by an entrepreneur, the cost is almost recovered in a year by the entrepreneur. The model is cost-effective. From the perspective of sustainability, the model has been rated high despite effective integration of all six component remain. MEDEP’s modality of micro-enterprise development has been and will remain an important increase in local organizations capabilities, even if scale of programme could decrease due to the inadequacy of funding after the termination of MEDEP. MEDEP has been successful in making the government to recognize that micro-enterprises belong to a different category of industries and therefore required different intervention approach, methodology and targeting. MEDEP has been successful to influence not only policy making at the national level, but also the planning and implementation of local bodies and the need for them to promote ME development for poverty reduction, employment generation and inclusive development. Despite of missing institutional development component, MEDEP has been successful to create several institutions from the central to grassroots level which are likely to continue to operate and promote micro-enterprises in the foreseeable future. Despite larger impact of MEDEP in creating institutions, performance and sustainability of these institutions has not been very promising as anticipated. Evidence further reveals that its inclusive development approach, effective targeting of poor and excluded creation of employment opportunities for unemployed youths have encouragingly contributed to peace building and reduction of conflicts.
Based on the key findings and conclusions drawn this study suggested to make key shifts in several areas which, among others, include move from promoting entrepreneurs to building capacities of government departments to do so, move from supporting all types of small enterprises, to adding a value chain perspective. Likewise, it suggested changes in emphasis for making the model more efficient and effective in terms of poverty outreach and employment generation, incorporation of support for growth and financial services, provision of demand oriented business development, development of a composite enterprise promotion strategy and organization building (institution development), addressing finance gaps and use of Gender and Social Exclusion Assessment Framework as a monitoring tool.
1
1 INTRODUCTION
1.1 Background
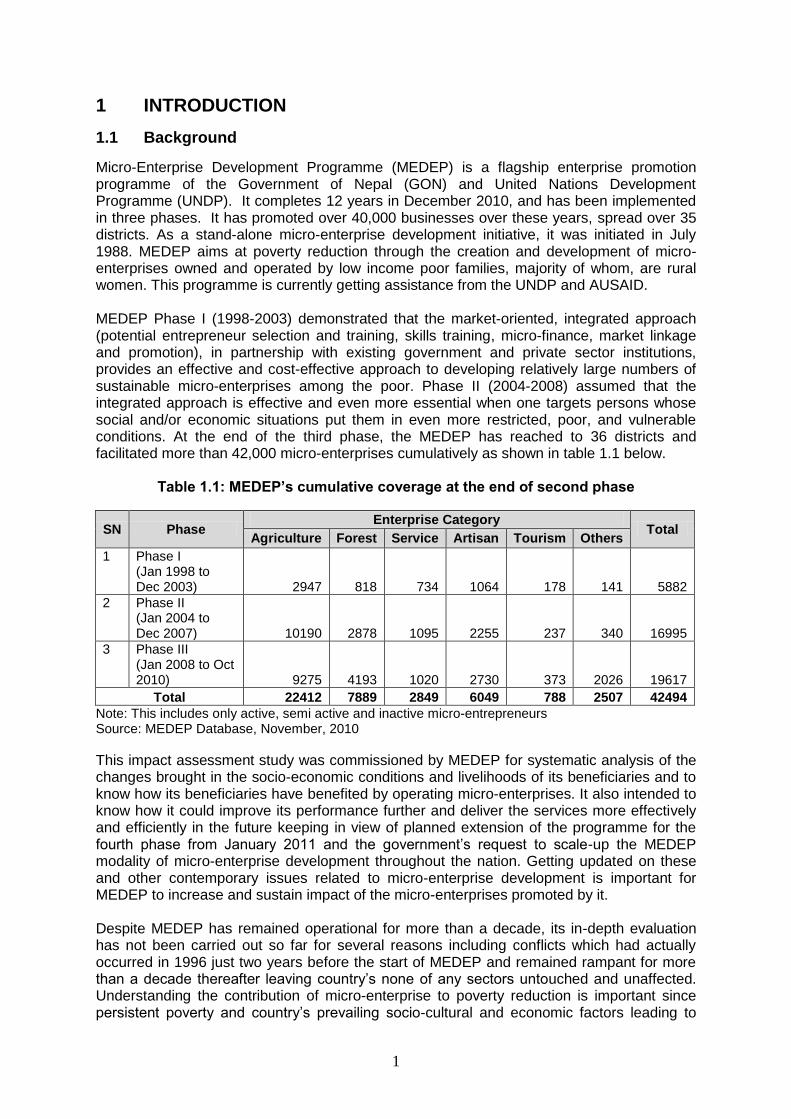
Micro-Enterprise Development Programme (MEDEP) is a flagship enterprise promotion programme of the Government of Nepal (GON) and United Nations Development Programme (UNDP). It completes 12 years in December 2010, and has been implemented in three phases. It has promoted over 40,000 businesses over these years, spread over 35 districts. As a stand-alone micro-enterprise development initiative, it was initiated in July 1988. MEDEP aims at poverty reduction through the creation and development of micro-enterprises owned and operated by low income poor families, majority of whom, are rural women. This programme is currently getting assistance from the UNDP and AUSAID. MEDEP Phase I (1998-2003) demonstrated that the market-oriented, integrated approach (potential entrepreneur selection and training, skills training, micro-finance, market linkage and promotion), in partnership with existing government and private sector institutions, provides an effective and cost-effective approach to developing relatively large numbers of sustainable micro-enterprises among the poor. Phase II (2004-2008) assumed that the integrated approach is effective and even more essential when one targets persons whose social and/or economic situations put them in even more restricted, poor, and vulnerable conditions. At the end of the third phase, the MEDEP has reached to 36 districts and facilitated more than 42,000 micro-enterprises cumulatively as shown in table 1.1 below.
Table 1.1: MEDEP’s cumulative coverage at the end of second phase
SN Phase Enterprise Category
Total Agriculture Forest Service Artisan Tourism Others
1 Phase I (Jan 1998 to Dec 2003) 2947 818 734 1064 178 141 5882
2 Phase II (Jan 2004 to Dec 2007) 10190 2878 1095 2255 237 340 16995
3 Phase III (Jan 2008 to Oct 2010) 9275 4193 1020 2730 373 2026 19617
Total 22412 7889 2849 6049 788 2507 42494
Note: This includes only active, semi active and inactive micro-entrepreneurs Source: MEDEP Database, November, 2010
This impact assessment study was commissioned by MEDEP for systematic analysis of the changes brought in the socio-economic conditions and livelihoods of its beneficiaries and to know how its beneficiaries have benefited by operating micro-enterprises. It also intended to know how it could improve its performance further and deliver the services more effectively and efficiently in the future keeping in view of planned extension of the programme for the fourth phase from January 2011 and the government’s request to scale-up the MEDEP modality of micro-enterprise development throughout the nation. Getting updated on these and other contemporary issues related to micro-enterprise development is important for MEDEP to increase and sustain impact of the micro-enterprises promoted by it. Despite MEDEP has remained operational for more than a decade, its in-depth evaluation has not been carried out so far for several reasons including conflicts which had actually occurred in 1996 just two years before the start of MEDEP and remained rampant for more than a decade thereafter leaving country’s none of any sectors untouched and unaffected. Understanding the contribution of micro-enterprise to poverty reduction is important since persistent poverty and country’s prevailing socio-cultural and economic factors leading to

2
social exclusion are often referred as one of the key reasons for the conflicts in Nepal and that the contribution of micro-enterprises to poverty reduction and employment generation has been found substantial. While Government and development partners, particularly UNDP, are interested to know to what extent MEDEP delivered results and achieved the purpose for which they have funded it throughout the programme period or partially. However, purpose of this study goes beyond assessing MEDEP’s impact. It also assesses MEDEP’s contribution to the fulfillment of Millennium Development Goals (MDGs), particularly Goal Number 1 on poverty reduction, Goal Number 3 on gender equality and empowers women, Goal no 6 on combating HIV/AIDS, Malaria and other diseases and Goal Number 7 on environment sustainability. Identification of challenges relating to scaling up and sustainability, in addition to measuring specific outcomes is necessary. Besides these, this study looks into the replicability (and scaling up) and sustainability issues of MEDEP’s modality of micro-enterprise development given government’s recent decision to adopt its modality nationwide. Lastly but not the least, with regard to micro-enterprise development, it is important to know answers to the questions such as what works?’ as well as ‘how?’ and ‘under what circumstances? Understanding how, and to what extent, does micro-enterprises contribute to poverty reduction is necessary for designing effective policies and enabling interventions for micro-enterprise development.
1.2 Objectives of the Study The main objective of the study is to assess the impact of MEDEP (phase I and II) in the socio-economic condition of poor, women, dalit and indigenous nationalities and effectiveness of MEDEP’s modality of micro-enterprise development. The specific objectives of the study are:
To assess the magnitude of changes in the socio-economic condition of
entrepreneurs including poor, women, dalit and indigenous nationalities supported by the programme,
To assess the impact of the programme in improving livelihoods of the poor, women, dalit and indigenous nationalities (Janajati),
To assess the contribution of the programme in achieving the MDGs, focusing mainly on MDG-1,3,6 and 7
To examine how the programme has contributed to address the issues of social inclusion and women empowerments,
To examine the effectiveness of MEDEP's modality with reference to its efficiency, effectiveness, relevance and sustainability for its continuation; and
To examine how the programme has contributed in transforming the conflict into peace.
1.3 Scope of the Study
The scope of the work includes:
Assess the contribution of the programme to increase household income of poor and excluded (including women, dalit and indigenous nationalities)
Examine the contribution of the programme to generating employment Analyze the trend of youth migration within and outside the country after intervention
of the programme Analyze the impact of the programme on the leadership development Assess the impact of the programme in empowering women for decision making
processes at household and entrepreneur level

3
Assess the impact of the programme in improving livelihoods of poor, women and excluded
Assess how the programme has contributed to address the issue of social exclusion and domestic violence against women
Examine the knowledge of entrepreneurs on policy and regulatory changes to enable participation of poor and excluded in micro and small enterprises
Assess how the programme has contributed in institutionalization of micro entrepreneurs
Assess the contribution of the programme to ensuring environment sustainability while developing enterprises
Assess how the programme has contributed in reducing the past conflict and present Terai conflict
Assess how the programme has contributed to disseminate the knowledge about HIV/AIDS to entrepreneurs
Examine the effectiveness of MEDEP's modality with reference to its efficiency, effectiveness, relevance, and sustainability for its continuation
Assess how the programme has contributed to institutionalize and internalize MEDEP-model in its implementing partners' organizations and other organizations
Assess how the programme has initiated its sustainability after the programme phases out
Explore the issues and challenges and strategic responses of entrepreneurs
1.4 Organization of the Report This report is organized into 11 chapters. Chapter 1 is the introductory chapter. Objectives and scope of the present study are depicted in this chapter. Chapter 2 briefly describes MEDEP modality. Central to this chapter is the processes piloted by MEDEP to assist the poor and excluded to identify and utilize their latent entrepreneur skills from within. Key steps followed by MEDEP in micro-entrepreneurship development are depicted in this chapter. Study methodology is briefly described in chapter 3. Chapter 4 presents the profile of MEDEP participants and non-participants. Impacts of MEDEP at the enterprise levels are assessed in chapter 5. This chapter presents the evidence for assessing MEDEP model of the micro-enterprise development as described in chapter 10. Chapter 6 assesses the impact of MEDEP on the livelihoods of its target groups who are poor, women, Dalit and indigenous nationalities. Chapter 7 assesses the impact of MEDEP at individual level in terms of their status, prestige and capability. Chapter 8 and 9 assesses contributions of MEDEP in terms of gender equality and social inclusion; and MDGs respectively. Chapter 10 focuses on assessment of MEDEP modality of micro-enterprise development, which assesses using four key criteria of evaluation which include effectiveness, efficiency, sustainability and impact. Last but not the least, chapter 11 summarize key findings, draw conclusions and provide recommendations.

4
Micro-Entrepreneurship
Development
Marketing Linkages and Business Counselling
Appropriate Technology
Testing and Transfer
Access to Finance
Technical Skills Development
Entrepreneurship Development
Social Mobilisation for Enterprise Development
2 MEDEP MODALITY OF MICRO-ENTERPRISE DEVELOPMENT The unique feature of MEDEP is its process oriented micro-enterprise development model with 6 key components as shown in Figure 2.1, which is popularly known as MEDEP modality in Nepal. The model is focused on the development of latent entrepreneurship from within. It is comprised of a number of steps and sub-steps as shown below:
Figure 2.1 MEDEP’s key components
Step 1: Identification of Programme Location and Market Centres (Preparatory Step) Sub-step 1: Resource potential survey using participatory rural appraisal (PRA) technique for the assessment of availability of raw materials, socio-economic situation analysis, identification of indigenous skills and market access Sub-step 2: Triangulation of findings of resource potential survey with other district indicators, facts and surveys carried out by other projects, agencies and programmes
Sub-step 3: Selection of market centres and program location based on the results of sub-step 1 (resource potential survey and triangulation). Criteria for the selection of programme location, among others, include (a) availability of raw materials, (b) local traditional skills (c) access to markets (d) settlement of potential entrepreneurs (e) demand and interest of target groups
Sub-step 4: Submission of the proposed programme locations and market centres to the District Enterprise Development Committee (DEDC) formed under the chairmanship of the District Development Committee
Sub-step 5: Review and approval of the programme locations and market centres by the DEDC. Figure 2.2 shows MEDEP’s intervention area.

5
Figure 2: MEDEP’s programme location
Step 2: Identification of Potential Entrepreneurs Although MEDEP believes that every individual has latent entrepreneurship within himself/herself, it follows the following sub-steps to identify most potential entrepreneurs and to target the poorest of the poor and socially excluded groups like women, dalits and ethnic minorities. Key to the identification of potential entrepreneurs is the maximum utilization of the limited resource which the MEDEP has and facilitating the implementation of demand based micro-enterprises. If the step one sets out the appropriate platform for the micro-enterprise development (MED), this step provides the way forward. This step is comprised of the following sub-steps. Sub-step 1: Poverty mapping in selected programme locations (areas) through PRA to select the poor households
Sub-step 2: Household (HH) survey through socio-economic baseline survey. The purpose of this survey is to collate basic demographic profile, employment details, sources of income, ownership status of land and other livelihood assets/capitals, sources and level of income, management of food supplies of the potential HHs etc. For this, the MEDEP has developed a structured HH survey questionnaire (Form A)
Sub-step 3: Administration of survey questionnaire for the unemployed and potential entrepreneur members of the HHs. Having identified unemployed members in the HHs through HH survey (Form A), the next questionnaires (Form B and Form C) is administered to them. This questionnaire focuses on the educational status, knowledge, skills, interest/priorities, economic sources, entrepreneurship background, family background, membership in other groups and associations etc.
Sub-step 4: Selection of potential entrepreneurs within the selected households in participatory discussions and interactions with the concerned HHs.
Step 3: Establishment of micro-entrepreneurs
Sub-step 1: Identification of products which can be produced at the local level. In this sub-step, traders survey (Form D) is carried out to identify potential markets, traders, market demand for the products (quantitative and qualitative), market situation and so forth.
Sub-step 2: Prepare the potential list of products which can be produced at the local level
People’s needs and demands
Raw materials potential
MEDEP intervention
area/
Market demand

6
Sub-step 3: Provide an orientation skill oriented training to potential entrepreneurs focused on enterprise development, selection of appropriate enterprises, preparation of business plan, marketing etc
Sub-step 4: Provide Start and Improve Your Business1 (SIYB) training which is comprised
of the following sequential four packages: (a) Training of Potential Entrepreneurs (TOPE), (b) Training of Selected Entrepreneurs (TOSE), (c) Training of Existing Entrepreneurs (TOEE), and (d) Training of Growing Entrepreneurs (TOGE). As seen in Figure 2.3 below, of every 25 people receiving the first package (TOPE), only 5 (or 20%) will receive the last package. Of the four packages, the first two packages are given as part of this step.
Figure 2.3: The steps of the SIYB training package
5 participants
10 participants
TOGE
15 participants
TOEE
Entrepreneurs who are operating
enterprises and are interested to expand
their enterprises
25 participants
TOSE
Entrepreneurs who have
started operating
TOPE Potential entrepreneurs
selected from TOPE or through other
processes
Participants: Persons interested to start enterprise
Step 4: Follow up support services and technical backstopping2. Activities under these steps include the following
Activity 1: Group formation and organization Activity 2: Assistance to receive financial services Activity 3: Appropriate technology support services through skill oriented training and common facility centres Activity 4: Impart remaining two training packages of SIYB-TOEE and TOGE Activity 5: Assistance for establishing marketing linkages and market access
Table 2.1 summarizes key steps, sub-steps and components and responsible institutions as per the MEDEP’s MED modality.
1 Prior to introducing SIYB training model in 2004, MEDEP used microenterprise creation and development
model (MECD) of training 2 Like in other sub-steps, no sub-steps can be specficially distinguished in this step.

7
Table 2.1: MEDEP’s modality of entrepreneurshship development
Steps Key Action/sub-steps/Key
Key responsibility
Supporting role Participants
Identification of Programme Location and Market Centres
Resource potential survey
MEDEP Consultants DDC
Triangulation of findings
MEDEP District stakeholders
District stakeholders
Selection of market centres and program location
DEDC/DDC MEDEP Consultant
District stakeholders
Identification of Potential Entrepreneurs
Poverty mapping MEDEP
BDSPO DDC VDC
Local communities
Surveys (Form A, B,C)
MEDEP
BDSPO Local communities
Establishment of micro-entrepreneurs
MEDEP
BDSPO DDC VDC
Local communities Potential HHs and Entrepreneurs
Trader survey (Form D)
MEDEP BDSPO
Traders
Orientation training
MEDEP BDSPO Potential entreprenuers
SIYB MEDEP BDSPO
Follow-up support services and technical backstopping
Group and association organization (Social mobilization)
MEG MEGA DMEGA NMEGA
MEDEP Micro-entrepreneurs
Finance service MFIs Banks
BDSPOs DMEGAs
Micro-entrepreneurs
Training BDSPO MEDEP DCSI DDC
Technology services
BDSPO MEDEP DDC VDC DCCI
Micro-entrepreneurs
Marketing linkages, business counseling assistances
DMEGA MEDEP DCCI FNCCI BDSPO NMEGA
Micro-entrepreneurs Traders
As seen from the above table, MEDEP’s support is directed towards delivering technical support and services. It does not provide direct cash or material support to the MEs, except some hardware (equipments, tools, machineries and building ) support through the provision of common facility centres (CFCs). Support for CFCs, particularly building construction part, is not provided unless the MEs receive assistance through local bodies such as Village Development Committees (VDCs) , municipalities and District Development Committees (DDCs), and preferably from other donors and agencies.

8
3 STUDY METHODOLOGY A multi-method data collection approach was used to collect secondary and primary data for assessing impacts of MEDEP on poverty reduction, livelihoods and institutional development. Secondary sources of data collection included desk review. At the onset of the study, the study team collected and reviewed all the relevant and available reports and studies relating to micro-enterprise sector in general and MEDEP in particular. This included project documents, annual progress reports, phase III scoping reports, other study reports, micro enterprise policy, industrial policy, micro finance policy and so forth. Review of these reports in the light of the requirements of the study TOR helped the study team to have a clear picture about the nature and scope of the programme, the types and nature of information to be collected, refine the study methodology and triangulate the findings.
3.1 Study Coverage Given time and resource constraints and the need to intensively assess the socio-economic impact of the programme, this study covered 9 districts of which 5 districts (Parbat, Nawalparasi, and Dhanusa, Pyuthan and Dang) were from first phase and 4 districts (Sindhupalchowk, Udayapur, Kavre Planchowk and Kailali) were from second phase. These study districts were selected to represent three physio-graphic regions (Mountain, Hills and Terai) and five development regions (Eastern, Central Western Mid Western and Far Western) as follows (Figure 3.1).
Figure 3.1: A Map of Nepal showing study districts
3.2 Study Method This study used a mix method approach which combined quantitative and qualitative methods.

9
3.2.1 Quantitative method
As part of quantitative method, entrepreneur survey was carried out using a difference of difference method which comprised a survey of both participants and non-participants following the before and after method. (Figure 3.2). This method will help to assess net impact or contribution made by the programme. For selecting participants (treatment group) and non-participants (treatment group), a multi-stage random sampling technique was followed (Annexure 3.1) for selecting respondents. Respondents were selected to represent different categories of entrepreneurs while taking account of district, caste, phase and gender based on population probability to size.
Figure 3.2: Impact assessment method
Treatment group include those who have been reported as entrepreneurs by the MEDEP up to its phase II, i.e. 2007 December and also called as participants. Control group included those persons who were selected by MEDEP’s for enterprise development but not received any interventions from them. In this study, they are referred as non-participants. The idea was that the socio-economic conditions of the HHs and the persons will be very similar to the respondents from treatment groups before MEDEP’s intervention.
In any impact analysis, a before-after analysis tells the story of the change in the situation of the participants of the programme, before they joined it, and after they received the inputs. This is valuable and necessary. However, at the same time as programme inputs are used by participants, many other changes are taking place in the external environment, which impact both participants and non-participants. These may enhance the positive impact or even negatively impact both participants and non participants. The impact of these external factors can be accounted not only among programme participants but also among non participants, who have similar characteristics as that of participants. Presumably, those who have similar characteristics would have grown similarly to the participants, except that one group has received MEDEP inputs and the other hasn’t. This non-participant group forms the control group. A comparison of the differences between where the control group has reached, and where the participant group has reached, gives an idea of the net impact of intervention or contribution of made by the programme. It is for this reason that this impact study has taken a control group. This should be constituted of non participants who have similar characteristics as the participant group. In order to ensure this, the control group comprises of new entrants: those who were selected for support under MEDEP (therefore ensuring similarity of characteristics) but are yet to receive any support from MEDEP.
t0 t1
Y0
Y1
Y2 Treatment group
(MEDEP Participants)
Control group
(Non- participants)
Net impact of MEDEP or MEDEP Contribution = Y2- Y1
Where, t0 and t1 are time lapses between project y0, y1 and y2 are impact at different time intervals

10
MEDEP participants are selected according to poverty criteria. To ensure that the control group had similar characteristics, those participants already selected by MEDEP on poverty criteria were selected for the control group. As far as possible, other characteristics, such as location, were matched, by spreading control group in each of the nine sample districts. All other characteristics, such as literacy, do not form part of the selection criteria of MEDEP, and information on all other parameters was collected AFTER selection in control group. This methodology, of taking selected beneficiaries, before they receive project support, is considered best practice internationally, in studies that use control groups. Further, studies that use control groups provide a better understanding of impact than those that only use before-after analysis. Control group are bound to have distinctly different characteristics. For instance, it would be normal for them to have lower literacy levels. Given a situation where land has been becoming more and more fragmented, it would not be surprising that more are landless. The selection process of MEDEP could have become more refined resulting in improved targeting. These would be some of the reasons why control group characteristics differ from the MEDEP participant group. What this study has ensured in the control group is that MEDEP participants are poor on the income criteria when they are selected. Only the fact that they are poor and reside in the same locations is common at the time of selection. All other characteristics will most likely differ. Apart from this, statistical analysis also reveals that participants and non-participants do not differ significantly on per capita income prior to MEDEP intervention (before project). The study planned to survey 810 participants and 160 non-participants. However, number of respondents was increased by 10 percent in all the districts to remove inconsistent responses and outliers during the data processing and analysis. Table 3.1 shows number of respondents surveyed by district, which comprises of both participants and non-participants. The study surveyed 832 participants and 183 non-participants from nine study districts. The sample size was distributed equally among all the district in case of participants (90 each) whereas for non-participants, respondents were selected based on list of non-entrepreneurs provided by MEDEP. As a result of this, non-participants survey was conducted in only six districts.
Table 3.1: Number of respondents by district
District Participants Non-participants
Udayapur 97 44
Dhanusa 91 58
Sindhupalchowk 90 10
Kavrepalanchok 90 -
Nawalparasi 91 22
Parbat 89 -
Pyuthan 98 -
Dang 95 38
Kailali 91 11
Total 832 183
For the enterprise assessment, micro-enterprises promoted by MEDEP were categorized into the following 5 categories.
Agriculture (this is mainly related to primary production, such as vegetable farming, goat keeping, milk selling etc)
Forest product based (Primary production and value addition)
Food products (value addition of agriculture products, such as milk processing, dairy products, juice making, edible foods etc)

11
Services (this includes tailoring, retail shop operation, repair and maintenance service, barbering etc)
Non-farm (which does not fall in any one of the above four categories, especially this category included artisan, pottery, metallic goods, chemical products, footwear and leather products, metallic mineral products, engineering etc)
This study planned to select samples in such a way that the selected samples will proportionately represent the different categories of micro-enterprises promoted by MEDEP, as depicted in Table 3.2.
Table 3.2: Number of entrepreneurs surveyed by enterprise category
Enterprise category Planned sample size Actual sample size
Proportion (%) Number Proportion (%) Number
1. Agriculture 37.9 288 34.3 285
2. Forest 18.0 137 19.1 159
3. Food products 16.2 123 16.2 135
4. Services 17.8 135 17.3 144
5. Non-farm 10.1 77 13.1 109
Total 100.0 760 100 832
The total number of questionnaires planned was 760, while in fact 832 questionnaires were filled. There is some difference between the planned and final percentage of participants in each enterprise category. The difference occurred for two main reasons: (a) type of enterprise reported in MEDEP’s database and actual enterprise operated by selected respondents did not correspond with each other (probably this is due to data entry problem) and (b) shifting of enterprises by the selected respondents which still remained updating from the part of DMEGA and so by MEDEP.
3.2.2 Qualitative method Qualitative method included intensive participatory interactions with a large number of actors, stakeholders and communities or beneficiaries households, key informant surveys, oral history, focus group discussions, time line preparation, preparation of impact diagram, observation, flow chart etc. Qualitative/ participatory methods provided critical insights into beneficiaries’ perceptions, value of programme to beneficiaries, the processes that have affected outcomes, and interpretation of results observed in quantitative survey.
In each study districts, interactive discussions were held with BDSPOs, D-MEGA, MEGA and MEG to identify key livelihoods changes, impacts at three levels (households, district, institutional and national level) and other issues as required for the purpose of the study including the nature and types of changes (positive, negative, intended, not intended) brought about by the micro-enterprises. During the focus group discussions, several tools of participatory rural appraisals (PRAs) were used. Focus group discussions were carried out with 56 MEGs from nine study districts. Apart from this, 16 group operated enterprises were also surveyed for the enterprise assessment.
3.3 Survey Execution
An objectively designed and pre-tested survey instruments were used to collect quantitative and qualitative information. Data collection instruments, including survey questionnaire were revised through the discussions with the clients, partner NGOs of the project. The revised instruments were pre tested in Kavrepalanchok for relevance and appropriateness and further reformed before translation into the Nepali language and printing for the purpose of survey.

12
A three day long orientation participatory training was organized to orient field supervisors and enumerators on study approaches, methods, and survey instruments. In the first day, enumerators were given orientation about the project, food security concepts, survey objectives and methodology, sample size, techniques for selecting sample households, ways of administering questionnaires with households and communities, role and responsibilities of the district coordinator, supervisor and enumerators etc. Second day was spent on field exercise, especially on household survey and administration of group discussion instruments. In third day, feedback session was organized to share problems and challenges of using survey instruments. Further to training, one to one feedbacks were provided to the enumerators and supervisors after reviewing the questionnaire filled by them. Necessary guidelines were provided to them thereafter. A four teams comprising of supervisor and five enumerators conducted survey from Last week of August to end of September, 2010. Enumerators were responsible for executing survey while field supervisor provided mentoring and technical back-stopping support to the survey team. Field supervisors cross checked and edited questionnaire filled by the enumerators to avoid discrepancies and data inconsistencies. The enumerators and field supervisors were made to visit same respondents again when any discrepancies were observed for any reasons- negligence or human error. Information collected through the survey questionnaires were edited in the field then and there for consistency through the techniques of random check, comparison of inters- and intra ward responses and discussions with the key informants. Consultants and subject matter specialist supervised the survey work.
3.4 Data Analysis Data entry software has been designed in CSProS (Census and Survey Processing System) programme for participants and non-participants survey. Open-ended questions were coded prior to entering into computer and edited information are entered into the database software. Entered data were thoroughly checked to remove entry errors and inconsistencies. Data were then transferred into Statistical Package for Social Sciences (SPSS Ver 13.0) and processed accordingly.
Participant’s survey data has been analyzed by (a) gender (b) caste group, (c) phase and (d) enterprise category while that of non-participants are analyzed by a) gender and (b) caste/ ethnic groups. The caste classifications includes the following (a) BCTS: This comprises Brahmin, Thakuri, Chhetri and syansi (BCTS) caste people who are living mainly in the hills, mountains or terai. This includes both hill and terai caste people; (b) Janajati: Indigenous people/nationalities (Janajati) are those ethnic groups or communities enlisted who has their own mother tongue and traditional costumes, distinct cultural identity, distinct social stricture or written or oral history of their own. They have their own mother tongue and traditional culture (c) Dalit: Dalit are considered lower in the caste hierarchy and some are even considered untouchable Hindu groups, such as Kami, Sarki, Damai, Badi and Gaine in the hills and caste like Tatma, Bantar, Musahar, Chamar, Dom and (d) Others: a category that includes other terai backward caste groups, such as backward castes like Halwai, Hajam, Sonar, Lohar, and Rajbhar. This also includes a small number of religious groups such as Muslims.
The data were stratified by gender and caste group to make cohort analysis of net impact of intervention at households and individual level by comparing changes among participants and non-participants while data were disaggregated by phase and enterprises to assess the impact of intervention at the enterprise level.
Simple statistical tools such as mean, range, and percentage have been used for the analysis of quantitative data, whereas descriptive method has been used for the analysis of qualitative data. Statistical significance test was carried out among participants and non-participants at present wherever applicable. Where ever data, information and findings from
13
the field survey have been presented through appropriate graphics (diagrams, photographs, etc). The qualitative data are mostly used in building discussion and interpretation.
3.5 Limitations
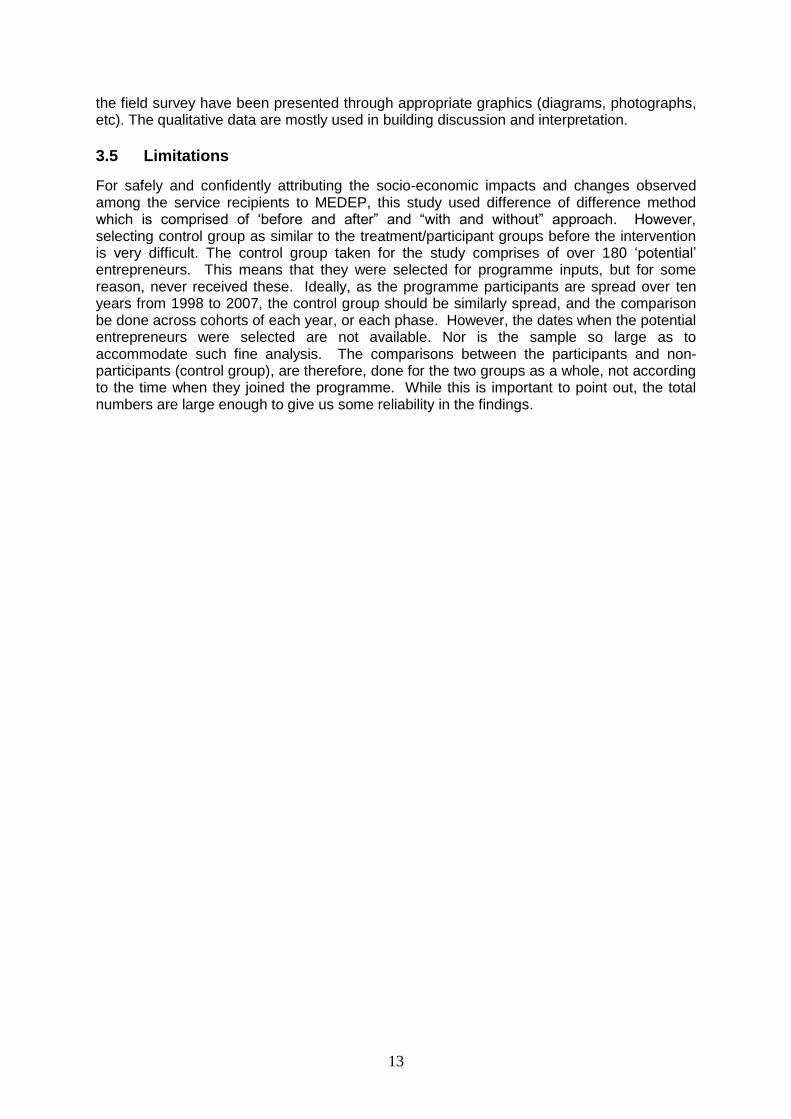
For safely and confidently attributing the socio-economic impacts and changes observed among the service recipients to MEDEP, this study used difference of difference method which is comprised of ‘before and after” and “with and without” approach. However, selecting control group as similar to the treatment/participant groups before the intervention is very difficult. The control group taken for the study comprises of over 180 ‘potential’ entrepreneurs. This means that they were selected for programme inputs, but for some reason, never received these. Ideally, as the programme participants are spread over ten years from 1998 to 2007, the control group should be similarly spread, and the comparison be done across cohorts of each year, or each phase. However, the dates when the potential entrepreneurs were selected are not available. Nor is the sample so large as to accommodate such fine analysis. The comparisons between the participants and non-participants (control group), are therefore, done for the two groups as a whole, not according to the time when they joined the programme. While this is important to point out, the total numbers are large enough to give us some reliability in the findings.

14
4 PROFILE OF RESPONDENTS
This chapter presents demographic and socio-economic characteristics of respondents3 which include MEDEP participants and non-participants (control groups). MEDEP participants refer to those entrepreneurs who were randomly selected from the list of the
entrepreneurs4 of nine survey districts provided by MEDEP in August 2010. This list
included active, semi-active and in-active entrepreneurs as per MEDEP’s classification and this does not include those entrepreneurs who died, moved on marriage or migrated. A pre-determined number of entrepreneurs were selected from each of the nine districts covered in the study, to give a total of 840 entrepreneurs. Of these, responses of 832 were retained and that of 8 were discarded due to inconsistency and incomplete responses. In addition to this, sample replacement rate of participants varied between 10 to 20 percent by study districts who were away from home at the time of field survey.
Control groups are considered non-participants (without intervention). As the control group needs to have people with similar characteristics as MEDEP participants, the list of the potential entrepreneurs was taken for the control group selection. These were people who were identified on MEDEP selection criteria, but have not received any support and services from MEDEP, as they are waiting to receive its services. The list was obtained from MEDEP to select respondents for the control group/non-participants. Of 185 non-participant surveyed, responses of 183 respondents have been retained. Sample replacement rate of non-participants varied between 20 to 25 percent by study districts who died, moved on marriage, migrated or were away at the time of study.
4.1 Respondents Characteristics
The profile of respondents of the survey, both participants and the non-participant, are described below.
4.1.1 Sex, ethnicity and age group Table 4.1 shows the number of respondents and percent distribution of the MEDEP participants and non-participants (control group) by sex, ethnicity and age group.
Table 4.1: Distribution of respondents by sex, ethnicity and age groups
Respondent categories Participants Non-participants
Number Percent No %
Overall 832 100.0 183 100.0
A. Gender
Women 586 70.4 142 77.6
Men 246 29.6 41 22.4
B. Caste/Ethnicity
BCTS 246 29.6 44 24.0
Dalit 198 23.8 50 27.3
Janajati 329 39.5 62 33.9
Others 59 7.1 27 14.8
C. Age group
Adult (15-29)* 177 21.3 63 34.4
Youth (30-59) 606 72.8 116 63.4
Elderly (Above 60 years) 49 5.9 4 2.2
3 Respondents refer to individuals from both MEDEP participants and control groups. 4 In this report, entrepreneurs means micro-entrepreneurers unless stated otherwise.
15
The characteristics of the participants are almost similar to that of non-participants, except for a few differences. The proportion of women and Dalit were slightly higher in control group compared to participants. Likewise, control group is comprised of 14.8% other Terai caste group whereas 7.1% individuals were found among participants. 4.1.2 Literacy and educational status
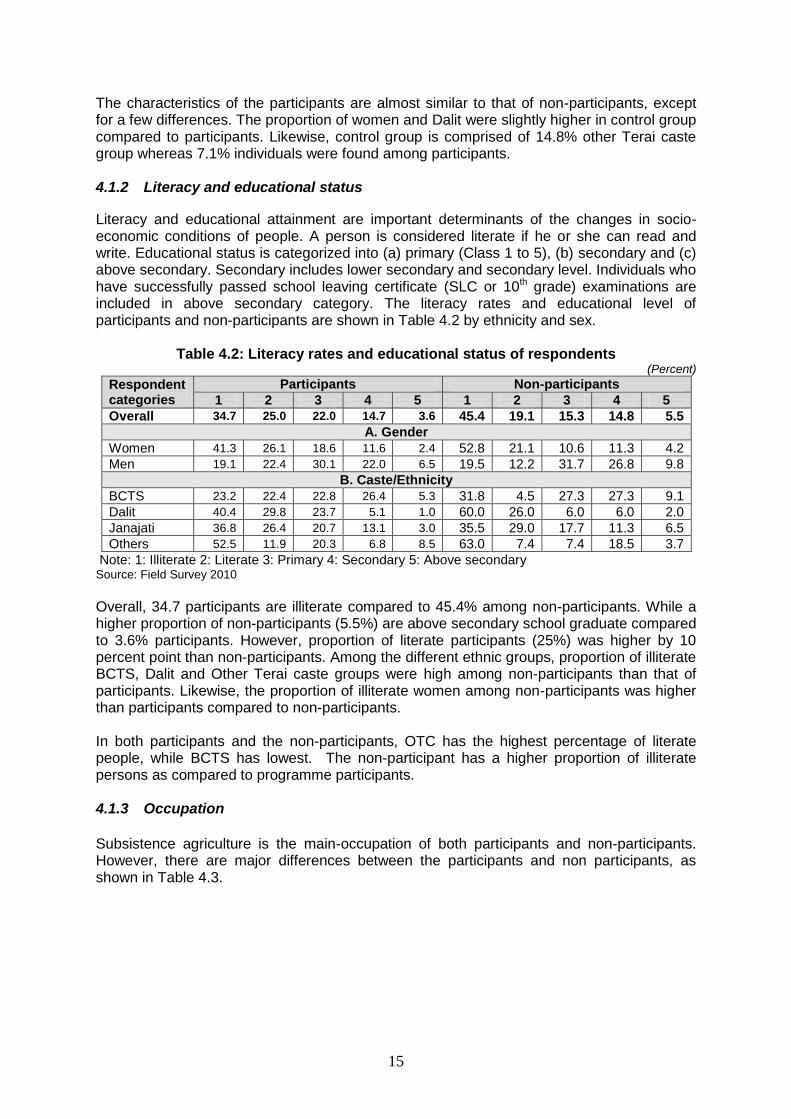
Literacy and educational attainment are important determinants of the changes in socio-economic conditions of people. A person is considered literate if he or she can read and write. Educational status is categorized into (a) primary (Class 1 to 5), (b) secondary and (c) above secondary. Secondary includes lower secondary and secondary level. Individuals who have successfully passed school leaving certificate (SLC or 10th grade) examinations are included in above secondary category. The literacy rates and educational level of participants and non-participants are shown in Table 4.2 by ethnicity and sex.
Table 4.2: Literacy rates and educational status of respondents (Percent)
Respondent categories
Participants Non-participants
1 2 3 4 5 1 2 3 4 5
Overall 34.7 25.0 22.0 14.7 3.6 45.4 19.1 15.3 14.8 5.5
A. Gender
Women 41.3 26.1 18.6 11.6 2.4 52.8 21.1 10.6 11.3 4.2
Men 19.1 22.4 30.1 22.0 6.5 19.5 12.2 31.7 26.8 9.8
B. Caste/Ethnicity
BCTS 23.2 22.4 22.8 26.4 5.3 31.8 4.5 27.3 27.3 9.1
Dalit 40.4 29.8 23.7 5.1 1.0 60.0 26.0 6.0 6.0 2.0
Janajati 36.8 26.4 20.7 13.1 3.0 35.5 29.0 17.7 11.3 6.5
Others 52.5 11.9 20.3 6.8 8.5 63.0 7.4 7.4 18.5 3.7
Note: 1: Illiterate 2: Literate 3: Primary 4: Secondary 5: Above secondary Source: Field Survey 2010
Overall, 34.7 participants are illiterate compared to 45.4% among non-participants. While a higher proportion of non-participants (5.5%) are above secondary school graduate compared to 3.6% participants. However, proportion of literate participants (25%) was higher by 10 percent point than non-participants. Among the different ethnic groups, proportion of illiterate BCTS, Dalit and Other Terai caste groups were high among non-participants than that of participants. Likewise, the proportion of illiterate women among non-participants was higher than participants compared to non-participants. In both participants and the non-participants, OTC has the highest percentage of literate people, while BCTS has lowest. The non-participant has a higher proportion of illiterate persons as compared to programme participants. 4.1.3 Occupation
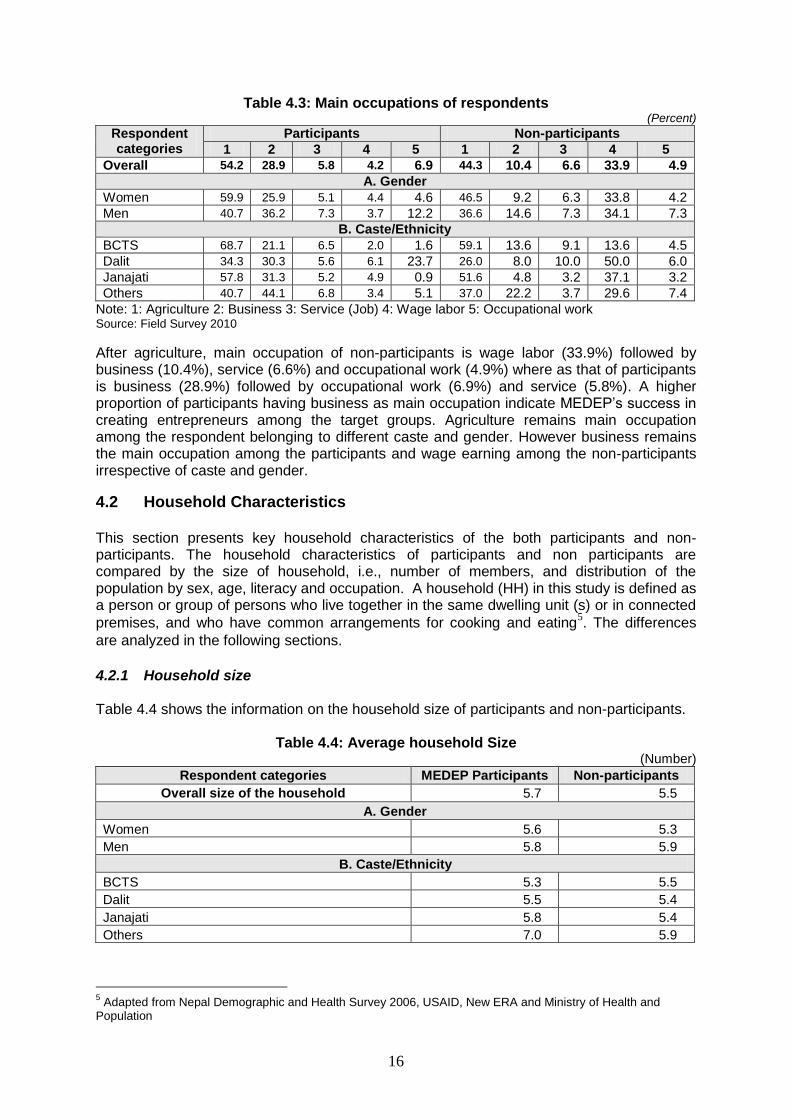
Subsistence agriculture is the main-occupation of both participants and non-participants. However, there are major differences between the participants and non participants, as shown in Table 4.3.
16
Table 4.3: Main occupations of respondents (Percent)
Respondent categories
Participants Non-participants
1 2 3 4 5 1 2 3 4 5
Overall 54.2 28.9 5.8 4.2 6.9 44.3 10.4 6.6 33.9 4.9
A. Gender
Women 59.9 25.9 5.1 4.4 4.6 46.5 9.2 6.3 33.8 4.2
Men 40.7 36.2 7.3 3.7 12.2 36.6 14.6 7.3 34.1 7.3
B. Caste/Ethnicity
BCTS 68.7 21.1 6.5 2.0 1.6 59.1 13.6 9.1 13.6 4.5
Dalit 34.3 30.3 5.6 6.1 23.7 26.0 8.0 10.0 50.0 6.0
Janajati 57.8 31.3 5.2 4.9 0.9 51.6 4.8 3.2 37.1 3.2
Others 40.7 44.1 6.8 3.4 5.1 37.0 22.2 3.7 29.6 7.4
Note: 1: Agriculture 2: Business 3: Service (Job) 4: Wage labor 5: Occupational work Source: Field Survey 2010
After agriculture, main occupation of non-participants is wage labor (33.9%) followed by business (10.4%), service (6.6%) and occupational work (4.9%) where as that of participants is business (28.9%) followed by occupational work (6.9%) and service (5.8%). A higher proportion of participants having business as main occupation indicate MEDEP’s success in creating entrepreneurs among the target groups. Agriculture remains main occupation among the respondent belonging to different caste and gender. However business remains the main occupation among the participants and wage earning among the non-participants irrespective of caste and gender.
4.2 Household Characteristics This section presents key household characteristics of the both participants and non-participants. The household characteristics of participants and non participants are compared by the size of household, i.e., number of members, and distribution of the population by sex, age, literacy and occupation. A household (HH) in this study is defined as a person or group of persons who live together in the same dwelling unit (s) or in connected
premises, and who have common arrangements for cooking and eating5. The differences
are analyzed in the following sections.
4.2.1 Household size Table 4.4 shows the information on the household size of participants and non-participants.
Table 4.4: Average household Size
(Number)
Respondent categories MEDEP Participants Non-participants
Overall size of the household 5.7 5.5
A. Gender
Women 5.6 5.3
Men 5.8 5.9
B. Caste/Ethnicity
BCTS 5.3 5.5
Dalit 5.5 5.4
Janajati 5.8 5.4
Others 7.0 5.9
5 Adapted from Nepal Demographic and Health Survey 2006, USAID, New ERA and Ministry of Health and
Population

17
The average household size of the participants is 5.7 and that of non-participants is 5.5. The average HH size of other caste people which include Muslims is high among both the participant and non-participant while BCTS has lower family size among participants and Dalit and Janajati among non-participants. The average HH size of men was higher among both the participants and non-participants (5.8 and 5.9 person respectively). Interestingly, women had smaller household size, which was found similar among both participants and non-participants too. This could be because women-headed households tend to be smaller (often because the man has died or migrated or left the woman).
Table 4.5 distributes population of male and female among participant and non-participant.
Table 4.5: Distribution of HH population by sex (Percent)
Respondent categories MEDEP Participants) Non-participants
Women Men Women Men
Overall 48.4 51.6 49.1 50.9
A. Gender
Women 48.8 51.2 49.7 50.3
Men 47.6 52.4 47.1 52.9
B. Caste/Ethnicity
BCTS 50.3 49.7 49.2 50.8
Dalit 48.4 51.6 51.5 48.5
Janajati 47.1 52.9 49.7 50.3
Others 48.9 51.1 43.7 56.3
As seen in this table, overall, proportion of male was slightly higher and than female among both types of respondents, i.e. participants and non-participants. This situation remains similar by gender. However, it varies by caste/ethnicity. Proportion of women members was high among BCTS in case of participants while it was Dalit among non-participants. 4.2.2 Household population by age groups
Age group are classified into 4 categories namely (a) children (upto 14 years) (b) youth (15 to 29 years), (c) adult (30 to 60 years) and elders (60 years and above. Table 4.6 shows distribution of members of participant and non-participant HHs by age groups.
Table 4.6: Distribution of family members by age groups (Percent)
Respondent categories
Participants Non-participants
Children Youth Adult Elders Children Youth Adult Elders
Overall 29.6 33.0 31.3 6.1 34.5 30.4 30.5 4.6
A. Gender
Female 29.6 32.9 31.8 5.7 34.7 30.9 30.3 4.1
Male 29.6 33.2 30.2 7.0 33.9 28.9 31.0 6.2
B. Caste/Ethnicity
BCTS 29.1 32.2 32.6 6.1 28.8 31.3 35.8 4.2
Dalit 32.2 32.6 31.2 4.0 34.0 29.1 31.3 5.6
Janajati 27.1 35.1 30.6 7.2 37.1 29.9 27.5 5.4
Others 35.9 27.0 30.6 6.5 38.6 32.3 27.2 1.9
There is slight variation on age group among participants and non-participants. Overall, majority of family members of participants HHs are young (33%) while that of non-participants are children (34.5%). Likewise proportion of elders is higher among participants compared to non-participants. Nevertheless, adult population is almost similar among these two groups.

18
In case of gender, youth population dominates the population of participants while children dominate the population of non-participants irrespective of women and men respondents. BCTS has higher proportion of adult among both the participants and non-participants while family member of Dalit participants and non-participants are dominated by youth and children respectively.
4.2.3 Literacy status
Literacy is ratio of the people who can read and write to the total population above 5 years of age, Table 4.7 presents literacy status of the households.
Table 4.7: Distribution of literacy of family members of five years and above (Percent)
Respondent categories
MEDEP Participants Non-participant HHs
Total Men Women Total Men Women
Overall 81.1 87.4 74.4 77.0 83.2 61.7
A. Gender
Female 81.4 87.2 75.3 76.9 83.1 63.2
Male 80.4 87.7 72.2 77.4 83.5 57.1
B. Caste/Ethnicity
BCTS 85.7 92.8 78.6 83.4 92.0 63.4
Dalit 77.8 83.1 72.2 72.4 76.4 71.8
Janajati 83.3 88.4 77.4 77.5 82.5 63.7
Others 64.6 76.4 52.4 73.8 81.7 41.6
Literacy rate of family members of both participants and non-participants are almost similar (81.1 percent and 77.0 percent respectively). However, it varies by gender since literacy rate of men is higher than women in case of both participants and non-participants. Nevertheless, literacy rate of both the men and women is high among participants compared to non-participants. Among different ethnic groups, BCTS and Janajati have higher literacy rate irrespective of respondent category and gender whereas that of others and Dalit has lowest literacy rate among participants and non-participants respectively. This suggests BCTS HHs have access to education compared to other caste group. .
4.2.4 Occupational structure
Occupation of family members of both the participants and non-participants above 10 years of age are classified into four categories based on their involvement with different activities, which includes study, farm activities, non-farm and dependent (less than 5 years old and above 60 years). The data is presented in Table 4.8.
Table 4.8: Distribution of occupation of family members of 10 years and above (Percent)
Respondent categories
Participants Non-participant
Study Farm Non-farm
Dependent Study Farm Non-farm
Dependent
Overall 33.4 33.9 21.1 11.6 30.7 37.0 13.8 18.5
A. Gender Female 34.0 34.6 20.5 10.9 31.8 35.1 14.5 18.6 Male 32.1 32.2 22.5 13.2 27.1 43.1 11.7 18.1
B. Caste/Ethnicity BCTS 37.9 30.9 22.1 9.2 33.2 34.7 19.1 13.1

19
Dalit 30.1 38.1 20.0 11.9 29.7 48.1 7.1 15.1 Janajati 33.7 33.8 21.0 11.4 30.1 31.7 13.9 24.3 Others 25.6 33.3 20.7 20.4 29.4 32.8 16.8 21.0
Agriculture remains main occupation among participants and non-participants followed by study. However, more of participants are involved in non-farm while that of non-participants are dependent. The information shows that the proportion of dependents is lower among participants than non- participants (11.6% vs. 18.5%). Similarly, the proportion of students was higher among participants than non-participants. Agriculture and study remain the main occupation irrespective of gender and caste. Among the participants, the proportion of students was higher in BCTS followed by Janajati (33.7%), Dalit (30.1%) and other Terai caste (25.6%). Above data reveals that larger percentage of participants has been able to move out of subsistence agriculture to non farm sector enterprises, while non participants have a greater reliance on farm sector, and also have a higher number of dependents.
4.3 Profile of Participants This impact assessment study included two types of respondents from the perspective of proprietorship of the enterprises-personal enterprises (832 in number) and the group enterprises (16 in numbers). Group enterprises were identified and studied based on the information provided by sample respondents who did not have personal/private enterprises during the survey period but were working either as employees or members in group enterprises. Based on the information available from them, the survey team identified 16 group enterprises and questionnaires were filled for the group enterprises as well like that for the private/personal enterprises. Interviews with 832 sample respondents showed the following results with respect to the status of the enterprises operated in the sample districts (Figure 4.1).
Figure 4.1: Participants involvement in enterprises
Private
Enterprises
64%
Group
Enterprises
12%
Employees 4%
Drop Outs
20%
Private Enterprises (529)
Group Enterprises (101)
Employees (36)
Drop Outs (166)
As the sample 832 respondents6 were entrepreneurs at some point of time during the project period, this section presents the profile of all 832 respondents irrespective of whether
6 832 samples were randomly selected from the list of the entrepreneurs provided by MEDEP and none of these
respondents during the survey have reported that they have never established enterprises. However, what they said that they have dropped them for different reasons.

20
they have operating enterprises at private/personal or group level. For the purpose of this section, drop-outs are reported as those respondents with no enterprises. The table shows that 64% of MEDEP participants interviewed had private enterprises, and 12% were members of group enterprises. Four percent were employed in enterprises of other participants, and 20% have no operational businesses. The next chapter on enterprise analysis studies their behavior too and analyses the reasons for dropping the enterprises. 4.3.1 Enterprise categories
Table 4.9 disaggregates respondents by ethnicity/caste, sex and enterprise types.
Table 4.9: Percent distribution of respondents by ethnicity, sex and enterprise type
MEDEP Participants
Respondents (Number)
Enterprise type (Percent)
Agriculture Forests Food
products Service
Non-farm
None
Overall 832 33.4 13.8 9.3 13.9 9.6 20.0
A. Sex
Women 586 35.8 15.2 10.1 11.3 8.7 18.9
Men 246 27.6 10.6 7.3 20.3 11.8 22.4
B. Caste/Ethnicity
BCTS 246 43.1 8.5 15.4 10.2 0.4 22.4
Dalit 198 11.1 19.2 2.5 17.2 25.3 24.7
Janajati 329 40.4 16.1 10.0 11.2 6.4 15.8
Others 59 28.8 5.1 1.7 33.9 13.6 16.9
Data presented in this table show that nearly one third of enterprise belongs to agriculture (33.4%) followed by no enterprise (20%), service (13.9%) forest (13.8%), non-farm (9.6%) and food products (9.3%). Majority of men and women had operated agriculture related enterprise (35.8% and 27.6% respectively) followed by none (18.9% and 22.4% respectively). After agriculture, involvement of women is high in forest related enterprise (15.2%) while that of men in service sector (15.2 percent). This reveals women continue in the agricultural sector, whereas men tend to start non farm sector and service sector businesses. Among the different caste group, involvement of BCTS and Janajati is high in agriculture sector (43.1 and 40.4%% respectively) whereas that of Dalit and other terai case is involved other non-farm enterprises (23.3%) and service sector (33.9%) respectively. This shows those backward caste groups are more involved in non-farm or service sector while that of upward caste are involved in farming. 4.3.2 Nature of involvement Table 4.10 shows status of MEDEP participants by their involvement in enterprises and disaggregates data by sex, ethnicity, enterprise type and phases.
Table 4.10: Nature of involvement with enterprises
Respondent categories
Sample size Private/
Personal Groups
Employees/ workers only
None
Overall 832 63.6 12.1 4.3 20.0
A. Gender
Women 586 63.0 13.1 4.9 18.9
Men 246 65.0 9.8 2.8 22.4
B. Caste/Ethnicity
BCTS 246 63.0 13.4 1.2 22.4

21
Respondent categories
Sample size Private/
Personal Groups
Employees/ workers only
None
Dalit 198 54.0 15.7 5.6 24.7
Janajati 329 66.9 10.6 6.7 15.8
Others 59 79.7 3.4 16.9
D. Phase
Phase I 208 64.4 5.8 1.4 28.4
Phase II 624 63.3 14.3 5.3 17.1
C. Enterprise type
Agriculture 285 77.5 3.5 1.8 17.2
Forest 159 51.6 15.7 6.3 26.4
Food products 135 51.1 21.5 5.9 21.5
Service 144 75.0 6.9 1.4 16.7
Non-farm 109 45.0 24.8 10.1 20.2
Nearly two third of participants (64.4 %) are operating personal enterprises followed by none (20%), group (12.1%) and employee/workers (4.3%). This shows that nearly four-fifth of entrepreneurs are either operating or working for enterprise. Majority of the participants are working for their own enterprise irrespective of gender, caste/ethnicity, and phase and enterprise category. Data presented in this table show that the proportion of participants operating no enterprises is highest Dalit (24.7%) among followed by BCTS, others and Janajati. The proportion of women not operating no enterprises is higher (22.4%) than men. The proportion of employees in non-farm (others) type of enterprises is highest (10.1%) followed by forest based products (6.3%), service (7.8%) and food products (5.9%). This suggests that more employment can be created if MEDEP would promote enterprises like non-farm, food products, and forest based, all of which have a high potential for value addition. The likelihood of generating employment through enterprises like agriculture and service is less. Analysis across MEDEP phases shows that the proportion of respondents not operating any enterprises during the survey period was higher in first phase compared to second phase. While detail reasons for drop-outs are presented else where, it is suffice here to mention that the first phase respondents participated in MEDEP about 10 years ago and second phase participants less than 5 years ago. The other reason for a high proportion of drop-outs among first phase entrepreneurs could be due to a small sample size in first phase (25%) compared to second phase (75%). Therefore, further analysis is needed of the reasons for respondents not operating any enterprises. This is done in a later in section 10. 4.3.3 Involvement in enterprises prior to MEDEP’s intervention/support
All 832 respondents were asked whether they had been operating enterprises and if they had any skills and knowledge on the enterprises prior to MEDEP support/intervention. Responses to these two questions by sex of respondents, ethnicity and types of enterprises are presented in Table 4.11.
Table 4.11: Involvement in enterprises prior to MEDEP support
Respondent categories
Proportion of respondents who reported to have been operating
enterprises prior to receiving MEDEP support
Proportion of respondents who reported to have skills and
knowledge of the enterprise before MEDEP
Overall 39.7 38.4
A. Gender
Women 34.5 33.3
Men 53.7 51.2

22
Respondent categories
Proportion of respondents who reported to have been operating
enterprises prior to receiving MEDEP support
Proportion of respondents who reported to have skills and
knowledge of the enterprise before MEDEP
B. Caste/Ethnicity
BCTS 35.8 28.0
Dalit 49.0 51.0
Janajati 33.4 31.6
Others 66.1 79.7
C. Enterprises type
Agriculture 47.8 38.1
Forest based 48.7 47.0
Food products 16.9 18.2
Service 50.9 62.9
Non-farm 42.5 47.5
D. Phase
First 38.5 33.3
Second 40.7 51.2
Nearly two fourth of participants (39.7%) have been operating enterprises prior to receiving MEDEP support while similar proportion (38.4%) have skills and knowledge of the enterprise The data show that a higher proportion of men (54%) reported operating enterprises prior to MEDEP support than women (34.5%). This shows that a larger percentage of women have got an opportunity through MEDEP to start enterprise. Likewise, more men (51.2%) reported to have knowledge and skills about the enterprises which they have been operating than women (33.3%). This exemplifies that as women have lower level of skills, greater attention is needed from programme interventions to impart vocational and business skills to women. The project may need to follow different approach and methodology which are appropriate for training women. A higher proportion of other caste people including Muslims (66.1%) followed by Dalit reported that they had been operating enterprises prior to MEDEP intervention. Likewise, they reported to have knowledge and skills before MEDEP. As these groups were doing generally non-farm types of enterprises and their caste specific occupational job related enterprises, it is to be expected that they have prior knowledge and skills. Analysis by the type of enterprise shows that few entrepreneurs who have food businesses had businesses before they joined MEDEP. This is explained by the fact that food and beverages businesses have largely been those where MEDEP has introduced new technology, and supported Common Facility Centre (CFCs) with machines, thus adding value to the raw materials used.

23
5 ENTERPRISE ANALYSIS AND ITS IMPACTS This chapter assesses impacts of MEDEP at the enterprise level. This chapter presents evidence for assessing MEDEP model of the micro-enterprise development7 as described in chapter 2. It then assesses the changes brought about by MEDEP on the lives of the micro-entrepreneurs (MErs) at the individual level. This chapter is organized into four sections as follows. The first section is about the assistance provided by MEDEP to its target groups for micro-enterprise development. Access of different categories of target groups to different types of assistance and support provided by MEDEP are assessed in this section. Issues concerning enterprise management by entrepreneur are discussed in second section. Section 3 assesses the performance of the enterprises as perceived by the different categories of respondent’s namely individual entrepreneurs, group enterprises, members/workers working in group enterprises and contract workers. Lastly but not the least, the fourth section assesses impact of MEDEP’s interventions on diversification of enterprises including cost-benefit analysis, and employment generation. The extent to which socio-economic conditions of the different types of entrepreneurs have changed due to the participation in MEDEP in general and enterprise operation in particular are also discussed in this section. Since the focus of this section is micro-enterprises, defining micro-enterprise is necessary (see Box 5.1). This study has followed this definition while analyzing the enterprises.
Box 5.1: Definition of micro-enterprise
Micro-enterprise means any industry, enterprise or other service business, based particularly on agriculture, forest, tourism, mines and handicrafts, which meet the following conditions:
(a) In the case of a manufacturing industry, enterprise involving the investment of fixed capital of not exceeding two hundred thousand rupees, excluding house and land, and in the case of a service enterprise, an industry or enterprise involving the investment of the fixed capital of not exceeding one hundred thousand rupees.
(b) The entrepreneur himself or herself is involved in the management (c) A maximum of nine workers including the entrepreneur are employed. (d) It has annual turnover of less than two million rupees. (e) If it uses an engine or equipment, the electric capacity of such engine or equipment is less than
10 kilowatts. Source: Industrial Policy 2010
5.1 MEDEP Assistance MEDEP has been providing different type of training and support to the participants for establishing and operating enterprise. This section analyzes the access of participants to different type of training and support provided by the MEDEP.
5.1.1 Training
Training is one of the key components of MEDEP. It has been providing different types of entrepreneurial, skills oriented and business management trainings to the participants. Table 5.1 shows distribution of participants by number of training they have received.
7 See Chapter 9 for the assessment of the MEDEP model of ME development.

24
Table 5.1: Distribution of participants by number of trainings (Percent)
Number of trainings
Gender Overall
Caste/Ethnicity
Men Women BCTS Dalit Janajati Others
None 3.9 5.7 4.4 3.7 5.1 4.6 5.1
One 2.6 13.8 5.9 4.1 3.0 4.6 30.5
Two 9.6 6.1 8.5 6.9 11.6 7.0 13.6
Three 26.5 26.4 26.4 26.8 31.3 21.9 33.9
Four 18.4 11.8 16.5 16.3 15.2 20.1 1.7
Five 17.2 15.4 16.7 17.5 13.6 18.8 11.9
Six 21.8 20.7 21.5 24.8 20.2 23.1 3.4
Table 5.1 reveals that more than almost all respondents have received at least one training while more than four fifth have received three or more trainings. Likewise, almost a quarter have received six trainings. Data in Table 5.2 above show that almost 26 percent of both women and men entrepreneurs have received at least three training. Among the different caste groups, a larger proportion of other caste groups reported to have received at least three training (33.9%) followed by Dalit (21.9%) and Janjatis (21.9%). In terms of number of training, women have less access compared to men. Similarly, other terai caste and Dalit has less access to training compared to BCTS and Janajati. This reveals less access of marginalized group such as women, Dalit and other terai caste even within the poor category of the respondent. This further confirms that targeting is essential not only by economic status but also by social status such as gender and caste while providing support services to poor and marginalized group. Table 5.2 presents the distribution of participants by type of training.
Table 5.2: Distribution of participants by types of trainings (Percent)
Types of training Gender
Overall Caste/Ethnicity
Men Women BCTS Dalit Janajati Others
1. MECD 64.3 67.9 65.4 68.7 63.6 61.1 81.4
2. TOPE 92.7 77.2 88.1 88.1 94.8 96.1 69.8
3. TOSE 92.7 77.6 88.2 93.1 90.4 89.1 55.9
4. Skills 81.9 69.5 78.2 85.4 74.7 84.8 23.7
5. TOEE 52.4 43.5 49.8 50.0 44.4 57.1 25.4
6. TOGE 39.8 38.2 39.3 37.0 39.4 44.7 18.6
7. Business management
50.2 49.6 50.0 58.5 41.9 55.9 8.5
Furthermore, when respondents were asked to identify what types of training they had received, they were confused and could not report exactly what training they had received. Nearly nine-tenth of participants had received TOPE/TOSE (88.1% and 88.2% respectively) training followed by skill oriented and MECD training. During the focus group discussions, most of the participants were found misreporting about the types of training which they had received and confused among MECD, TOPE, TOSE, TOEE and TOGE. While MEDEP staff understands differences between these five types of training under MEDEP/SIYB, these differences are not understood by the entrepreneurs.
A high proportion of respondents have received all types of training (Table 5.2) which contradicts with number of training received by them. This further confirms that participants are confused with the type of training. In all interviews, a large majority of entrepreneurs acknowledged that they have received training a few times and argued how important was these training to them to initiate and run enterprises but could not identify exactly the type of training. Annual assessment of training or even once in three years would have helped MEDEP to streamline these four levels into maximum of two steps.
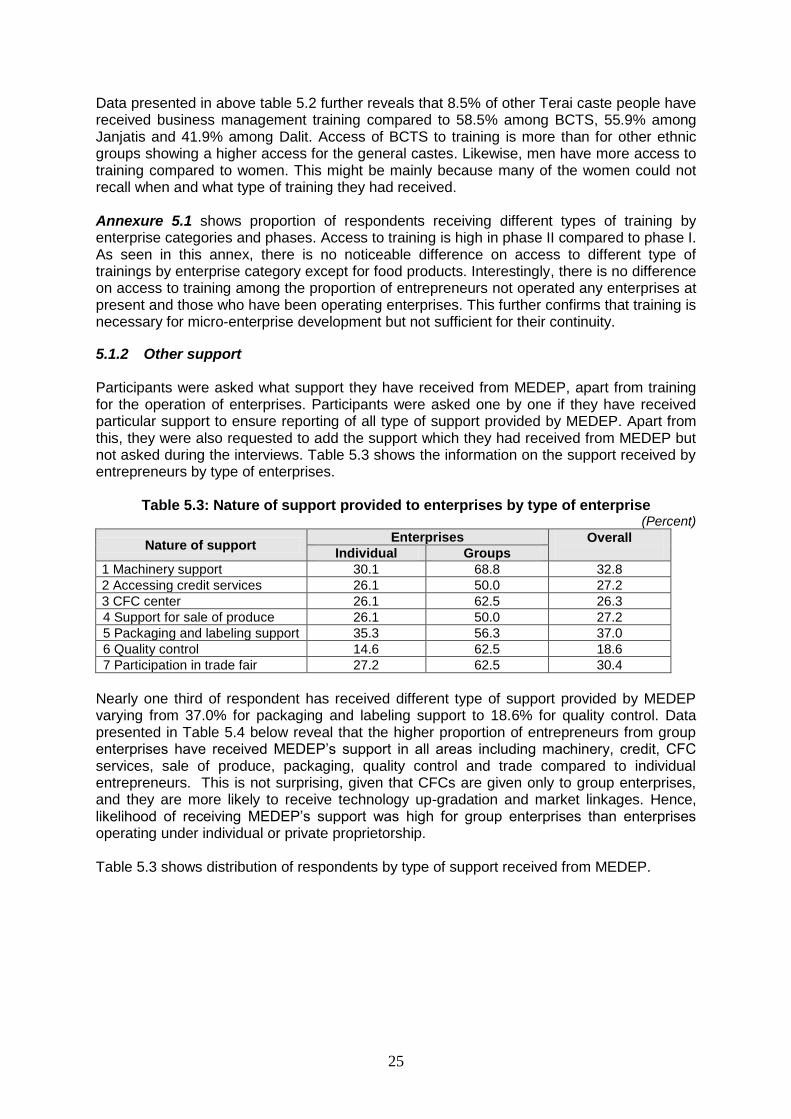
25
Data presented in above table 5.2 further reveals that 8.5% of other Terai caste people have received business management training compared to 58.5% among BCTS, 55.9% among Janjatis and 41.9% among Dalit. Access of BCTS to training is more than for other ethnic groups showing a higher access for the general castes. Likewise, men have more access to training compared to women. This might be mainly because many of the women could not recall when and what type of training they had received. Annexure 5.1 shows proportion of respondents receiving different types of training by enterprise categories and phases. Access to training is high in phase II compared to phase I. As seen in this annex, there is no noticeable difference on access to different type of trainings by enterprise category except for food products. Interestingly, there is no difference on access to training among the proportion of entrepreneurs not operated any enterprises at present and those who have been operating enterprises. This further confirms that training is necessary for micro-enterprise development but not sufficient for their continuity.
5.1.2 Other support Participants were asked what support they have received from MEDEP, apart from training for the operation of enterprises. Participants were asked one by one if they have received particular support to ensure reporting of all type of support provided by MEDEP. Apart from this, they were also requested to add the support which they had received from MEDEP but not asked during the interviews. Table 5.3 shows the information on the support received by entrepreneurs by type of enterprises.
Table 5.3: Nature of support provided to enterprises by type of enterprise (Percent)
Nature of support Enterprises Overall
Individual Groups
1 Machinery support 30.1 68.8 32.8
2 Accessing credit services 26.1 50.0 27.2
3 CFC center 26.1 62.5 26.3
4 Support for sale of produce 26.1 50.0 27.2
5 Packaging and labeling support 35.3 56.3 37.0
6 Quality control 14.6 62.5 18.6
7 Participation in trade fair 27.2 62.5 30.4
Nearly one third of respondent has received different type of support provided by MEDEP varying from 37.0% for packaging and labeling support to 18.6% for quality control. Data presented in Table 5.4 below reveal that the higher proportion of entrepreneurs from group enterprises have received MEDEP’s support in all areas including machinery, credit, CFC services, sale of produce, packaging, quality control and trade compared to individual entrepreneurs. This is not surprising, given that CFCs are given only to group enterprises, and they are more likely to receive technology up-gradation and market linkages. Hence, likelihood of receiving MEDEP’s support was high for group enterprises than enterprises operating under individual or private proprietorship. Table 5.3 shows distribution of respondents by type of support received from MEDEP.

26
Table 5.3: Distribution of respondents by types of support received from MEDEP (Percent)
Nature of support Phase Enterprise type
I II Agri Forest Service Food
products Non-farm
1 Machinery support 18.7 37.4 38.1 26.1 54.5 15.5 51.3
2 Accessing credit 26.3 27.5 27.3 32.2 37.7 26.7 33.8
3 CFC center 24.4 26.9 23.7 40.0 29.9 20.7 53.8
4 Support for sale of produce
38.8 36.5 33.5 62.6 55.8 13.8 48.8
5 Packaging and labeling support
38.8 36.5 18.3 33.9 53.2 6.9 20.0
6 Quality control 15.8 19.6 13.7 21.7 45.5 7.8 31.3
7 Participation in trade fair 27.3 31.5 29.5 45.2 49.4 12.1 53.8
Table 5.3 reveals that MEDEP’s assistance during the second phase is more intensive compared to the first phase. However, proportion of respondents reporting to have received any support ranged between 15 to 39%. This suggests that the coverage of MEDEPs by different types of support is limited. There is no big difference among respondent receiving different type of support from MEDEP by phases except for machinery. Majority of enterpreneurs involved in forest products (62.6%) and service type of enterprises (55.8%) reported to have received MEDEP’s support for the sale of their products. Among those who received support, the proportion of respondents reporting support for Common Facility Centre was highest for forest-based products (62.6%) followed by services (55.8%), non-farm (48.8%), agriculture (33.5%) and food products (13.8%). This suggests that the probability of access of entrepreneurs to CFC service is high when they operate forest-based, service and non-farm enterprises. The proportion of respondents reporting to have received MEDEP’s support for quality control services was 20% during both phases suggesting MEDEP’s inadequate focus on market needs, demands and consumers requirements. Box 5.2 below summarizes the results of FGDs with regard to their perceptions on timeliness and adequacy of services provided by MEDEP.
The table shows that except for the training majority of MEs consider the support are not provided timely. Likewise, very few reported that support provided by MEDEP is inadequate.
Box 5.2: Perceptions on MEDEP’s services (n=56)
S.N. Services Timeliness of the support Adequacy of the support
No. of groups % No. of groups %
1 Training 30 53.6 22 39.3
2 Provision of Machineries and equipments 19 33.9 15 26.8
3 Technical support 4 7.1 4 7.1
4 Coordination with stakeholders 2 3.6 1 1.8
5 Access to credit 8 14.3 4 7.1
6 Marketing of products 4 7.1 2 3.6
7 Physical infrastructures/ CFC etc 2 3.6 1 1.8
Source: Focus Group Discussions

27
5.2 Enterprise Management This section analyses business management by individual and group enterprises. Enterprise management includes management of raw materials, use of technologies, financing arrangements, establishing backward and forward linkages and marketing of produce. 5.2.1 Management of raw materials
Timely and regular availability of raw materials at reasonable prices is important for operation of enterprises. Both individual enterprises and group enterprises were asked how they have been managing raw materials. A large majority of enterprises reported that raw materials are self produced and they do not need to make extra efforts8. Figure 5.1 below shows the proportion of entrepreneurs according to their management of raw materials.
Figure 5.1: Management of raw materials
24.4
18.5
6.6
12.5
31.3
18.8
24.0
18.9
7.0
0
5
10
15
20
25
30
35
40
Self production Extra efforts made Received support from other
agencies
Pe
rce
nta
ge
Private Group Overall
The data presented in Figure 5.1 show that about a quarter of the individual or private enterprises produce raw materials by themselves. About 19% of private individual entrepreneurs need to make extra efforts to procure raw materials, and 6.6% have received external support for procuring raw materials. By comparison, only 12.5% of group entrepreneurs produce the raw materials they use, 31.3% need to make extra efforts to procure these, and 19% have received support from other agencies such as District Forest Office, Community Forestry Groups, Village Development Committees, District Development Committees, Agricultural Service Centres etc., Box 5.1 below presents a case from Dhanusha district depicting how a Micro Enterprise Group (MEG) managed raw materials for the production of traditional Lac Bangles.
Box 5.1: Sansaro Mandal of Bhurawa VDC, Dhanusha District A few years ago, Bhurawa VDC was hardly known in Dhanusha district and to outsiders. After the start of MEDEP’s intervention and its assistance to a few very poor selected women in this VDC to operate MEs of bangles-made from Lac, this VDC has become famous and known as Lac bangles village in Dhanusha district. Many visitors come to this village every day to purchase bangles and also
8 Here over 90% of the enterprises considered are from agriculture, forest or food sector. Whenever
entrepreneurs produce the raw materials used by the enterprise, it is referred to as “self production”. Extra efforts” implies that they have to buy the raw material from the growers, or nearby markets. Support from other agencies could be from the agriculture or forest or industries department, or from MEDEP’s staff.

28
to sell raw materials, particularly Lac and decorative items used in the Bangles but at much higher prices. Wearing attractive Lac bangles is important for Terai women, particularly in festivals and social functions. As there is a high demand for this kind of traditional bangles in Nepal and bordering cities of India, many poor women started to produce bangles on their own initiative. They have been innovating several attractive designs so that they could compete in the market and add value to their products. The number of bangle MEs operating in this village far exceeds the number of formally reported bangle MEs established in this village through MEDEP support, showing a clear demonstration effect and positive externalities of the MEDEP project. However, Lac, the basic raw material, is not available locally but is imported from India with a lot of formal and informal hassles and harrassments. To overcome this constraint, the members of micro-enterprise group (MEG), all of whom are women, assisted one of their members, Ms. Sansaro Mandal, to open a retail shop in Bhurawa village for selling Lac and other decorative items. For starting business, MEG provided her loan through its saving and credit scheme. Now, procuring Lac from this shop is much cheaper compared to bringing directly from India as she purchases at wholesale price from India. Local procurement has not only saved labour and time but also avoided harassments. This, in turn, has contributed to the multiplication of Bangel MEs in Bhurawa and the neighbouring VDC.
Table 5.5 Management of raw materials by enterprise categories, gender and ethnicity
Enterprises Respondents
(Number) Self production
Extra efforts made
Support from other agencies
Overall 529 24.4 18.5 6.6
A. Enterprises type
Agriculture 258 29.1 19.4 7.0
Forest 89 39.3 16.9 5.6
Food products 33 39.4 36.4 21.2
Service 107 2.8 14.0 2.8
Others 42 7.1 14.3 4.8
B. Gender
Women 369 25.2 18.7 4.9
Men 160 22.5 18.1 10.6
C. Caste/Ethnicity
BCTS 155 33.5 25.8 9.0
Dalit 107 11.2 15.9 2.8
Janajati 220 28.6 15.5 6.4
Others 47 4.3 14.9 8.5
The data show that nearly 40% entrepreneurs involved in forest based products and food products reported that they have been using their own production. Proportion of respondents reporting self- production in forest products was high because respondents harvested raw materials from community forests and considered collecting forest products (raw materials) from them as their own production. Similarly, the MEs in agricultural sector have high production of raw materials, presumably seeds, etc. The gender difference is not significant. Caste differentials are high, with more BCTS and Janajati showing a higher percentage producing raw materials. Presumably they have higher land-ownership (BCTS) and higher proximity to forests (Janajati) as compared to Dalit, especially. Very few participants had received support for management of raw materials. In terms of external support, BCTS have received greater support of other agencies (9%) as compared to Dalit (3%) Among the enterprise categories, a larger proportion of entrepreneurs involved in food products reported to have received support of other agencies followed by agriculture and forest based products. Gender differences are highlighted by the fact that more men owned enterprises (11%) get external support as compared to women’s enterprises (5%).

29
5.2.2 Technology Technologies have been divided into three types namely, modern, improved and traditional. Modern technologies refer to the use of new machineries and equipments, for example use of briquette machine, bamboo cutting machine, Bangle dye and cutting dyes etc. Improved technology means improvements in existing machineries or equipments such as use of fan to make fire, motors/engines to improve efficiency, or use of improved seeds. Traditional technologies mean continuation of their existing/local practices. Table 5.6 presents the use of different types of technologies by different enterprise types.
Table 5.6: Types of Technology used by MEDEP participants (Percent)
Respondents
(Number) New/Modern Improved Traditional
Individual 529 34.4 47.8 17.8
Group 16 68.8 31.3 -
Overall 545 35.4 47.3 17.2
As seen in the table above, 68.8% group enterprises reported that they have been using modern technologies compared to 4.4.3% by individual enterprises. Data show that more than 80% individual enterprises and all the group enterprises have been using either modern or improved technologies. Proportion of entrepreneurs using traditional technology is small (17.8%). This shows clearly that MEDEP has contributed to the use of improved and new/modern technologies. When analyses by enterprise categories, gender, ethnicity/caste and MEDEP phases (see Annexure 5.2), the data reveal that the highest proportion of food products enterprises used improved technologies (54.5%) followed by service enterprise (51.4%), agriculture (50.4%), non-farm (40.5%) and forest based (37.1%). Likewise, equal proportion of women and men used modern technologies but the former remained behind in using improved technologies. This is indicative of men having greater access to improved technologies than women. This corroborates the earlier data showing that men are more likely to receive trainings as compared to women. When analyzing by ethnicity, the proportion of Dalit was found higher among those who reported using of modern technologies and that of BCTS for improved technologies. This suggests mixed performance of MEDEP with regard to its coverage for the promotion of improved and modern technologies by gender and different caste/ethnic groups. Table 5.7 below presents perceptions of individual and group enterprises on the usefulness of the modern and improved technologies. Table 5.7: Perceptions about the usefulness of the modern and improved technology
(Percent)
Type of Enterprises
Reported case
Increased labor productivity
Increased production
capacity
Reduced cost of production
Individual 435 87.4 87.6 78.4
Group 16 93.8 93.8 93.8
Overall 451 87.6 87.8 78.9
The above data show that nearly 9 out of 10 of both group and individual enterprises have been able to improve labor productivity, production capacity and reduce the cost of production through adoption of modern and improved technologies. As seen earlier, the group enterprises received a little more support than individual enterprises. MEDEP’s current
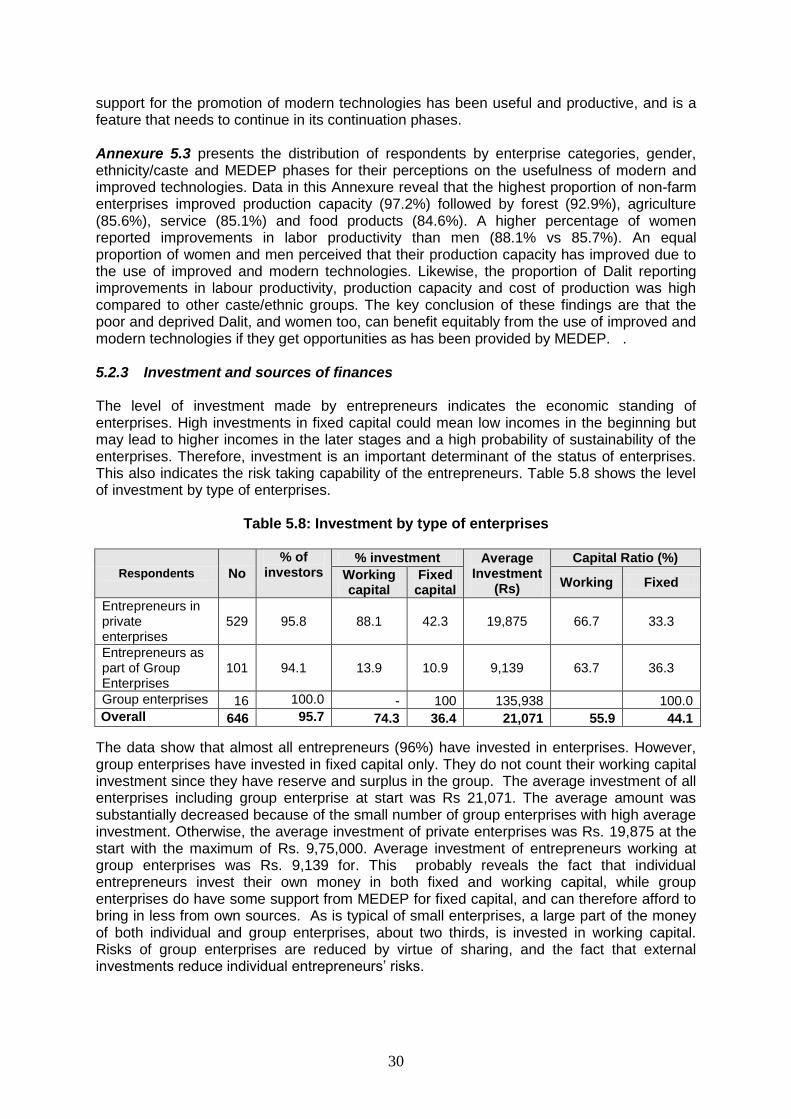
30
support for the promotion of modern technologies has been useful and productive, and is a feature that needs to continue in its continuation phases. Annexure 5.3 presents the distribution of respondents by enterprise categories, gender, ethnicity/caste and MEDEP phases for their perceptions on the usefulness of modern and improved technologies. Data in this Annexure reveal that the highest proportion of non-farm enterprises improved production capacity (97.2%) followed by forest (92.9%), agriculture (85.6%), service (85.1%) and food products (84.6%). A higher percentage of women reported improvements in labor productivity than men (88.1% vs 85.7%). An equal proportion of women and men perceived that their production capacity has improved due to the use of improved and modern technologies. Likewise, the proportion of Dalit reporting improvements in labour productivity, production capacity and cost of production was high compared to other caste/ethnic groups. The key conclusion of these findings are that the poor and deprived Dalit, and women too, can benefit equitably from the use of improved and modern technologies if they get opportunities as has been provided by MEDEP. . 5.2.3 Investment and sources of finances The level of investment made by entrepreneurs indicates the economic standing of enterprises. High investments in fixed capital could mean low incomes in the beginning but may lead to higher incomes in the later stages and a high probability of sustainability of the enterprises. Therefore, investment is an important determinant of the status of enterprises. This also indicates the risk taking capability of the entrepreneurs. Table 5.8 shows the level of investment by type of enterprises.
Table 5.8: Investment by type of enterprises
Respondents No
% of investors
% investment Average Investment
(Rs)
Capital Ratio (%)
Working capital
Fixed capital
Working Fixed
Entrepreneurs in private enterprises
529 95.8 88.1 42.3 19,875 66.7 33.3
Entrepreneurs as part of Group Enterprises
101 94.1 13.9 10.9 9,139 63.7 36.3
Group enterprises 16 100.0 - 100 135,938 100.0
Overall 646 95.7 74.3 36.4 21,071 55.9 44.1
The data show that almost all entrepreneurs (96%) have invested in enterprises. However, group enterprises have invested in fixed capital only. They do not count their working capital investment since they have reserve and surplus in the group. The average investment of all enterprises including group enterprise at start was Rs 21,071. The average amount was substantially decreased because of the small number of group enterprises with high average investment. Otherwise, the average investment of private enterprises was Rs. 19,875 at the start with the maximum of Rs. 9,75,000. Average investment of entrepreneurs working at group enterprises was Rs. 9,139 for. This probably reveals the fact that individual entrepreneurs invest their own money in both fixed and working capital, while group enterprises do have some support from MEDEP for fixed capital, and can therefore afford to bring in less from own sources. As is typical of small enterprises, a large part of the money of both individual and group enterprises, about two thirds, is invested in working capital. Risks of group enterprises are reduced by virtue of sharing, and the fact that external investments reduce individual entrepreneurs’ risks.

31
Annexure 5.4 presents the distribution of entrepreneurs (individual and group) by enterprise categories, gender, ethnicity/caste and MEDEP phases. Data in this Annexure show that the average investment at the start was highest for food products (Rs. 32,107) followed by services (Rs. 30,616), non-farm (Rs. 23, 190), agriculture (Rs. 14,919) and forestry (Rs. 11,984). This indicates that the forest-based and agricultural enterprises are more pro-poor than other enterprises. However, the landless would be automatically excluded in agriculture based enterprises. This reveals that inclusion of the landless, in enterprises which may be services, food sector or others, will require about twice as much investment as in agriculture, which should be organized by external agencies as grants or loans. In terms of the average investment, men entrepreneurs have invested more than women entrepreneurs. Likewise, the average investment was lowest among Dalit entrepreneurs (Rs. 13,601) and the highest was recorded among BCTS (Rs.30, 981). The capital ratio (proportion of fixed capital to total investment) was highest for food products (76%) followed by non-farm (50%), forest (39.9%), agriculture (36.9%) and service (36.3%). The need for the working capital was highest for service enterprises. Annexure 5.4 (a) distributes entrepreneurs by investment. The data in this annexure show that none of the entrepreneurs have exceeded Rs. 200,000 fixed capital and nearly 60% entrepreneurs have not spent on fixed capital. In terms of fixed capital investment, service and non-farm required more investment than others.
5.2.4 Borrowing
MEDEP have envisioned that at least 60 percent of poor and excluded micro-entrepreneurs in second phase will be able to secure credit through micro-finance institutions and 15 percent will complete third cycle loan by the end of a three year period. This would have strengthened the depth and breadth of micro enterprises towards achieving the growth of enterprises. However, interviews with proprietors of individual enterprises and group enterprises show that the microfinance linkages have remained far below the level envisaged. Figure 5.2 below presents status of different types of enterprises with regard to the sources of borrowing.
Figure 5.2: Sources of borrowing (individual and group enterprises)
81.5
10.76.9
12.8
5.7
14.8
6.91.1 1.14.2
7.411.6
16.8
74.7
0
20
40
60
80
100
Self
ME
Gs
Gro
ups/S
avin
g a
nd
Cre
dit
gro
ups
Coopera
tives
Fin
ancia
l NG
Os
Friends/R
ela
tives/m
oney
lenders M
FI B
anks
Perc
en
t
Individual ow ner Group
The data presented in above figure show that 82% MEs are self financed, with only 20% borrowing from MEGs, savings and credit groups, cooperatives, NGOs, MFIs, friends,

32
relatives or money lenders. It is evident from the figure above that sampled enterprises have borrowed from more than one source. The proportion of individual entrepreneurs borrowing from formal sources is less than 12%. Access of individual entrepreneurs to institutional sources of credits is high compared to group enterprises. Table 5.9 shows sources of finances by gender and caste.
Table 5.9: Distribution of entrepreneurs by sources of finances
(Percent)
Sources of finances Gender Overall
n=630
Caste/Ethnicity
Women Men BCTS Dalit Janajati Others
Self 77.7 86.7 80.4 83.1 70.1 85.8 72.3
MEGs 14.3 5.5 11.6 11.0 10.9 13.8 4.3
Groups/Saving and Credit groups 7.1 5.0 6.5 6.4 3.6 8.5 4.3
Cooperatives 10.7 17.1 12.6 18.0 15.3 6.5 17.0
Financial NGOs 5.0 5.0 5.0 5.2 4.4 6.1 0.0
Friends/Relatives 3.6 6.6 4.5 5.8 3.6 4.1 4.3
Money lenders, friends and relatives 10.7 20.4 13.6 11.0 17.5 8.2 40.5
The data show that a higher proportion of Janajati (85.1%) and BCTS (83.1%) are self financed compared to Dalit (75.1%). As a corollary, 40.5% and 17.5% enterprises operated by other Terai caste persons and Dalit respectively borrowed from money lenders and friends whereas the corresponding figures among BCTS and Janjatis were 11 and 8.2%. This shows that other Terai Caste People and Dalit have a greater dependence on external sources compared to BCTS and Janajati. Table 5.8 further shows that men have more access to formal sources of credit than women. Further, the proportion of men entrepreneurs borrowing from cooperatives was higher than that of women (17.1% vs 10.7%). When combined with the fact that 87% men operated enterprises reported that they have been financing their enterprises compared to women (77.7%), it is clear that women have less access as compared to men, to both own finance as well as external finance. 5.2.5 Linkages and networking For operating enterprises, it is very important for the entrepreneurs to maintain linkages, networking and coordination with a number of actors and stakeholders delivering different services. Entrepreneurs are not self-sufficient like subsistence farmers; they are commercial actors and produce products and services for markets and to earn profits. Failing to receive information, support and cooperation from others means not only reduced chances for sustainability of the enterprises, but also the likelihood of expansion of enterprises is remote. This is well understood by entrepreneurs. During the focus group discussions, a large majority of entrepreneurs highlighted the importance of backward and forward linkages in operating enterprises. Backward linkage refers to the linkages at pre-production stage and forward linkages refer to the linkages after the production of the primary products. Smartness of entrepreneurs depends on skills and capacity of the entrepreneurs to receive support and cooperation of other actors and adjust depth and breadth of linkages based on the quality, quantity and prices of services delivered by them. Both types of linkages are necessary for adding value to the products and earn competitive profits. Table 5.10 shows the proportion of entrepreneurs establishing forward and backward linkages by type of enterprises.

33
Table 5.10: Linkages with the other actors by gender and caste (Percent)
Gender Overall
Caste/Ethnicity
Men Women BCTS Dalit Janajati Others Raw materials supplier 39.0 48.8 42.6 37.4 53.3 34.1 68.1
Skill enhancement 27.9 30.6 28.6 30.3 30.8 28.2 21.3
Machinery and equipments supplier
18.7 26.9 21.5
21.3 23.4 17.7 31.9
Financial service 36.3 41.3 38.2 37.4 39.3 30.0 72.3
Marketing agents 49.3 51.3 50.3 43.9 57.0 43.6 83.0
Processor 17.1 15.6 16.7 18.1 18.7 15.5 12.8
Other micro-enterprises 26.0 27.5 26.4 25.2 17.8 27.7 44.7
Market outlets 40.1 38.8 40.4 40.0 42.1 35.5 53.2
Above table depicts that women have better linkages than men entrepreneurs with raw material suppliers, machinery suppliers, traders and other entrepreneurs. They also have better linkages for skill enhancement. By contrast, men show better linkages with processors and the market. A higher linkage with markets is reminiscent of the inside outside dichotomy, whereby women take the production, especially home based production tasks while men do the tasks relating to market presence and access to cash. Despite of the fact that women have less access to training and support, their access or linkages with service provider has increased. Notwithstanding this, the general trend seems to be that MEDEP has contributed significantly to women entrepreneurs having improved backward, forward and horizontal linkages.
The data reveal that, overall, backward and forward linkages exist for 20 to 50% of the enterprises. Proportion of women reporting to have established linkages will all types of actors in the value chain (forward and backward) was higher than men than women suggesting that MEDEP has been more inclusive, supporting to women and given due consideration to both the practical and strategic needs of the women as they have been successful in establishing linkages with others appropriately.
Table 5.11 shows the proportion of entrepreneurs establishing forward and backward linkages by type of enterprises.
Table 5.11: Linkages with the other actors by type of enterprises and phases (Percent)
Linkages with Phase Enterprises type
I II Agri Forest Service Food
products Non-farm
Raw materials supplier 41.5 42.9 31.8 46.1 63.6 47.7 64.3
Skill enhancement 27.4 29.0 29.5 21.3 48.5 26.2 31.0
Machinery and equipments supplier
22.2 21.2 19.0 15.7 39.4 21.5 31.0
Financial service 44.4 36.1 31.0 44.9 60.6 42.1 35.7
Marketing agents 44.4 52.2 39.9 57.3 54.5 57.9 71.4
Processor 10.4 18.8 12.4 22.5 45.5 9.3 26.2
Other micro-enterprises 21.5 28.0 23.6 32.6 54.5 20.6 23.8
Market outlets 32.6 42.9 34.5 48.3 60.6 34.6 50.0
The data in the above figure show that more than 71% entrepreneurs involved in non-farm enterprises have established linkages and coordination with traders, followed by food products, services and forest based enterprises. The proportion of enterpreneuers involved in agriculture based enterprises has the lowest level of linkages with other actors and stakeholders. Overall, value chain types of enterprises such as non-farm, food products, services and forest based products demonstrated a high level of linkages and coordination. This is to be expected, as these types of businesses require more linkages and coordination than do traditional agricultural ones.

34
Figure 5.8 depicts that others and Dalit have forged greater links with markets, traders, financial service providers and raw material suppliers as compared to Janajati and BCTS. Given that the financial resources are higher among the BCTS, MEDEP has helped forge linkages for the more backward groups and to this extent has contributed to reducing the gap between the ethnic categories. This indicates that MEDEP is an inclusive programme and contributed towards the empowerment of the Dalit and other Terai caste groups, especially women.
Table 5.12 show the number of linkages established by women and men entrepreneurs, by ethnic/caste groups and types of enterprises (individual and groups) respectively.
Table 5.12: Linkages with the other actors by type of enterprises and phases (Percent)
Number of linkages Gender
Overall Caste/Ethnicity
Men Women BCTS Dalit Janajati Others None 36.6 30.0 34.6 39.4 26.2 40.0 12.8
One 10.0 8.8 9.6 11.0 10.3 10.0 2.1
Two 10.3 9.4 10.0 7.7 8.4 12.7 8.5
Three 8.1 8.8 8.3 6.5 15.0 5.9 10.6
Four 8.4 15.6 10.6 6.5 15.9 7.7 25.5
Five 9.8 13.1 10.8 11.0 8.4 9.1 23.4
Six 6.5 6.3 6.4 6.5 9.3 4.5 8.5
Seven 4.3 3.8 4.2 4.5 3.7 4.5 2.1
Eight 6.0 4.4 5.5 7.1 2.8 5.5 6.4
Information in above figures show that women entrepreneurs have performed better in terms of establishing a larger number of linkages. Likewise, other Terai caste and Dalit have established more linkages and coordination with other actors. From this, it can be concluded that the empowerment level of Dalit and other caste Terai persons, especially women, have been improved as a result of their participation in MEDEP and that they have been able to seek services from others. Group enterprises have been successful to establish more linkages with other actor actors and stakeholders than individual enterprises. 5.2.6 Support of other agencies Further to linkages and coordination, this study assessed the support received by the entrepreneurs from agencies other than MEDEP in three areas namely machinery and equipment, technical services and capacity building (skills enhancement). A higher level of support received from other agencies indicates lower dependence on MEDEP and better opportunities for business expansion, thus greater likelihood of the sustainability of the micro-enterprises.
Table 5.13 shows the distribution of entrepreneurs by type of support and assistance received by them from other agencies.
Table 5.13: Distribution of entrepreneurs by type of external support (Percent)
Respondents Machinery support Technical support Capacity building
Overall 5.3 3.2 7.7
A. Gender
Women 4.1 2.2 6.3
Men 8.1 5.6 11.0
B. Caste/Ethnicity
BCTS 4.5 3.9 10.5
Dalit 4.7 2.8 5.4
Janajati 6.8 3.6 7.9
Others 2.1 - 2.0
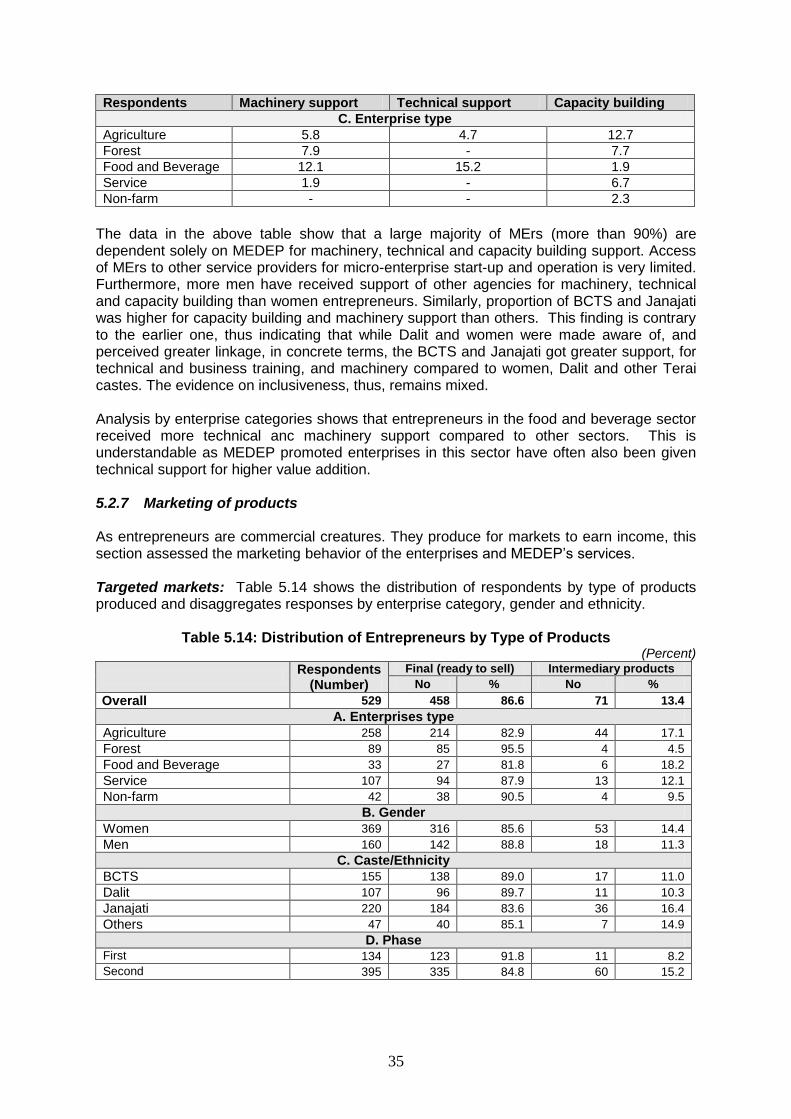
35
Respondents Machinery support Technical support Capacity building
C. Enterprise type
Agriculture 5.8 4.7 12.7
Forest 7.9 - 7.7
Food and Beverage 12.1 15.2 1.9
Service 1.9 - 6.7
Non-farm - - 2.3
The data in the above table show that a large majority of MErs (more than 90%) are dependent solely on MEDEP for machinery, technical and capacity building support. Access of MErs to other service providers for micro-enterprise start-up and operation is very limited. Furthermore, more men have received support of other agencies for machinery, technical and capacity building than women entrepreneurs. Similarly, proportion of BCTS and Janajati was higher for capacity building and machinery support than others. This finding is contrary to the earlier one, thus indicating that while Dalit and women were made aware of, and perceived greater linkage, in concrete terms, the BCTS and Janajati got greater support, for technical and business training, and machinery compared to women, Dalit and other Terai castes. The evidence on inclusiveness, thus, remains mixed. Analysis by enterprise categories shows that entrepreneurs in the food and beverage sector received more technical anc machinery support compared to other sectors. This is understandable as MEDEP promoted enterprises in this sector have often also been given technical support for higher value addition. 5.2.7 Marketing of products As entrepreneurs are commercial creatures. They produce for markets to earn income, this section assessed the marketing behavior of the enterprises and MEDEP’s services. Targeted markets: Table 5.14 shows the distribution of respondents by type of products produced and disaggregates responses by enterprise category, gender and ethnicity.
Table 5.14: Distribution of Entrepreneurs by Type of Products (Percent)
Respondents
(Number)
Final (ready to sell) Intermediary products
No % No %
Overall 529 458 86.6 71 13.4
A. Enterprises type
Agriculture 258 214 82.9 44 17.1
Forest 89 85 95.5 4 4.5
Food and Beverage 33 27 81.8 6 18.2
Service 107 94 87.9 13 12.1
Non-farm 42 38 90.5 4 9.5
B. Gender
Women 369 316 85.6 53 14.4
Men 160 142 88.8 18 11.3
C. Caste/Ethnicity
BCTS 155 138 89.0 17 11.0
Dalit 107 96 89.7 11 10.3
Janajati 220 184 83.6 36 16.4
Others 47 40 85.1 7 14.9
D. Phase First 134 123 91.8 11 8.2
Second 395 335 84.8 60 15.2

36
The data show that 86.6% of produced final products in ready to sell form for the market while rest reported to have produce intermediary products to be used by other enterprises. Nearly one fifth of (18.2%) entrepreneurs in the food and beverage sector produced intermediary products followed by agriculture (17.2%), services (12.1%), non-farm (9.5%) and forest based products (4.5%). More women (14.4%) produced intermediary products than men (11.3%). Likewise, a higher proportion of Janajati (16.4.1%) and others (14.9.1%) produced intermediary products. The proportion of entrepreneurs producing intermediary products was higher in second phase compared to first phase. A majority of the enterprises produced products which could be sold directly to consumers rather than producing intermediary products for the use of other entrepreneurs. This indicates good selection of enterprises, close to the market. At the same time, it is also an indication of possible unexplored opportunities for value addition, which could potentially yield more income, and more profit. Figure 5.3 shows the distribution of individual and group entrepreneurs by their targeted markets.
Figure 5.3: Distribution of entrepreneurs by their target markets
36%
44%
12%
2%5% 1%
Village
Local market
District headquarter
Neighboring district
Kathmandu
Exporter
24%
33%12%
7%
24%
0%
Village
Local market
District headquarter
Neighboring district
Kathmandu
Exporter
The above figures show that targeted market of most of entrepreneurs (44 percent among individual entrepreneurs and 32% among group entrepreneurs) is local. By contrast, the proportion of group entrepreneurs targeting distant markets was high compared to individual enterprises. This implies that when small entrepreneurs form groups they can compete with big business houses in big markets and cities like Kathmandu. The study further found 1.3% individual enterprises selling their products to exporters. Annexure 5.5 presents the distribution of individual respondents by enterprise categories, gender, ethnicity/caste and MEDEP phases based on their targeted markets. Data show that the majority of food products enterprises target local markets which is followed by agriculture based and service enterprises. However, the target market for most of the non- farm enterprises are Kathmandu (33%), while forest based enterprises have a low dependence on Kathmandu (6.7%). Data further show that the proportion of women entrepreneurs and Dalit entrepreneurs targeting Kathmandu market was higher compared to their respective counterpart’s men and BCTS. The highest improved production capacity is reported by other (non-farm) enterprises (97.2%), followed by forest enterprise (92.9%), agriculture (85.6%), service (85.1%) and food products (84.6%). This finding supports the earlier, that it is good that individual entrepreneurs reach the nearby markets, which is of course the design of MEDEP programme, as it takes a market centre approach. At the same time, the experience of group enterprises promoted by MEDEP show the benefits of value addition, pointing to the benefits of taking a value chain approach. The study also provides evidence of increased inclusion, as women and Dalit show a higher linkage to markets as compared to men and other ethnic categories.
Distribution of Entrepreneurs (Individuals) Distribution of Entrepreneurs (Groups)

37
Assessment of Entrepreneurs’ Marketing Skills: Following four questions were asked to assess entrepreneurs’ marketing skills m which include (a) How big is the market for your products and services or what is the demand of your products and services (b) Ability to produce as per market demand (b) capacity to produce quality products as per demands of markets and (c) Do you feel that MEDEP’s support is adequate for the sustainability of your enterprise? These provide a self assessment by the entrepreneurs, of their own capacities for market access. Table 5.15 distributes respondents by their responses to above three questions.
Table 5.15: Individual entrepreneurs’ marketing capacity (Percent)
Respondents
(Number)
Has big market or
high demand of
product and services
Can produce as per market
demand (Quantity)
Having capacity to
produce quality
products
Adequacy of MEDEP’s
support
Overall 529 44.6 29.5 37.1 28.9
A. Enterprises type
Agriculture 258 42.2 22.9 31.4 29.5
Forest 89 49.4 33.7 41.6 32.6
Food products 33 33.3 24.2 21.2 42.4
Service 107 46.7 41.1 43.9 23.4
Non-farm 42 52.4 35.7 57.1 21.4
B. Gender
Women 369 46.1 27.4 34.1 30.6
Men 160 41.3 34.4 43.8 25.0
C. Caste/Ethnicity
BCTS 155 47.1 27.7 32.3 29.0
Dalit 107 46.7 29.9 47.7 21.5
Janajati 220 45.5 30.9 35.9 35.5
Others 47 27.7 27.7 34.0 14.9
D. Phase
First 134 35.1 26.1 40.3 17.2
Second 395 47.8 30.6 35.9 32.9
Data in the above table show that less than 50% respondents feel that the market is big enough for their products, indicating competition in the local markets. About a third of the entrepreneurs feel that they can produce products the quantity and quality as per market demands. 41% entrepreneurs involved in service enterprises felt that they have the capacity to meet market demands, 57% percent involved in the production of non-farm products felt that they can deliver quantity of services as per market demands. Responses of entrepreneurs producing different types of enterprises on the different marketing issues were mixed. As seen in the table largest proportion of entrepreneurs producing non-farm enterprises (52%) perceived that the market for their products is big, followed by forest (49%) and service (46%). Overall, only 29% of the entrepreneurs felt that they have been receiving adequate assistance from MEDEP to sustain their enterprises. The highest proportion of respondents perceiving MEDEP’s assistance adequate was reported by food products entrepreneurs, followed by forest products (32.6%). Likewise, more proportion of women (30.6%) against 25% men and and 35% Janajati against 21.5% Dalit felt that they have received adequate support from MEDEP’s. Overall, less than 50% feel that MEDEP’s market related services is not adequate. A surprising finding is that more Phase 2 entrepreneurs report as adequate

38
as compared to Phase 1 entrepreneurs, given the fact that follow up was stronger in Phase 1. One reason for this could be that Phase 2 entrepreneurs have received support more recently, whereas support to Phase 1 entrepreneurs is in the distant past (7 to 10 years ago), which may have influenced their responses.
5.3 Performance of Enterprises This section assesses the performance of enterprises which have received MEDEP’s assistance. Performance of enterprises has been assessed based on the following three criteria:
(a) Status of operation (b) Capacity utilization (c) Profitability
5.3.1 Status of Operation Table 5.16 shows the status of the enterprises based on the interviews and observation during the field survey. Status of enterprises has been characterized into three types namely, year-round, seasonal and casual. Enterprises operating for 12 months of a year are included under year-round. One or more members of the HHs remain fully engaged in the year-round enterprises. Seasonal enterprises are those which, by virtue of the products handled, can operate seasonally. Therefore, even if one or more members of the HHs remain fully engaged in the enterprise, they cannot remain engaged for all 12 months of the year. Examples of these kinds of enterprises are honey production, ginger production, bamboo sticks for ice candy and so forth. In casual enterprises, one or more members of the HHs are engaged but in their leisure or surplus time. These enterprises operate on and off, based on market demands. Table 5.16 gives the status of enterprises.
Table 5.16: Status of Enterprises (Percent)
Respondent category Respondents
(Number) Year round Seasonal Casual
Private/Individual 529 69.2 29.9 0.9
Group Entrepreneur 101 30.7 54.5 14.9
Worker Only 36 36.1 50.0 13.9
Above data show that 69% individual enterprises operate year-round followed by seasonal (30%) and casual (0.9%). Of those reporting to work for group enterprises, majority of their enterprises (54.5%) were seasonal followed by year-round (30.7%) and casual (14.9%). This reveals that the individual HH or entrepreneurs often operate year-round businesses and employ themselves, whereas group businesses could be seasonal and workers tend to get seasonal or casual employment. This finding corroborates the existing understanding of micro enterprise sector, whereby most micro enterprises first tend to provide self employment to the entrepreneurs themselves.
5.3.2 Capacity of Operation
The involvement of one or more members of the HHs year-round does not mean that an enterprise is operating at full capacity. Therefore, entrepreneurs were asked whether “do you operate in full capacity for round the year. An enterprise has been considered operating at full capacity when members of the HHs involved in them are fully involved year-round which, means at least 250 days a year. Data show that a little less than 50% individual enterprises are running at full capacity. Table 5.17 disaggregates data by gender, ethnicity/caste, enterprise types and programme phases.

39
Table 5.17: Status of enterprises by capacity utilization (Percent)
Respondent categories Running of enterprises on full capacity for round the year
Respondents (Number) Response (Number) %
Overall 6669 299 44.9
A. Gender
Women 475 193 40.6
Men 191 106 55.5
B. Caste/Ethnicity
BCTS 191 90 47.1
Dalit 149 66 44.3
Janajati 277 115 41.5
Other Terai Caste 49 28 57.1
C. Enterprise types
Agriculture 278 121 43.5
Forest 115 49 42.6
Food products 77 26 33.8
Services 116 75 64.7
Non-farm 80 28 35.0
D. Phases
Phase I 149 81 54.4
Phase II 517 218 42.2
Data show that a higher proportion of men enterprises operate at full capacity than women operated ones. Likewise, enterprises of other Terai Caste groups (57.1%) were running at full capacity followed by BCTS (47.1%), Dalit (44.3%) and Janajati (41.5%). By enterprise types, almost 65% services operated at full capacity followed by agriculture (43.5%), forest (42.6%), non-farm (33.8%) and non-farm (35.0%). By phases, a larger proportion of first phase enterprises operated at full capacity than second phase (42.2%).
5.3.3 Profit analysis
Gross income and expenditure details provided by entrepreneurs were analyzed to estimate profit or net income by enterprises last year (2008-09). Profit analysis was carried out only for 529 enterprises operated by individual entrepreneurs. Since a large majority of respondents did not keep business details and accounts, data presented in the following table (Table 5.18) is based on the interviews with the respondents.
Table 5.18: Average income and profit status of individual enterprises
Respondent categories
Income (Rs)
Expenditure (Rs)
Profit (Rs)
Profit as% of expenditure
Overall 91,671 44,123 53,029 120
A. Gender
Female 74,439 33,524 45,421 135
Male 130,983 67,197 70,569 105
B. Caste/Ethnicity
BCTS 90,013 52,106 47,977 92
Dalit 92,408 40,647 54,167 133
Janajati 71,085 29,148 45,699 157
Other Terai Caste 193,065 93,698 101,404 108
9 This excludes drop out enterprises but includes responses of individual, group and employees in enterprises.

40
Respondent categories
Income (Rs)
Expenditure (Rs)
Profit (Rs)
Profit as% of expenditure
C. Enterprise type
Agriculture 47,797 15,044 34,898 232
Forest 93,453 49,142 51,516 105
Food products 121,619 83,381 59,083 71
Service 170,790 89,692 87,880 98
Non-farm 135,750 60,156 77,026 128
D. Phases
First 128,583 73,216 66,744 91
Second 79,021 34,619 48,350 140
The data showed that on an average an entrepreneur earned Rs. 91,161 per year and
expended Rs 44,123 with average profit of Rs. 53,029. The range of income spread to a maximum income of Rs. 11,00,000 and at the other end, a net loss of loss Rs.1000 (see Annexure 5.6). This does not include the wage laborers of entrepreneurs and members of the HHs, who would have earned wage labor had they worked elsewhere as wage laborers. Among the enterprise types, the highest average profit was yielded by services sector, followed by food products, non-farm, forest-based and agriculture. In terms of expenditure, service (Rs. 87,800) sector enterprises were the highest, with non-farm enterprises (Rs. 77,026) next, followed by food products (Rs. 51,516). Interestingly, in terms of profit as percentage of expenditure, agriculture gave the highest return (232%) followed by non-farm (140%), and forest products (105%). In terms of return to investment, the performance of service enterprises was the lowest (71%). Second phase enterprises were significantly more profitable than the ones promoted during the first phase. Table 5.19 shows profit distribution of enterprises by sex, ethnicity, enterprise category and phases.
Table 5.19: Distribution of enterprises by profit (Percent)
Enterprises Respondent number Status of operation (%)
Profit Loss Breakeven
Overall 529 96.8 1.3 1.9
A. Gender
Women 369 96.5 1.6 1.9
Men 160 97.5 0.6 1.9
B. Ethnicity/Caste
BCTS 155 95.5 1.9 2.6
Dalit 107 99.1 0 0.9
Janajati 220 96.4 1.8 1.8
Others 47 97.9 0 2.1
C. Enterprise type
Agriculture. 258 96.5 2.3 1.2
Forest based 89 98.9 0 1.1
Food products 33 93.9 3.0 3.0
Service 107 95.3 0 4.7
Non-farm 42 100 0 0
D. Phase
First 134 97.8 0.7 1.5
Second 395 96.5 1.5 2.0

41
As seen from the above table almost all the enterprises (96.8%) operated in profit followed by breakeven and while 1.3% incurred losses. This situation remains similar by caste, gender, phases and enterprises category. Of those 7 loss-making independent enterprises, six were agriculture enterprises. Enterprises started by MEDEP show that almost all are profit making, with return on investment ranging from 71% to 157%. This is a significant achievement. In this study, , 250 days is considered as a full employment for a person and daily wage rate is based on NRs.200.00 per day10. Thus an amount of Rs. 50,000 (250 person days @NR 200 per day) is taken as the cut off point for considering full employment of one person. Figure 5.3 shows extent of profit by gender and caste group.
Figure 5.3: Extent of profit by gender and caste group
0.0
10.0
20.0
30.0
40.0
50.0
60.0
70.0
80.0
Pe
rce
nt
Below 50000 56.9 71.8 61.4 70.3 62.6 73.6 38.3
Above 50000 43.1 28.2 38.6 29.7 37.4 26.4 61.7
Male Female Overall BCTS Dalit Janajati Others
Above figure reveals that nearly one third of entrepreneurs (38.6%) seemed to provide income for at least one person for a full year. However, employment creation has not reached the same levels, which indicates that the level of enterprise operations could be increased. It also points to a possible location and market constraint, in remote and poorer regions, which are prioritized by MEDEP. Proportion of men generating profit of Rs 50000 or above is quite higher among men compared to women (41.1% and 28.2% respectively). This reveals that men are making more profit from enterprises compared to women. Among different caste groups, a higher proportion of other Terai caste groups had net profit of more than Rs.50,000.00 per year per person (61.7%) followed by Dalit (37.4%), BCTS (29.7%) and Janajati (26.4%). Of 8 enterprises which operated in a net loss last year, 7 were individual enterprises and 1 was group enterprise. Similarly, a higher proportion of Terai other caste people and Dalit among those enterprises having more than 50,000.00 profit was because they generally operate service and non-farm enterprises The proportion of non-farm enterprises with average profit of more than Rs.50,000.00 was little higher among non-farm enterprises (57.1%) compared to service (56.1%) followed by food and beverage (39.4%), forest based (31.5%) and agriculture (19.8%). The probability of profit is less for enterprises involved in agriculture based enterprises, and likely to fall within the range of lower than Rs.50, 000 per year.
10 Daily wage rate for unskilled labour ranges between NRs.150.00 to Rs.250.00 per person per day in Nepal depending on the type of work, place and sex of the person. However, for the purpose of the present study, the daily wage rate is taken at Rs.200.00 per person for day.

42
Figure 5.4 distributes enterprises by level of profit.
Figure 5.4: Extent of profit by enterprise type
0.0
10.0
20.0
30.0
40.0
50.0
60.0
70.0
Pe
rce
nt
Below 25000 57.4 32.6 48.5 21.5 19.0
25000 - 50000 23.3 36.0 18.2 22.4 23.8
50000 - 75000 8.1 13.5 12.1 20.6 23.8
75000 - 100000 3.9 6.7 6.1 5.6 9.5
100000 - 150000 3.5 5.6 6.1 12.1 7.1
Above 150000 3.9 5.6 9.1 17.8 16.7
Agricultural Forest Food Service Non-farm
The proportion of non-farm enterprises with average profit of more than Rs.50,000.00 was little higher among non-farm enterprises (57.1%) compared to service (56.1%) followed by food and beverage (39.4%), forest based (31.5%) and agriculture (19.8%). The probability of profit is less for enterprises involved in agriculture based enterprises, and likely to fall within the range of lower than Rs.50, 000 per year. Information in the figure show that nearly 60% Entrepreneurs operating agriculture enterprises had average profit of less than Rs. 25,000 compared to less than 18% for non-farm enterprises. Thus services and non farm sector enterprises created more employment as compared to the primary sector, which is to be expected. This suggests that the poverty intervention targeted programme such as MEDEP should focus more on non-farm and service type enterprises than enterprises focused on primary production such as agriculture which requires land, and is subject to climate and other technical service related risk factors. These sectors also have the likelihood of being more inclusive in terms of ethnicity and caste, as they are not land dependent. However, they do call for a high investment and more skill training inputs. 5.4 Impact of MEDEP Interventions As stated earlier, MEDEP has targeted very poor and excluded people by assisting them to identify their entrepreneurial skills from within by themselves and later to help them to select appropriate enterprises and operate enterprises. This section assesses the impact of operating enterprises at individual or entrepreneurial levels. For this, respondents were asked different questions on utilization of income, diversification of enterprises, employment generation, and improvements in social capital.
5.4.1 Utilization of income
After having analyzed the amount of income earned by the micro entrepreneurs, the analysis now moves to how they utilize the income earned. This is depicted in Table 5.15.

43
Table 5.20: Utilization of income (Percent)
Respondents
Items
Total Purchasing of Assets
HH expenses
Children Education
Re-investment
in enterprise Land
Improvement in Housing/
living condition
Individual 6.6 42.4 12.5 17.7 12.9 7.8 100.0
Group Worker 27.3 35.7 10.7 9.1 10.5 6.7 100.0
Worker 22.7 52.1 6.7 18.3 0.0 0.2 100.0
Overall 10.0 41.6 12.1 16.5 12.2 7.5 100.0
Data in the above table reveals that a large majority of investment of income earned goes to household expenses (41.6%), followed by reinvestment in enterprise (16.5%), children’s education (12.1%), purchase of land and children’s education (12% each), purchase of assets(10.0%).and improvement in housing (7.5%) . This means higher incomes are first applied to household consumption, and then to provide opportunities for children to receive better education. Annexure 5.7 presents distribution of respondents by gender, ethnicity/caste and enterprise type. As seen in this annexure, the proportion of women entrepreneurs spending income on children education was higher than men entrepreneurs, showing that women give a higher priority to children’s education. Dalit spent more on household expenditures than other caste groups. The proportion of those who reinvested in enterprise was highest among service entrepreneurs (23.3%) followed by food products (21.7%). Of those who reported to have reinvested in the enterprise, the proportion of entrepreneurs involved in forest based products was the lowest (8.9%). 5.4.2 Diversification of enterprises Diversification of enterprises has been defined as the addition or changes in the enterprise after the start of enterprises. Diversification indicates increased capability of entrepreneurs to change the enterprises based on market demand, skills and other factors including capacity to bear risks. Figure 5.5 shows the proportion of entrepreneurs by type (individual and groups) who have diversified enterprises.
Figure 5.5: Enterprise diversification
22.0
15.8
20.9
0.0
5.0
10.0
15.0
20.0
25.0
Entrepreneurs in private
enterprise
Entrepreneurs in group
enterprise
Overall
Perc
en
t
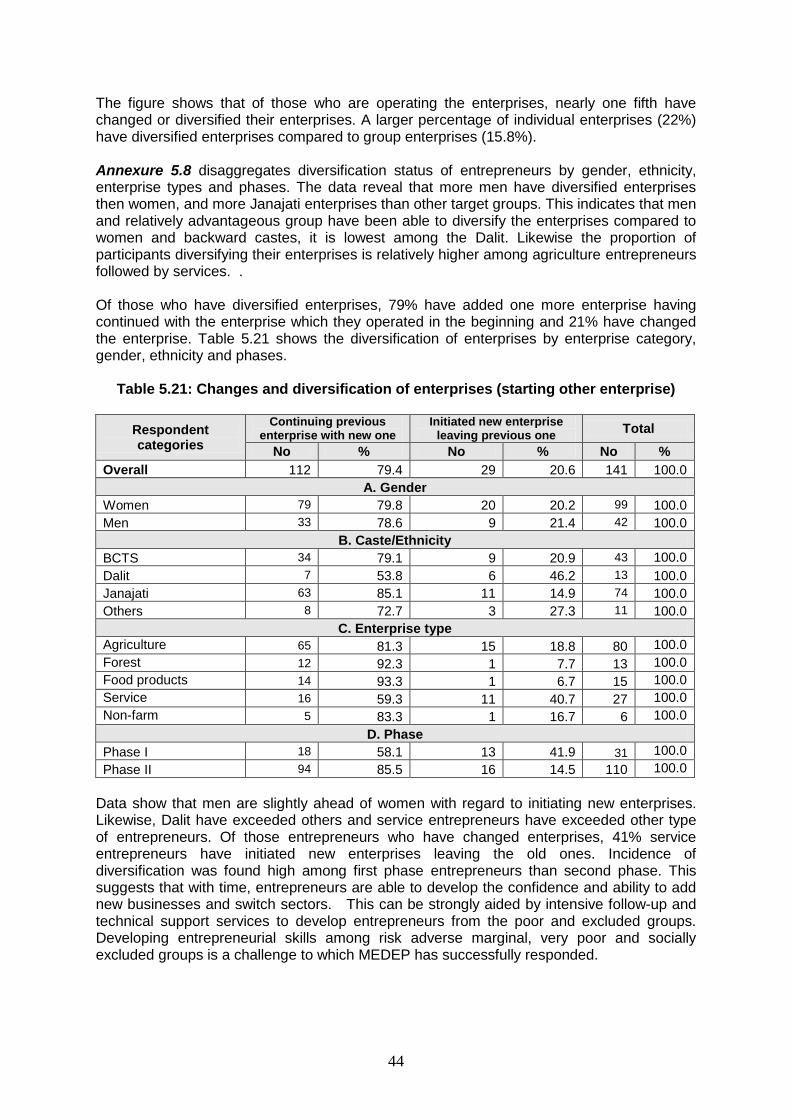
44
The figure shows that of those who are operating the enterprises, nearly one fifth have changed or diversified their enterprises. A larger percentage of individual enterprises (22%) have diversified enterprises compared to group enterprises (15.8%). Annexure 5.8 disaggregates diversification status of entrepreneurs by gender, ethnicity, enterprise types and phases. The data reveal that more men have diversified enterprises then women, and more Janajati enterprises than other target groups. This indicates that men and relatively advantageous group have been able to diversify the enterprises compared to women and backward castes, it is lowest among the Dalit. Likewise the proportion of participants diversifying their enterprises is relatively higher among agriculture entrepreneurs followed by services. . Of those who have diversified enterprises, 79% have added one more enterprise having continued with the enterprise which they operated in the beginning and 21% have changed the enterprise. Table 5.21 shows the diversification of enterprises by enterprise category, gender, ethnicity and phases.
Table 5.21: Changes and diversification of enterprises (starting other enterprise)
Respondent categories
Continuing previous enterprise with new one
Initiated new enterprise leaving previous one
Total
No % No % No %
Overall 112 79.4 29 20.6 141 100.0
A. Gender
Women 79 79.8 20 20.2 99 100.0
Men 33 78.6 9 21.4 42 100.0
B. Caste/Ethnicity
BCTS 34 79.1 9 20.9 43 100.0
Dalit 7 53.8 6 46.2 13 100.0
Janajati 63 85.1 11 14.9 74 100.0
Others 8 72.7 3 27.3 11 100.0
C. Enterprise type
Agriculture 65 81.3 15 18.8 80 100.0 Forest 12 92.3 1 7.7 13 100.0 Food products 14 93.3 1 6.7 15 100.0 Service 16 59.3 11 40.7 27 100.0 Non-farm 5 83.3 1 16.7 6 100.0
D. Phase
Phase I 18 58.1 13 41.9 31 100.0
Phase II 94 85.5 16 14.5 110 100.0
Data show that men are slightly ahead of women with regard to initiating new enterprises. Likewise, Dalit have exceeded others and service entrepreneurs have exceeded other type of entrepreneurs. Of those entrepreneurs who have changed enterprises, 41% service entrepreneurs have initiated new enterprises leaving the old ones. Incidence of diversification was found high among first phase entrepreneurs than second phase. This suggests that with time, entrepreneurs are able to develop the confidence and ability to add new businesses and switch sectors. This can be strongly aided by intensive follow-up and technical support services to develop entrepreneurs from the poor and excluded groups. Developing entrepreneurial skills among risk adverse marginal, very poor and socially excluded groups is a challenge to which MEDEP has successfully responded.

45
5.4.3 Contribution to employment and improvement in labor productivity One of the key purposes of micro-enterprise promotion is employment generation, however, the impact with regard to employment generation was found mixed. Table 5.22 shows the status of HH members’ and their contribution to employment.
Table 5.22: Contribution to Employment of Household Members
Respondents
(Number)
Average annual days of
employment per HH
Labor productivity
per HH , Days
Gender division of employment (%)
Men Women
Individual 529 254 146 44.0 56.0 Group entrepreneurs 101 128 360 75.8 24.2 Employees 36 166 232 87.3 12.7 Total 666 229 168 44.0 56.0
Overall, individual entrepreneurs were employed for 254 days per year per enterprise and group enterprises created employment of 128 days per HH per year. The average number of HH members engaged in the sample HHs was 2.2 with contribution of 229 person days of employment per HH per year. This means that in overall, MEDEP has created more than 32, 00,000 person days of employment in a year in addition to the additional income contributed to household economy. This is equivalent to employment worth of NRs. 64,000,000 (Approx. US$ 8,8 million) 11. Annexure 5.9 shows person days of employment created, labour productivity and proportion of employment creation by gender, ethnicity, enterprise type and phases. Information in the Annexure show that a larger proportion of employment was created by men entrepreneurs than women entrepreneurs (268 person days days per HH per year by men against 214 days). Likewise, highest employment was created by other Terai Caste Group (329 days) followed by Dalit, Janajati and least by BCTS (209 days). Among the enterprises, service created the highest person days of employment (319 days) followed by forest, non-farm, agriculture and least by food products (176 days). By phases, the enterprises representing first phase created more person days of employment (277 days) compared to second phase (216 days), Overall, proportion of employment created for women was higher (54%) compared to men (45.7%). While men entrepreneuers generated more employment for men, women entrepreneurs too seemed to follow the same pattern, women for women. In addition to contributing directly to employment creation, MEDEP has contributed to improve labour productivity indirectly. Labor productivity is defined as the ratio of net enterprise income to the total number of days worked for the enterprise by each household. On this indicator, the survey results showed MErs have been successful to improve labour productivity at the rate of 146 days per HH which is at par with the local wage rates in the survey districts. Apart from individual employment, very few entrepreneurs (2.1%) have created full time employment opportunities outside the households while 11.3% are hiring wage labor as and when required. Apart from this, very few have contracted out for production of goods and services. Annexure 5.10 presents status of employment outside the households.
11
The extrapolation has been made to all the MEDEP participants of first and second phase, who are operating a
business at present. This includes active, semi-active and inactive participants too. Simple linear extrapolation has been made by multiplying the number of entrepreneurs developed by MEDEP with the days of employment estimated from survey. Monetary value was converted by multiplying with the wage rate, which is considered as Rs 150 per day.

46
5.4.4 Networking and social capital
Different people and agencies tend to define social capital differently. Within the sustainable
livelihoods framework, as one of the key components of livelihood assets, social capital12 is
defined as “the social resources upon which people draw in pursuit of their livelihood
objectives”13. Drawing upon this definition, in this section, we define social capital as “stocks
of social trust, norms and networks which entrepreneurs can draw upon to solve enterprise/business related problems and challenges”. Social capital is productive, as two entrepreneurs exchanging experiences, tools and lessons learned can get more work done with less physical capital, can generate pools of financial capital for increased
entrepreneurial activity; and job searches can also be more efficient. Table 5.18 presents
membership of entrepreneurs by gender, ethnicity and enterprise categories.
Table 5.23: Membership and affiliations with various institutions
Respondents
(Number) MEG DMEGA FNCCI
CSI Federation
Overall 832 84.0 37.9 2.0 2.5
A. Gender
Women 586 83.8 38.2 2.9 2.4
Men 246 84.6 37.0 6.1 2.8
B. Caste/Ethnicity
BCTS 246 86.2 44.3 4.5 3.7
Dalit 198 83.3 32.3 4.5 2.5
Janajati 329 81.8 38.0 2.4 1.5
Other Terai Caste 59 89.8 28.8 6.8 3.4
C. Enterprises type
Agriculture 278 88.1 43.5 4.0 3.6
Forest 115 87.0 33.9 1.7 1.7
Food and Beverage 77 75.3 55.8 3.9 3.9
Service 116 81.9 35.3 7.8 1.7
Non-farm 80 81.3 48.8 5.0 3.8
No enterprises (none) 166 81.9 19.3 1.8 0.6
D. Phase
First stage 208 85.1 31.3 5.7 1.4
Second stage 624 83.7 40.1 3.8 3.3
Data in the above table show that 84 percent respondents are members in the MEG followed by DMEGA (38%) and very few in CSI (2.5%) and FNCCI (2%). This shows the importance of project created forums, which are important, given the continued lack of access of the poor households to mainstream industry associations. 16% respondents said that they were not members in MEG at present. This means either they were drop-out or unaware of MEG activities as they have not been participating in MEG activities due to poor social mobilization activities after the restructuring of the service delivery approach in the second phase. Dalits and Janajati participants have a lower enrolment in MEGs as compared to Other castes in theTerai region, which indicates that the remote regions may have lower enrolment. While the proportion of men in MEG was slightly higher, but it was almost equal (84.6% vs 83.8%). Likewise, the proportion of other Terai caste people was slightly higher than other groups. Of the different enterprises, the highest proportion was reported among agriculture
12
Sustainable Livelihoods Guidance Sheets, DFID, April 1999 13 While there are much similarities between livelihood objectives such as more income, increased well-being, objective of the entrepreneurs and enterprises could be different too. What matters much to the latter is more profit and doing business.

47
enterprises (88.1%) followed by forest (87%) and least in non-farm (81.3%). Even those entrepreneurs who were earlier MEG members, but not operating any enterprises, during the study period were still MEG members and do not want to withdraw from it suggesting how important is this group to them. First phase entrepreneurs reported to be slightly better in terms of membership of MEG than second phase. This suggests the likelihood of continuity of MEG even after the termination of the project. To assess the importance of MEGs to MErs, participants in the focus group discussions were asked to list down all the activities which their respective groups are currently engaged in. They were further asked if they would like to remain in the groups or not in the future and what is the group’s significance to them. Table 5.24 below presents the results of the group discussions.
Table 5.24: Current activities of MEGs
S.N. Activities No of MEG %
1 Saving and credit 35 67.8
2 Sharing experiences on enterprises 32 56
3 Socialization and meeting friends and relatives 29 51.8
4 Maintain linkages and coordination with local bodies, particularly VDC and other service providers 14 25
5 Sharing market information and risks 6 10.7
6 Training members and providing learning 5 9 Source: FGD
While all groups agreed that the group is very important for them and it has provided a good platform for them to share experiences and to pass their problems and constraints to the MEDEP through BDSPOs, DMEGAs and EDFs, current activities performed by groups were found limited and the groups were not meeting regularly due to weak social mobilization and monitoring. The data shows that most of the groups have been virtually dysfunctional, except that continue to engage in saving and credit activities. Members acknowledge the value of groups. Groups do not meet regularly so both monthly saving and credit disbursement are irregular. However, saving and credit activities have appeared as one of the key activities of the groups, binding them together, and responsible for their continued relevance.

48
6 IMPACT OF THE PROGRAMME ON THE LIVELIHOODS: HOUSEHOLD LEVEL SOCIO-ECONOMIC CHANGES
This chapter assesses the impact of MEDEP on the livelihoods of its target groups who are poor, women, Dalit and indigenous nationalities. A livelihood comprises the capabilities, assets and activities required for a means of living. For assessing the impact, the changes in socio-economic situation of the households among participants and non-participants has been carried out to estimate net impact due to MEDEP intervention using difference of difference method. Data for before situation of both the participants and non-participants has been generated either from recall method or from MEDEP database while present situation was carried through the survey. The MEDEP participants recalled the situation before joining the programme. Non participants of the programme have not yet received programme support, therefore in their case, they have stated their situation at the time MEDEP conducted the household survey for selecting of entrepreneurs (i.e. before filling Form B questionnaire), mainly before five years period of time. The data for the situation ‘after’ project intervention come from the participants and non-participants survey carried out as part of this study. The results are analyzed statistically and tested for their significance among participants and non-participants at present. This chapter is organized into four sections and builds on information given earlier, in, Chapter 3, profile of respondents. The first section discusses on changes brought by MEDEP on living conditions while section two assess the impacts on livelihoods assets which include physical, natural, social, financial and human capital. The third section assesses the livelihoods outcome of including income, food security and migration.
6.1 Living Conditions
This section assesses the living conditions of MEDEP participants and non-participants based on the following criteria: (a) ownership of houses (b) type of roofing materials (c) type of floor (d) access to drinking water (e) sanitation (f) source of energy for cooking and (g) source of energy for lighting. 6.1.1 Ownership of houses
Increases in ownership of houses have been positively contributed by MEDEP. Table 6.1 depicts the ownership of houses by MEDEP participants and non participants.
Table 6.1: Distribution of households by ownership of houses (Percent)
Respondent categories
Participants Non-Participants Changes among MEDEP’s
Contribution Now Before Now Before Participant Non-
participant
Overall 99.0* 98.6 97.8* 96.8 0.5 1.1 (0.6)
A. Gender
Women 99.1 98.5 99.3 98.6 0.7 0.7 (0.0)
Men 98.8 98.8 100.0 97.6 0.0 2.4 (2.4)
B. Caste/Ethnicity
BCTS 99.2 98.8 100.0 97.7 0.4 2.3 (1.9)
Dalit 97.5 96.5 98.0 98.0 1.0 - 1.0
Janajati 100.0 99.7 100.0 98.4 0.3 1.6 (1.3)
Other 98.3 98.3 100.0 100.0 0.0 - -
Note: * significant at 10% level of significance
The table shows that almost all participant HHs and non-participant HHs have their own houses irrespective of the quality of the houses. The overall proportion of HHs with own

49
houses after participation in MEDEP is higher than before intervention. Likewise, proportion of participant HHs having houses is higher compared to non-participants at present. Though percent change among non-participant HHs is higher than participant HHs, statistical analysis showed that proportion of participants having own houses is significantly different from that of non-participants at present. This confirms that MEDEP has positively contributed to increase in ownership of houses. There has been marginal improvement on ownership of houses among both the participants and non-participants. However, changes among non-participants on ownership of houses is quite high among participants compared to non-participants, As a result of this, MEDEP contribution appears negative on improving ownership of housing. This situation remains similar by gender and caste. Nevertheless, women participants show a marginally higher ownership of houses than men participants, which is positive, though this does not reflect that the assets are created in the names of women. Janajati and BCTS have shown an overall higher level of ownership, but Dalit show a higher net change, showing that MEDEP made a positive contribution to participants, also compared to the non participants, who could not achieve a positive change in house ownership.
6.1.2 Roofing materials
Table 6.2 distributes participant and non-participant HHs by roofing materials. Generally five types of roofing materials are found in Nepal namely, thatched, tile/mud, stone/slate, zinc sheet and cemented (Reinforced cement concrete). Of these, very few people can afford to build cement roofs. When people earn money, often they first change their thatch roofs to tiled ones and replace stone roofs by zinc sheet. Data in table 6.2 show that proportion of the participants and non-participants owning thatch, tile/mud and stone/slate roof has decreased while it has increased for zinc sheet and cemented roof. The percentage change is high among participants compared to non-participants.
Table 6.2: Distribution of HHs by roofing materials (Percent)
Roofing materials
Participants Non-Participants Changes among MEDEP’s
Contribution Now Before Now Before Participant Non-
participant
Thatch/Straw 9.7 23.0 14.8 16.4 (13.2) (1.6) (11.6)
Tile/Mud 35.5 36.8 47.5 50.8 (1.3) (3.3) 2.0
Stone/Slate 12.3 12.4 2.7 2.7 (0.1) - (0.1)
Zinc Sheet* 35.1* 24.0 25.1* 22.4 11.1 2.7 8.3
Cement 7.5 3.8 9.8 7.7 3.6 2.2 1.4
Total 100 100 100 100.0
Note: * significant at 1% level of significance
The proportion of participants with zinc sheet roof has increased by 11.1 percent while that of non participants by 2.7 percent, with net increase of 8.3 percent among MEDEP participants. This shows that living condition of MEDEP participants in terms of type of roofs have improved. Likewise, statistical analysis showed proportion of participants with zinc sheet is significantly different from that of non-participants at present. Thus MEDEP has positively contributed to improvement in roofing condition of the houses. This further indicates that the probability of changing thatched roofs by zinc sheet among MEDEP participants is high. Table 6.3 shows contribution made by MEDEP in improving roofing materials of the house by sex and ethnicity with detailed data in Annexure 6.1.

50
Table 6.3: MEDEP contribution on improving roofing material by respondent category (Percent)
Type of roofs A. Gender
Overall B. Caste/Ethnicity
Women Men BCTS Dalit Janajati Others
Thatch/Straw (11.5) (9.3) (11.6) (4.6) (24.7) (11.6) 0.6
Tile/Mud 2.2 0.4 2.0 7.2 3.5 3.1 (14.2)
Stone/Slate - (0.4) (0.1) (0.8) 1.5 (0.6) -
Zinc Sheet 7.3 10.2 8.3 4.8 18.2 5.2 -
Cement 1.4 (0.8) 1.4 2.4 1.5 4.0 13.6
The data show that the proportion of women and men using thatch roof has decreased by 11.5 percent and 9.3 percent respectively while it has increased for those using zinc sheet due to MEDEP intervention. Among the ethnic groups, the highest proportion of decrease was observed among Dalit (24.7) using thatched roof followed by Janajati (11.6%), BCTS (4.6%). This shows MEDEP’s positive contribution to improvement in roofing material by gender and caste.
6.1.3 Flooring
For assessing the impact of MEDEP on type of floors, two types of floors were categorized- cement and mud/brick., People generally replace mud/brick floors by cement ones. Table 6.4 presents percent distribution of participant and non-participant HHs by type of floor.
Table 6.4: Distribution of HHs by type of floor (Percent)
Type of floors
A. Participants B. Non-Participants Changes among MEDEP’s Contribution Now Before Now Before Participant Non-participant
Cement 13.5* 7.9 17.5* 15.3 5.5 2.2 3.3
Mud/Brick 86.5 92.1 82.5 84.7 (5.5) (2.2) (3.3)
Total 100.0 100.0 100.0 100.0
Note: * significant at 10% level of significance At present 13.5% of participants having cement floor while that of 17.5% of non-participants. As seen in Table 6.4 above, proportion of participants having cement floor has increased while that of mud floor has decreased among both the participants and non-participants. While the proportion having cement floors is higher among non-participants, the rate of change among participant HHs is higher than non-participant HHs showing a marked difference of 3.3 percent. Statistical analysis reveals that participants and non-participants differ significantly in terms of flooring. Table 6.5 below shows net changes (impact of programme) on type of floors.
Table 6.5: MEDEP contribution on improving flooring by respondent categories (Percent)
Responses A. Sex
Overall B. Caste/Ethnicity
Women Men BCTS Dalit Janajati Other Cement 3.5 2.8 3.3 (0.7) 2.0 6.4 6.5
Mud/Brick (3.5) (2.8) (3.3) 0.7 (2.0) (6.4) (6.5)
Annexure 6.2 shows the percent distribution of participants and non-participants by type of floors and types of respondents (gender and ethnicity). Data in this Annexure show that higher proportions of women and Dalit entrepreneurs change type of floor than their respective counterparts.
The MEDEP contribution changing mud floor to cement ones was higher among women compared to Men. By ethnicity, MEDEP contribution was higher among other Terai caste people followed by Janajati and Dalit. Negative contribution of MEDEP among BCTS reveals that changes among non-participants are quite high compared to MEDEP participants or contribution of other factors is relatively high.

51
6.1.4 Access to drinking water Table 6.6 depicts the access to drinking water, for participants and the control group.
Table 6.6: Distribution of HHs by access to drinking water (Percent)
Responses
A. Participants B. Non-
Participants Changes among
MEDEP’s Contribution
Now Before Now Before Participant Non-
participant
Tap (Own/Community)
88.6* 82.8 80.9* 75.4 5.8 5.5 0.3
Water hole/Pond 5.5 6.6 10.4 15.3 (1.1) (4.9) (3.8)
River 5.9 10.6 8.7 9.3 (4.7) (0.5) 4.1
Total 100 100.0 100.0 100.0
Note: * significant at 1% level of significance The data show that 4 out of 5 MEDEP participants have access to drinking water and that the proportion of HHs with access to taps after MEDEP participation has increased compared to before MEDEP. Overtime, both participants and non participants have gained access to taps however, MEDEP participants show a slightly higher access (0.3). Statistical analysis shows that there is no similarity among participants and non-participants using tap water among at 99 percent confidence level. This indicates that MEDEP has positive impact or contributed to improvement in access to safe and clean drinking water. The increased access of MEDEP participants to safe and clean drinking water could be due to increase in awareness, income and contribution to improve drinking water schemes. This is an un-intended positive impact of MEDEP. Table 6.7 below shows net changes in sources of drinking water by respondent categories with detailed data in Annexure 6.3.
Table 6.7: MEDEP contribution on improving access to drinking water (Percent)
Responses A. Gender
Overall B. Caste/Ethnicity
Women Men BCTS Dalit Janajati Others Tap (Own/Community) 0.8 (3.7) 0.3 (7.5) 9.6 1.0 (7.4)
Water hole/Pond 2.6 8.9 3.8 11.6 (2.5) 3.5 3.7
River (3.4) (5.3) (4.1) (4.1) (7.1) (4.6) 3.7
The data show that MEDEP’s contribution on improving access of women and Dalit to clean and safe drinking water while the contribution of other factors was high among men, BCTS and others. Hence, results show negative contribution of MEDEP on men and BCTS entrepreneurs. As seen from the Annexure 6.3, proportion of men and BCTS participants with access to drinking water has increased after participation in MEDEP but this change is less than that among non participants. For example, proportion of the men participants having access to tap water increased from 80.1% to 91.1%, i.e. increase by 11% point, while that of non-participants reached to 73.2% from 58.5% point with increase of 14.6 percent point. MEDEP’s targeted intervention for micro-enterprise development and capacity improvements of its enterprises has increased their access to services of different service providers including local bodies. Perhaps due to this, there was an increased probability of installing tap stands in areas dominated by Dalit entrepreneurs. . 6.1.5 Sanitation For assessing the impact of MEDEP in improvements in sanitation, this study assessed the change in the proportion of HHs with toilets before and after intervention. Table 6.8 shows proportion of participant and non-participant HHs having toilet.

52
Table 6.8: Proportion of households having toilet (Percent)
Respondent categories
A. Participants B. Non-Participants Changes among MEDEP’s
Contribution Now Before Now Before Participant Non-
participant
Overall 78.6* 59.9 66.1* 60.1 18.8 6.0 12.7
A. Gender
Women 79.5 60.9 68.3 64.1 18.6 4.2 14.4
Men 76.4 57.3 58.5 46.3 19.1 12.2 6.9
B. Caste/Ethnicity
BCTS 89.4 72.8 79.5 72.7 16.7 6.8 9.8
Dalit 73.2 47.5 54.0 50.0 25.8 4.0 21.8
Janajati 76.9 60.5 71.0 61.3 16.4 9.7 6.7
Other 61.0 44.1 55.6 55.6 16.9 0.0 16.9
Note: * significant at 1% level of significance
The data show that less than 60% HHs (3 out of 5 HHs) had toilets before intervention which increased to almost 79% after intervention (4 out of 5 HHs). The change in the proportion of HHs having toilets after intervention was higher among men than women entrepreneurs and among Dalit than others. The change was highest among Dalit (25.8%) compared to all other groups (16%). Among non-participants, the biggest change in percentage point was observed among Janajati than Dalit. The contribution of MEDEP on improving access to sanitation facility was 12.2 percent with highest contribution among Dalit, other and women.. A larger proportion of participants have constructed toilets after participating in MEDEP, as compared to non participants. Though there have been improvements on construction of toilet among both the participants and non-participants, the proportion of change is quite higher among participants compared to non-participants. The statistical analysis further showed that proportion of participants having toilets is significantly different from that of non-participants. 6.1.6 Energy sources for cooking Another indicator used to show changes at the household level was the type of energy used for cooking. Table 6.9 distributes HHs by the use of different types of energy for cooking purpose before and after participation in MEDEP and compares participants with and without intervention.
Table 6.9: Distribution of HHs by use of energy sources for cooking
(Percent)
Responses
A. Participants B. Non-
Participants Changes among
MEDEP’s Contribution
Now Before Now Before Participant Non-
participant
Fire-wood* 87.6 94.4 90.2 95.6 (6.7) (5.5) (1.3) LPG-gas 5.9 2.2 7.1 1.1 3.7 6.0 (2.3) Bio-gas 6.5 3.1 2.7 3.3 3.4 (0.5) 3.9
Crop-reside 0.0 0.4 0.0 0.0 (0.4) - (0.4) Total 100.0 100.0 100.0 100.0
Note: * insignificant at even 10% level of significance
The data show that MEDEP intervention is likely to reduce dependency of HHs on firewood and enable them to shift to other clean energy sources such as biogas and LPG gas. The proportion of HHs using firewood as major source of energy for cooking was 94% which has now reduced to 87.6%. Likewise, among non-participants the proportion of HHs using firewood at present is 90% whereas before intervention it was 95.6%. Statistical analysis showed that there is similarity on proportion of respondents using firewood among

53
participant and non-participants at present even at the 90 percent confidence level. However, proportion of HHs shifting to other energy sources is high among participant HHs compared to non-participant HHs with difference of 1.3 percent. This indicates that the decrease in use of firewood and increased use of LPG gas is due to factors other than just MEDEP intervention. Table 6.10 shows contribution made by MEDEP on changing sources of energy for cooking by gender and ethnicity with data in Annexure 6.4.
Table 6.10: Contribution of MEDEP on changing sources of energy for cooking by
respondent categories (Percent)
Source of energy
A. Sex Overall
B. Caste/Ethnicity
Women Men BCTS Dalit Janajati Others
Wood (2.7) 2.8 (1.3) 1.0 (5.1) (3.7) 14.5
LPG gas (1.5) (4.5) (2.3) (11.4) 2.5 2.6 (9.4)
Bio-gas 4.3 2.8 3.9 10.5 2.5 1.0 -
Crop residue - (1.2) (0.4) - - - (5.1)
As can be expected, women show a bigger shift to bio-gas than men entrepreneurs. Among caste and ethnic categories, the biggest contribution was found among BCTS, who adopted biogas after MEDEP intervention in much higher proportions compared to the other groups. 6.1.7 Source of energy for lighting Table 6.11 distributes HHs by the use of different energy sources for lighting among participants and non-participants.
Table 6.11: Distribution of HHs by use of energy for lighting
(Percent)
Source of energy
A. Participants B. Non-Participants Changes among MEDEP’s
Contribution Now Before Now Before Participant Non-
participant
Electricity 88.9* 64.7 87.4* 77.6 24.3 9.8 14.4 Solar 1.8 1.0 0.5 1.1 0.8 (0.5) 1.4
Candle 0.4 1.2 0.5 1.1 (0.8) (0.5) (0.3) Kerosene 8.5 33.1 10.9 19.7 (24.5) (8.7) (15.8)
Battery 0.4 0.1 0.5 0.5 0.2 - 0.2 Total 100.0 100.0 100.0 100.0
Note: * Significant at 10% level of significance The data show that MEDEP intervention increased the proportion of HHs using electricity among both the participations and non-participants. The proportion of HHs using electricity has increased to 89% from that of 64.7% earlier. Likewise, among non-participants the proportion of HHs using electricity at present is 87.4% whereas before intervention it was 77.6%. The test of significance confirms that MEDEP has been able to contribute positively to increase the use of electricity among its target groups. MEDEP participants have also increased their use of solar energy, showing greater access to clean energy than non participants. The net changes in sources of energy for lighting according to gender and ethnic categories are shown in Table 6.12 with detail data in Annexure 6.5.

54
Table 6.12: Contribution of MEDEP on changing source of energy for lighting by respondent categories
(Percent)
Energy source A. Sex
Overall B. Caste/Ethnicity
Women Men BCTS Dalit Janajati Others
Electricity 13.7 15.4 14.4 11.0 20.3 16.1 5.8
Solar 0.3 4.5 1.4 0.8 (0.5) 1.8 3.7
Candle (0.1) (0.8) (0.3) - (0.0) (0.6) (1.7)
Kerosene (14.1) (19.5) (15.8) (11.8) (20.3) (17.7) (7.8)
Battery 0.2 0.4 0.2 - 0.5 0.3 -
The data in the above table and corresponding Annexure 6.5 show that the contribution of MEDEP was more among men entrepreneurs for electricity, solar and battery based energy. A higher contribution in access to electricity was observed among Dalit (20.3%) followed by Janajati (16.1%), BCTS (11.0%) and least among others (5.8%).
6.2 Livelihoods Capitals/Assets This section assesses the impacts of MEDEP interventions on changes in livelihoods capitals which are comprised of physical, natural, financial, social and human capitals. Like earlier, changes in the HH capitals are assessed among the participants and non-participants at present and before. Where applicable, statistical significance test on status of livelihoods capital/assets is carried out among participants and non-participants at present. 6.2.1 Physical Assets Physical capital comprises the basic infrastructure and producer goods needed to support livelihoods such as land and livestock. a. Land Table 6.13 shows the proportion of HHs having land among participants and non-participants. Prior to the MEDEP intervention, 90.5% participant HHs had land which has now increased to 94.1%. There has been slight improvement on proportion of HHs having land having both the participants and non-participants; however change is higher among non-participant HHs than participant HHs resulting difference of 1.3% between the two groups.
Table 6.13: Distribution of HHs having land ( Percent)
Respondent categories
A. Participants B. Non-Participants Changes among MEDEP’s
Contribution Now Before Now Before Participant Non-
participant
Overall 94.1* 90.5 88.5* 83.6 3.6 4.9 (1.3)
A. Gender Women 93.7 90.1 85.2 81.7 3.6 3.5 0.1
Men 95.1 91.5 100.0 90.2 3.7 9.8 (6.1)
B. Ethnicity/Caste BCTS 96.7 90.2 95.5 90.9 6.5 4.5 2.0
Dalit 89.9 85.9 82.0 78.0 4.0 4.0 0.0
Janajati 94.5 93.3 91.9 85.5 1.2 6.5 (5.2)
Other 94.9 91.5 81.5 77.8 3.4 3.7 (0.3)
Note: * Significant at 1% level of significance By gender, contribution of MEDEP was positive among women. However, men among the control group all acquired land showing the importance of land as an asset in rural areas.

55
Among the ethnic groups, the highest contribution of MEDEP was observed among BCTS (2.0%) while data show no net impact in the case of Dalit and greater land acquisition among Janajati and others caste non participants, as compared to MEDEP participants. This reveals mixed results for MEDEP’s contribution to change in the proportion of HHs having land in terms of ethnicity. Table 6.14 shows average landholding size of participants and non-participants. Prior to the MEDEP intervention, the average land holding size of MEDEP participant was 0.52 which has now increased to 0.57 Ha. The average land holding size among participant HHs increased by 9.6% while that of non-participant increased by 5.0% with difference of 4.6% ha between the two groups. Furthermore, statistical analysis showed average land holding size of participants is significantly different from that of non-participants at present. This shows MEDEP’s positive contribution to increase land holding size of participants (4.6%).
Table 6.14: Average land holding size
Respondent categories
A. Participants B. Non-Participants Changes among (%) MEDEP’s Contribution
(%) Now (ha)
Before (ha)
Now (ha)
Before (ha)
Participant Non-participant
Overall 0.57 0.52 0.42 0.40 9.6 5.0 4.6
A. Gender
Women 0.54 0.49 0.37 0.36 12.2 2.8 9.5
Men 0.64 0.59 0.57 0.54 8.5 5.6 2.9
B. Ethnicity/Caste
BCTS 0.57 0.51 0.71 0.70 12.2 2.8 9.5
Dalit 0.46 0.45 0.28 0.27 8.5 5.6 2.9
Janajati 0.60 0.53 0.30 0.27 12.2 2.8 9.5
Others 0.78 0.75 0.46 0.45 8.5 5.6 2.9
Note: * Significant at 1% level of significance
By gender, contribution of MEDEP intervention was positive among both women and men, with women showing a higher propensity to acquire land as compared to women. Among the ethnic groups, the highest contribution was observed among BCTS and Janajati (9.5% each) followed by Janajati (0.04 ha), others and Dalit (2.9% each). This reveals MEDEP’s positive contribution to change in livelihoods assets, particularly in terms of average land holding size.
b. Physical assets
Participants and non-participants were asked if they had major physical assets (such as radio, television, refrigerator, motorbike, cycle, bio-gas plant, furniture) and their corresponding value. Table 6.14 presents proportion of HHs having physical assets by the participants and non-participants.
Table 6.14: Proportion of HHs having physical assets (Percent)
Respondent categories
A. Participants B. Non-Participants Changes among MEDEP’s
Contr Now Before Now Before Participant Non-
participant
Overall 96.5* 81.4 92.3* 73.2 15.1 19.1 (4.0)
A. Gender Women 95.9 80.4 92.3 71.1 16 21 (6)
Men 98.0 83.7 92.7 80.5 14 12 2
B. Caste/Ethnicity
BCTS 98.0 82.5 97.7 86.4 15.4 11.4 4.1
Dalit 93.9 78.3 92.0 58.0 15.7 34.0 (18.3)
Janajati 96.7 80.2 87.1 69.4 16.4 17.7 (1.3)
Other TC 98.3 93.2 96.3 88.9 5.1 7.4 (2.3)
Note: * Significant at 1% level of significance

56
As seen in the above table, prior to the MEDEP intervention, 81.4% participant HHs had several types of physical assets which have now increased to 96.5%. The percent change is higher among non-participant HHs than participant HHs with difference of 4% between the two groups. While MEDEP has made a positive contribution to increase physical assets, the rate of increase of non-participants is higher. This might be mainly because non-participants have higher rate of migration in gulf countries and this could have contributed to higher rate of increase in physical asset. Participants have invested more on enterprises and land. A higher proportion of HHs of women entrepreneurs showed increased physical assets as compared to those of men entrepreneurs. Among ethnicity, highest increase among participants at present was found among Janajati followed by Dalit, BCTS and other Terai caste. This shows a movement towards greater equity, with Dalit showing higher proportion of physical assets accumulation than BCTS. Again, the proportion of households with increase of physical assets in many categories is higher among the control group as compared to MEDEP participants. Table 6.15 presents average value of physical assets owned by participants and non-participants and average net impacts.
Table 6.15: Average value of physical assets
Respondent categories
A. Participants B. Non-Participants Changes among (%) MEDEP’s Contribution
(%) Now (Rs)
Before (Rs)
Now (Rs)
Before (Rs)
Participant Non-
participant
Overall 26,759* 10,183 16,973* 9,864 162.8 72.1 90.7
A. Gender
Women 26,906 10,776 15,353 9,210 149.7 66.7 83.0
Men 26,407 8,771 22,541 12,128 201.1 85.9 115.2
B. Caste/Ethnicity
BCTS 31,026 12,268 28,026 17,241 152.9 62.6 90.3
Dalit 14,373 5,790 11,138 5,808 148.2 91.8 56.5
Janajati 27,026 9,379 11,782 6,679 188.2 76.4 111.8
Other TC 49,043 20,713 22,093 12,665 136.8 74.4 62.3
Note: * Significant at 1% level of significance The data in Table 6.15 show that the average value of physical assets of participant HHs at present is Rs. 26,759 with maximum value of Rs. 248,200. Likewise, average value of physical assets of non-participant at present was Rs. 16,973.00 with maximum value was Rs. 119,000.00. On an average, value of physical assets due to MEDEP increased by Rs 90.7%. Statistical analysis further showed that value of assets owned by two groups is not similar. This means that MEDEP has positively contributed to increase in value of physical assets at present. By gender, contribution of MEDEP was found higher among women than that of men Likewise contribution of MEDEP was found highest among the participants belonging to Janajati followed by BCTS, others and Dalit. (c) Proportion of HHs owning Livestock Proportion of participants having livestock after MEDEP intervention has increased significantly. Table 6.17 below presents distribution of participants and non-participants having any livestock and net impacts. Before MEDEP intervention, 74% women participant HHs owned any livestock which has now increased to 85.8%. Although the participants show a higher percentage of households currently with livestock, the percent change among non-participant HHs is higher than participant HH.

57
Table 6.17: Distribution of Households Having any Livestock (Percent)
Respondent categories
A. Participants B. Non-Participants Changes among MEDEP’s
Contribution Now Before Now Before Participant Non-
participant
Overall 85.2* 73.9 79.2* 61.2 11.3 18.0 (6.7)
A. Gender
Women 85.8 74.2 76.1 60.6 11.6 15.5 (3.9)
Men 83.7 73.2 90.2 63.4 10.6 26.8 (16.3)
B. Caste/Ethnicity
BCTS 86.2 79.7 86.4 81.8 6.5 4.5 2.0
Dalit 81.3 65.7 64.0 48.0 15.7 16.0 (0.3)
Janajati 89.1 76.3 90.3 61.3 12.8 29.0 (16.3)
Others 72.9 64.4 70.4 51.9 8.5 18.5 (10.0)
Note: * Significant at 5% level of significance The proportion of HHs of women entrepreneurs owning livestock at present was higher than that of men entrepreneurs by 1.6 percent. In terms of ethnicity, the highest contribution of MEDEP was found among BCTS, while MEDEP could not exceed the performance of the control group for the rest of the ethnic groups. Table 6.18 shows average value of livestock owned by participant and non-participant HHs.
Table 6.18: Average value of livestock owned by HHs
Respondent categories
A. Participants B. Non-Participants Changes among (%) MEDEP’s Contribution
(%) Now (Rs)
Before (Rs)
Now (Rs)
Before (Rs)
Participant Non-
participant
Overall 35,605 18,446 24116 15,070 93.0 60.0 33.0
A. Gender
Women 34,106 18,024 24,298 15,862 89.2 53.2 36.0
Men 39,175 19,449 23,488 12,327 101.4 90.5 10.9
B. Caste/Ethnicity
BCTS 42,387 22,753 29,900 21,876 86.3 36.7 49.6
Dalit 25,702 12,539 16,426 9,444 105.0 73.9 31.0
Janajati 38,062 19,062 25,716 15,773 99.7 63.0 36.6
Others 26,856 16,871 25,259 12,785 59.2 97.6 (38.4)
Note: * Significant at 1% level of significance
The data above show that the average value of livestock of participant HHs at present was Rs. 35,605 and the maximum value of livestock owned by participant was Rs.166,000. Likewise, the average value of livestock of non-participant at present was Rs. 24,116 with maximum value was Rs. 110,000.00. Statistical analysis showed that value of livestock owned by two groups is not similar. This means that MEDEP has positively contributed to increase in value of livestock at present. MEDEP contribution on increasing value of livestock is 33 percent. MEDEP contribution was found higher among women than that of men. Among different ethnicity/caste groups, MEDEP contribution was highest among BCTS (49.6%) followed by Janajati (36.6%) and Dalit (31.0%). 6.2.2 Natural Capital
Natural capital includes natural resource stocks such as forest and water from which resource flows and services useful for livelihoods are derived. For assessing MEDEP’s impact on natural capital, this study used respondents’ (participants and non-participants) access to two types of natural resources, forest and water. This was measured in terms of membership and holding of decision making positions.

58
(a) Forestry groups Table 6.19 presents respondents having membership in forestry related groups.
Table 6.19: Proportion of HHs having membership in forestry groups
(Percent)
Respondent categories
A. Participants B. Non-Participants Changes among MEDEP’s
Contribution Now Before Now Before Participant Non-
participant
Overall 66.1* 49.3 53.6* 36.6 16.8 16.9 (0.1)
A. Gender
Women 66.0 47.4 51.4 33.8 18.6 17.6 1.0
Men 66.3 53.7 61.0 46.3 12.6 14.6 (2.0)
B. Caste/Ethnicity
BCTS 84.1 69.1 70.5 63.6 15.0 6.8 8.2
Dalit 62.1 46.5 32.0 22.0 15.7 10.0 5.7
Janajati 65.0 43.5 62.9 37.1 21.6 25.8 (4.2)
Others 10.2 8.5 44.4 18.5 1.7 25.9 (24.2)
Note: * Significant at 1% level of significance
Before MEDEP intervention, 49.3% participant HHs were members in forestry groups which has now increased to 66.1%, whereas the percentage of non participants joining forestry groups increased from 36.6% to 53.6%. MEDEP has made a positive contribution to increase membership in forestry groups, though the net difference in proportion of both groups is negligible. . The contribution of MEDEP was positive among women but negative among men suggesting that it has positively contribute to increase access of women to forestry groups. Among the ethnic groups, MEDEP contribution was highest proportion among BCTS (8.2%) followed by Dalit (5.7%) whereas the change was negative among others and Janajati. This indicates that probably the increase in the membership of people in forestry groups is not related to MEDEP alone, but there must have been an external drive for enrolment which has led to increased membership among both participants and non participants. Holding of decision making positions in the forestry groups Table 6.20 presents distribution of participants and non-participants having holding key
decision making positions14
in forestry related groups.
Table 6.20: Proportion of HHs holding decision making positions in forestry related
groups (Percent)
Respondents categories
A. Participants B. Non-Participants Changes among MEDEP’s Contribution Now Before Now Before Participant Non-
participant
Overall 12.7* 8.3 2.7* 3.8 4.4 (1.1) 5.5
A. Gender
Women 12.5 6.0 2.8 1.4 6.5 1.4 5.1
Men 13.4 13.8 2.4 12.2 (0.4) (9.8) 9.3
B. Caste/Ethnicity
BCTS 17.5 14.6 4.5 13.6 2.8 (9.1) 11.9
Dalit 11.6 7.1 2.0 2.0 4.5 - 4.5
Janajati 12.2 5.8 1.6 0.0 6.4 1.6 4.8
Others 0.0 0.0 3.7 0.0 - 3.7 (3.7)
Note: * Significant at 1% level of significance
14
Key decision making positions include chairperson, vice chairperson, secretary and treasurer.

59
The data show that before MEDEP intervention 8.3% participant HHs had occupied any decision making positions in forestry groups which has now increased by 5.5%, while the proportion of non-participants holding decision making positions in forestry groups has decreased by 1.1%. Statistical analysis further showed that proportion of participants holding decision making positions in forestry groups is significantly different from that of non-participants at present. This shows positive contribution of MEDEP in enhancing participants’ capacity to occupy any decision making positions in forestry groups. The contribution of MEDEP was positive among women while that of men have decreased. This shows that MEDEP’s intervention has changed the rules of the game by increasing the proportion of women in decision making positions. Among ethnic groups, highest contribution of MEDEP was observed among BCTS (11.9%) followed by Janajati (4.8%) and Dalit (4.5%) whereas the change was negative among other Terai caste group. The overall contribution of MEDEP in bringing participant households in decision making was positive, and more so for women, but the differences among ethnic categories are not in favour of the other terai caste. (b) Membership in Water Related Groups (Drinking Water, Irrigation etc.)
Table 6.21 presents the respondents having membership in water related groups. Table 6.21: Proportion of Hs with membership in Water Related Groups
(Percent)
Respondents categories
A. Participants B. Non-Participants Changes among MEDEP’s Contribution Now Before Now Before Participant Non-
participant
Overall 34.1* 21.0 21.3* 16.4 13.1 4.9 8.2
A. Gender
Women 33.8 19.8 20.4 15.5 14.0 4.9 9.1
Men 35.0 24.0 24.4 19.5 11.0 4.9 6.1
B. Caste/Ethnicity
BCTS 50.4 37.0 43.2 34.1 13.4 9.1 4.3
Dalit 38.4 19.7 8.0 8.0 18.7 - 18.7
Janajati 24.9 13.1 21.0 17.7 11.9 3.2 8.6
Other TC 3.4 3.4 11.1 0.0 0.0 11.1 (11.1)
Note: * Significant at 1% level of significance
As seen in above table, before MEDEP intervention, 21% participant HHs (1 out of 5) were members in water related groups which has now increased to 34.1% (1 out of 3). Statistical analysis show that proportion of participants having membership in water related group significantly different from that of non-participants at present. This shows MEDEP’s positive contribution to increased membership in water related groups. Contribution of MEDEP was positive among both women and men with highest contribution among women compared to men. Among the ethnic groups, the highest proportion of contribution was observed among Dalit (18.7%) followed by Janajati (8.6%), and BCTS (4.3%). This reveals that MEDEP’s positive contribution to change in the membership of water related groups which have specifically has gone in favor of Dalit and Janajati. Likewise, higher proportion of women and Dalit holding decision making positions in water related groups shows MEDEP’s contribution in changing rule of the game in favour of poor, excluded and disadvantaged people. MEDEP’s contribution in this regard seems positive. Holding of decision making positions in the water related groups Table 6.22 presents distribution of participants and non-participants holding decision making positions in water related groups.
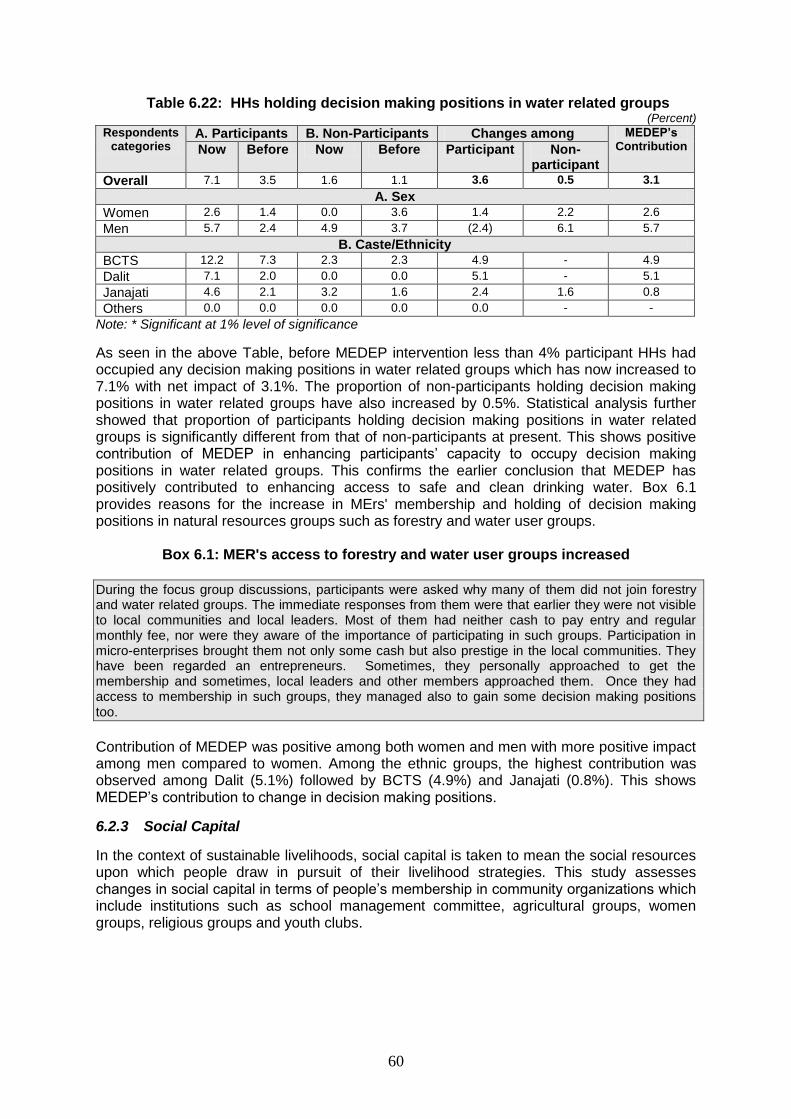
60
Table 6.22: HHs holding decision making positions in water related groups (Percent)
Respondents categories
A. Participants B. Non-Participants Changes among MEDEP’s Contribution Now Before Now Before Participant Non-
participant
Overall 7.1 3.5 1.6 1.1 3.6 0.5 3.1
A. Sex
Women 2.6 1.4 0.0 3.6 1.4 2.2 2.6
Men 5.7 2.4 4.9 3.7 (2.4) 6.1 5.7
B. Caste/Ethnicity
BCTS 12.2 7.3 2.3 2.3 4.9 - 4.9
Dalit 7.1 2.0 0.0 0.0 5.1 - 5.1
Janajati 4.6 2.1 3.2 1.6 2.4 1.6 0.8
Others 0.0 0.0 0.0 0.0 0.0 - -
Note: * Significant at 1% level of significance
As seen in the above Table, before MEDEP intervention less than 4% participant HHs had occupied any decision making positions in water related groups which has now increased to 7.1% with net impact of 3.1%. The proportion of non-participants holding decision making positions in water related groups have also increased by 0.5%. Statistical analysis further showed that proportion of participants holding decision making positions in water related groups is significantly different from that of non-participants at present. This shows positive contribution of MEDEP in enhancing participants’ capacity to occupy decision making positions in water related groups. This confirms the earlier conclusion that MEDEP has positively contributed to enhancing access to safe and clean drinking water. Box 6.1 provides reasons for the increase in MErs' membership and holding of decision making positions in natural resources groups such as forestry and water user groups.
Box 6.1: MER's access to forestry and water user groups increased
During the focus group discussions, participants were asked why many of them did not join forestry and water related groups. The immediate responses from them were that earlier they were not visible to local communities and local leaders. Most of them had neither cash to pay entry and regular monthly fee, nor were they aware of the importance of participating in such groups. Participation in micro-enterprises brought them not only some cash but also prestige in the local communities. They have been regarded an entrepreneurs. Sometimes, they personally approached to get the membership and sometimes, local leaders and other members approached them. Once they had access to membership in such groups, they managed also to gain some decision making positions too.
Contribution of MEDEP was positive among both women and men with more positive impact among men compared to women. Among the ethnic groups, the highest contribution was observed among Dalit (5.1%) followed by BCTS (4.9%) and Janajati (0.8%). This shows MEDEP’s contribution to change in decision making positions.
6.2.3 Social Capital
In the context of sustainable livelihoods, social capital is taken to mean the social resources upon which people draw in pursuit of their livelihood strategies. This study assesses changes in social capital in terms of people’s membership in community organizations which include institutions such as school management committee, agricultural groups, women groups, religious groups and youth clubs.

61
(a) Membership in community organizations
Table 6.23 shows the proportion of HHs holding memberships in community organizations15.
Table 6.23: Distribution of HHs having membership in community organizations (Percent)
Respondents categories
A. Participants B. Non-Participants Changes among MEDEP’s Contribution Now Before Now Before Participant Non-
participant
Overall 64.7* 30.6 56.8* 26.8 34.0 30.1 4.0
A. Gender
Women 65.9 29.0 55.6 23.9 36.9 31.7 5.2
Men 61.8 34.6 61.0 36.6 27.2 24.4 2.8
B. Caste/Ethnicity
BCTS 72.4 47.6 75.0 43.2 24.8 31.8 (7.0)
Dalit 51.0 20.7 34.0 16.0 30.3 18.0 12.3
Janajati 69.9 28.0 61.3 30.6 41.9 30.6 11.3
Other 49.2 8.5 59.3 11.1 40.7 48.1 (7.5)
Note: * Significant at 5% level of significance
The data show that before MEDEP intervention, 30.6% participant HHs (1 out of 3) were members in community organizations which, at present, has increased to 64.7%. Statistical analysis shows that proportion of participants having membership in community organizations is significantly different from that of non-participants at present. This shows MEDEP’s positive contribution to increased membership in community organizations.
The contribution of MEDEP intervention was positive among both women and men, with the high difference among women suggesting that it has positively contribute to increase access of women to community organizations. Among the ethnic groups, the highest contribution was observed among Dalit (12.3%) and Janajati (11.3%) with decrease among BCTS and others. This reveals MEDEP’s positive and appreciative impact in the membership of community organizations.
Holding of decision making positions in the community organizations
Table 6.24 presents the proportion of participants and non-participants holding decision making positions in community organizations..
Table 6.24: Proportion of HHs holding decision making positions in community organizations
(Percent)
Respondents categories
A. Participants B. Non-Participants Changes among MEDEP’s Contribution Now Before Now Before Participant Non-
participant
Overall 21.3* 6.5 10.9* 2.7 14.8 8.2 6.6
A. Gender
Women 21.3 5.3 6.3 1.4 16.0 4.9 11.1
Men 21.1 9.3 26.8 7.3 11.8 19.5 (7.7)
B. Caste/Ethnicity
BCTS 28.0 11.8 31.8 9.1 16.3 22.7 (6.5)
Dalit 11.6 3.0 0.0 0.0 8.6 - 8.6
Janajati 22.5 5.5 6.5 1.6 17.0 4.8 12.2
Other TC 18.6 1.7 7.4 0.0 16.9 7.4 9.5
Note: * Significant at 1% level of significance
15
The respondents are members in different community organizations. Generally community organizations include local youth clubs, school management committees, agricultural groups such as vegetable production, goat keeping groups, and religious groups. However, this does not include forestry and water user groups as these have been separately studied as part of natural capital.
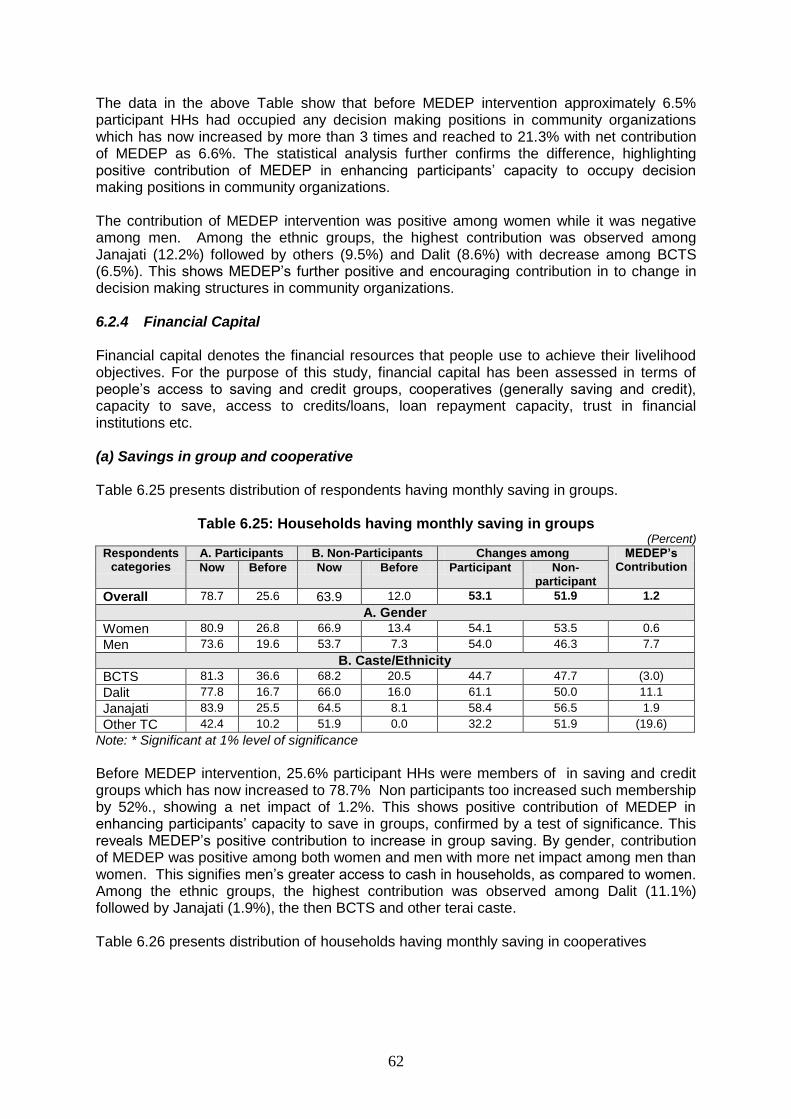
62
The data in the above Table show that before MEDEP intervention approximately 6.5% participant HHs had occupied any decision making positions in community organizations which has now increased by more than 3 times and reached to 21.3% with net contribution of MEDEP as 6.6%. The statistical analysis further confirms the difference, highlighting positive contribution of MEDEP in enhancing participants’ capacity to occupy decision making positions in community organizations. The contribution of MEDEP intervention was positive among women while it was negative among men. Among the ethnic groups, the highest contribution was observed among Janajati (12.2%) followed by others (9.5%) and Dalit (8.6%) with decrease among BCTS (6.5%). This shows MEDEP’s further positive and encouraging contribution in to change in decision making structures in community organizations. 6.2.4 Financial Capital Financial capital denotes the financial resources that people use to achieve their livelihood objectives. For the purpose of this study, financial capital has been assessed in terms of people’s access to saving and credit groups, cooperatives (generally saving and credit), capacity to save, access to credits/loans, loan repayment capacity, trust in financial institutions etc. (a) Savings in group and cooperative Table 6.25 presents distribution of respondents having monthly saving in groups.
Table 6.25: Households having monthly saving in groups
(Percent)
Respondents categories
A. Participants B. Non-Participants Changes among MEDEP’s Contribution Now Before Now Before Participant Non-
participant
Overall 78.7 25.6 63.9 12.0 53.1 51.9 1.2
A. Gender
Women 80.9 26.8 66.9 13.4 54.1 53.5 0.6
Men 73.6 19.6 53.7 7.3 54.0 46.3 7.7
B. Caste/Ethnicity
BCTS 81.3 36.6 68.2 20.5 44.7 47.7 (3.0)
Dalit 77.8 16.7 66.0 16.0 61.1 50.0 11.1
Janajati 83.9 25.5 64.5 8.1 58.4 56.5 1.9
Other TC 42.4 10.2 51.9 0.0 32.2 51.9 (19.6)
Note: * Significant at 1% level of significance
Before MEDEP intervention, 25.6% participant HHs were members of in saving and credit groups which has now increased to 78.7% Non participants too increased such membership by 52%., showing a net impact of 1.2%. This shows positive contribution of MEDEP in enhancing participants’ capacity to save in groups, confirmed by a test of significance. This reveals MEDEP’s positive contribution to increase in group saving. By gender, contribution of MEDEP was positive among both women and men with more net impact among men than women. This signifies men’s greater access to cash in households, as compared to women. Among the ethnic groups, the highest contribution was observed among Dalit (11.1%) followed by Janajati (1.9%), the then BCTS and other terai caste. Table 6.26 presents distribution of households having monthly saving in cooperatives

63
Table 6.26: Households with monthly saving in Cooperatives (Percent)
Respondents categories
A. Participants B. Non-Participants Changes among MEDEP’s Contribution Now Before Now Before Participant Non-
participant
Overall 54.8* 8.4 43.2* 1.6 46.4 41.5 4.9
A. Gender
Female 57.0 9.6 43.0 2.1 47.4 40.8 6.6
Male 49.6 5.7 43.9 0.0 43.9 43.9 -
B. Caste/Ethnicity
BCTS 60.2 13.8 36.4 0.0 46.3 36.4 10.0
Dalit 46.5 5.1 22.0 2.0 41.4 20.0 21.4
Janajati 57.4 7.3 51.6 1.6 50.2 50.0 0.2
Others 45.8 3.4 74.1 3.7 42.4 70.4 (28.0)
Note: * Significant at 1% level of significance
Earlier to MEDEP intervention, 8.4% participant saved in cooperatives which have now increased to 54.8%, while the proportion of non-participants saving in cooperatives has increased by 41.5%, with a net impact of 4.9%. The test of significance is positive, showing positive contribution of MEDEP in enhancing participants’ capacity to save in cooperatives. Contribution off MEDEP was positive among women and no net impact due to MEDEP was found among men. By ethnic groups, the highest contribution was observed among Dalit (21.4%) followed by BCTS (10.4%) and Janajati (0.2%). Although other terai caste people involved in saving at cooperatives has increased by 42.4%, the proportion of this category saving in cooperatives was higher among non-participants than participants. This indicates higher presence of cooperatives in the Terai region, and that probably the persons reached by MEDEP are in remote regions with low access. Average monthly saving Table 6.27 presents average monthly saving of participant and non-participant HHs in groups and cooperatives as reported by them.
Table 6.27 Average monthly saving in groups and cooperatives Rs
Respondents categories
A. Participants B. Non-Participants Changes among MEDEP’s Contribution
Now Before Now Before Participant Non-
participant
Overall 260.7* 12.8 151.3* 2.0 247.9 149.3 98.7
A. Gender
Women 274.7 16.1 80.5 2.6 258.6 77.9 180.7
Men 227.3 4.7 396.6 0.0 222.6 396.6 (174.0)
B. Caste/Ethnicity
BCTS 431.7 27.0 223.2 0.0 404.7 223.2 181.5
Dalit 147.1 5.9 43.4 0.4 141.2 43.0 98.2
Janajati 241.7 8.4 173.0 1.6 233.3 171.4 61.8
Others 35.1 0.7 184.1 9.3 34.4 174.8 (140.4)
Note: * Significant at 1% level of significance Table 6.27 presents average monthly savings of participants and non-participants in groups and cooperatives and average net impact. Average monthly saving of participant HHs at present was Rs. 260.70 while that of non-participant at present was Rs. 151.3. The Statistical analysis showed that average monthly saving of the two groups is not similar. This means that MEDEP has positively contributed to saving at present.

64
MEDEP contribution on saving among the cooperatives was found higher among women than that of men. Among different ethnicity/caste groups, higher contribution was found among BCTS followed by Janajati, Dalit and other terai caste groups. (b) Perception of bankability and negotiating skills
Respondents were asked to assess their perception of their own bankability and negotiating skills. Table 6.28 presents distribution of respondents by their perceptions on transformation to bankable from non-bankable.
Table 6.28: Perceptions about bank ability (Percent)
Respondents categories
A. Participants B. Non-Participants Changes among MEDEP’s Contribution Now Before Now Before Participant Non-
participant
Overall 76.2* 8.3 54.6* 16.9 67.9 37.7 30.2
A. Gender
Women 75.8 7.7 54.2 12.0 68.1 42.3 25.8
Men 77.2 9.8 56.1 34.1 67.5 22.0 45.5
B. Caste/Ethnicity
BCTS 84.1 17.5 79.5 31.8 66.7 47.7 18.9
Dalit 68.2 4.0 28.0 6.0 64.1 22.0 42.1
Janajati 80.9 4.6 46.8 12.9 76.3 33.9 42.4
Others 44.1 5.1 81.5 22.2 39.0 59.3 (20.3)
Note: * Significant at 1% level of significance A large majority of respondents felt that they have become bankable now and are able to receive credit/loan with less transaction costs and time at present compared to their situation before. While the proportion of both participants and non-participants have increased, percent change is far higher (68%) among participants than non-participants (37.7%). Before MEDEP intervention, 8.3% participant felt that they could get loan/credits from financial institutions which have now increased to 76.2%. Given that the increase among non participants was from 17% to 55%, the MEDEP contribution on confidence in bankability was 30.2%. This positive contribution of MEDEP in enhancing participants’ bankability was confirmed by the test of significance. The contribution of MEDEP was high among both women and men with more net impact among men than women. Among the ethnic groups, highest proportion of contribution was observed among Janajati (42.4%) followed by Dalit (42.1%), and BCTS (18.9%). Among other terai castes, the non participants perceived greater increase in bankability than MEDEP participants. This could be due to the larger presence of MFIs in the terai region in general, reducing the gap between participants and non participants on this score. (c) Loan repayment capacity During the survey, both the participants and non-participants were asked on their judge their capability to repay loan. Table 6.29 presents their perception on loan repayment capacity. Prior to MEDEP, less than 9% participant HHs felt that they could repay their loan so they were very reluctant to take loan even if they were available. By 2010, 77% of participants feel that they can repay loan timely. This is far higher than 40% increase among non participants. This was reinforced by test of significance, showing positive contribution of MEDEP in enhancing participants’ capacity to repay loan.

65
Table 6.29: Loan repayment capacity of HHs (Percent)
Respondents categories
Participants Non-Participants Changes in MEDEP’s Contribution Now Before Now Before Participant Non-
participants
Overall 76.9* 8.7 58.5* 19.1 68.3 39.3 28.9
A. Gender
Women 76.6 7.2 54.9 12.7 69.5 42.3 27.2
Men 77.6 12.2 70.7 41.5 65.4 29.3 36.2
B. Caste/Ethnicity
BCTS 84.1 17.9 79.5 36.4 66.3 43.2 23.1
Dalit 71.7 2.5 32.0 6.0 69.2 26.0 43.2
Janajati 79.9 5.5 54.8 14.5 74.5 40.3 34.1
Others 47.5 8.5 81.5 25.9 39.0 55.6 (16.6)
Note: * Significant at 1% level of significance
Contribution of MEDEP was positive among both women and men with more net impact among men than women. Among the ethnic groups, the highest contribution was observed among Dalit (43.2%) followed by Janajati (34.1%) and BCTS (23.1). 6.2.5 Human capital Human capital represents the skills, knowledge, ability to labor and good health that enable people to pursue different livelihood strategies and achieve their livelihood objectives. This study assessed human capital in terms of literacy level of participants and non-participants. Table 6.30 shows the literacy rate of population of age of over 5 years among participants and non-participants.
Table 6.30: Literacy rate of family members (5 years and above) (Percent)
Entrepreneurs
Participants Non-Participants Changes among MEDEP’s
Contribution Now Before Now Before Participant Non-
participant
Women 74.4* 70.4 70.7* 64.0 4.0 6.7 -2.7
Men 87.4 84.7 83.2 81.2 2.7 2.0 0.7
Overall 81.1 77.8 77.0 72.8 3.4 4.2 -0.8
Note: * Insignificant Of the total population of 5 years and above among MEDEP participants, 70.4 percent of sampled population were literate which has increased to 74%. Literacy among MEDEP participants just rose 3.4%, less than the 4.2 percent increases among non-participants. The analysis showed that the population of 5 years old and above in terms of literacy rate between participants and non-participants at present are not significantly different. This shows that the increase in literacy rates was more likely due to increased access to government scholarships, access to educational facilities and infrastructure and non-formal educational services.
6.3 Livelihood Outcomes Livelihoods outcomes at household level were assessed on multiple indicators: house ownership, roofing material, type of floor, access to drinking water and sanitation, and energy source used for cooking and lighting. The important parameters used were income, food security and reduced migration.

66
6.3.1 Income Per capita income is the ratio of total income of all the HH members obtained from different sources to the HH size. Figure 6.1 below shows that per capita income of participant and non-participant were almost similar before receiving support from MEDEP. This is because initial selection was done on poverty criteria, and all households selected were those below the national poverty line. The survey results showed that the per capita income of participants has now reached to Rs 26, 961 while that of non-participants reached to 12514. The difference between two groups at present is 117%.
Figure 6.1: Per Capita Income of Participant and Non-participant HHs
4402
26961
4278
12514
0
5000
10000
15000
20000
25000
30000
Now Before
Rs
Participant Non-participant
Note: Before income was taken from MEDEP database.
Table 6.31 shows the per capita income of respondents by gender and ethnicity.
Table 6.31: Per capita income
(Rs)
Respondents categories
Participants Non-Participants Percent changes among MEDEP’s Contribut
ion (%) Now Before Now Before Participant Non-
participant
Overall 26961* 4402 12514* 4278 512.5 192.5 320.0
A. Gender
Women 27094 4338 12065 4071 524.6 196.4 328.2
Men 26644 4554 14066 4966 485.1 183.2 301.8
B. Caste/Ethnicity
BCTS 30817 4644 15688 5351 563.6 193.2 370.4
Dalit 23593 3869 12377 3546 509.8 249.1 260.7
Janajati 26323 4380 11505 3936 501.0 192.3 308.7
Others 25735 5305 9909 4915 385.1 101.6 283.5
Note: * Significant at 1% level of significance
The data show that the average per capita income at present has reached to Rs. 26,961.00 with maximum of Rs. 184,000 whereas the average per capita income of non-participants is 12,514.00 with maximum of Rs. 121,000. Overall, PCI of both participants and non-participants have increased but a much higher increase was observed among participants (512.5%) than non-participants (192%). Analysis further showed that the two groups participants and non-participants are significantly different. This confirms MEDEP’s substantial contribution to increase in income among participants. A larger contribution of MEDEP was PCI observed among women participants. . By ethnicity, contribution was highest among BCTS followed by Janajati, other TCs and Dalit.
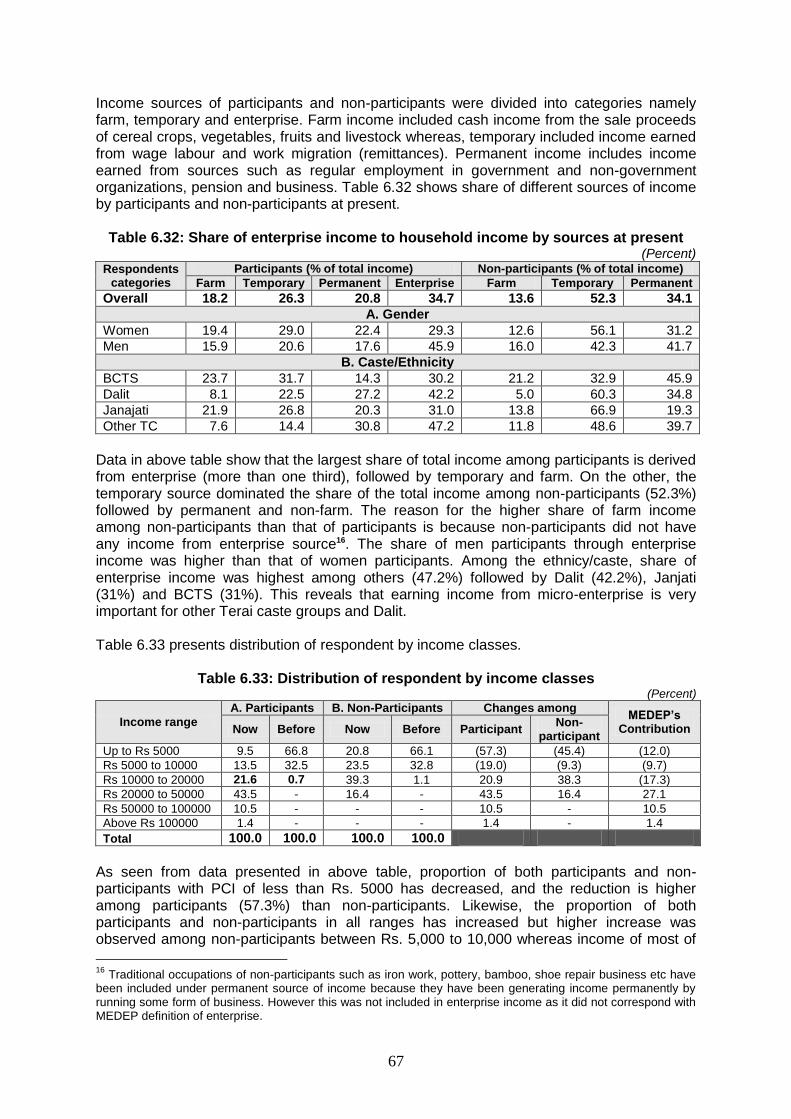
67
Income sources of participants and non-participants were divided into categories namely farm, temporary and enterprise. Farm income included cash income from the sale proceeds of cereal crops, vegetables, fruits and livestock whereas, temporary included income earned from wage labour and work migration (remittances). Permanent income includes income earned from sources such as regular employment in government and non-government organizations, pension and business. Table 6.32 shows share of different sources of income by participants and non-participants at present.
Table 6.32: Share of enterprise income to household income by sources at present (Percent)
Respondents categories
Participants (% of total income) Non-participants (% of total income)
Farm Temporary Permanent Enterprise Farm Temporary Permanent
Overall 18.2 26.3 20.8 34.7 13.6 52.3 34.1
A. Gender
Women 19.4 29.0 22.4 29.3 12.6 56.1 31.2
Men 15.9 20.6 17.6 45.9 16.0 42.3 41.7
B. Caste/Ethnicity
BCTS 23.7 31.7 14.3 30.2 21.2 32.9 45.9
Dalit 8.1 22.5 27.2 42.2 5.0 60.3 34.8
Janajati 21.9 26.8 20.3 31.0 13.8 66.9 19.3
Other TC 7.6 14.4 30.8 47.2 11.8 48.6 39.7
Data in above table show that the largest share of total income among participants is derived from enterprise (more than one third), followed by temporary and farm. On the other, the temporary source dominated the share of the total income among non-participants (52.3%) followed by permanent and non-farm. The reason for the higher share of farm income among non-participants than that of participants is because non-participants did not have any income from enterprise source16. The share of men participants through enterprise income was higher than that of women participants. Among the ethnicy/caste, share of enterprise income was highest among others (47.2%) followed by Dalit (42.2%), Janjati (31%) and BCTS (31%). This reveals that earning income from micro-enterprise is very important for other Terai caste groups and Dalit. Table 6.33 presents distribution of respondent by income classes.
Table 6.33: Distribution of respondent by income classes (Percent)
Income range
A. Participants B. Non-Participants Changes among MEDEP’s
Contribution Now Before Now Before Participant Non-
participant
Up to Rs 5000 9.5 66.8 20.8 66.1 (57.3) (45.4) (12.0)
Rs 5000 to 10000 13.5 32.5 23.5 32.8 (19.0) (9.3) (9.7)
Rs 10000 to 20000 21.6 0.7 39.3 1.1 20.9 38.3 (17.3)
Rs 20000 to 50000 43.5 - 16.4 - 43.5 16.4 27.1
Rs 50000 to 100000 10.5 - - - 10.5 - 10.5
Above Rs 100000 1.4 - - - 1.4 - 1.4
Total 100.0 100.0 100.0 100.0
As seen from data presented in above table, proportion of both participants and non-participants with PCI of less than Rs. 5000 has decreased, and the reduction is higher among participants (57.3%) than non-participants. Likewise, the proportion of both participants and non-participants in all ranges has increased but higher increase was observed among non-participants between Rs. 5,000 to 10,000 whereas income of most of
16
Traditional occupations of non-participants such as iron work, pottery, bamboo, shoe repair business etc have been included under permanent source of income because they have been generating income permanently by running some form of business. However this was not included in enterprise income as it did not correspond with MEDEP definition of enterprise.

68
the participants increased within the range of Rs.20,000 to 50,000 (43.5%) with a net difference of 27.1%. This shows that the majority of the participant HHs has crossed the poverty line. The next chapter on contribution of MEDEP to MDG further highlights this. Data in table 6.34 below analyses contribution of MEDEP to different income classes by respondent categories with details in Annexure 6.6.
Table 6.34: MEDEP’s Contribution to income by respondent categories (Percent)
Responses A. Gender Overall B. Caste/Ethnicity
Women Men BCTS Dalit Janajati Others Up to Rs 5000 3.7 (25.1) (12.0) (14.0) (5.2) (10.8) (17.1)
Rs 5000 to 10000 (18.5) 2.6 (9.7) 3.4 (11.5) (12.1) (22.8)
Rs 10000 to 20000 (23.6) (16.6) (17.3) (25.9) (20.8) (15.6) (5.0)
Rs 20000 to 50000 27.6 24.5 27.1 22.3 27.4 26.6 36.3
Rs 50000 to 100000 8.9 14.2 10.5 12.2 10.1 9.7 8.5
Above Rs 100000 1.9 0.4 1.4 2.0 - 2.1 -
Above table reveals that MEDEP’s contribution was negative for participants belonging to income group of less than 20000 while its contribution increased for rest of the income group. This situation remains similar by gender and caste. MEDEP contribution was relatively higher among men compared to women for moving to higher income group. Among the caste group, there is not mark able difference on contribution of MEDEP among different income groups. However, BCTS have relatively moved to high income group followed by Dalit and Janajati. This reveals MEDEP’s positive contribution to move participants to higher income groups while that of lower groups has decreased. 6.3.2 Household food security
Food security has four components: (i) availability (the sum of domestic production, imports and changes in national stock), (ii) access (a household’s or individual’s entitlement to food, (iii) utilization (how food is handled and then biologically absorbed into the body) and (iv) vulnerability (susceptibility to risk of not having access to food). While all components are equally important, this study is focused on availability component which is critical component of the household food security.
(a) Food Sufficiency For assessing the availability, food sufficiency is taken as proxy indicator which, apart from taking care of availability, considers issues of access too. It incorporates both supply and demand factors. Food sufficiency has been assessed in terms of number of months of food sufficiency for a household from their own production and other permanent sources of income. As stated earlier, permanent source of income includes sources such as service, business, pension, enterprises etc. However, daily and seasonal wage labour is not included in it. Figure 6.2 shows the number of months of food sufficiency among participants and non-participants before and now.

69
Figure 6.2: Number of months of food sufficiency from own production and permanent source of income
5.83.6
4.3
3.1
0
1
2
3
4
5
6
7
Now Before
No
of
mo
nth
s
Participant Non-participant
As seen in this figure, before MEDEP, on average, participants had sufficient food for 3.6 months which increased to 5.8 months with net increase of 2.2 months. Survey results showed also increase in number of food sufficient months among non-participants but this increase was lower than that of participants by 1.0 month. Table 6.35 shows the number of food sufficient months of participant and non-participant HHs by gender and ethnicity.
Table 6.35: Number of food sufficient months among participants and non-participants
(Month)
Respondents categories
Participants Non-Participants Changes among MEDEP’s
contribution Now Before Now Before Participant Non-
participant
Overall 5.8* 3.6 4.3* 3.1 2.2 1.2 1.0
A. Gender
Women 5.7 3.6 4.2 3.0 2.1 1.2 0.9
Men 6.0 3.7 4.6 3.4 2.3 1.2 1.1
B. Caste/Ethnicity
BCTS 6.0 3.7 5.3 3.0 2.4 2.2 0.1
Dalit 5.3 3.6 4.3 3.2 1.6 1.1 0.6
Janajati 5.8 3.5 3.8 2.9 2.3 0.9 1.4
Other TC 6.5 3.9 3.8 3.4 2.6 0.4 2.2
Note: * Significant at 1% level of significance
The analysis of data in the above table shows that while both women and men participants had increase in number of food sufficiency months but the change was higher among men participants compared to women participants. This is also consistent with income increase data, which show a higher increase among men as compared to women participants. All ethnic groups showed net increase in number of food sufficient months but the largest increase was found among other Terai caste followed by Janjatis, Dalit and BCTS. Table 6.36 divides below number of months of food sufficiency from own production and permanent source of income and shows how participants and non-participants have moved from one level to the other.

70
Table 6.36: Number of food sufficient months by ranges (Percent)
Number of food sufficient months
(Ranges)
Participants . Non-Participants Changes among MEDEP’s
contribution Now Before Now Before Participant Non-particip.
Up to 3 months 14.1 48.7 41.0 70.5 (34.6) (29.5) (5.1)
3 – 6 months 51.7 48.6 44.8 27.3 3.1 17.5 (14.4) 6 – 9 months 29.3 2.8 13.1 2.2 26.6 10.9 15.6 Above 9 months 4.9 - 1.1 - 4.9 1.1 3.8
Total 100 100 100 100
The data show that both participants and non-participants have improved in terms of decreasing number of food sufficient months. However, the increase was more prominent among participants than non-participants. Table 6.37 presents net increase in number of food sufficient months by gender and ethnicity with detail data in Annexure 6.7.
Table 6.37 Contribution of MEDEP on changing food sufficiency months by respondent categories
(Percent)
Responses A. Gender Overall B. Caste/Ethnicity
Women Men BCTS Dalit Janajati Other
Up to 3 months (4.4) (7.7) (5.1) (1.8) (8.3) (33.4) (4.4)
3 – 6 months (13.6) (14.6) (14.4) (28.0) (9.1) 9.5 (20.9)
6 – 9 months 14.5 17.9 15.6 23.3 18.5 18.7 14.5
Above 9 months 3.4 4.5 3.8 6.5 (1.1) 5.2 10.8
The data in above table show that the increases in number of food sufficient months have been largest among Janajati followed by Dalit, other TC and BCTS. Men participants have shown more increase than women participants. For assessing the access of participants and non-participants to food, participants and non-participants were asked if they have had sufficient income to procure food for their respective HHs. Table 6.38 presents responses of participants and non-participants by distribution by their responses on the income earned at least for meeting the food requirements of their respective HH members.
Table 6.38: Distribution of participants and non-participants by their income (cash) sufficient for procuring food to meet HH requirements
(Percent)
Respondents categories
A. Participants B. Non-Participants Changes among MEDEP’s contribution Now Before Now Before Participant Non-
participant
Overall 73.4* 11.1 37.7* 8.7 62.4 29.0 33.4
A. Gender
Women 73.7 10.1 31.0 4.9 63.7 26.1 37.6
Men 80.1 18.3 50.0 15.9 61.8 34.1 27.7
B. Caste/Ethnicity
BCTS 80.1 18.3 50.0 15.9 61.8 34.1 27.7
Dalit 61.6 7.1 28.0 4.0 54.5 24.0 30.5
Janajati 79.6 9.1 37.1 9.7 70.5 27.4 43.1
Other TC 50.8 5.1 37.0 3.7 45.8 33.3 12.4
Note: * Significant at 1% level of significance
Before MEDEP, less than 12% participant HHs reported cash incomes sufficient to procure food for the family which has now increased to 73.4%, The proportion of non-

71
participants who reported to have income to procure food has also increased by 29%, but far less than that of participants (62.4%), thus showing a net contribution of MEDEP by 33.4%. The analysis showed that proportion of participants reported to have earned income (cash) to procure quality food for consumption is significantly different from that of non-participants at present. This further shows positive contribution of MEDEP in enhancing participants’ capacity to procure food. Among the ethnic groups, the highest contribution of MEDEP was observed among Janajati (43.1%) followed by Dalit (30.6%), BCTS (27.7%) and other Terai caste groups (12.4%). In general, impact of MEDEP towards earning sufficient cash income for procuring food sufficient to meet HH requirements across different ethnic/caste groups is positive. The proportion of change due to MEDEP intervention was positive among both women and men with more net impact among women than men. Placed against the fact that men earned higher incomes than women, gender analysis shows that women prioritize food purchase more than men entrepreneurs. . (b) Quality of Food Table 6.39 presents distribution of participants and non-participants by their responses on consumption of nutritious and good quality food. Good quality refers to the food menu which is comprised of at least three things: rice or bread, pulse soup (dal) and one vegetable. Use of pickles could be optional and occasional. If a HH is non-vegetarian, diet could be supplemented by mutton or chicken at least twice in a month.
Table 6.39: Distribution of participants and non-participants by food quality (Percent)
Responses Participants Non-Participants Changes among MEDEP’s contribution Now Before Now Before Participant Non-parti
Overall 40.3 18.4 20.2 8.7 21.9 11.5 10.4
A. Gender
Women 39.2 19.3 16.9 5.6 20.0 11.3 8.7
Men 42.7 16.3 31.7 19.5 26.4 12.2 14.2
B. Caste/Ethnicity
BCTS 45.9 20.3 38.6 18.2 25.6 20.5 5.2
Dalit 24.7 10.1 2.0 0 14.6 2.0 12.6
Janajati 46.5 21.6 19.4 11.3 24.9 8.1 16.9
Other 33.9 20.3 25.9 3.7 13.6 22.2 (8.7)
Note: * Significant at 1% level of significance
Before MEDEP intervention, less than 20% (one in five) participants reported consumption of good quality food which has now increased to 40.3%. The proportion of non-participants who reported to have consumed good quality food has also increased by 11.5%, but far less than that of participants (21.9%). This shows a net contribution of 10.4% due to MEDEP participation. Analysis showed that proportion of participants consuming quality food is significantly different from that of non-participants at present. This further shows positive contribution of MEDEP in enhancing participants’ capacity to consume good quality food. By gender, contribution of MEDEP was positive among both women and men with more net impact among men than women. Among the ethnic groups, the highest contribution was observed among Dalit (11.1%) followed by Janajati (16.9%) followed by Dalit (12.6%) and BCTS (5.2%). While other Terai caste group consuming good quality food after intervention has increased but much lower to than that of non-participants. In general, impact of MEDEP towards the consumption of quality food by Dalit and Janjatis have improved substantially, with difference of more than overall net contribution of MEDEP

72
6.3.3 Migration
For centuries, large numbers of Nepali workers have gone to India during the dry season to seek seasonal employment. Recent years have seen this phenomenon increase for casual work, employment and educational purposes. Apart from India, Nepalis have been migrating to other countries such as UAE, Malayasia, Kuwait, Korea, Japan, UK and USA. Depending on the economic status and opportunities, people select the countries for work migration. A recent report by the World Bank even reported that Nepal is the fifth top-most country in the world successful in earning remittance income. In short, migration is not a new phenomenon for Nepal. Table 6.40 shows the distribution of participant and non-participant HHs with at least one HH member having migrated.
Table 6.40: HHs with at least one migrant family member (Percent)
Responses A. Participants B. Non-Participants Changes among Overall difference Now Before Now Before Participant Non-
participant
Overall 33.2* 20.7 36.6* 6.6 12.5 30.1 (17.5)
A. Gender
Women 35.3 19.8 36.6 5.6 15.5 31.0 (15.5)
Men 28.0 23.2 36.6 9.8 4.9 26.8 (22.0)
B. Caste/Ethnicity
BCTS 39.8 10.2 54.5 20.5 29.6 34.1 (4.5)
Dalit 32.8 29.2 40.0 0.0 3.6 40.0 (36.4)
Janajati 25.8 29.4 16.1 4.8 (3.6) 11.3 (14.9)
Other 47.5 10.7 48.1 0.0 36.7 48.1 (11.4)
Note: * Test result insignificant
The proportion of non-participants who reported at least one migrant from their HH members has increased for both participants and non-participants but the increase among non-participants is much higher at 30.1% compared to participants (12.5%). Combined with a test of significance, the finding is that MEDEP did not contribute to increase migration but, in fact, it might have lowered/reduced the probability of migration. The difference is more pronounced among men entrepreneurs. Among the ethnic groups, the highest proportion of difference was observed among Dalit (36.4%) followed by Janajati (14.9%) other Terai caste (11.4%) and BCTS (4.5%). It is important to state here that results on migration do not merit a simplistic analysis. As incomes of the poor increase, migration is likely to increase, with families opting to send their children to better paid jobs, and for higher and more skilled education. The results show a combination of reduction of distress migration, and increase in migration which depicts better opportunities.
6.4 Vulnerability Assessment People’s livelihoods and the wider availability of assets are fundamentally affected by critical trends as well as shocks and stresses-over which they have limited or no control. Shocks include factors such as human health shocks, natural shocks, economic shocks and conflicts. Seasonality and stresses could be of prices, of production, of health and of employment opportunities. Assets are both destroyed and created as a result of the shocks and seasonality of the vulnerability context. Participants and non-participants were asked their perception to cope with the shocks and stresses. Following five shocks and stress areas were selected for impact assessment (a) occurrence of flood and landslides (b) agricultural production (c) loss of livestock and poultry (d) sickness of HH members (e) loss of key earning member or HH head due to death or permanent disability. Table 6.41 presents distribution of participants and non-participants by their responses on ability to cope from shocks and stresses

73
Table 6.41: Ability of respondent’s to cope up with shock and stresses (Percent)
Shocks and stresses A. Participants B. Non-Participants
Changes among MEDEP Contribution
Now Before Now Before Participant Non-part.
Flood and landslides 51.0*** 20.7 36.6*** 19.7 30.3 16.9 13.3
Poor agriculture agricultural production
62.4*** 24.5 45.9*** 20.8 37.9 25.1 12.7
Death/loss of livestock/poultry
56.3*** 22.2 40.4*** 18.6 34.0 21.9 12.2
Major illnesses in family
54.1*** 21.8 43.2*** 19.7 32.3 23.5 8.8
Death of earning members in family
38.8** 13.9 32.2** 14.8 24.9 17.5 7.4
*** Significant at 1%; ** Significant at 5%
Before MEDEP intervention, about 14% to 25% to (less than one in four) participants reported that could cope with selected vulnerability indicators (shocks and stresses). This has now increased to 39 to 63%. Likewise, the ability of non-participants too has increased but at much lower rates (17 to 26%). Thus the net contribution of MEDEP ranges from 7.4 to 13.3%. Analysis showed that proportion of participants have increased their ability to cope shock and stresses irrespective of type or categories. Table 6.42 shows MEDEP’s contribution to increase ability to cope with shocks and stresses. Table 6.42: Contribution of MEDEP’s on enhancing ability of respondent’s to cope up
with shock and stresses by respondent categories (Percent)
Responses Gender Overall Caste/Ethnicity
Women Men BCTS Dalit Janajati Others
Flood and landslides 12.7 17.1 13.3 17.3 19.8 12.2 (14.1)
Poor agriculture agricultural production 10.4 21.5 12.7 18.9 14.4 14.3 (14.7)
Death/loss of livestock/poultry 9.5 21.5 12.2 19.1 17.3 8.2 (10.7)
Major illnesses in family 4.6 24.0 8.8 17.5 7.3 7.7 (5.9)
Death of earning members in family 5.2 15.0 7.4 8.1 15.3 3.0 (3.3)
The contribution of MEDEP to enhance ability to cope up with shock and stresses was positive among both women and men with high contribution among men compared to women. Among the ethnic groups, the contribution of MEDEP to increase people’s ability to cope with shocks and stresses differed by type of shocks and stresses. Overall, ability of Dalit has increased more than other groups followed by BCTS and Janajati. While the proportion of other Terai caste people reporting increase in their ability to cope with shocks and stresses in all areas has increased at present compared to before MEDEP intervention but the proportion of improvements among non-participants was high in all areas with highest difference for reduction in agricultural production followed by flood and landslides, loss of livestock/poultry, sickness in family members and loss of earning members. This suggests that Nepal’s Terai areas have been coping regularly with floods and other climate change effects. Impact of the project in this area remained almost nil. Detail data are presented in Annexure 6.8.

74
7 IMPACT AT INDIVIDUAL LEVEL: ECONOMIC, SOCIAL AND POLITICAL EMPOWERMENT
This chapter assesses the differences between MEDEP participants and non-participants on the basis of impact at individual’s level, especially on the parameter of empowerment. The first section presents respondent’s perception with their status within households followed by their status within the community. Thereafter, an assessment is made about MEDEP’s impact on three dimensions of empowerment, namely economic, social and political. This section does not disaggregate data by gender and caste group because next section assesses MEDEP’s contribution on gender and social inclusions where extent of empowerment is analyzed by caste and gender.
7.1 Status within the Household
The first aspect considered is the status of the respondents (participants and non-participants) within the household, which is assessed through two indicators: involvement in decisions regarding HHs affairs and in HH economic decisions. 7.1.1 Involvement in decisions regarding HHs affairs Table 7.1 presents distribution of participants and non-participants by their involvement in HHs decisions which include procurement of groceries, clothing, repair houses and leasing of land and properties.
Table 7.1: Distribution of respondents by their involvement in HH decisions (Percent)
Responses
Participants Non-Participants Changes among MEDEP
Contribution Now Before Now Before Participant Non-
participant
Groceries purchases
37.0*** 28.2 47.0*** 44.3 8.8 2.7 6.0
Clothing 35.5** 26.9 43.2** 43.2 8.5 - 8.5
Repair house 16.5*** 13.5 8.2*** 7.7 3.0 0.5 2.5
Leasing land 15.3*** 12.6 7.7*** 7.7 2.6 - 2.6
*** Significant at 1%; ** Significant at 5% As seen in the above Table, before MEDEP intervention 28.2% of participants HHs were involved in decision making process regarding groceries purchase which has now increased to 37.0% with net difference of 6.0%. The proportion of non-participants involved in such decision making process has increased by 2.7%, which is much lower than that of participants. Likewise, before MEDEP intervention 26.9% of participants HHs were involved in decision-making regarding clothing which has now increased to 35.5% with net impact of 8.5% after considering the change among non-participants. Similarly, 13.5% of the HHs were consulted earlier in decision making regarding repair of houses, which has now increased to 16.5% with net impact of 2.5%. This situation is also seen in case of decisions regarding leasing of land where before MEDEP intervention 12.6% of the participants HHs were involved, and now 15.3% are. When compared with the change in the control group, the positive change attributable to MEDEP is 2.6%, which is validated through statistical tests of significance. 7.1.2 Involvement in economic decisions Involvement in economic decision has been assessed using indicators such as access to and uses of loan, saving in group, selection of income generating activities/business, selling of products and services including utilization of income. Table 7.2 presents distribution of participants and non-participants by their involvement in economic decisions of households.
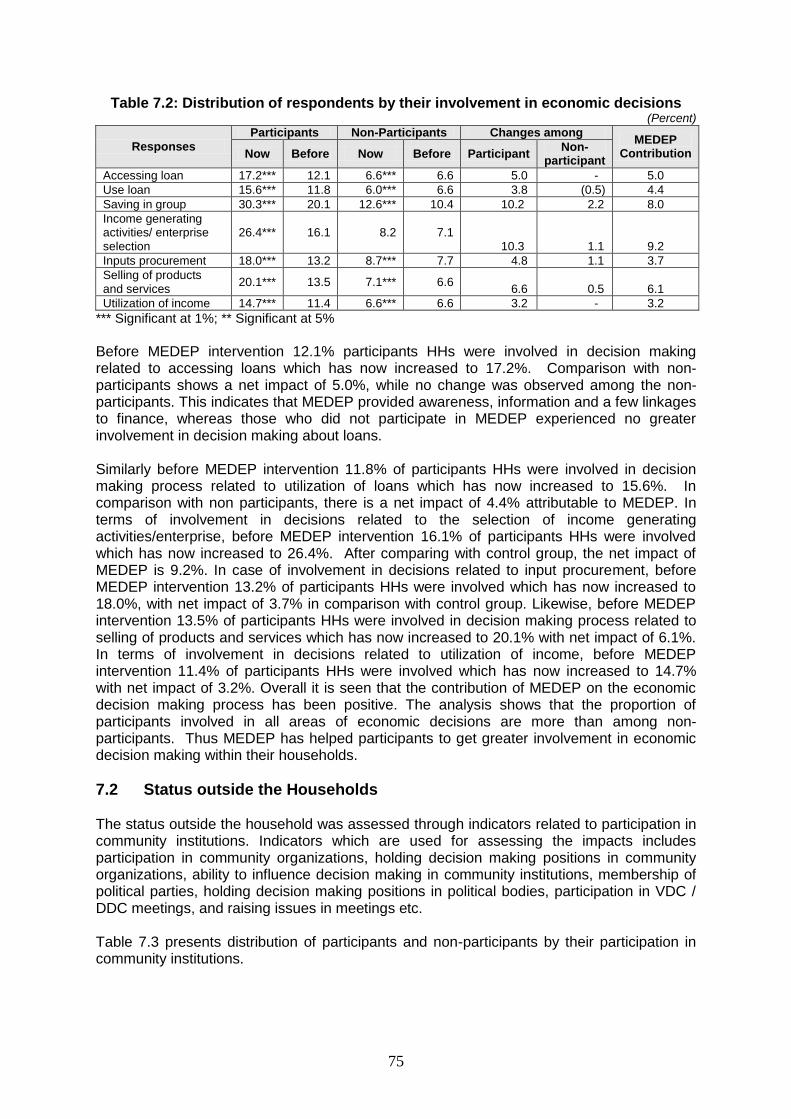
75
Table 7.2: Distribution of respondents by their involvement in economic decisions (Percent)
Responses
Participants Non-Participants Changes among MEDEP
Contribution Now Before Now Before Participant Non-
participant
Accessing loan 17.2*** 12.1 6.6*** 6.6 5.0 - 5.0
Use loan 15.6*** 11.8 6.0*** 6.6 3.8 (0.5) 4.4
Saving in group 30.3*** 20.1 12.6*** 10.4 10.2 2.2 8.0
Income generating activities/ enterprise selection
26.4*** 16.1 8.2 7.1 10.3 1.1 9.2
Inputs procurement 18.0*** 13.2 8.7*** 7.7 4.8 1.1 3.7
Selling of products and services
20.1*** 13.5 7.1*** 6.6 6.6 0.5 6.1
Utilization of income 14.7*** 11.4 6.6*** 6.6 3.2 - 3.2
*** Significant at 1%; ** Significant at 5%
Before MEDEP intervention 12.1% participants HHs were involved in decision making related to accessing loans which has now increased to 17.2%. Comparison with non-participants shows a net impact of 5.0%, while no change was observed among the non-participants. This indicates that MEDEP provided awareness, information and a few linkages to finance, whereas those who did not participate in MEDEP experienced no greater involvement in decision making about loans. Similarly before MEDEP intervention 11.8% of participants HHs were involved in decision making process related to utilization of loans which has now increased to 15.6%. In comparison with non participants, there is a net impact of 4.4% attributable to MEDEP. In terms of involvement in decisions related to the selection of income generating activities/enterprise, before MEDEP intervention 16.1% of participants HHs were involved which has now increased to 26.4%. After comparing with control group, the net impact of MEDEP is 9.2%. In case of involvement in decisions related to input procurement, before MEDEP intervention 13.2% of participants HHs were involved which has now increased to 18.0%, with net impact of 3.7% in comparison with control group. Likewise, before MEDEP intervention 13.5% of participants HHs were involved in decision making process related to selling of products and services which has now increased to 20.1% with net impact of 6.1%. In terms of involvement in decisions related to utilization of income, before MEDEP intervention 11.4% of participants HHs were involved which has now increased to 14.7% with net impact of 3.2%. Overall it is seen that the contribution of MEDEP on the economic decision making process has been positive. The analysis shows that the proportion of participants involved in all areas of economic decisions are more than among non-participants. Thus MEDEP has helped participants to get greater involvement in economic decision making within their households.
7.2 Status outside the Households The status outside the household was assessed through indicators related to participation in community institutions. Indicators which are used for assessing the impacts includes participation in community organizations, holding decision making positions in community organizations, ability to influence decision making in community institutions, membership of political parties, holding decision making positions in political bodies, participation in VDC / DDC meetings, and raising issues in meetings etc. Table 7.3 presents distribution of participants and non-participants by their participation in community institutions.

76
Table 7.3: Distribution of respondents by their participation in community institutions (Percent)
Responses
Participants . Non-
Participants Changes among
MEDEP’s Contribution
Now Before Now Before Participant Non-
participant
Membership in community institutions
71.4*** 37.0 55.7*** 36.6 34.4 19.1 15.2
Holding of decision making positions in community institutions
33.8*** 13.6 18.0*** 11.5 20.2 6.6 13.6
Ability to influence decisions taken at community institutions
48.1*** 20.7 26.8*** 16.4 27.4 10.4 17.0
Participation in community/ social works
72.8*** 49.0 58.5*** 44.8 23.8 13.7 10.1
Participation in political parties (Active members)
11.7*** 6.5 5.5*** 4.9 5.2 0.5 4.6
Holding of decision making positions in political parties
6.5** 4.1 2.7** 2.7 2.4 - 2.4
Participation in the VDC/Municipality/DDC meetings
17.7** 7.7 12.0** 7.1 10.0 4.9 5.1
Ability to raise voices in VDC/DDC meeting
21.6** 8.2 14.2** 8.2 13.5 6.0 7.5
*** Significant at 1%; ** Significant at 5% As seen in the above Table, status of both the participants and non-participants participation in community institutions has increased with higher changes among participants compared to non-participants. As a result of this, MEDEP contribution was positive against all the indicators. MEDEP contribution was relatively high on building or strengthening ability to influence decisions taken at community institutions followed by Membership in community institutions and holding of decision making positions in community institutions. Before MEDEP intervention 37.0% of participants HHs were members in community institutions which has now increased to 71.4%, and comparison with non-participants shows a net difference of 15.2%. Change among the non-participants is also positive but at a much lower rate. Before MEDEP intervention 13.6% of participants HHs were holding decision making positions in community organizations which has now increased to 33.8% with net impact of 13.6%. In terms of ability to influence decisions taken in community institutions before intervention 20.7% of participants HHs were involved which has now increased to 48.1%, with net MEDEP impact of 17.0% when compared with non-participants. In case of participation in community/social work, before intervention 49% of participants HHs were involved which has now increased to 72.8%, with MEDEP net impact of 10.1%. Similarly, before MEDEP intervention 6.5% of participants HHs were active members of political parties which have now increased to 11.7% with MEDEP net impact of 4.6%. In terms of holding decision making positions in political parties, before MEDEP intervention 4.1% of participants HHs were involved which has now increased to 6.5% with net impact of 2.4%. Before MEDEP intervention 7.7% of participant HHs participated in VDC/Municipality/DDC meetings which have now increased to 17.7% with net impact of 5.1%. In case of ability to raise voice in VDC/DDC/Municipality meeting, before MEDEP intervention 8.2% of participants HHs were involved which has now increased to 21.6% with net impact of 7.5%. Statistical tests of significance on all the indicators used to assess the participation in community institutions show significant impact.

77
7.3 Empowerment Empowerment is a term that has different connotations in different socio-cultural and political contexts and is shaped by beliefs and value systems. It is a value-laden term and the consequence of value-laden processes (e.g. participation, demanding and realizing rights). It is both a process and outcome of participation. It is about people-both women and men-taking control over their lives; setting their own agendas; gaining skills; building self confidence, solving problems and developing self reliance. For the purpose of this study, empowerment is defined as increased opportunity for women and men to control their lives, and it is assessed from three dimensions, economic, social and political. Economic empowerment is assessed through women’s ownership of assets. Social empowerment is considered through access to community organizations and institutions. Political empowerment judged by whether there have been group/community actions against offences at public places, and whether there is increased capacity to raise voices against gender violence and discrimination. Since the best people to assess empowerment are the people who are sought to be influenced, the data and information presented in this section come from the participants and non-participants themselves. The purpose of this chapter is to assess the extent to which MEDEP, as a targeted poverty reduction programme, has contributed to reduce powerlessness and increase opportunity for participants to influence and improve their own lives. 7.3.1 Economic empowerment Economic empowerment has been assessed in terms of ownership of assets in the name of participants especially related to land, house, bank balance/saving and investment in share and equity of groups and cooperatives. Table 7.4 presents distribution of participants and non-participants by their ownership of assets which include land, house, bank balance/saving and share/equity..
Table 7.4: Distribution of respondents by their ownership of assets (Percent)
Responses
A. Participants B. Non-Participants Changes among MEDEP
Contribution Now Before Now Before Participant Non-
participant
Land 28.5# 22.8 25.1# 19.7 5.6 5.5 0.2
House 27.4# 21.9 24.6# 20.8 5.5 3.8 1.7
Saving in group/ Bank balance/
39.2*** 21.6 24.0*** 16.9 17.5 7.1 10.4
Share/Equity 36.1*** 19.2 9.3*** 7.7 16.8 1.6 15.2
*** Significant at 1%; # Insignificant
As seen in the above table, before MEDEP intervention less than 22.8% participant HHs owned land which has now increased to 28.5% with net MEDEP contribution of 0.2%. The proportion of non-participants owing land has also increased by 5.5% but is slightly lower than that of participants. Likewise, before MEDEP intervention less than 21.9% participant HHs owned a house which has now increased to 27.4%.While the increases among participants are higher for both land and houses compared to the control group, statistical analysis shows the net impact to be insignificant for both parameters. This suggests that it is very difficult to generalize confidently that MEDEP participants are more likely to own houses and have more land than non-participants, though there is definite evidence of participants themselves improving land and housing assets over time. Nevertheless, MEDEP contribution is high on investment especially related to sharing/equity (15.2%) and saving or increase bank/balance and saving among participations.
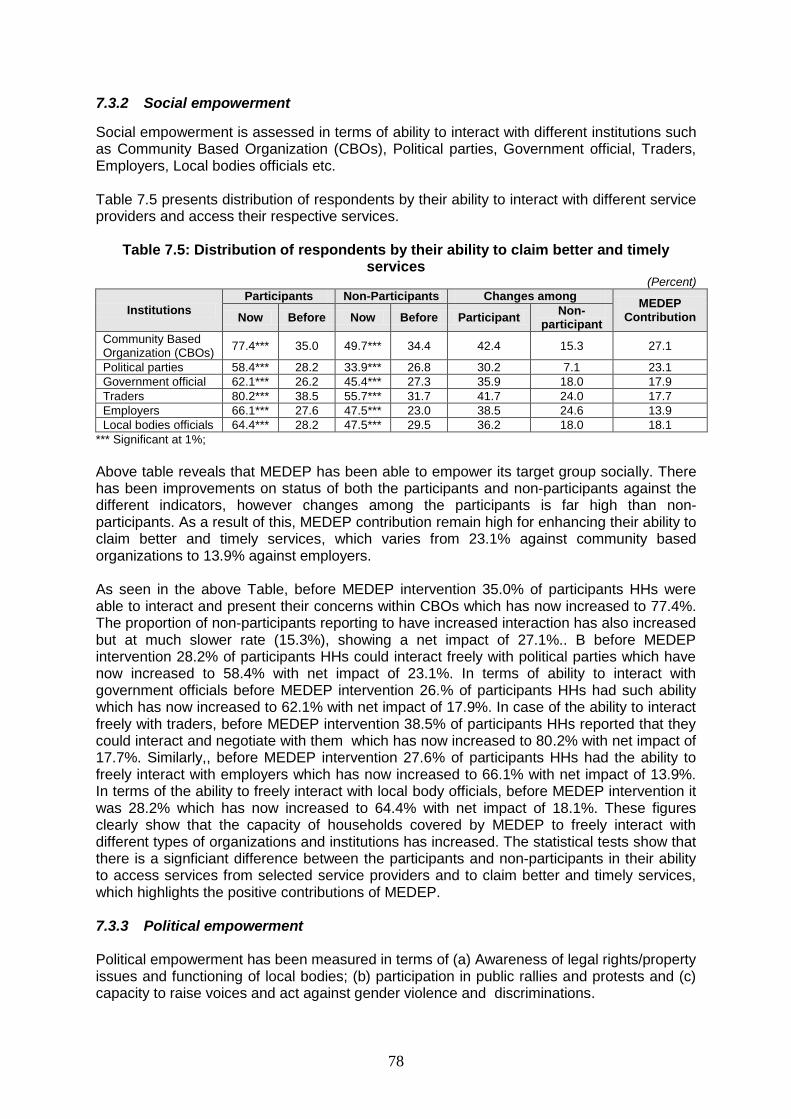
78
7.3.2 Social empowerment
Social empowerment is assessed in terms of ability to interact with different institutions such as Community Based Organization (CBOs), Political parties, Government official, Traders, Employers, Local bodies officials etc. Table 7.5 presents distribution of respondents by their ability to interact with different service providers and access their respective services.
Table 7.5: Distribution of respondents by their ability to claim better and timely services
(Percent)
Institutions
Participants Non-Participants Changes among MEDEP
Contribution Now Before Now Before Participant Non-
participant
Community Based Organization (CBOs)
77.4*** 35.0 49.7*** 34.4 42.4 15.3 27.1
Political parties 58.4*** 28.2 33.9*** 26.8 30.2 7.1 23.1
Government official 62.1*** 26.2 45.4*** 27.3 35.9 18.0 17.9
Traders 80.2*** 38.5 55.7*** 31.7 41.7 24.0 17.7
Employers 66.1*** 27.6 47.5*** 23.0 38.5 24.6 13.9
Local bodies officials 64.4*** 28.2 47.5*** 29.5 36.2 18.0 18.1
*** Significant at 1%;
Above table reveals that MEDEP has been able to empower its target group socially. There has been improvements on status of both the participants and non-participants against the different indicators, however changes among the participants is far high than non-participants. As a result of this, MEDEP contribution remain high for enhancing their ability to claim better and timely services, which varies from 23.1% against community based organizations to 13.9% against employers. As seen in the above Table, before MEDEP intervention 35.0% of participants HHs were able to interact and present their concerns within CBOs which has now increased to 77.4%. The proportion of non-participants reporting to have increased interaction has also increased but at much slower rate (15.3%), showing a net impact of 27.1%.. B before MEDEP intervention 28.2% of participants HHs could interact freely with political parties which have now increased to 58.4% with net impact of 23.1%. In terms of ability to interact with government officials before MEDEP intervention 26.% of participants HHs had such ability which has now increased to 62.1% with net impact of 17.9%. In case of the ability to interact freely with traders, before MEDEP intervention 38.5% of participants HHs reported that they could interact and negotiate with them which has now increased to 80.2% with net impact of 17.7%. Similarly,, before MEDEP intervention 27.6% of participants HHs had the ability to freely interact with employers which has now increased to 66.1% with net impact of 13.9%. In terms of the ability to freely interact with local body officials, before MEDEP intervention it was 28.2% which has now increased to 64.4% with net impact of 18.1%. These figures clearly show that the capacity of households covered by MEDEP to freely interact with different types of organizations and institutions has increased. The statistical tests show that there is a signficiant difference between the participants and non-participants in their ability to access services from selected service providers and to claim better and timely services, which highlights the positive contributions of MEDEP. 7.3.3 Political empowerment Political empowerment has been measured in terms of (a) Awareness of legal rights/property issues and functioning of local bodies; (b) participation in public rallies and protests and (c) capacity to raise voices and act against gender violence and discriminations.

79
Respondents (participants and non-participants) were asked to assess their awareness of (a) legal rights and property issues and (b) functioning of local bodies. Table 7.6 shows distribution of respondents by their awareness on these parameters.
Table 7.6: Awareness of legal rights/property issues and functioning of local bodies (Percent)
Responses
A. Participants B. Non-
Participants Changes among
MEDEP Contribution
Now Before Now Before Participant Non-
participant
Awareness on legal rights/property
44.6*** 13.5 23.5*** 16.4 31.1 7.1 24.0
Awareness on functioning of local bodies
34.6*** 10.6 19.7*** 14.2 24.0 5.5 18.6
*** Significant at 1%;
MEDEP’s contribution remains high on bringing awareness on legal/property rights and functioning of local bodies. Data show that before MEDEP intervention 13.5% participants HHs were aware on legal rights/property issues which have now increased to 44.6% with net difference between two groups remaining at 31.1%. Proportion of non-participants reporting to be aware on legal rights/property have increased but at much slower rate (7.1%). Likewise, before MEDEP intervention 10.6% participants were aware about the functioning of local bodies which have now increased to 34.6%, with non-participants comparisons showing a net difference of 18.6%. The differences between the two groups are statistically significant.
Another indicator was whether there have been any group/community actions taken against offences at public places. Respondents were also asked if they feel they are now more able to participate in rallies and protests than before to assess the extent of political empowerment. Table 7.7 presents distribution of participants and non-participants by their participation in rallies and protests against public offences. Table 7.7: Distribution of respondents by their participation in public rallies/protests
(Percent)
Responses
A. Participants B. Non-
Participants Changes among
MEDEP Contribution
Now Before Now Before Participant Non-
participant
Against mis-behave of local Community/elite people
28.8*** 18.8 10.9*** 8.2 10.1 2.7 7.4
Against community discrimination
18.4*** 12.4 9.8*** 7.1 6.0 2.7 3.3
*** Significant at 1%;
As seen in the above Table, before MEDEP intervention 18.8% of participants HHs participated in public protest related to public offences such as drinking alcohol and gambling in public places which has now increased to 28.8% with net difference of 10.1%. The proportion of non-participants reporting to have participated in such types of rallies has also increased but it was much less (2.7%). Likewise, before MEDEP intervention 12.4% of participant HHs participated in protest against community discriminations such as untouchability, inter caste marriage, multiple marriages and stopping dalits from entering temples which has now increased to 18.4% with net difference of 3.3%. Statistically, the difference between MEDEP participants and non participants is significant, thus showing MEDEP’s positive impact.

80
A third parameter assessed was the capacity to raise voices against gender violence and discriminations. Table 7.8 presents distribution of participants and non-participants by their capacity to raise voice and act against gender violence and discriminations.
Table 7.8: Capacity to Act against gender violence and discrimination (Percent)
Responses
Participants Non-
Participants Changes among
MEDEP Contribution
Now Before Now Before Participant Non-
participant
Against men hurting spouse
25.8*** 16.6 9.8*** 7.7 9.3 2.2 7.1
Against men leaving or attempting to divorcing spouse
24.0*** 15.7 9.8*** 7.7 8.3 2.2 6.1
*** Significant at 1%;
Before MEDEP intervention 16.6% of participant HHs participated in public protest related to public offences such as drinking alcohol and gambling in public places; this has now increased to 25.8%. Compared with non participants, there is a net difference of 7.1% owing to MEDEP. Proportion of non-participants reporting to have ability to raise voices and act against gender violence has also increased but it was much less (2.2%). Likewise, before MEDEP intervention 15.7% participants HHs reported that they have taken actions against men who attempted to leave or divorce their wife to marry other girls who has now increased to 24% with net difference of 2.2% between participants and non-participants. Statistically, the difference between MEDEP participants and non-participants is significant in terms of ability to raise voice and act against gender violence and discriminations.

81
8 CONTRIBUTION TO GENDER EQUALITY AND SOCIAL INCLUSION
Gender equality and social inclusion have been recognized as critical to equitable development in Nepal by the Government of Nepal (GoN) and its development partners. This chapter assesses contributions of MEDEP in terms of gender equality and social inclusion. Towards this end, MEDEP’s second phase document contains some indicators:
Of its total target to develop 17,500 micro-entrepreneurs, at least 70% (12,200)17 will be from among women, poor and excluded.
In terms of staffing, MEDEP required at least two key decision making positions in the BDSPOs to be occupied by women and men from excluded caste/ethnic/religious group for voice, influence and agency.
MEDEP’s responsiveness to Nepal’s contemporary gender equality and social inclusion issues is substantive. Its efforts to assist a large number of women to identify their latent entrepreneur skills and provide them necessary entrepreneurial skills appear quite positive. MEDEP has hundreds of stories of successful women entrepreneurs who have graduated out of poverty through MEDEP’s intervention. The first story presented here, in Box 8.1 is that of a model entrepreneur, Muna Mandal (a Terai caste women), from Dhanusha district who succeeded to live a respectable life within three years of start of Bangle enterprise by investing just Rs. 800(less than 15 US$).
Box 8.1: Muna Mandal moves out of poverty within 3 years
The “lakhoti” bangle maker, Muna Mandal of Mahuwa VDC of Dhanusha district started the business with a small amount of Rs 800 3 years ago. Now she makes a monthly profit of Rs. 5,000 to Rs 8,000. Recently during Teej (women’s fasting festival) , she earned Rs 25,000 within just ten days. Some women living in the USA have placed orderswith her for this work. This has increased her self-confidence for expanding her business in a professional way. Her husband is sick due to an accident when he fell from the roof and injured his head. Since then, he is incapable of earning now. But Muna earns an income for her family to live comfortably; after meeting the expenses of education for her three children, she has bought agricultural land and constructed part of her house . She hires labor to cultivate their land, so has also created agricultural employment in addition to working in her own
enterprise. Muna’s case is just one example which illustrates how MEDEP has been successful in helping poor and excluded women transform into economic agents by bringing them out from their traditional reproductive roles. Needless to emphasize here that, in Nepal, underemployment rate for women is much higher than men although it is a little lower for women than for men. The lack of access/control over productive resources/assets, mainly of landed property and credit, have deprived women and excluded people from gainful employment opportunities. As part of its objectives of gender equality and social inclusion, MEDEP has set targets for enterprise development among women, poor and excluded. It has also been providing gender sensitization training to staff of BDSPOs, EDFs, MErs and has often included a one day gender sensitization training attached with the TOEE/TOGE. Prior to assessing MEDEP’s contribution to gender equality and social inclusion, the following briefly defines gender equality and social inclusion. Gender Equality and Empowerment: Gender inequalities operate on several levels—within households and in communities, markets and government institutions—and in virtually all spheres of social, economic and political activity. Gender equality means that women and
17
MTR/MEDEP. This target was later revised to 60%.
82
men have equal conditions for realizing their full human rights and for contributing to, and benefiting from, economic, social, cultural and political development. The UN Millennium Project has suggested that gender equality encompasses three interrelated and mutually reinforcing dimensions:
access to resources and opportunities (including access to economic assets, such as land and infrastructure; resources, such as income and employment; and political opportunities such as representation in political bodies);
(capabilities (including basic human abilities related to education, health, and nutrition); and
Security (including reduced vulnerability to violence and conflict). Together, they contribute to women’s individual well-being and enable women and girls to make strategic choices and decisions—that is, to be empowered. Social Inclusion: Social exclusion refers to discrimination against certain categories of people on the basis of their ethnicity, race, sexual orientation, gender, disability etc, Exclusion denies some people the same rights and opportunities as are afforded to others in their society, simply because of who they are. By contrast, social inclusion is both a means and an end by which people who are systematically disadvantaged get the same or more opportunities as available to others to increase their income and escape from poverty. In simple terms, social inclusion is a process of removing institutional barriers and the enhancement of incentives to increase access by diverse individuals and groups to development opportunities. MEDEP’s contribution to gender and social inclusion (GESI) has been assessed within Livelihoods and social inclusion (LSI) framework which is comprised of the following three domains of change:
access to livelihood assets and services;
the ability of poor and excluded to exercise voice, influence and agency; and
the “rules of game” which refer to the policies and institutions which mediate and regulate people’s participation in the life of the state as well as their access to livelihood opportunities policies.
In this study, gender equality implies on equality between women and men, between dalits and non-dalits, between ethnic and other caste groups about
Equality in legal provisions, ownership of productive assets , e.g. land
Equality in participation of women and men in organized groups, such as, community based organizations, public services, local bodies
Equality in important household decisions, regarding buying/selling of land, education and health of children, etc.
Decision making by women in public space and matters, such as, VDC, Community Forestry Users Groups meetings, etc
Equality in market mobility for women and men
In order to achieve gender equality, the following indicators at the level of individual attitude and behavior were assessed:
Obtaining equal access to and control over productive resources by women, dalits and other discriminated section of the communities
Equality in participation of women and men (dalits, etc) in development decisions (planning, implementation, monitoring , evaluation all stages)
Equal voice of women and men, dalits and non-dalits, etc on claiming rights to services, legal provisions, assets, etc

83
Before assessing impact of MEDEP on gender equality and empowerment, the following figures show MEDEP’s impressive coverage in terms of development of micro-entrepreneurs by gender and ethnicity/caste and sample coverage with detail data in Table 8.1.
Table 8.1 Number of entrepreneurs by gender and ethnicity
Ethnicity/ caste Phase I Phase II Grand Total
Men Women Men Women Men Women Total
BCTS 1126 1299 1797 4045 2923 5344 8267
Dalit 440 282 1001 2326 1441 2608 4049
Janajati 802 946 1651 5207 2453 6153 8606
Others 194 174 416 562 610 736 1346
Total 2562 2701 4865 12140 7427 14841 22268
Source: MEDEP, August 2010
Above table shows MEDEP has developed over 22.268 entrepreneurs comprising of 7427 male and 14841 female. These figures illustrate that MEDEP has been successful to overcome several institutional, social and economic barriers and constraints in enhancing opportunities for disadvantaged women and socially excluded people to participate economic opportunities due to micro-enterprise development. The coverage of women and men is given in Figure 8.1.
Figure 8.1: MEDEP’s coverage by gender, in percent
Men, 33.3
Women, 66.7
By the end of Phase 2, MEDEP had covered a total of 22, 268 entrepreneurs, of which 66.5% were women. MEDEP’s coverage by ethnicity and caste is given in Figure 8.2.

84
Figure 8.2: MEDEP’s Coverage by ethnicity/caste
BCTS, 37.1 Others, 6.0
Janajati, 38.6 Dalit, 18.2
The figure shows that 38.6% were from Janajati, followed by BCTS (37.1%), Dalit (18.2) and others (6.0%). With this coverage, MEDEP’s GESI impact is now assessed on three aspects: ownership to productive resources and opportunities, participation in community/public institutions and improvements in capability.
8.1 Ownership/Entitlement to Productive Resources The ownership to productive resources is assessed through access to assets and resources at the household level, position of the woman in the household as an important income earner, decision making roles in households and access to services. 8.1.1 Access to assets/resources (HHs) Table 8.2 below shows MEDEP’s contribution on enhancing ownership of assets by gender and ethnicity with details in Annexure 8.1.
Table 8.2: MEDEP’s contribution on enhancing ownership of assets by respondent category
(Percent)
Assets Gender Caste/Ethnicity
Women Men BCTS Dalit Janajati Others
Land 0.7 (2.4) 0.9 0.5 1.3 (4.3)
House 1.4 1.2 1.3 2.0 1.0 3.1
Bank balance/Saving 11.7 7.3 5.3 17.2 12.3 5.5
Share/Equity 16.7 12.2 15.0 16.7 16.0 1.7
As seen from the Annexure 8.1, ownership of assets of the participants and non-participations has increased irrespective of gender and caste. However, rate of changes is quite high among the participants belong to different categories that that of non-participants, except for few exceptions. As a result of this, MEDEP contribution was positive for enhancing ownership of assets by gender and caste. However extent of contribution varies with the type of assets. Small contribution were observed among the land and houses irrespective of gender and caste while the contribution remain much higher for enhancing bank balance and investment on share and equity. However, contribution of MEDEP varies by gender and caste.

85
The data in above table show that the MEDEP contribution on enhancing ownership of assets in all assets considered in this study, namely land, house, bank balance/saving and holding share/equity in cooperatives is high among women compared to men. Of the different assets, contribution on investment of share/equity was much higher followed by bank balance/saving, house ownership and land. This could be because many women became members/shareholders of MEDEP promoted enterprises formed as companies or cooperatives and the share ownership probably reflects their participation in these group enterprises. This suggests MEDEP’s substantial contribution towards improvements in gender equality and empowerment. Among the ethnic groups, difference was markedly higher in bank balance/saving and equity for Dalit than other caste groups. 8.1.2 Reorganization as the income earner The respondents were asked about their perceptions about the recognition as the income earner for the family. Table 8.3 shows the responses of of MEDEP participants and non-participants, by gender and ethnicity. Table 8.3: Distribution of respondents by their perception on recognition as income
earner of the family (Percent)
Responses
A. Participants B. Non-Participants Changes among MEDEP
contribution Now Before Now Before Participant Non-
participant
Overall 92.2* 81.1 81.4* 74.9 11.1 6.6 4.5
A. Gender
Women 90.3 75.9 78.9 75.4 14.3 3.5 10.8
Men 96.7 93.5 90.2 73.2 3.3 17.1 (13.8)
B. Caste/Ethnicity BCTS 93.9 82.1 88.6 90.9 11.8 (2.3) 14.1
Dalit 91.4 82.8 62.0 52.0 8.6 10.0 (1.4)
Janajati 92.7 79.0 88.7 80.6 13.7 8.1 5.6
Other 84.7 83.1 88.9 77.8 1.7 11.1 (9.4)
Note: * significant at 1% level of significance
The data show that perception of both participants and non-participants as important income earner has increased, and the increase among participants was higher than non-participants. Data further showed that 14 percent MEDEP participant women members perceived that their status within HHs as economic agent/income earner has increased as compared to men (3.3%). Among ethnicity, highest increase in the perception as important income earner was perceived by Janjatis (13.7%) followed by BCTS (11.8%), Dalit (8.6%) and other TC (1.7%). Of these, proportions of non-participant Dalit and other Terai castes were higher than respective participants. This could probably indicate greater social barriers for Dalit and Terai caste women compared to those for Janajati and BCTS women. 8.1.3 Decisions making roles This section assesses decision making roles of women and men participants for decisions related to household management and economic decisions. (a) Households decisions Table 8.4 below shows contribution made by MEDEP’s on empowering its target group with related to decision making of household activities by gender and ethnicity with detail data in Annexure 8.2.

86
Table 8.4: Contribution of MEDEP’s to decision making about household activities by gender and ethnicity
(Percent)
Decision areas Gender Caste/Ethnicity
Women Men BCTS Dalit Janajati Others
Grocery purchases 9.1 (1.2) 8.3 5.1 9.6 (11.1)
Clothing 11.2 2.8 13.2 5.1 8.7 -
Repair house 4.2 (1.6) 6.3 3.0 2.7 (7.4)
Leasing land and property 1.2 4.3 5.9 3.0 2.1 (3.7)
As seen from the Annexure 8.2, participation on household’s decision making of the participants and non-participations has increased irrespective of gender and caste. However, rate of changes is quite high among the participants belong to different categories that that of non-participants, apart from for few exceptions. The contribution of MEDEP appears negative among men and other terai caste among few indicators, which reveals that contribution of other factors is quite high resulting negative contribution of MEDEP. Nevertheless, MEDEP contribution was positive for all the indicators among women while negative contribution was observed among grocery purchase and repairing of houses against men. This shows mix contribution of MEDEP on enhancing decision making at the HHs level. MEDEP contribution remains positive against all the indicators among the ethnic/caste group except for other terai caste group, which shows negative results. There is a remarkable contribution of MEDEP on taking decisions of clothing irrespective of caste and gender. As seen in the above table, MEDEP’s contribution among men and women on household decisions making, namely procurement of groceries, clothing, house repair and leasing of land and other property, remain positive in all areas. However contribution of MEDEP was negative on leasing land and other property. Even on these indicators, the contribution of MEDEP was higher among women participants than men. Of the different decisions, contribution on clothing and groceries was much higher compared to repair house and leasing land. This possibly indicates that women find it easier to take on the household related roles first, whereas the property related ones, such as house repair and land lease continue to be perceived as male domains and get transferred to women very slowly. Among the ethnic groups, survey findings showed mixed contribution with BCTS and Janajati having higher contribution. Highest contribution of MEDEP in decision related to ‘groceries purchase’ was observed among Janajati (9.6%) followed by BCTS (8.3%). In case of decision related to clothing, the highest contribution was observed among BCTS (13.2%) followed by Janajati (8.7%). In case of decisions related to ‘repair of houses’ and ‘leasing of land’ highest contribution was seen in case of BCTS followed by Dalit and Janajati.
(b) Economic decisions
Table 8.5 illustrates contribution of MEDEP on economic decisions by gender and ethnicity with detailed data in Annexure 8.3. Table 8.5: MEDEP contribution to HHs economic decisions by respondent categories
(Percent)
Decision areas Gender Caste/Ethnicity
Women Men BCTS Dalit Janajati Others Accessing Loan 8.0 (2.8) 5.7 2.5 5.4 3.7
Utilization of loan amount 7.4 7.4 7.6 2.0 2.9 3.7
Saving in Group 11.5 (0.4) 2.9 6.1 13.3 -
Selection of IGAs/ enterprises 8.6 2.8 13.5 2.8 9.0 5.6
Utilization of Income 5.8 (3.7) 7.6 2.0 1.4 -
Inputs procurement 6.3 (2.8) 5.3 1.5 5.7 (3.7)
Selling of products and services 9.2 (2.0) 8.5 2.5 7.2 -

87
As seen from the Annexure 8.3, participation of both the participants and non-participations on households’ economic decision has increased irrespective of gender and caste. However, rate of changes is quite high among the participants belong to different categories that that of non-participants, except for few exceptions, especially among men and other terai caste. As a result of this, MEDEP contribution was positive for enhancing participation of the target groups on economic decisions of the households by gender and caste. However extent of contribution varies not only by decision area but also by caste and gender. Nevertheless, women are more empowered compared to men.
The data above show that the contribution of MEDEP on women’s involvement in economic decisions such as accessing loans, utilization of loan amount, selection of enterprises etc, is higher among women compared to men in all areas except when there was an equal contribution on involvement in utilization of loan amount. Of the different types of decisions where the net difference between participants and non-participant women were high, the highest contribution of MEDEP was found for saving in groups followed by selling of products and services, selection of IGAs/enterprises and accessing credits/loans. Among the ethnic groups, survey findings showed positive results across all ethnic/caste groups, the MEDEP contribution remaining highest among BCTS and other terai caste for selection of IGAs and saving in groups for Dalit and Janajati.
8.1.4 Access to public services and resources
Table 8.6 illustrates contribution of MEDEP on accessing public services and resources by gender and ethnicity with detailed data in Annexure 8.4.
Table 8.6: Contribution of MEDEP to access to public services and resources by gender and ethnicity
(Percent)
Responses Gender Caste/Ethnicity
Women Men BCTS Dalit Janajati Others Marketing infrastructures 19.0 2.4 26.4 17.3 14.5 (4.6)
Irrigation 7.3 (6.5) 20.2 10.3 (0.8) (0.8)
Road (Rural)/mobility 8.4 (7.3) 21.6 12.3 (0.8) (37.4)
Education 10.3 (7.3) 18.5 16.4 1.6 (34.0)
Community forests 11.3 (10.2) 18.2 12.8 0.1 (25.9)
Delivery of enterprise development and promotion services 7.1 (5.7) 16.9 14.4 (0.5) (29.8)
As seen from the Annexure 8.4, access to public services and resources of both the participants and non-participations has increased irrespective of gender and caste. However, rate of changes is quite high among the participants belong to different categories that that of non-participants, except for few exceptions, especially among men, other terai caste and Janajati. As a result of this, MEDEP contribution was positive for enhancing access to public services and resources among women while there exists mix results by caste and ethnicity. Nevertheless, contribution of MEDEP remains positive among Dalit and BCTS against all the indicators, but remain negative for few indicators among Janajati and others terai caste. Negative contribution of MEDEP reveals that the contribution of other factors is so high among these groups that the changes cannot be attributed for MEDEP.
As seen in the above table, contribution of MEDEP on access to all public services and resources remain high among women compared to men. Of the different services, contribution of MEDEP was observed highest among women for all the indicators while negative contribution was observed against all the indicators among men except for marketing infrastructure. Among the ethnic groups, survey findings showed positive contribution of MEDEP across all services and resources considered in this study for Dalit and BCTs together with marketing infrastructures among Janajati. Likewise, while BCTS and Dalit had positive contribution of MEDEP in access to services, the increases among BCTS were higher than Dalit.

88
8.2 Participation in Community/Public Institutions
This section includes assess the participation on public and community institutions in-terms of their (a) confidence to interact freely and participle in decisions (b) participation and holding of decision making positions in community/public institutions.
8.2.1 Confidence
Table 8.7 shows contribution of MEDEP on building capacity of respondents to interact freely and participate on discussions with various community and public institutions by gender and ethnicity with details in Annexure 8.5.
Table 8.7: Contribution of MEDEP to build confidence to interact freely and participate on discussions with various community and public institutions
(Percent)
Responses Gender Caste/Ethnicity
Women Men BCTS Dalit Janajati Others Community institutions 31.9 15.9 25.1 27.4 38.9 (17.5)
Political parties 26.1 15.0 23.8 19.3 29.9 0.8
Government service providers 18.2 19.1 21.7 21.3 21.0 (16.1)
Local bodies 18.0 21.1 22.0 20.3 23.8 (18.1)
As seen from the Annexure 8.5, confidence of both the participants and non-participants to interact freely and participate on discussions with community and public institutions has increased irrespective of gender and caste. However, rate of changes is quite high among participants belong to different caste and gender than that of non-participants, except among other terai caste. As a result of this, MEDEP contribution was positive for building confidence among the participations. However extent of contribution varies with by gender and caste. As seen in the above table, contribution of MEDEP in building confidence to interact with community institutions and political parties is positive among both men and women, but the contribution is larger among women than men. However, contribution of MEDEP was lowered among women in case of participation in government service providing agencies and local bodies (VDC/DDC meetings). This suggests that MEDEP has been able to increase opportunities for women to increase their access to community/public institutions, though links to official agencies continues to be easier for men. Likewise, contribution of MEDEP on improving access of Dalit and Janjatis to community institutions, political parties, government service providers and local bodies remain higher suggesting MEDEP’s positive contribution towards social inclusion as well. 8.2.2 Holding decision making positions Table 8.8 shows MEDEP contribution in improving access to control over resources, i.e. increasing representation on decision making positions in community and political parties by gender and ethnicity among participants and non-participants. Decision making positions refers to chairperson, vice chairpersons, secretary, treasurers, executive members of the community institutions and political parties.
Table 8.8: MEDEP’s contribution to increased representation in decision making positions in community/public institutions by gender and ethnicity
(Percent)
Responses Gender Caste/Ethnicity
Women Men BCTS Dalit Janajati Others
Holding of decision making positions in community institutions
12.7 17.1 10.8 12.6 20.0 (6.0)
Holding of decision making positions in political parties
0.7 7.3 6.3 (1.0) 2.1 1.7

89
As seen from the Annexure 8.6, representation of the participants and non-participants has increased on decision making of community institutions irrespective of gender and caste. However, rate of changes is quite high among the participants belong to different categories than that of non-participants, except few exceptions. As a result of this, MEDEP contribution was positive for improving control over resources by gender and caste. However extent of contribution varies with the gender and caste. The study data MEDEP contribution remain positive on MEDEP contribution remain positive on increasing representation on decision making positions in community/public institutions irrespective of gender and caste. However, negative contribution was observed among other terai caste in terms of their representation on decision making position of the community institutions. This reveals that contribution of other factors remain high among these group than that of MEDEP. Contribution of MEDEP on holding key decision making position and community institutions remain higher among men compared to women. Among ethnic/caste groups, contribution of MDEP on enhancing access to decision making position remain high among Janajati to decision making positions in both community institutions and political parties has increased followed by Dalit and BCTS while negative contribution was observed among other caste group. This suggests that the impact of MEDEP is generally encouraging from social inclusion dimension.
8.3 Improvements in Capability
Impact of MEDEP on improvements/increases in capability of women and disadvantaged groups like Dalit, ethnic groups and other Terai caste people haven assessed on the basis of following three indicators namely (a) Capacity to influence decisions at community/public institutions; (b) Capacity to act against gender violence and social discriminations and (c) Capacity to understand and use their rights. 8.3.1 Capacity to influence decisions at community/public institutions Table 8.9 below shows difference in the ability of women and men to claim for better and timely services and put their voices in community/public institutions by gender and ethnicity among participants and non-participants with detail data in Annexure 8.3.
Table 8.9: MEDEP contribution to build capacity to influence decisions of community
institutions by gender and ethnicity (Percent)
Responses Gender Caste/Ethnicity
Women Men BCTS Dalit Janajati Others
Capacity to influence decisions in the community institutions
17.4 16.3 15.6 16.2 26.7 (17.1)
Participation/representation in community/ social works
11.7 7.7 10.8 7.2 27.5 (37.4)
Capacity to influence decisions made at local bodies (VDCs)
6.8 9.3 8.2 6.1 11.9 (11.1)
As seen from the Annexure 8.7, capacity to influence decision of community institutions of the participants and non-participants has increased irrespective of gender and caste. However, rate of changes is quite high among the participants belong to different categories that that of non-participants, except for other terai caste. As a result of this, MEDEP contribution was positive for building capacity to influence decisions of community institutions. Higher contribution of MEDEP was observed in case of capacity to influence decisions in the community institutions followed by participation/representation in community/ social works an d Capacity to influence decisions made at local bodies (VDCs) irrespective of caste and gender. However extent of contribution varies with the respondent categories.

90
The data show that MEDEP contributed to build capacity of both the men and women to claim better and timely services and raise their voices in community/public institutions. While increase in the capacity of was larger among women than men except on capacity to influence decisions made at the VDCs. This suggests that in general, operation of micro-enterprises and in particular participation in MEDEP has increased capacity of women participants to interact and demand better and timely services from the community/public institutions. Among ethic/caste groups, a higher contribution was observed among of Janajati followed perceived to have increased their capacity to interact with all types of community/public institutions. However, Dalit ranked second after Janjatis for community based organizations. Contribution of MEDEP was higher among BCTS for representation on community/work and capacity to influence decisions made at local bodies. However, MEDEP’s contribution appears negative for all the indicators among other terai caste. This is mainly because proportion of change in participants lower than non-participants across all indicators. Hence, contribution of other factors remains high among the other terai caste than MEDEP. Nevertheless, MEDEP has contributed positively for increasing capacity of participants to demand services from local government organizations. 8.3.2 Capacity to act against gender violence and social discriminations Table 8.10 below shows differences in the capacity to raise voices and act against gender violence such as wife-beating, leaving wife/divorcing to marry another girl (multiple marriages) and social discrimination such as, forbidding Dalit to enter temples and untouchability issues etc. More detailed data is presented in Annexure 8.8.
Table 8.9: MEDEP’s contribution to take action against gender violence and social discrimination
(Percent)
Responses Gender Caste/Ethnicity
Women Men BCTS Dalit Janajati Others Against beating spouse 9.9 (1.2) 10.8 6.0 8.2 (5.7)
Against a man leaving/ or attempting to divorce spouse
8.9 (2.0) 8.7 6.0 7.2 (5.7)
Against social discriminations
4.9 (2.0) 3.4 6.1 3.7 (5.7)
Capacity to raise voices against low wage/unequal wage for men and women for work of equal value
15.5 (4.9) 19.4 12.2 4.9 1.3
As seen from the Annexure 8.8, capacity of both the participants and non-participants has increased irrespective of gender and caste to take actions against gender and violence and social discrimination irrespective of caste and gender. However, rate of changes is quite high among the participants belong to different categories than that of non-participants with few exceptions lies with men and other terai caste. Negative results appear among men and other terai caste because high proportion of changes was observed among non-participants compared to participants belonging to these groups. As a result of this, negative contribution of MEDEP shows has been observed but this does not mean that gender and social discrimination among this group has increased. Nevertheless, larger contribution of MEDEP has been observed among women, BCTS, Janajati and Dalit to organize and protest against gender violence and social discrimination than non-participants and men. As seen from the data presented above, a larger contribution of MEDEP has been observed among women for increasing their capacity to organize and protest against domestic violence and social discrimination than men. Of these, the largest increase was observed in their capacity to raise voices and claim equal pay against low wage/unequal wage rate for men and women for work of equal value. This was followed by protesting against wife-

91
beating wife), leaving wife and lastly against social discriminations. The MEDEP contribution was positive among all ethnic/caste groups for all areas except Other Terai castes. Contribution of MEDEP remain high on BCTS followed by Dalit, Janjatis and other caste groups reported to have increased capacity to raise voices against unequal wage rate among men and women compared to non-participants. This suggests that MEDEP’s impact with regard to enhancing capabilities of participants to raise voices against is positive. 8.3.3 Capacity to understand and utilize rights Table 8.11 below shows difference in the capacity of participants and non-participants to understand and use their rights.
Table 8.11: Capacity of respondents to understand and use their rights (Percent)
Responses
Participants Non-Participants Changes among MEDEP
contribution Now Before Now Before Participant Non-
participant
Overall 94.7* 88.6 90.2* 84.7 6.1 5.5 0.7
Gender
Women 94.0 86.2 89.4 85.2 7.8 4.2 3.6
Men 96.3 94.3 92.7 82.9 2.0 9.8 (7.7)
Caste/Ethnicity
BCTS 96.7 89.4 97.7 97.7 7.3 - 7.3
Dalit 95.5 87.4 72.0 68.0 8.1 4.0 4.1
Janajati 93.9 88.8 95.2 85.5 5.2 9.7 (4.5)
Other TC 88.1 88.1 100.0 92.6 0.0 7.4 (7.4)
Note: * significant at 5% level of significance
The data in the above table show that the proportion of both participants and non-participants who are aware of their rights and have the capacity to use them appropriately has increased but the increase among participants was higher than non-participants. Data further showed that more of men participants (96.3%) were aware of their rights than women (94.0). Among ethnic categories, the highest contribution on the awareness of rights was among BCTS (7.3%) followed by Dalit (4.2%) while negative contribution was observed among Janajati and other terai caste. Despite of increase in awareness level of both men and women participations MEDEP contribution remains positive among women while it is negative among men. The highest increase in awareness has been among the most excluded category, the Dalit, showing positive inclusive impacts.
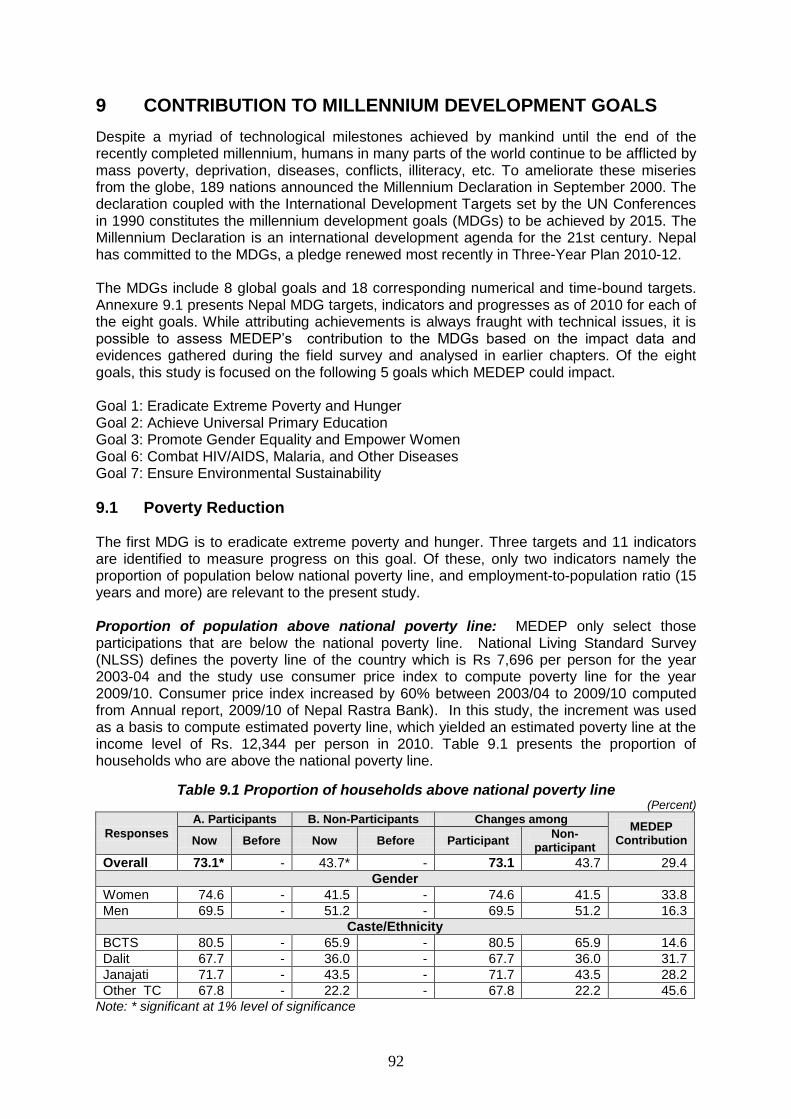
92
9 CONTRIBUTION TO MILLENNIUM DEVELOPMENT GOALS
Despite a myriad of technological milestones achieved by mankind until the end of the recently completed millennium, humans in many parts of the world continue to be afflicted by mass poverty, deprivation, diseases, conflicts, illiteracy, etc. To ameliorate these miseries from the globe, 189 nations announced the Millennium Declaration in September 2000. The declaration coupled with the International Development Targets set by the UN Conferences in 1990 constitutes the millennium development goals (MDGs) to be achieved by 2015. The Millennium Declaration is an international development agenda for the 21st century. Nepal has committed to the MDGs, a pledge renewed most recently in Three-Year Plan 2010-12. The MDGs include 8 global goals and 18 corresponding numerical and time-bound targets. Annexure 9.1 presents Nepal MDG targets, indicators and progresses as of 2010 for each of the eight goals. While attributing achievements is always fraught with technical issues, it is possible to assess MEDEP’s contribution to the MDGs based on the impact data and evidences gathered during the field survey and analysed in earlier chapters. Of the eight goals, this study is focused on the following 5 goals which MEDEP could impact. Goal 1: Eradicate Extreme Poverty and Hunger Goal 2: Achieve Universal Primary Education Goal 3: Promote Gender Equality and Empower Women Goal 6: Combat HIV/AIDS, Malaria, and Other Diseases Goal 7: Ensure Environmental Sustainability
9.1 Poverty Reduction The first MDG is to eradicate extreme poverty and hunger. Three targets and 11 indicators are identified to measure progress on this goal. Of these, only two indicators namely the proportion of population below national poverty line, and employment-to-population ratio (15 years and more) are relevant to the present study. Proportion of population above national poverty line: MEDEP only select those participations that are below the national poverty line. National Living Standard Survey (NLSS) defines the poverty line of the country which is Rs 7,696 per person for the year 2003-04 and the study use consumer price index to compute poverty line for the year 2009/10. Consumer price index increased by 60% between 2003/04 to 2009/10 computed from Annual report, 2009/10 of Nepal Rastra Bank). In this study, the increment was used as a basis to compute estimated poverty line, which yielded an estimated poverty line at the income level of Rs. 12,344 per person in 2010. Table 9.1 presents the proportion of households who are above the national poverty line.
Table 9.1 Proportion of households above national poverty line (Percent)
Responses
A. Participants B. Non-Participants Changes among MEDEP
Contribution Now Before Now Before Participant Non-
participant
Overall 73.1* - 43.7* - 73.1 43.7 29.4
Gender
Women 74.6 - 41.5 - 74.6 41.5 33.8
Men 69.5 - 51.2 - 69.5 51.2 16.3
Caste/Ethnicity BCTS 80.5 - 65.9 - 80.5 65.9 14.6
Dalit 67.7 - 36.0 - 67.7 36.0 31.7
Janajati 71.7 - 43.5 - 71.7 43.5 28.2
Other TC 67.8 - 22.2 - 67.8 22.2 45.6
Note: * significant at 1% level of significance

93
Nearly three fourth of the participants households have moved out of poverty (73.1%) while that of non-participants is 53.6%. This shows that MEDEP has contributed to poverty reduction by almost 30% among its beneficiaries. This is consistent with the contribution of the household income of participants by the micro-enterprise. The statistical tests of significance confirm that MEDEP has positively contributed to reduce poverty.
More than two third of participants belonging to different caste and gender have moved out of poverty while such proportion ranges between 22.2 to 65.9% among non-participants. Data show that a larger proportion of BCTS among both the participants and non-participants (80.5% and 65.9%) have moved out of poverty, as compared to other ethic/ caste groups. The contribution of MEDEP to poverty reduction is higher among women (33.8%) and Dalit (28.2%) and other terai castes (45.6%). Likewise, a larger percentage of women (74.6%) have moved out of poverty as compared to men (69.5%). This reveals that MEDEP has contributed substantially to economic empowerment of marginalized communities such as women, Dalit, Janajati and other Terai castes.
According to NLSS 2003-04, HHs use nearly two third of their incomes (64.5%) is needed for meeting food expenditure. Considering this, households are classified into three categories which include (a) very poor households who are only able to meet food expenses whose per-capita income is up to Rs 7,962 (b) poor includes those households whose income ranges between Rs 7,962 to poverty line, i.e. Rs. 12,344 and (c) non-poor households whose per capita income is above national poverty line income, i.e. more than Rs. 12,344. Figure 9.1 shows distribution of households by poverty status at present, and Table 9.2 presents the figures according to the three categories of very poor, poor and non-poor.
Figure 9.1 Distribution of households by poverty status at present
16.9
10.0
31.7
24.6
43.7
73.1
0.0
20.0
40.0
60.0
80.0
Very Poor Poor Non-poor
Perc
en
t
Participants Non-participants
Table 9.2: Per-capita income of the participants and non-participants households at present by poverty group
(Rs)
Respondent categories
Participant Non-participant
Very Poor
Poor Non-poor Very Poor Poor Non-poor
Overall 4,176 9867 34,577 3,560 10,212 20,300
Gender
Women 4,247 9,747 34,139 3,250 10,377 20,360
Men 4,052 10,163 35,695 5,247 9,701 20,131
Caste/Ethnicity
BCTS 4,083 10,222 36,710 3,278 10,601 20,592
Dalit 3,496 9,862 31,947 3,932 10,755 21,327
Janajati 4,641 9,696 34,184 3,466 9,965 18,795
Other 4,198 9,675 35,143 3,435 9,431 22,575

94
A majority of the households among both the participants and non-participants are non-poor at present. However, the proportion of the households falling under very poor and poor is relatively higher among non-participants compared to participants. Apart from this, there are large variations in per-capita income of the participants and non-participants at present by poverty groups (see Table 9.2). This shows that MEDEP has contributed positively to reduce poverty and hence to MDG 1. Employment-to-population ratio (15 years and more): Employment to population ratio is ratio of population of 15 years and above involved in agriculture and non-agriculture sector to the total population. Table 9.3 presents employment to population ratio among participants and non-participants respondents.
Table 9.3: Employment to population ratio (Percent)
Responses
A. Participants B. Non-Participants Changes among MEDEP
Contribution Now Before Now Before Participant Non-
participant
Overall 66.7 57.3 62.1 56.2 9.4 6.0 3.4
Gender
Women 69.6 59.3 61.1 56.6 10.3 4.5 5.7
Men 60.3 52.7 65.2 55.0 7.6 10.2 -2.6
Caste/Ethnicity BCTS 66.3 51.4 55.6 51.3 14.9 4.4 10.6
Dalit 67.5 61.6 73.7 67.9 5.9 5.8 0.1
Janajati 68.9 60.7 67.1 55.8 8.2 11.3 -3.1
Other 55.5 48.4 43.4 43.8 7.1 -0.5 7.5
Note: Statistical test result insignificant among participants and non-participants at present
The employment rate of both participants and non-participants in agriculture and non-agricultural sector has increased by 9.4% and 6% respectively with MEDEP contribution of 3.4%. This shows slight or small improvement in improving employment to population ratio. This has occurred mainly because a large majority of the participants has been operating enterprises as additional activity for diversifying their household livelihoods. Thus the enterprises have served to employ surplus labour in the households, but creation of additional full time employment opportunities for the family members or outsiders has been little. Employment to population ratio has increased among participants and non-participants across different ethnic/ caste groups and gender. Howeverthe percentage change is higher among participants compared to non-participants irrespective of ethnicity and gender. Likewise, MEDEP contribution is higher among women (5.7%), BCTS (10.1%) and other caste group (7.5%). This shows that MEDEP has contributed to increase full and productive employment, as also stated above.
9.2 Primary Education Goal 2 of MDGs aims to achieve universal primary education at all levels. The target of this indicator is to “ensure that, by 2015, children everywhere, boys and girls alike, will be able to complete a full course of primary schooling”. Of the three indicators for measuring this target, two indicators namely net enrollment rate in primary education, and literacy rate of 15-24 years old women and men, are relevant to the current study. Net enrollment rate in primary education: Net enrollment rate is ratio of the children attending primary school to primary school-age-going children. The Department of Education in Nepal has defined five to nine years of age as primary school going age. Table 9.4 presents net enrollment rate in primary education.

95
Table 9.4: Net enrollment Rate in Primary Education (Percent)
Responses
A. Participants B. Non-Participants Changes among MEDEP
Contribution Now Before Now Before Participant Non-
participant
Overall 97.2 95.7 95.7 97.8 1.5 -2.2 3.6
A. Gender
Women 96.7 96.2 97.7 98.1 0.4 -0.4 0.8
Men 98.5 94.4 89.7 97.1 4.1 -7.5 11.6
B. Caste/Ethnicity BCTS 98.3 97.3 100.0 97.0 1.0 3.0 -2.1
Dalit 98.3 91.9 88.9 100.0 6.4 -11.1 17.5
Janajati 96.7 95.5 100.0 98.0 1.2 2.0 -0.8
Other 98.1 96.2 90.9 95.8 1.9 -4.9 6.8
Note: Statistical test result insignificant among participants and non-participants at present
The data show that almost all primary school going age children of both the participants and non-participants (97.2% and 95.7% respectively) have been enrolled in school. However, there was a decline in proportion of the non-participant children enrollment in primarily education by 2.2% while increase in the primary school enrollment among children of participants by 1.5%. This reveals that participation in MEDEP has enabled people to send their primary school going age children to schools. The net enrollment rate in primary education has increased among participants irrespective of caste and gender while thea results among non-participants are mixed. However, it varies by gender and caste. Among the ethnic groups, highest proportion of contribution was observed among Dalit (17.5%) followed by other terai caste (6.8%). By gender, contribution of MEDEP intervention was high among men compared to women. Given that the increase in incomes of men entrepreneurs were much higher than those of women entrepreneurs, it is logical that the education impact in the former HHs is more than that in the latter. Literacy rate of 15–24 year olds, women and men: Literacy rate is ratio of the population who are able to read and write to the total population belonging to this age group. Table 9.5 presents literacy rate of the 15-24 years old, women and men.
Table 9.5 Literacy rate of the 15-24 years old women and men (Percent)
Responses
A. Participants B. Non-Participants Changes among MEDEP
Contribution Now Before Now Before Participant Non-
participant
Overall 97.2* 95.7 86.0* 76.9 1.5 9.1 -7.6
A. Gender
Women 96.7 96.2 88.4 76.4 0.4 12.0 -11.6
Men 98.5 94.4 78.6 77.6 4.1 1.0 3.1
B. Caste/Ethnicity
BCTS 98.3 97.3 92.3 88.9 1.0 3.4 -2.4
Dalit 98.3 91.9 77.4 59.6 6.4 17.8 -11.4
Janajati 96.7 95.5 93.3 87.7 1.2 5.6 -4.4
Other 98.1 96.2 75.0 68.8 1.9 6.3 -4.4
Note: * Significant at 1% level of significance
The literacy rate of the participants is 97.2% at present while that of non-participant is 86.0%. This shows that participants are more literate than non-participants. Likewise, statistical analysis shows that participants differ significantly than non-participants in terms of literacy at present. This shows that MEDEP has contributed towards improvements in the literacy status of the participants. This is one of the unintended positive benefits of MEDEP, which is primarily an enterprise promotion project. However, the percentage change of the

96
non-participants is higher than participants. This might be because of contribution of other factors such as increased access to government scholarships; access to educational facilities and non-formal educational services etc. The literacy rate of both participants and non-participants has increased irrespective of caste and gender. However, the percent change is quite high among non-participants compared to participants. This reveals that external factors have a greater impact on literacy and education than MEDEP interventions, which are primarily enterprise focused.
9.3 Gender Equality and Women Empowerment The issue of gender equality and empowerment, particularly issues of social exclusion and domestic violence, has already been discussed at length in Chapter 8. This section focuses on key indicators which are specifically part of the Nepal’s commitment to UN Summit (Annexure 9.1). Goal three of the MDGs is focused on eliminating gender disparity in primary and secondary education, preferably by 2005, and in all levels of education no later than 2015. Of the six indicators under this goal, five indicators are directly relevant to the present study. Ratio of girls to boys in primary education: Table 9.6 presents ratio of girls to boys in primary education, which covers Grades 1–5.
Table 9.6: Ratio of girls to boys in primary education
Responses
A. Participants B. Non-Participants % Changes among MEDEP
Contribution% Now Before Now Before Participant Non-
participant
Overall 0.99 0.94 0.94 0.92 5.3 2.2 3.1
A. Gender
Women 0.99 0.95 0.94 0.91 4.9 3.5 1.4
Men 0.98 0.93 0.95 0.95 6.3 -0.8 7.0
B. Caste/Ethnicity
BCTS 1.12 0.99 1.06 0.95 13.4 11.4 2.0
Dalit 0.95 0.91 0.89 0.85 4.3 5.3 -0.9
Janajati 0.96 0.95 0.91 0.93 1.1 -1.8 2.9
Other 0.93 0.87 0.89 0.92 6.2 -2.4 8.6
Note: * Significant at 1% level of significance
The ratio of the girl to boy in primary education has improved among both the participants and non-participants with increment of 5.3% and 2.2% respectively. Contribution of MEDEP on improving ratio of girls to boys in primary education is 3.1%. This shows MEDEP has been able to contribute to enrollment of girls in primary education. Statistical analysis further confirms that MEDEP has contributed to improvement in the ratio of girls to boys in primary education at present.
There is no marked difference in ratio of girls to boys in primary education among both the participants and non-participants . However, more girl children belonging to BCTS caste are enrolled in primary education as a result of which the ratio of girls appears more than one among both the participants and non-participants at present. This reveals that enrollment of girls among both the participant and non-participant has improved in recent years. Contribution of the MEDEP on improving ratio of girls to boys is 1.4% among female and 7.0% among men respondents. This possibly reflects higher priority that women entrepreneurs attach to girls’ education. In terms of ethnicity/caste group, contribution of MEDEP ranges from -0.9% among Dalit to 8.6% among other terai castes. The low net impact of MEDEP on education among Dalit as

97
compared to external factors, possibly reflects increased access of other supportive educational programmes, especially scholarship programme implemented by the government targeting these communities. Ratio of girls to boys in secondary education: Table 9.7 presents ratio of girls to boys in secondary education. Secondary education is considered from class 5 to 10.
Table 9.7: Ratio of girls to boys in secondary education
Responses
A. Participants B. Non-Participants % Changes among MEDEP
Contribution% Now Before Now Before Participant Non-
participant
Overall 0.69 0.62 0.66 0.63 12.5 4.7 7.7
A. Gender
Women 0.75 0.66 0.68 0.63 13.5 7.5 6.0
Men 0.55 0.51 0.63 0.58 8.0 7.1 0.9
B. Caste/Ethnicity
BCTS 0.90 0.76 0.59 0.53 18.0 10.3 7.7
Dalit 0.67 0.56 0.67 0.56 21.3 20.0 1.3
Janajati 0.61 0.57 0.76 0.75 7.6 2.0 5.7
Other 0.41 0.38 0.57 0.57 6.4 0.0 6.4
Note: Result insignificant among participants and non-participants at present
The ratio of girls to boys in secondary education has increased by 12.5% among participants and 4.7% among non-participants. Hence, MEDEP’s contribution is 7.7%. This suggests that probability of MEDEP participants sending their girls to secondary schools is high as compared to non-participants indicating MEDEP’s positive contribution to enrollment of girls in secondary education. MEDEP has positively contributed to improving gender equality in secondary education. This is an indirect positive impact of MEDEP. There is high disparity among the ratio of girls and boys in secondary schools irrespective of caste group and gender of entrepreneur. Nevertheless, ratio of girls to boys in secondary school at present is high among participants irrespective of caste and gender. MEDEP contribution is 6.0% among women while it is 0.9% among men. Among ethnicity/caste group, MEDEP’s contribution was found relatively high among BCTS (7.7%) followed by other caste (6.4%), Janajati (5.7%) and Dalit (1.3%). While the prevailing external enivornmental factors result in girls not continuing education beyond primary school, MEDEP has had some positive impact on this parameter.
Ratio of women to men in tertiary education: Tertiary level of education is considered from grade 11 and above. Table 9.8 presents ratio of girls to boys in tertiary education.
Table 9.8: Ratio of girls to boys in tertiary education
Responses
A. Participants B. Non-Participants % Changes among MEDEP
Contribution% Now Before Now Before Participant Non-
participant
Overall 0.60 0.45 0.56 0.47 31.4 17.3 14.1
A. Gender
Women 0.56 0.44 0.56 0.44 29.4 26.6 2.8
Men 0.67 0.52 0.55 0.50 30.3 9.1 21.2
B. Caste/Ethnicity BCTS 0.64 0.49 0.62 0.56 30.9 10.8 20.1
Dalit 0.52 0.36 0.40 0.33 44.2 20.0 24.2
Janajati 0.56 0.44 0.60 0.50 26.4 20.0 6.4
Other 0.60 0.36 0.50 0.33 65.0 50.0 15.0
Note: Result insignificant among participants and non-participants at present
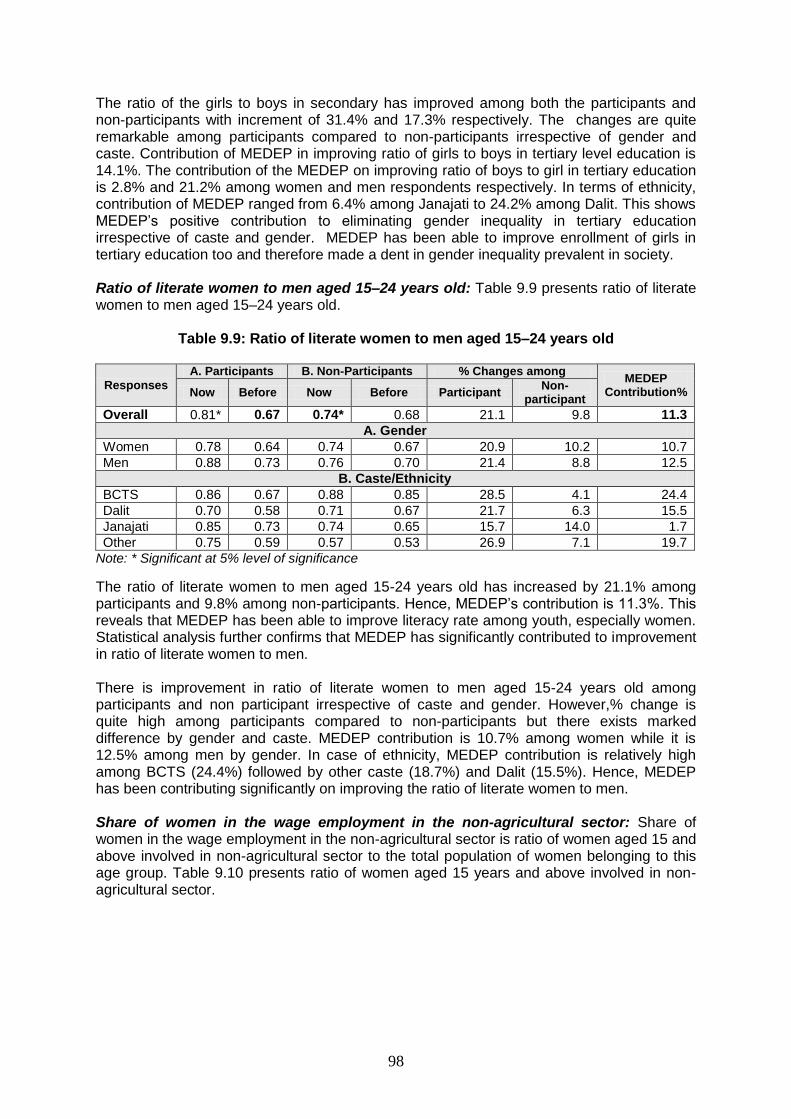
98
The ratio of the girls to boys in secondary has improved among both the participants and non-participants with increment of 31.4% and 17.3% respectively. The changes are quite remarkable among participants compared to non-participants irrespective of gender and caste. Contribution of MEDEP in improving ratio of girls to boys in tertiary level education is 14.1%. The contribution of the MEDEP on improving ratio of boys to girl in tertiary education is 2.8% and 21.2% among women and men respondents respectively. In terms of ethnicity, contribution of MEDEP ranged from 6.4% among Janajati to 24.2% among Dalit. This shows MEDEP’s positive contribution to eliminating gender inequality in tertiary education irrespective of caste and gender. MEDEP has been able to improve enrollment of girls in tertiary education too and therefore made a dent in gender inequality prevalent in society. Ratio of literate women to men aged 15–24 years old: Table 9.9 presents ratio of literate women to men aged 15–24 years old.
Table 9.9: Ratio of literate women to men aged 15–24 years old
Responses
A. Participants B. Non-Participants % Changes among MEDEP
Contribution% Now Before Now Before Participant Non-
participant
Overall 0.81* 0.67 0.74* 0.68 21.1 9.8 11.3
A. Gender
Women 0.78 0.64 0.74 0.67 20.9 10.2 10.7
Men 0.88 0.73 0.76 0.70 21.4 8.8 12.5
B. Caste/Ethnicity BCTS 0.86 0.67 0.88 0.85 28.5 4.1 24.4
Dalit 0.70 0.58 0.71 0.67 21.7 6.3 15.5
Janajati 0.85 0.73 0.74 0.65 15.7 14.0 1.7
Other 0.75 0.59 0.57 0.53 26.9 7.1 19.7
Note: * Significant at 5% level of significance
The ratio of literate women to men aged 15-24 years old has increased by 21.1% among participants and 9.8% among non-participants. Hence, MEDEP’s contribution is 11.3%. This reveals that MEDEP has been able to improve literacy rate among youth, especially women. Statistical analysis further confirms that MEDEP has significantly contributed to improvement in ratio of literate women to men. There is improvement in ratio of literate women to men aged 15-24 years old among participants and non participant irrespective of caste and gender. However,% change is quite high among participants compared to non-participants but there exists marked difference by gender and caste. MEDEP contribution is 10.7% among women while it is 12.5% among men by gender. In case of ethnicity, MEDEP contribution is relatively high among BCTS (24.4%) followed by other caste (18.7%) and Dalit (15.5%). Hence, MEDEP has been contributing significantly on improving the ratio of literate women to men. Share of women in the wage employment in the non-agricultural sector: Share of women in the wage employment in the non-agricultural sector is ratio of women aged 15 and above involved in non-agricultural sector to the total population of women belonging to this age group. Table 9.10 presents ratio of women aged 15 years and above involved in non-agricultural sector.

99
Table 9.10: Ratio of women aged 15 years and above in non-agriculture sector
Responses
A. Participants B. Non-Participants Changes among MEDEP
Contribution Now Before Now Before Participant Non-
participant
Overall 22.8 10.9 13.9 11.7 11.9 2.2 9.7
A. Gender
Women 25.8 10.6 12.9 11.1 15.1 1.7 13.4
Men 15.5 11.5 17.2 13.6 4.1 3.6 0.5
B. Caste/Ethnicity BCTS 21.1 8.5 11.8 9.2 12.6 2.6 10.0
Dalit 24.7 14.7 19.0 18.9 9.9 0.1 9.9
Janajati 25.2 11.6 12.2 10.0 13.6 2.2 11.4
Other 11.8 4.8 10.5 4.4 7.0 6.1 0.8
Note: * Significant at 1% level of significance
Before MEDEP intervention, 10.9% of women were involved in non-agricultural sector which has now increased to 22.8%. Likewise, there has been slight improvement among women. Statistical analysis show that proportion of women participants involved in non-agricultural sector is significantly different from that of non-participants at present. MEDEP contribution varies by gender and caste. By gender, MEDEP contribution was high among women than men (13.4% and 0.5% respectively) suggesting that it has positively contributed to increase women’s access to wage employment in non-agriculture sector. Among the ethnic groups, the highest proportion of increase was observed among Janajati (11.4%) followed by BCTS (10.0%) and Dalit (9.9%). This shows MEDEP’s positive contribution to these three excluded groups as well.
9.4 HIV/AIDS, Malaria and Other Diseases
Goal six of the MDGs aim to combat HIV/AIDs, malaria and other diseases, progress on which are measured on three targets and 13 indicators . Of 13 indicators, threeare are relevant to this study, namely, (a) proportion of HIV/AIDs aware population, (b) prevalence rate associated with malaria and (c) prevalence rate associated with tuberculosis. . Proportion of HIV AIDS aware population: Table 9.11 presents proportion of HIV/AIDs aware population.
Table 9.11: Proportion of population having awareness on HIV AIDS Unit:%
Responses
A. Participants B. Non-Participants Changes among MEDEP
Contribution Now Before Now Before Participant Non-
participant
Overall 72.0* 46.8 66.1* 51.9 25.2 14.2 11.0
A. Gender
Women 69.6 43.5 60.6 44.4 26.1 16.2 9.9
Men 77.6 54.5 85.4 78.0 23.2 7.3 15.9
B. Caste/Ethnicity BCTS 78.0 61.4 86.4 79.5 16.7 6.8 9.8
Dalit 70.2 39.4 46.0 38.0 30.8 8.0 22.8
Janajati 71.1 39.8 72.6 56.5 31.3 16.1 15.2
Other 57.6 49.2 55.6 22.2 8.5 33.3 (24.9)
Note: * Significant at 10% level of significance
Data show that the awareness level of both participants and non-participants on HIV/AIDs has increased by 25.2% and 14.2% respectively with MEDEP contribution of 11.0%. Statistical analysis further confirms that MEDEP has contributed to increase participants awareness on HIV/AIDs.

100
Awareness on HIV/AIDs has increased among both participants and non-participants belonging to different ethnic/caste groups and gender. However increases are higher among participants compared to non-participants in all ethnic groups except for other Terai caste. Among the ethnicity, MEDEP’s contribution is high among Dalit (22.8%) followed by Janajati 15.2%) while that of among other terai caste is negative (24.9%). MEDEP’s contribution is 15.9% among men and 9.9% among women. This reveals that contribution of other factors is high among other terai castes in improving awareness on HIV/AIDs while MEDEP can be attributed to rest of the caste groups and gender.
Prevalence rate associated with malaria: Table 9.11 shows proportion of HHs whose family members have suffered from Malaria and receiving treatment.
Table 9.11: Proportion of HHs whose family members suffered from Malaria and receiving treatment
Responses
A. Participants B. Non-Participants Changes among
Now Before Now Before Participant Non-
participant
% of HHs whose family member is suffering from malaria
0.7 1.0 0.0 0.5 (0.2) (0.5)
% of HHs whose family member is receiving treatment
0.7 0.6 0.0 0.0 0.1 -
Very few participants reported to have suffered from Malaria (0.7%) at present while none of the non-participants reported such incidence. The incidence or occurrence of malaria has declined from the past while the proportion of the participants receiving treatment has increased. This shows MEDEP has been able to reduce prevalence rate associated with malaria but the change is almost negligible.
Prevalence rate associated with tuberculosis: Table 9.12 presents proportion of HHs whose family members have suffered from tuberculosis and receiving treatment.
Table 9.12: Proportions of HHs whose family members suffered from tuberculosis and receiving treatment
Responses
A. Participants B. Non-Participants Changes among
Now Before Now Before Participant Non-
participant
% of HHs whose family member is suffering from tuberculosis
1.3 1.6 0.0 0.5 (0.2) (0.5)
% of HHs whose family member is receiving treatment
1.3 1.1 0.0 0.5 0.2
Very few participants have suffered from tuberculosis (1.3%) at present while none of the non-participants reported such incidence. Nevertheless, incidence of tuberculosis has declined from the past while the proportion of the participants receiving treatment has increased. This shows MEDEP has been able to reduce prevalence rate associated with tuberculosis or have increased access to treatment facilities. However change is almost negligible and insignificant. These results show that even as MEDEP has made small positive impacts, the control of malaria and tuberculosis by the government has been quite effective and has ameliorated the situation of the villagers in general.

101
9.5 Environmental Sustainability Goal 6 of MDGs relates to environmental sustainability. It has identified four targets and 15 indicators for monitoring targets. Of these indicators, only four indicators appear relevant for the purpose of this study, namely (a) proportion of people using wood as their main fuel (b) proportion of people using LPG as their main fuel (c) proportion of people using improved drinking water source and (d) proportion of population using an improved sanitation facility . Proportion of people using wood as main fuel: Table 9.13 presents proportion of households using firewood as their main fuel.
Table 9.13: Proportion of HHs using firewood as main fuel Unit:%
Responses
A. Participants B. Non-Participants Changes among MEDEP
Contribution Now Before Now Before Participant Non-
participant
Overall 87.6 94.4 90.2 95.6 (6.7) (5.5) (1.3)
A. Gender
Women 86.3 94.0 90.8 95.8 (7.7) (4.9) (2.7)
Men 90.7 95.1 87.8 95.1 (4.5) (7.3) 2.8
B. Caste/Ethnicity BCTS 81.3 89.4 75.0 84.1 (8.1) (9.1) 1.0
Dalit 93.4 98.5 100.0 100.0 (5.1) - (5.1)
Janajati 87.2 95.7 93.5 98.4 (8.5) (4.8) (3.7)
Other 96.6 93.2 88.9 100.0 3.4 (11.1) 14.5
Note: Result insignificant among participants and non-participants at present
Dependency on firewood has declined though large majority of the people still use firewood as main source of energy for cooking. As seen from the table, 6.7% of participants and 5.5% of non-participant have shifted to other sources of energy. This shows higher ratio of change among participants compared to non-participants, hence MEDEP has been able to reduce dependency on fire wood. Dependency on firewood has decreased among all categories of respondents irrespective of ethnicity and gender, except for other terai caste. However, MEDEP contribution is mixed or does not show clear distinctive pattern by gender and caste. MEDEP can be attributed for reducing dependency on firewood among women participants, Dalit and Janajati while contribution of other factors could be high among men, BCTS and other terai caste group participants. Proportion of people using gas (biogas and LPG) as their main fuel: Table 9.14 presents proportion of households using gas (this includes both biogas and LPG) as their main fuel.
Table 9.14: Proportion of HHs using gas (both biogas and LPG) as their main fuel
Unit:%
Responses
A. Participants B. Non-Participants Changes among MEDEP
Contribution Now Before Now Before Participant Non-
participant
Overall 12.4 5.3 9.8 4.4 7.1 5.5 1.6
A. Gender
Women 13.7 6.0 9.2 4.2 7.7 4.9 2.7
Men 9.3 3.7 12.2 4.9 5.7 7.3 -1.6
B. Caste/Ethnicity BCTS 18.7 10.6 25.0 15.9 8.1 9.1 -1.0
Dalit 6.6 1.5 0.0 0.0 5.1 0.0 5.1
Janajati 12.8 4.3 6.5 1.6 8.5 4.8 3.7
Other 3.4 1.7 11.1 0.0 1.7 11.1 -9.4
Note: Result insignificant among participants and non-participants at present

102
The data show that proportion of the households using gas is on the rise. As seen from Table 9.14, the proportion of households using gas increased by 7.1% among participants and 5.5% of non-participants with a net difference of 1.6% among two groups. This increment of 1.6% can be attributed to MEDEP and hence probability of using clean and safer energy technology is high among MEDEP participants. This increase in use of has increased among all categories of respondents irrespective of ethnicity and gender. However, MEDEP contribution does not show clear distinct pattern. MEDEP can be attributed for increasing use of gas among women participants, Dalit and Janajati while contribution of other factors is high among men, BCTS and other terai caste group participants. Proportion of population using improved drinking-water sources: Table 9.15 presents proportion of HHs using improved drinking water sources.
Table 9.15: Proportion of HHs using an improved drinking-water source
Unit:%
Responses
A. Participants B. Non-Participants Changes among MEDEP
Contribution Now Before Now Before Participant Non-
participant
Overall 88.6* 82.8 80.9* 75.4 5.8 5.5 0.3
A. Gender
Women 87.5 84.0 83.1 80.3 3.6 2.8 0.8
Men 91.1 80.1 73.2 58.5 11.0 14.6 -3.7
B. Caste/Ethnicity BCTS 92.3 86.2 88.6 75.0 6.1 13.6 -7.5
Dalit 84.8 75.3 80.0 80.0 9.6 0.0 9.6
Janajati 86.9 82.7 69.4 66.1 4.3 3.2 1.0
Other 94.9 94.9 96.3 88.9 0.0 7.4 -7.4
Note: * Significant at 1% level of significance
The proportion of both participants and non-participants using improved drinking water source has increased by 5.8% and 5.5% respectively with MEDEP contribution of 0.3%. This shows small improvement or contribution of MEDEP on improving access to improved drinking water sources. Statistical analysis shows that participants and non-participants are different in terms of access to improved drinking water source at present, which further confirms that MEDEP has positive impact or contributed to improvement in access to safe and clean drinking water. The proportion of population using improved drinking water sources has increased among participants and non-participants across ethnicity and gender. MEDEP contribution is mixed or does not show clear pattern by gender and caste on this parameter. MEDEP can be attributed for improving access to drinking water among women participants, Dalit and Janajati while contribution of other factors is high among men, BCTS and other terai caste group participants. This shows MEDEP’s positive contribution to improvement in access to drinking water sources among marginalized communities like women, Dalit and Janajati though the magnitude of change is small. Proportion of population using improved sanitation facility: Table 9.16 shows proportion of population using improved sanitation facility.

103
Table 9.16: Proportion of HHs using an improved sanitation facility Unit:%
Responses
A. Participants B. Non-Participants Changes among MEDEP
Contribution Now Before Now Before Participant Non-
participant
Overall 78.6 59.9 66.1 60.1 18.8 6.0 12.7
A. Sex
Women 79.5 60.9 68.3 64.1 18.6 4.2 14.4
Men 76.4 57.3 58.5 46.3 19.1 12.2 6.9
B. Caste/Ethnicity BCTS 89.4 72.8 79.5 72.7 16.7 6.8 9.8
Dalit 73.2 47.5 54.0 50.0 25.8 4.0 21.8
Janajati 76.9 60.5 71.0 61.3 16.4 9.7 6.7
Other 61.0 44.1 55.6 55.6 16.9 0.0 16.9
Note: * Significant at 1% level of significance
The proportion of participants and non-participants using improved sanitation facility has increased by 18.8% and 6.2% respectively with MEDEP contribution of 12.0%. Statistical analysis further confirms that MEDEP has contributed significantly for increasing access to improved sanitation facility since proportion of the participants having access to improved sanitation facility differs significantly from that of non-participants.
The use of improved sanitation facility has increased among all categories of respondents irrespective of caste and gender, and MEDEP contribution is positive for all these groups. MEDEP contribution was highest among women compared to men (14.4% and 6.9% respectively). Likewise, it was highest among Dalit (21.8%) followed by other caste group (16.9%), BCTS (9.8%) and Janajati (6.7%). This reveals that MEDEP has been able to improve access to sanitation facility among the marginalized group such as women, Dalit and other terai caste.

104
10 ASSESSMENT OF MEDEP MODALITY Chapter 2 briefly described MEDEP modality. Chapter 4 to 9 assessed socio-economic impacts of MEDEP from different dimensions at households, community and individual levels and MEDEP’s contribution to gender equality and social inclusion, and to MDGs. The focus of the earlier chapters, however, was the micro-enterprise. This chapter focuses specifically on MEDEP modality of micro-enterprise development and assesses it using four key criteria of evaluation which include effectiveness, efficiency, sustainability and impact18. The fifth criterion “relevance” of the modality has been omitted because many studies have earlier produced several credible evidences on the role of micro-enterprises to poverty reduction and employment generation. MEDEP’s relevance as a stand-alone micro-enterprise development programme can also be realized from the priority accorded to micro-enterprise promotion as an important tool by the GON in all successive periodic development plans starting from the Ninth Plan (1997-2002). The government’s poverty reduction strategy paper for the Tenth Plan (2002-07) has emphasized the promotion of micro-enterprises for poverty reduction. Box 10.1 below defines these five criteria of evaluation.
This chapter is organized into four sections focusing on each of the above four criteria of evaluation.
10.1 Key Aspects of the Modality The key characteristic features of MEDEP’s integrated market-based model have already been described above (Chapter 2). The model is based on two key things, firstly effective selection of potential entrepreneurs; secondly, rigorous entrepreneurship training to assist the participants to identify their latent entrepreneurship within themselves by themselves. The former is more focused on the target group. It uses a three pronged approach: the model focuses firstly on the demand of the potential beneficiaries and availability of local resources; secondly on the ability of the potential participants to use local resources; and lastly, on the market demand and potential for the products and services
Within the course of implementation, MEDEP has adjusted its strategy and approaches several times, particularly from the first to the second phase but the overall purpose and fundamentals of the programme have remained unchanged. The key concept being that the development of latent entrepreneurship skills among the poorest and most vulnerable has never been changed. Figure 10.1 present micro-enterprise development and creation process of MEDEP.
18
Relevancy of the model has not been assessed in this chapter because chapter 2,5.8 and 9 have adequately demonstrated the relevancy of the model.
Box 10.1: Definitions of five key criteria of MEDEP modality Relevance measures the extent to which MEDEP's modality is consistent with the national government’s policies and plans, and those of donors supporting/assisting it.
Effectiveness measures the extent to which MEDEP’s intended results (outputs or outcomes) have been achieved.
Efficiency measures how economically resources or inputs (such as funds, expertise and time) are converted to results.
Sustainability measures the extent to which benefits of benefits continue after external development assistance has come to an end. Impact measures changes in human development and people’s well-being that are brought about by MEDEP, directly or indirectly, intended or unintended.

105
Figure 10.1: Micro-enterprise creation and development process
Customer Registry Identification of Potential
Participants
Customer Survey Household Survey
(Forms A, B, and C
Market Aspect Socio-economic Aspect
Entrepreneurial Competency Screening
Selection of Participants
Determination Potential and
Needs of Participants
Identification of Viable
Products
SWOT Analysis
Selection of Viable Products
Resources Aspect
Designing Intervention
Strategies
Market Intervention Strategy
Monitoring &
Evaluation
Selection of Viable Products
District Overview:
Socio-economic, area potential and market survey
Selection of Programme Centre (PC)/Programme Locations (PL)
Training on Micro-Enterprise Creation and Development and
Strategic Market Planning and Business Development
Skill Training
Skill Upgrading
Micro-Finance
Quality Control of
Products and Services
Dissemination and Adaptation of
App. Tech.
Market Plan Implementation
Skills and Appropriate
Technology Aspects
Existing Skills and
AT Analysis
Existing Resource
Analysis
Skills and AT Need
Assessment

106
There were significant changes in strategy and approaches, as depicted in Table 10.1.
Table 10.1: Changes in MEDEP model from the first to the second phase
Aspect of implementation
First phase Second phase
Target group Low income households Low income households with at least 60% women and 40% Dalit and indigenous nationalities
Service delivery/ Business development services
Micro Enterprise Development Unit under the Local Development Fund (LDF) of the DDC
Business Development Service Providing Organisations (BDSPOs)
Funding arrangement
Local Development Fund Creation of the Micro-enterprise Development Fund (MEDF)
District Coordination
Provision of District Programme Implementation Committee (DPIC)
Provision of District Enterprise Development Committee (DEDC)
Recipient organisations
None Common Facility Centres (CFCs), District Micro Enterprise Group Association (DMEGA) and National Micro Enterprise Group Association (NMEGA)
Microfinance arrangement
Availability ensured through Agriculture Development Bank
DMEGAs and BDSPOs encouraged to establish understanding with micro-finance institutions
The changes show that MEDEP is a learning organization, and also demonstrate the flexibility in its decentralised service delivery approach which has helped it to be successful. MEDEP’s service delivery system is participatory and bottom-up. Central to MEDEP is to maintain balance between the central regulatory agencies like the MOI, local government bodies like DDCs and VDCs, alternative service providers like BDSPOs and users associations like MEGA and DMEGA. A key lesson learned is that the extent of MEDEP’s success depends on its ability to maintain this balance.
10.2 Effectiveness As has been evident from the evidence presented in earlier chapters, MEDEP, as a stand-alone micro-enterprise development programme, can be considered as one of the most successful development initiatives implemented by GON between 1998 and 2008. It has been quite successful in assisting very poor and excluded people to identify their entrepreneurial skills by themselves and later to help them select appropriate enterprises and operate them successfully. Unlike most other development projects, MEDEP has been able to expand in terms of geographical coverage, number of micro-enterprises and target groups even during the period of armed conflicts in Nepal (1996-2006) instead of being forced to pull out from the service areas. Statistics available from the MEDEP reveal that against the target of developing 19,840 MErs during the second phase of the project, the achievement has been almost 17,000 poor and excluded people (85.6%). When they joined the programme, all these participants earned income less than two third of the poverty line. By 2010, they have successful micro-enterprises in a sector of their choice. As reported in Chapter 4, 80% of the total MEs supported by MEDEP are operational at present. Of these, 69% operate all year-round, 30% are seasonal and 0.9% are casual19. This study found the average expenditure of an entrepreneur was about Rs 44,000 and the average earning was more than Rs. 90,000 per year. B. Almost all MEs have been earning
19 See chapter 5

107
profits, with average return on investment ranging from 71% to 157%. While the per capita incomes (PCI) of participants and non-participants were almost similar before receiving support from MEDEP, survey results found PCI of participants reached an average of Rs 26,961 from Rs. 4,402.00 with an average increase of more than 500%. These data reveal not only successes of MEDEP but also effectiveness of the MEDEP modality20. FGDs with key stakeholders, MEGs, BDSPOs and MEGAs revealed the following success factors of the MEDEP modality have either individually or together contributed to the effectiveness of the programme. 10.2.1 Success factors
There are several factors responsible for the success of the programme. The key ones are as follows:
Assisting people to identify latent entrepreneurial skills by themselves: Many contemporary development projects with micro-enterprise component give direct cash or material support to operate enterprises. Instead, MEDEP focussed on social mobilization, counseling, motivation and providing opportunities to participate in training like SIYB, and organizing training at the villages (spots) so that women and poor could participate.
Targeting and selection of the poor: Results of FGDs with BDSPOs, DDCs, DMEGAs and EDFs revealed that targeting of the poorest of the poor and identification of entrepreneurs within the household is very strong and crucial in MEDEP. The targeting process within MEDEP model combines both qualitative and quantitative methods. As part of qualitative method, participatory well being ranking is carried out and HH survey is implemented under the quantitative survey. Key to the success of this programme in reaching more than 60% women and 20% Dalit and other excluded groups is the combination of the qualitative and quantitative method. Group approach to enterprise promotion: Potential MErs are encouraged to form groups, undertake saving and credit activities and meet regularly to share experiences and skills. The importance of group is discussed with them. Group approach is expected to be more cost efficient and enable BDSPOs and DMEGAs to reach a large number of participants timely and effectively.
No rush and no pressure: As the programme is targeted to the poor, MEDEP model is aware that the poor are risk averse c of the poor. Therefore, it has been the general policy of MEDEP that it will al take sufficient time to selected persons to evaluate the benefits of participation in ME programme, select enterprises of their choice by themselves and start the business. Difficulties in accessing financial services were discussed with the potential participants earlier and that they were rather suggested to start the business with small scale, use groups’ saving and credit fund rather then depending on the financial services. Yet easy availability of financial services at doorsteps could have expedited the process further.
Professional/ technical advice and supervision of the grass roots service providers from APSOs and MEDEP: During the interaction, officials or many BDSPOs and DMEGAs indicated timely support and technical advice as one of the key factors for the effectiveness of the programme. Most of the BDSPOs and DMEGAs highlighted the need for timely supervision and guidance from the professional staff and experts.
10.2.2 Drop-outs and their reasons
Above achievements and success factors do not mean that the modality has produced what is possible under the sky. The drop-outs include those who are not operating any enterprise
20
See chapter 2 for the highlights of the model.
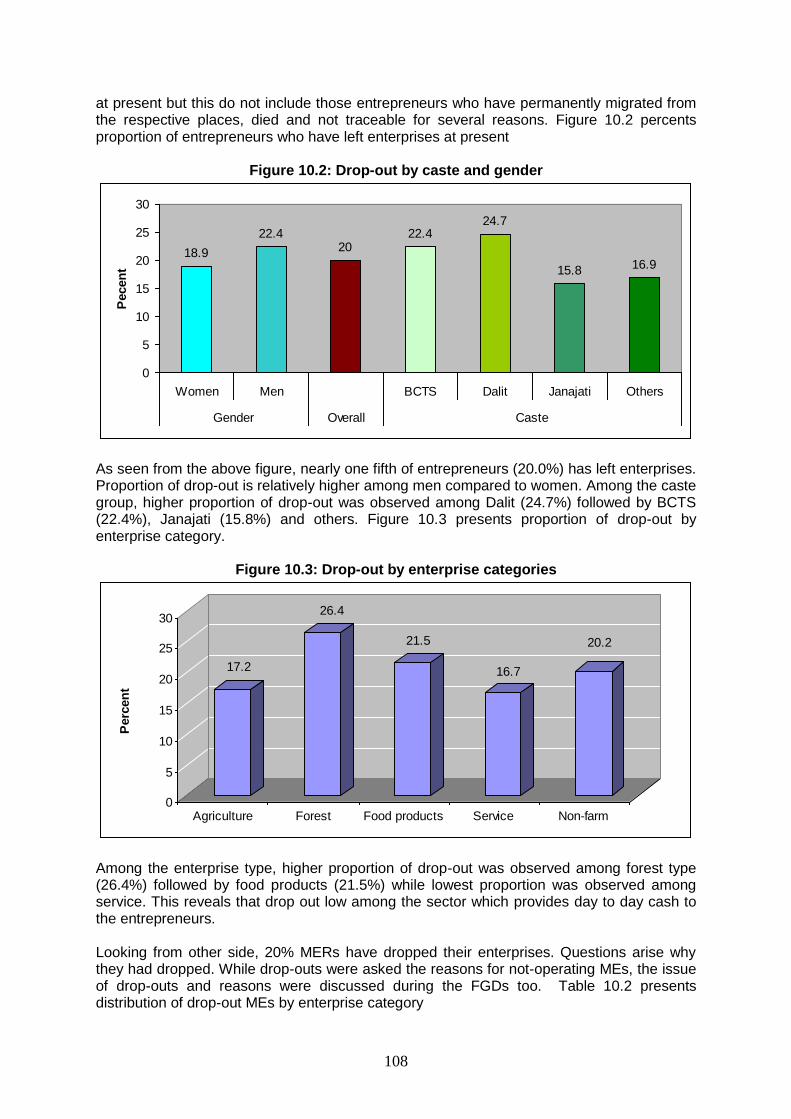
108
at present but this do not include those entrepreneurs who have permanently migrated from the respective places, died and not traceable for several reasons. Figure 10.2 percents proportion of entrepreneurs who have left enterprises at present
Figure 10.2: Drop-out by caste and gender
18.9
22.420
22.424.7
15.8 16.9
0
5
10
15
20
25
30
Women Men BCTS Dalit Janajati Others
Gender Overall Caste
Pecen
t
As seen from the above figure, nearly one fifth of entrepreneurs (20.0%) has left enterprises. Proportion of drop-out is relatively higher among men compared to women. Among the caste group, higher proportion of drop-out was observed among Dalit (24.7%) followed by BCTS (22.4%), Janajati (15.8%) and others. Figure 10.3 presents proportion of drop-out by enterprise category.
Figure 10.3: Drop-out by enterprise categories
17.2
26.4
21.5
16.7
20.2
0
5
10
15
20
25
30
Perc
en
t
Agriculture Forest Food products Service Non-farm
Among the enterprise type, higher proportion of drop-out was observed among forest type (26.4%) followed by food products (21.5%) while lowest proportion was observed among service. This reveals that drop out low among the sector which provides day to day cash to the entrepreneurs. Looking from other side, 20% MERs have dropped their enterprises. Questions arise why they had dropped. While drop-outs were asked the reasons for not-operating MEs, the issue of drop-outs and reasons were discussed during the FGDs too. Table 10.2 presents distribution of drop-out MEs by enterprise category
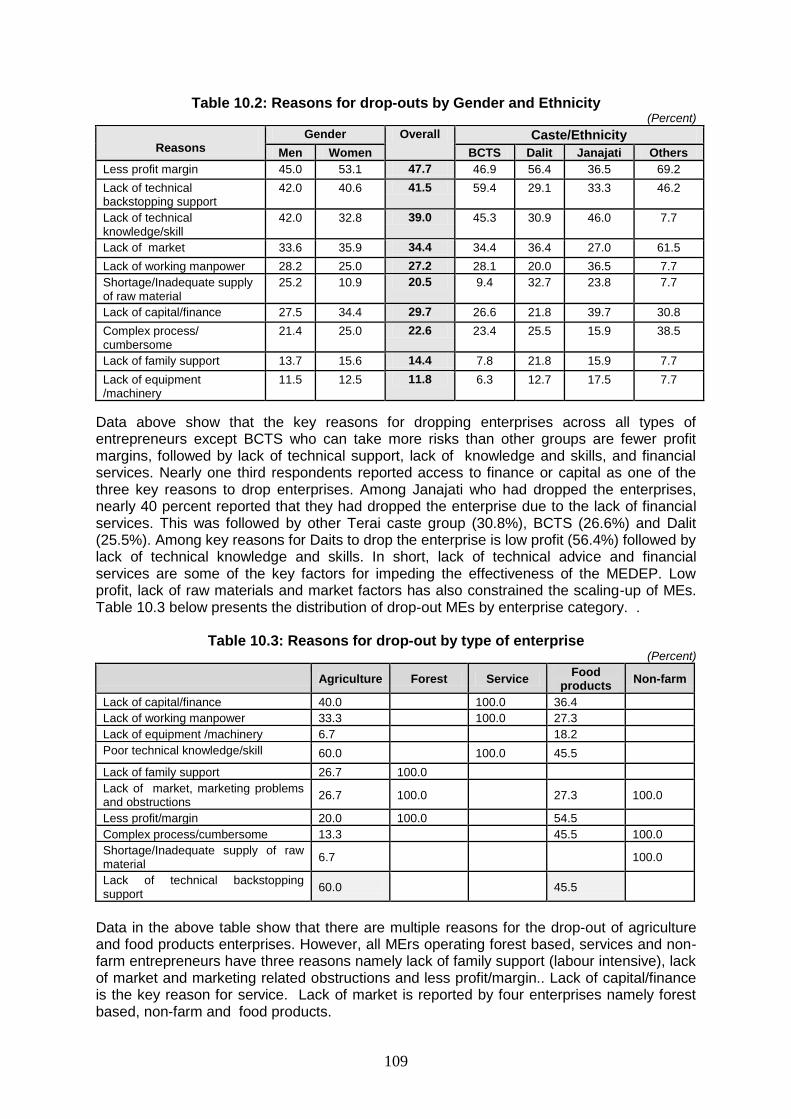
109
Table 10.2: Reasons for drop-outs by Gender and Ethnicity (Percent)
Reasons
Gender Overall Caste/Ethnicity
Men Women BCTS Dalit Janajati Others
Less profit margin 45.0 53.1 47.7 46.9 56.4 36.5 69.2
Lack of technical backstopping support
42.0 40.6 41.5 59.4 29.1 33.3 46.2
Lack of technical knowledge/skill
42.0 32.8 39.0 45.3 30.9 46.0 7.7
Lack of market 33.6 35.9 34.4 34.4 36.4 27.0 61.5
Lack of working manpower 28.2 25.0 27.2 28.1 20.0 36.5 7.7
Shortage/Inadequate supply of raw material
25.2 10.9 20.5 9.4 32.7 23.8 7.7
Lack of capital/finance 27.5 34.4 29.7 26.6 21.8 39.7 30.8
Complex process/ cumbersome
21.4 25.0 22.6 23.4 25.5 15.9 38.5
Lack of family support 13.7 15.6 14.4 7.8 21.8 15.9 7.7
Lack of equipment /machinery
11.5 12.5 11.8 6.3 12.7 17.5 7.7
Data above show that the key reasons for dropping enterprises across all types of entrepreneurs except BCTS who can take more risks than other groups are fewer profit margins, followed by lack of technical support, lack of knowledge and skills, and financial services. Nearly one third respondents reported access to finance or capital as one of the three key reasons to drop enterprises. Among Janajati who had dropped the enterprises, nearly 40 percent reported that they had dropped the enterprise due to the lack of financial services. This was followed by other Terai caste group (30.8%), BCTS (26.6%) and Dalit (25.5%). Among key reasons for Daits to drop the enterprise is low profit (56.4%) followed by lack of technical knowledge and skills. In short, lack of technical advice and financial services are some of the key factors for impeding the effectiveness of the MEDEP. Low profit, lack of raw materials and market factors has also constrained the scaling-up of MEs. Table 10.3 below presents the distribution of drop-out MEs by enterprise category. .
Table 10.3: Reasons for drop-out by type of enterprise (Percent)
Agriculture Forest Service Food
products Non-farm
Lack of capital/finance 40.0 100.0 36.4
Lack of working manpower 33.3 100.0 27.3
Lack of equipment /machinery 6.7 18.2
Poor technical knowledge/skill 60.0 100.0 45.5
Lack of family support 26.7 100.0
Lack of market, marketing problems and obstructions
26.7 100.0 27.3 100.0
Less profit/margin 20.0 100.0 54.5
Complex process/cumbersome 13.3 45.5 100.0
Shortage/Inadequate supply of raw material
6.7 100.0
Lack of technical backstopping support
60.0 45.5
Data in the above table show that there are multiple reasons for the drop-out of agriculture and food products enterprises. However, all MErs operating forest based, services and non-farm entrepreneurs have three reasons namely lack of family support (labour intensive), lack of market and marketing related obstructions and less profit/margin.. Lack of capital/finance is the key reason for service. Lack of market is reported by four enterprises namely forest based, non-farm and food products.

110
Having discussed the drop-out issues of the MEs, the following section assesses briefly each of the six key components of MEDEP modality. 10.2.3 Performance of components This section is primarily based on the responses of the officials of BDSPOs, DMEGAs and conclusions drawn during the FGDs. Social Mobilization: The MEDEP modality is rooted in social mobilization. During the first phase, it operated satisfactorily. Enterprise Development Facilitators (EDFs) were then full-time employees and getting regular salary and remuneration from the programme through respective DDCs. Increased conflicts and restriction of government difficulties to move freely in the interior parts of the district by the workers of the Communist Party of Nepal (Maoists) and sustainability reasons, the responsibility for social mobilization has been transferred to the same EDFs but working under different arrangements. Just before the end of the first phase, MEDEP encouraged working EDFs and Programme Coordinators to establish Business Development Service Providing Organizations (BDSPOs), as a non-government and non-profit making organizations, and provided output based contracts to them under two different arrangements. Firstly, BDSPOs were to receive contracts through the respective DDCs for the establishment of new enterprises. Under second arrangement, MEDEP funded directly to the BDSPOs for providing follow-up services and technical and marketing support to the operating MEs. With this arrangement, social mobilization became weak, many experienced EDFs left their BDSPOs in search of secured and attractive services elsewhere and conducting social mobilization became almost optional. Many MEGs have been carrying out mostly saving and credit activities and social mobilization became a kind of synonym for saving and credit activities. Many non-MErs joined the group, mostly to participate in saving and credit activities. To respond to this situation, many BDSPOs, as for example, Kavrepalanchok and Puythan district, started to provide monthly salary to the EDFs using funds available through them from DDCs and MEDEP, and others following the payment based on service contracts as per MEDEP’s norms. Yet the problem remains. Social mobilization activities have been diluted and many MErs who were receiving timely support and social mobilization support intensively started to perceive that they have not been receiving what they need.
Entrepreneurship development through SIYB/MECD – entrepreneurship development: While the result of the MEDEP is often measured in terms of the number of microenterprises developed, the key focus of MEDEP is the development of latent entrepreneurships from within among the poor and excluded, particularly women, Dalit, Janajati and other groups such as Muslims. Success of MEDEP model is therefore should be measured not solely on the number of enterprises development but on the entrepreneurship development. The most important thing to recognize is the self-identification of entrepreneurship. If it happens, sooner or later, s/he will successfully establish and operate enterprises based on available opportunities and resources. Drop-out of enterprises at present does not mean that s/he will be doing subsistence farming always. Interestingly, this study found least 95% sample MErs have received either Micro-enterprise Creation and Development Training or SIYB. Earlier, MEDEP followed MECD which was replaced by SIYB later. Although there was no detail study carried out about the impact of the MECD training, MEDEP replaced it with SIYB for the following obvious reasons: MECD is designed mainly for literate people ( at least who has completed lower secondary level of education and read up to 10 class ). On the other hand, SIYB is very simple and useful and appropriate equally for both illiterate and literate people. As most of the MEDEP’s target groups are illiterate, going to SIYB was not only in its interest but imperative to increase access of poor and excluded to entrepreneurship development.
111
Implementation of MECD training takes a long period. Evidence reveals that adults can’t afford and participate in long duration training. Their ability to learn goes on decreasing as an when the duration of the training. The duration of the SIYB divided into 4 packages (ToPE, ToSE, ToEE, and ToGE) is short and easy to deliver as its modules are based on games. Generally, MECD is based on lecture method. manage However, MEDEP has not assessed or reviewed its own methodology systematically over past 12 years. While staff understand differences between 4 types of training under SIYB, these differences are not understood by the participants. In all interviews as well as FGDs, entrepreneurs acknowledged that they received training but could not identify properly which type of training. Annual assessment or even once assessment in three years would have helped MEDEP to streamline these four models into two to three. At present, sometimes, these four packages are given in two steps(ToPE and ToSE into one) and ToEE and TOGE into other). Questions arise what is the basis of integration and why two, not three. So in a programme that is otherwise a very good enterprise development programme, periodic assessment of its key enterprise start up tool is necessary. This would have helped it to refine, repackage and offer a more compact tool to other development organizations involved in MEs development. Technical skills development: Entrepreneurship development is necessary but not adequate. Therefore, it has been providing need based technical skill oriented training on demand to the entrepreneurs. The duration of the training ranges from 5 days (e.g. Honey processing and marketing) to one month (shoes making) and even up to 3 months (e.g. Allo processing and weaving, Dhaka cloth weaving). Flexibility in the duration of the training is important. However, MEDEP has not done any assessment of the training. Questions arise, is it a good idea to provide such a long duration training? Is it really necessary? If it is an intern type training, it should be acknowledged and reported. The good thing about the skill oriented training was using the successful entrepreneuers as trainer. However, FGDs show that the MERs who have dropped enterprises, ar still being used as trainers. Some participants of the FGDs were very critical about this. BDSPOs/MEDEP should follow it up and not use droip-outs as trainers at any cost.
Access to finance: Access to financial services is one of the key features/components of MEDEP modality. To achieve this objective MEDEP had entered into partnership with Agricultural Development Bank of Nepal (ADB/N) in the first phase. However, MEDEP’s partnership with the ADB/N could not go ahead even till the end of the first phase because of this Bank’s plan to go commercialization and concomitant decision of its board for not to get engaged in the microfinance activities any more. This resulted MEDEP to partner with multiple Microfinance Institutions (MFIs) on case to case Memorandum of Understandings (MOUs) carried out between MFIs and BDSPOs/ DMEGAs in the districts. It was also reported that, in the beginning, MEDEP had shouldered administrative overhead costs of partner MFIs for the first 1 to 2 years. However, problem of access to financial services remained. Contrary to MEDEP’s plan to ensure secured credits for at least 60 percent of the total targets and 15 percent MERs to complete third cycle loan by the end of three years period, this impact study found almost 80% MEs were self financed. However, this study found that finance is not available for enterprises in their growth phase and due to this most of the MEs have to rely on informal sources such as friends, money lenders, relatives and groups. Of the three key reasons for drop outs and difficulties to scale up micro-enterprises, access to finance across all types and categories of MErs was one. FGDs with MEGs, BDSPOs and discussions with MFIs in the study districts showed the following reasons for the poor credit delivery among MErs: MF modality is different to MEDEP modality in terms of group formation and mobilization. Generally MFIs provide services based on typical group/ center model in which MEDEP model does not exactly fit. MFIs seem to be m ore reliant on their own group formation.

112
The overall goal of microfinance is to provide collateral free micro-credits on group guarantee to very poor and disadvantaged people, generally women,, to assist them in engaging in income generating activities (IGAs) only. Beneficiaries of MFIs are required to repay credit generally after 15 to 30 days on weekly/fortnightly/monthly basis. On the other, all MEs are IGAs but all IGAs are not MEs. Primarily, MEs target graduates of IGAs. Therefore, credit requirement of MEs is often much more higher and not possible to return loan installment as quickly as necessary on time bound basis as per microfinance rules.
There is lack of enough MFI network in or near the program areas.
Neither most of the BDSPOs and DMEGAs have capacity to negotiate with MFIs on behalf of MErs needing credits nor have they resources to coordinate, intensify meetings and contacts with MFIs.
MEDEP period corresponds with conflict period (1996-2006) when many MFIs were either forced to pull out their services or remain dormant from rural areas. This resulted low access of MERs to financial services.
As target groups of MEDEP are risk–prone very poor and excluded people, many were reluctant to take credit and expand business but preferred rather to go slowly and be happy with less profit/income.
Increased migration for work employment also hindered many to take micro-finance for operating enterprises which requires weekly or at the most fortnightly payment.
Increased operation of saving and credit groups and saving and credit cooperatives in the rural areas also provided opportunities for the people to get credit from them. As stated earlier, loan requirements of the MErs do not match with MF schemes.
Above factors suggest the need for the MEDEP to revisit its access to finance component. This component has not performed as anticipated. Indeed, performance of MEDEP would have been much better than what was found by this study if this component could have performed at the desired level. Box 10.2 below presents a case describing the constraint of a successful entrepreneur not being able to expand the enterprise due to the lack of finance
Box 10.2: Successful but lack of funding Mrs. Mamata Chaudhary joined Kopila Mahila Bakhra Palak Samuha (Goat Keeping Group) in 2006. Earlier, she was a house wife and earned no cash she could contribute to the HH income. Although her family owned 1 ha land (1.5 Bigha), her HH was poor and dependent on that marginal and non-irrigated low quality land. She decided to open a beauty parlor for which MEDEP provided her necessary training. She opened the enterprise but has not been able to attract many customers commensurate to her skills, The most constraining factor for her is the lack of fund/finance to acquire necessary tools, equipment, provide facilities and to decorate the parlor which are important to attract customers. She says, “I have been able to transit from housewife to an entrepreneur, I have some cash income to support my family. But I could have done much better and improved our livelihoods if I have finance. But what to do?”.
Appropriate technology testing and transfer: Appropriate technology testing and transfer is other key component of MEDEP. For this, it has been supporting the establishment of Common Facility Centre for MEG (individual proprietorship) or group of MErs (group proprietorship). Generally when building or common working place is needed for CFC, MERs are required to generate part of funding through VDC, DDC and other funding agencies aside from free land from the VDC and voluntary labor contribution of the participant MErs. Machineries and equipments are generally provided free of cost by MEDEP. MEDEP’s support for CFC was well appreciated by all respondents. CFC has provided not only working space for very poor MErs who lack space in their small houses to operate enterprises, but it has also created a learning platform for them. More than men entrepreneurs, women entrepreneurs are more enthusiastic and interested to work in CFCs because this allows them to come out of the house and free themselves from routine HH chores.
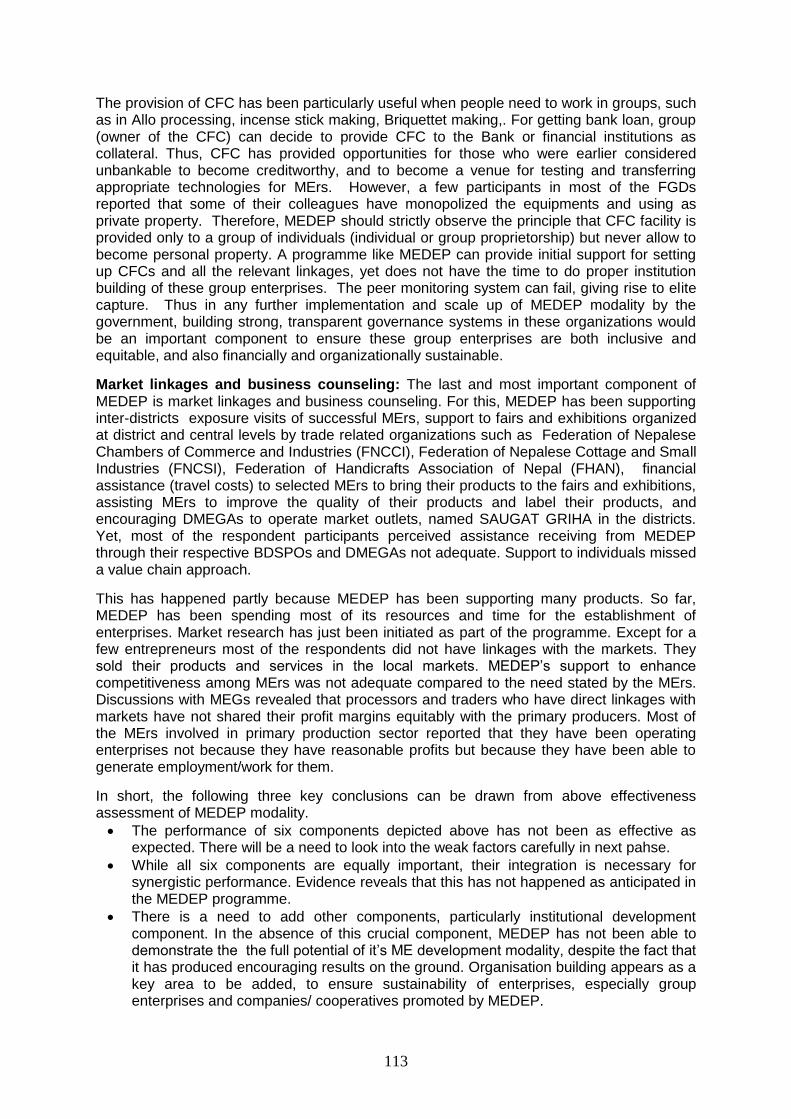
113
The provision of CFC has been particularly useful when people need to work in groups, such as in Allo processing, incense stick making, Briquettet making,. For getting bank loan, group (owner of the CFC) can decide to provide CFC to the Bank or financial institutions as collateral. Thus, CFC has provided opportunities for those who were earlier considered unbankable to become creditworthy, and to become a venue for testing and transferring appropriate technologies for MErs. However, a few participants in most of the FGDs reported that some of their colleagues have monopolized the equipments and using as private property. Therefore, MEDEP should strictly observe the principle that CFC facility is provided only to a group of individuals (individual or group proprietorship) but never allow to become personal property. A programme like MEDEP can provide initial support for setting up CFCs and all the relevant linkages, yet does not have the time to do proper institution building of these group enterprises. The peer monitoring system can fail, giving rise to elite capture. Thus in any further implementation and scale up of MEDEP modality by the government, building strong, transparent governance systems in these organizations would be an important component to ensure these group enterprises are both inclusive and equitable, and also financially and organizationally sustainable.
Market linkages and business counseling: The last and most important component of MEDEP is market linkages and business counseling. For this, MEDEP has been supporting inter-districts exposure visits of successful MErs, support to fairs and exhibitions organized at district and central levels by trade related organizations such as Federation of Nepalese Chambers of Commerce and Industries (FNCCI), Federation of Nepalese Cottage and Small Industries (FNCSI), Federation of Handicrafts Association of Nepal (FHAN), financial assistance (travel costs) to selected MErs to bring their products to the fairs and exhibitions, assisting MErs to improve the quality of their products and label their products, and encouraging DMEGAs to operate market outlets, named SAUGAT GRIHA in the districts. Yet, most of the respondent participants perceived assistance receiving from MEDEP through their respective BDSPOs and DMEGAs not adequate. Support to individuals missed a value chain approach.
This has happened partly because MEDEP has been supporting many products. So far, MEDEP has been spending most of its resources and time for the establishment of enterprises. Market research has just been initiated as part of the programme. Except for a few entrepreneurs most of the respondents did not have linkages with the markets. They sold their products and services in the local markets. MEDEP’s support to enhance competitiveness among MErs was not adequate compared to the need stated by the MErs. Discussions with MEGs revealed that processors and traders who have direct linkages with markets have not shared their profit margins equitably with the primary producers. Most of the MErs involved in primary production sector reported that they have been operating enterprises not because they have reasonable profits but because they have been able to generate employment/work for them.
In short, the following three key conclusions can be drawn from above effectiveness assessment of MEDEP modality.
The performance of six components depicted above has not been as effective as expected. There will be a need to look into the weak factors carefully in next pahse.
While all six components are equally important, their integration is necessary for synergistic performance. Evidence reveals that this has not happened as anticipated in the MEDEP programme.
There is a need to add other components, particularly institutional development component. In the absence of this crucial component, MEDEP has not been able to demonstrate the the full potential of it’s ME development modality, despite the fact that it has produced encouraging results on the ground. Organisation building appears as a key area to be added, to ensure sustainability of enterprises, especially group enterprises and companies/ cooperatives promoted by MEDEP.

114
10.2.4 Entrepreneurs’ responses to their challenges and constraints Most of the respondents have found themselves in difficult situations to operate and expand business due to the lack of the financial services for which they have often used their MEGs for saving and credit purposes, formed or participated in cooperatives and approached friends, relatives and even money lenders. Many entrepreneurs have joined the Microfinance groups and become members in both MEGs and MFGs. This has often been the source of double reporting. CFCs have provided them opportunities to work in a group culture and a platform for building social capital and share experiences. However, access of MErs to CFCs is limited. For the lack of technical services, technologies and skills training, MErs have often approached several agencies but there lacks institutions and projects in the districts and their settlements to support them. While they understand the importance of market competitiveness, they have not been so for several reasons, particularly the lack of market linkages, lack of awareness and skills for delivering quality products and services, lack of market promotion activities and inadequate operation and understanding of value chain processes. Secondary producers, processors and traders have often reaped more profits which are not equitably passed to primary producers. Lack of employment opportunities elsewhere have made many entrepreneurs just to limit their businesses to self -employment rather than expand and upscale to create employment generation. What it suggests that in future MEDEP should give more emphasis on employment creation and the success of the programme should be measured not only in terms of increase or change in the income earned from the enterprises but also from the perspective of employment generation and the proportion of profit/benefits passed to all categories and types of actors in the value chain, particularly the primary producers. Most of the drop outs are primary producers rather than processors, traders and enterprises in service sectors.
10.3 Efficiency
This section assesses MEDEP’s efficiency, which measures how economically resources or inputs (such as funds, expertise and time) are converted to results.. Chapter 5 on enterprise analysis earlier examined the efficiency of MEs. However, measuring the efficiency of MEDEP was not easy because it has been providing funds to enterprise development through multiple sources and part of the investment have been covered by DDCs as matching fund. Table 10.4 presents phase wise cost of the MEDEP and cost incurred by it over a period of 10 years.
Table 10.4: MEDEP’s cost of micro-enterprise development
Unit End of first phase (2003)
End of second phase (2007)*
Remark
A. Costs
Administrative cost US $ 747,270 2,414,974
Programme cost US $ 2,430,386 7,459,639
Total US $ 3,177,656 9,874,613
B. Number of enterprises
Enterprises No 5,263 22,268
Per Unit cost US $ 604 443 Rs. 31,010.00 *- includes costs incurred in the first phase too.
As seen in the above table, the average cost of entrepreneurship development of MEDEP is Rs. 31,010.00 at present price. On the other, survey result showed average net profit is Rs. 30,650.00 (this is average is inclusive of drop-out as well, hence value appears smaller than reported elsewhere). Based on this it can be concluded that the average cost per MEDEP entrepreneur is almost equal to the value of increase in the entrepreneur’s income. Earning the investment within a year or two suggests that MEDEP modality is efficient. Second phase is more efficient than the first phase for two reasons. First, the first phase was pilot

115
phase. Secondly, number of enterprises and coverage is high in second phase. This is a per year income figure. MEDEP has spent only once on an enterprise, but this annual income increase has occurred over time, every year, and is likely to sustain. So we should estimate that if we look at a period of ten years, then the cost is about 10 to 15% of the total income the programme has generated, which shows high efficiency.
Table 10.5 shows number of enterprises coverage by grassroots and supervisory staff. Grassroots staff includes mainly EDFs and supervisory staff includes APSOs and MEDEP HQ Kathmandu staff.
Table 10.5: Enterprise coverage by field staff
Phases No of MEs Total grass
root staff (No)
Coverage per grassroots
staff
No. of Staffs at supervisor
level
Coverage per supervisory
staff
Phase I 5,263 120 44 15 351
Phase II 22,268 250 89 25 890
Table 10.5 shows that coverage of MEs by EDFs and supervisory staff has increased by two and two and half times respectively in the second phase compared to the first phase. This happened in the second phase because of increase in number of districts covered by MEDEP during the second phase and not increasing the number of staff commensurate to the increase in number of districts. Yet, the performance of the programme has remained satisfactory and effective. This means that the model is cost-effective. As noted above, the cost incurred by MEDEP over a period of 10 years is almost recovered in a year by the entrepreneur.
10.4 Sustainability One of the key indicators to assess the sustainability of MEDEP modality of micro-enterprise development is the success rate which, as discussed earlier, is good. Given heightened conflicts during whole of the implementation period and lack of domestic experiences regarding the operation of stand-alone micro-enterprise development initiatives like MEDEP, 80% success rate (see Chapter 4) can be considered highly satisfactory. This section assesses the probability of continuation of MEDEP modality by the BDSPOs, DMEGAs, DDCs and other development partners after the handing over of MEDEP activities and achievements to the Government of Nepal, Ministry of Industry and the DDCs. The section is organized into three parts as follows. First part identifies the sustainability elements in the MEDEP modality and its realization based on the findings of this study. Part 2 discusses the internalization of the model by partner organizations, particularly MOI, BDSPOs, DMEGAs and DDCs. Part 3 of this section presents perception of other development partners on the modality. 10.4.1 Sustainability elements in the model Of the six components, namely, (a) social mobilization, (b) entrepreneurship development, (c) access to financial services, (d) technical skills, (e) technology testing and transfer and (f) market linkages and business counseling seemingly contribute to the sustainability of the model. Furtherthe likelihood of sustainability of the model increases when two or three components are effectively combined. From the perspective of sustainability, the model can be rated high. However, inadequate integration of these components, limited access to financial services and weak market linkages and business counseling have left some weaknesses in the sustainability of the MEDEP modality (see Box 2). Absence of institutional development component in the modality has weakened the sustainability prospect. This has resulted into few linkages and coordination of the MErs with other actors

116
and stakeholders in the value chain. Most of the benefits/profits earned due to MEs have remained with the processors and traders and not equitably shared with the MEs involved in primary production. MErs’ awareness to improve the quality of the products and services remain. Lack of institutional development component and shifting the modality of operation from salary based full time EDFs to output contract based EDFs further aggravated the situation. Incorporation of the elements of good governance within MEGs, MEGAs, DMEGAs and BDSPOs were missing. Data in chapter 5 indicated that backward and forward linkages exist for 20 to 50% of the enterprises. By type of enterprises, most of the linkages were found among non-farm enterprises followed by food products and forest based. The lowest level of linkages was observed among agriculture based enterprises. Furthermore, this study found a large majority of MErs (more than 90%) dependent on sole MEDEP for machinery, technical and capacity building support. Access of MErs to other service providers for micro-enterprise start and operation is very limited. 10.4.2 Internalization of the model by partner organizations FGDs and interactions with MEDEP’s key partner organizations at the central level namely the MOI and at the district level which include DDCs, BDSPOs, EDFs, and DMEGAs. NMEGA etc., revealed that these organizations have internalized the MEDEP model at satisfactory level. The strengths and weaknesses of the model as perceived by them are summarized below in table 10.6
Table 10.6: Strengths and Weaknesses of MEDEP Modality
Strengths Weaknesses
A demand based model
Priority to work in linkages, partnership and coordination with different organizations
Targeted poverty reduction programme which has emphasized gender equality and at least 60% participation of women
Priority to use local resources and facilities
Focused on enterprises that generates employment opportunities for unemployed youths
Support the livelihoods of the poor and excluded
Focused on professional and other institutional development of entrepreneurs
Inadequate facilitation for enhancing access of MErs to financial services
Inadequate services and support for ensuring market access for the MErs
Inadequate monitoring and supervision
Short-term contract (Three months)
Source: Field Consolations
Information in above table reveals that these organizations have internalized the model appropriately and are aware of its strengths and weaknesses. Despite BDSPOs, as professional non-profit making non-government organizations are likely to promote the modality but the extent of their support and comment is shaky for they will need to cast themselves as to the guidance and instructions of the project and funding agencies supporting them for micro-enterprise development. Yet, some components and key features of the modality as understood by them will they will continue to use and adapt, thereby reflecting increased long term capacities. The role of DDC, as local government and partner of MEDEP in the district, is very crucial. Discussions with Local Development Officers (LDOs)21 in different sample districts revealed that they have been closely monitoring the implementation of the programme. Although DDCs have difficulties in channelizing funds directly through BDSPOs without competitive bidding as per the provision of the Procurement Act of GON, they have been taking the
21
LDO is the Secretary of the DDC and at present LDO is acting as the Chairperson of the DDC in the absence of elected leader.

117
services of the BDSPOs by including those criteria in the selection process which will ensure the selection of MEDEP developed BDSPOs. Respondent LDOs were found fully aware of strengths and weaknesses of the model, particularly the decentralized service modality approach. They were convinced not only with the role of the MEs in poverty reduction but also usefulness of the MEDEP modality as one of the most appropriate modalities to promote microenterprises in Nepal. Yet, some questioned usefulness of the dual funding mechanism adopted by it- i.e. funding through DDC for the development of new enterprises and direct funding of MEDEP for the follow-up of the old enterprises. All DDCs have formulated Micro-Enterprise Development Guidelines as per the advice of MEDEP. The following four key activities ensures the sustainability prospect of the model within the DDC: (a) provision of the Enterprise Development Officer in the DDC (b) allocation of matching fund for the development of new microenterprises from the revenue of the district (c) issuance of Micro-Enterprise Development Operational Guidelines (d) chairing the District Enterprise Development Committee and undertaking the role of coordinator for MEs promotion in the district. In short, DDCs have fully internalized the model, Therefore, even if scale of programme could decrease due to the inadequacy of funding after the termination of MEDEP, MEDEP’s modality of micro-enterprise development has been and will remain an important increase in local organizations capabilities. 10.4.3 Use of MEDEP modality by other development partners Many development partners and government organizations engaged in the promotion of MEs were aware of MEDEP modality. But they mixed perceptions and were not fully aware of the key features of the MEDEP modality and the processes followed. Aid agencies such as AusAid, NZAid and DFID appreciated the model and partnered with UNDP during the part of second and third phase. Box 10.3 presents a few statements about the MEDEP modality as perceived by them.
Box 10.3: MEDEP model as perceived by others22
“MEDEP model is focused on helping poor and excluded to identify their latent entrepreneurial skills good.” “At least 9 months to one year will be required to start MEs. It is time taking. For quick results, MEDEP model may not be appropriate.” “Adoption of the model is costly. It is generally suited for standalone micro-enterprise development initiatives.” “The model is focused more on training and technical services rather than material support.” “Provision of CFC is a brilliant idea.” “Social mobilization component is weak in MEDEP model.” “ The model is demanding in terms of follow-up and constant supervision and services.” “Support for marketing aspect is weak and market linkages have not been appropriately emphasized in the model.” “The model is focused on too many products and services. There are no products and services which could identified/personalised to MEDEP.”
As seen from the above, some perceptions are close to MEDEP model and others may not apply to it. A few seemed to be based on just hearsay. However, what has been evident from the above statements is that MEDEP has been able to make development agencies aware about the model. However, none of these agencies can use the MEDEP model in totality. They are likely to adopt some of its best parts or lessons learned.
22
This includes agencies other than MEDEP’s partners such as Women Development Office.

118
10.5 Impact This section assesses impact of MEDEP modality. Since socio-economic impact, poverty reduction, impact on food security and other unintended impacts such as contribution to MDGs have already been presented in earlier chapters, this section assesses its impact on the following three areas: (a) Policy influence (b) Institutional impact (c) Contribution to peace and conflict mitigation
All of above three impacts are indirect and positive impacts of MEDEP. Despite of several difficulties to bring hardcore poor and/or socially/geographically excluded into the mainstream of enterprise development, MEDEP’s performance has remained encouraging. Credit for this goes to its modality although there needs improvements in its modality so that achievements could be further increased, intensified and sustained longer with lowering of dropout rate. 10.5.1 Policy influence MEDEP’s persistent efforts and technical backstopping for almost nine years led the government to formulate a Micro Enterprise Policy (MEP) in 2007, and later to include micro-enterprise as a distinct category of industry in Industrial Policy 2010. Prior to this, MEDEP and other agencies had their own definitions of micro-enterprise. Most of the agencies then tended to equate MEs with income generating activities. Impact of MEDEP to policy discourse has been assessed at three levels namely (a) macro (b) meso and (c) micro. Macro Level: MEDEP has been successful in making the government to recognize that micro-enterprises belong to a different category of industries and therefore required different intervention approach, methodology and targeting. In addition, the programme has been successful to raise a high level of awareness on importance and contribution of the micro-enterprises to poverty reduction and employment generation, particularly in rural areas where opportunities are very limited. Poverty Reduction Strategy Paper (10th Plan) and the successive Three Year Plans have recognized micro-enterprise as one of the effective tools for poverty reduction and accorded priority to it. In addition, it was reported that the programme has influenced the formulation of Microfinance Policy 2008. Industrial Policy has depicted several assistance and support which will be available to the MErs from the part of the government and that it has raised the issue of registration of MEs by the VDC.
The National Planning Commission/GoN has also made a declaration of support to the programme through the priority accorded to micro-enterprise sector in the Tenth Five-Year Plan (2002-07) and the Three Year Plans formulated thereafter.
Meso/Implementation Level: In addition to making macro level impacts as described above, MEDEP has made key meso level impacts. The programme contributed in the formulation of District Enterprise Development Programme Guidelines which is major contribution to the micro-enterprise sector. Likewise, through this program Micro-Enterprise Development Fund has been established in 31 districts. MEDEP has also influenced the planning and implementation of local bodies where it has ensured the contribution of the DDCs to the micro-enterprise development as an effort for poverty reduction.

119
Micro (Grassroots level): Apart from micro and meso level impacts, some of the micro level impacts of MEDEP has also been started to emerge. Recognizing the contribution of microenterprise to the overall livelihoods of the poor people, some VDCs have started to allocate a part of their grant fund to micro-enterprises. 10.5.2 Institutional impact After the completion of the first phase in 2003, bilateral donors, namely the United Kingdom’s Department for International Development (DFID), New Zealand Aid (NZAID) and Australian Aid (AUSAID) joined the collaborative effort of the GoN and the UNDP because of the potential of micro-enterprise to contribute to poverty reduction, the overriding goal of the country, and employment generation and because of MEDEP’s successes with its integrated market-driven approach to micro-enterprise development. Establishment of Institutions: Impact of MEDEP to institutional development has been remarkable. It has been successful in the establishment of many institutions at different levels. At the settlement level more than 4,000 Micro enterprise Groups (MEGs) are currently functional whereas about 300 Micro Enterprise Group Associations (MEGA) at the rate of eight to ten per district are functional in 36 districts at the market centre level. In the entire 36 MEDEP districts, institutions such as District Micro-enterprise Group Association (DMEGA) and Business Development Service Provider Organization (BDSPO) have been successfully established. Likewise all DDCs have established Enterprise Development Unit (EDU) within them. District Enterprise Development Committee (DEDC) has been formed and are operational in all the 36 districts under the leadership of the DDC Chairman. At the national level, an apex association overseeing the overall micro enterprise development in the country namely N-MEGA has been established. A separate association of BDSPOs has also been successfully formed. In addition, a separate Micro-Enterprise Unit (MEU) in MOI and Cottage and Small Industry Development Board /DCSI has been established. Despite of missing institutional development component, MEDEP has created many institutions which will continue to operate and promote micro-enterprises in the foreseeable future. Performance and Institutional sustainability: Despite larger impact of MEDEP in creating institutions, performance and sustainability of these institutions has not been very promising. Several issues remain regarding their participation, awareness, service delivery mechanism and capacity. MEGs have been mostly occupied in saving and credit activities while operating enterprises has been second priority. Sharing of experiences and networking is often inadequate. Participation of representatives of MEGs in MEGAs is poor and most of MEGAs are not operating as intended. In some districts the capacity of BDSPOs to deliver business development services has been questioned. Likewise, there seems to be gap in the awareness regarding the importance of MEGAs among many MEG members and the capacity of DMEGA to assist MEs has been poorly developed. Delivering quality and demand based services through the MEGAs is difficult at MEGA level because EDFs operating at market centre level lack necessary skills and experiences. There is a high turnover of EDFs and the present contract based financing system tied up with activity does not motivate them. Membership of DMEGAs is limited and formed by MErs supported by MEDEP only. DMEGAs and NMEGA have not moved towards generating resource generation. 10.5.3 Contribution to peace and conflict mitigation Nepal has been adversely affected by a long ten years conflict caused by persistent disparities and discriminations in the social, economic and cultural spheres. The conflict not only necessitated the diversion of resources away from development, but also ruined the limited infrastructure base of the already battered economy. Despite the purpose of MEDEP was neither peace building nor conflict mitigation, evidence reveals that its inclusive
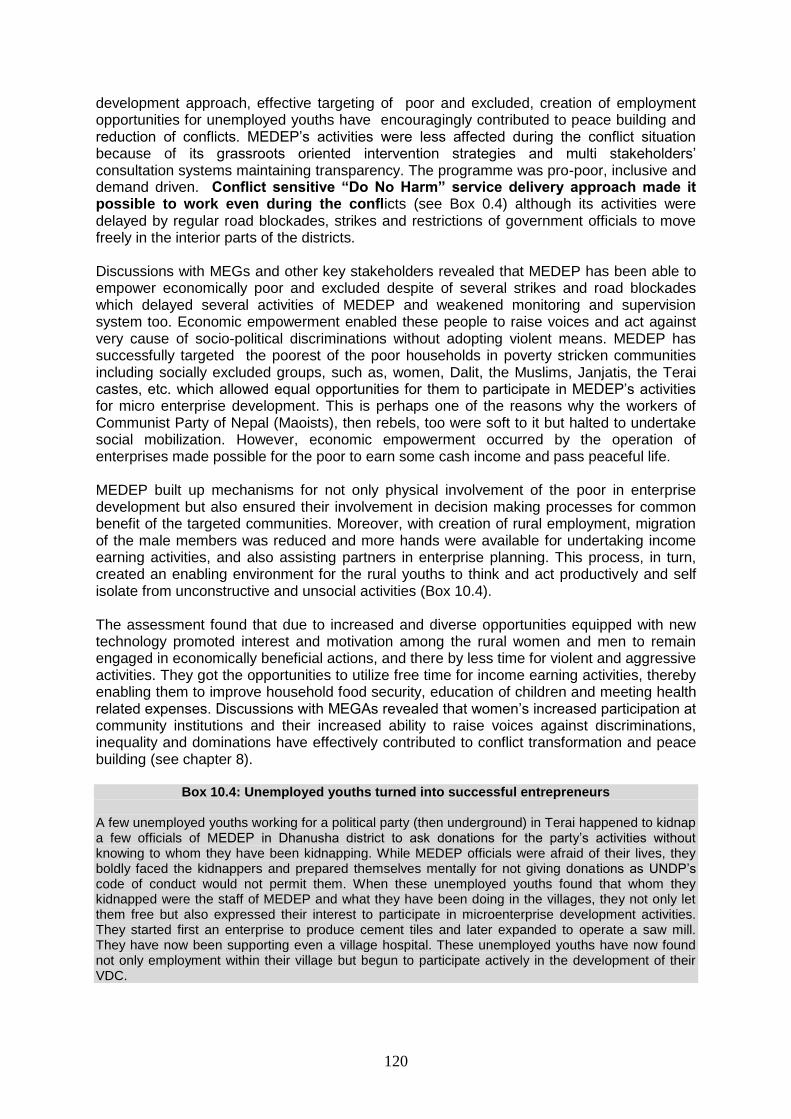
120
development approach, effective targeting of poor and excluded, creation of employment opportunities for unemployed youths have encouragingly contributed to peace building and reduction of conflicts. MEDEP’s activities were less affected during the conflict situation because of its grassroots oriented intervention strategies and multi stakeholders’ consultation systems maintaining transparency. The programme was pro-poor, inclusive and demand driven. Conflict sensitive “Do No Harm” service delivery approach made it possible to work even during the conflicts (see Box 0.4) although its activities were delayed by regular road blockades, strikes and restrictions of government officials to move freely in the interior parts of the districts. Discussions with MEGs and other key stakeholders revealed that MEDEP has been able to empower economically poor and excluded despite of several strikes and road blockades which delayed several activities of MEDEP and weakened monitoring and supervision system too. Economic empowerment enabled these people to raise voices and act against very cause of socio-political discriminations without adopting violent means. MEDEP has successfully targeted the poorest of the poor households in poverty stricken communities including socially excluded groups, such as, women, Dalit, the Muslims, Janjatis, the Terai castes, etc. which allowed equal opportunities for them to participate in MEDEP’s activities for micro enterprise development. This is perhaps one of the reasons why the workers of Communist Party of Nepal (Maoists), then rebels, too were soft to it but halted to undertake social mobilization. However, economic empowerment occurred by the operation of enterprises made possible for the poor to earn some cash income and pass peaceful life. MEDEP built up mechanisms for not only physical involvement of the poor in enterprise development but also ensured their involvement in decision making processes for common benefit of the targeted communities. Moreover, with creation of rural employment, migration of the male members was reduced and more hands were available for undertaking income earning activities, and also assisting partners in enterprise planning. This process, in turn, created an enabling environment for the rural youths to think and act productively and self isolate from unconstructive and unsocial activities (Box 10.4). The assessment found that due to increased and diverse opportunities equipped with new technology promoted interest and motivation among the rural women and men to remain engaged in economically beneficial actions, and there by less time for violent and aggressive activities. They got the opportunities to utilize free time for income earning activities, thereby enabling them to improve household food security, education of children and meeting health related expenses. Discussions with MEGAs revealed that women’s increased participation at community institutions and their increased ability to raise voices against discriminations, inequality and dominations have effectively contributed to conflict transformation and peace building (see chapter 8).
Box 10.4: Unemployed youths turned into successful entrepreneurs A few unemployed youths working for a political party (then underground) in Terai happened to kidnap a few officials of MEDEP in Dhanusha district to ask donations for the party’s activities without knowing to whom they have been kidnapping. While MEDEP officials were afraid of their lives, they boldly faced the kidnappers and prepared themselves mentally for not giving donations as UNDP’s code of conduct would not permit them. When these unemployed youths found that whom they kidnapped were the staff of MEDEP and what they have been doing in the villages, they not only let them free but also expressed their interest to participate in microenterprise development activities. They started first an enterprise to produce cement tiles and later expanded to operate a saw mill. They have now been supporting even a village hospital. These unemployed youths have now found not only employment within their village but begun to participate actively in the development of their VDC.

121
As MEDEP targeted directly at women MErs from the excluded caste groups, women from indigenous (janajatis), Dalit, Muslims, Terai and other excluded caste groups are visibly holding higher socio-economic status within their family and communities. This, in turn, has contributed to peace building process. The program helped to reduce migration of the rural adults by providing an enabling environment for them to live a quality life with human dignity (see chapter 6). Focus of youth employment was one of the key factors which is reported to have contributed to peace process. While there is no specific studies which were carried out to assess contribution of MEDEP to peace process, available information and evidence show that MEDEP has, indeed, contributed to conflict mitigation and peace process. It has successfully reached out and supported civil society organizations which have a presence in, and the trust of, poor communities and vulnerable sections of society.

122
11 SUMMARY, CONCLUSIONS AND RECOMMENDATIONS Micro-Enterprise Development Programme (MEDEP) is a flagship enterprise promotion programme of the Government of Nepal (GON) and United Nations Development Programme (UNDP). It was initiated 12 years ago in 1988 targeting the poor and excluded as a stand-alone micro-enterprise development initiative. During the course of implementation, other bilateral donors namely, AusAid, DFID and NZAid have joined the GON and UNDP. This impact assessment study was carried out to systematically analyse the changes brought about by it in the socio-economic conditions and livelihoods of its beneficiaries and to know how its beneficiaries have benefited by operating micro-enterprises. This study covers first 10 years period which is comprised of first phase (1998-2003) and second phase (2003-2007). It was carried out in 9 districts (Parbat, Nawalparasi, Dhanusa, Pyuthan, Dang, Sindhupalchowk, Udayapur, Kavre Planchowk and Kailali) representing first and second phases. This chapter summarizes key findings, draws conclusions and provides recommendations for further improvements of the micro-enterprise development programmes in the future and successful handing over the achievements and lessons learned of MEDEP to the GON for their sustainability and further upgrading. This chapter is organized into four sections namely summary of findings, key conclusions,strategic responses of entrepreneurs to address issues and challenges and finally recommendations. For the purpose of assessing the impact of MEDEP, micro-enterprises promoted by this programme were categorized into 5 categories, namely, (a) agro-based (primary production), (b) forest product based (primary production and value addition), (c) food products and beverages (value addition) (d) services and (e) non-farm/others. Impacts were analysed by gender and ethnicity of the respondents.
11.1 Summary of Findings The following summarizes the key findings of the study. Profile of participants and non-participants
Subsistence agriculture is the main-occupation of both MEDEP participants and non-participants.
Compared to non-participants, a higher proportion of MEDEP participants are involved in business than non-participants.
Profile of 832 participant respondents shows that 64% of of them have private enterprises, 12% members in group enterprises, four percent are employed in enterprises of other MEDEP participants, and 20% did not have enterprises at survey period.
The proportion of employees in non-farm (others) type of enterprises is highest (10.1%) followed by forest based products (6.3%), service (7.8%) and food products (5.9%).
A higher proportion of men (54%) reported operating enterprises prior to MEDEP support than women (34.5%) suggesting that a larger percentage of women have got an opportunity through MEDEP to start enterprises.
Proportion of MEDEP participants operating no enterprises is highest among Dalit followed by BCTS, others and Janjatis. Likewise, among the sex, the proportion of women not operating any enterprise is higher than men.
Enterprise Analysis
Overall, more than 95% respondents have received at least one training, and over 80% have received three or more trainings.

123
The proportion of respondents reporting to have received any support from MEDEP ranged between 15 to 39%. A higher proportion of entrepreneurs from group enterprises have received MEDEP’s support in all areas including machinery, credit, CFC services, and sale of produce, packaging, quality control and trade compared to individual entrepreneurs.
Group enterprises have been successful to establish more linkages with other actor actors and stakeholders than individual enterprises.
Generally, operation of MEs has not been constrained by the supply of raw materials. More men owned enterprises and BCTS have received support of other agencies for raw materials.
A higher proportion of food products enterprises used improved technologies followed by service enterprise, agriculture, non-farm and forest. Men entrepreneurs have greater access to improved technology than women.
There is a evidence of increased inclusion, as women and Dalit show a higher linkage to markets as compared to men and other ethnic categories.
Among the enterprises, the highest average profit making enterprise is service followed by food products, non-farm, forest based and agriculture.
Individual HH or entrepreneurs often operate year-round businesses and employ themselves, whereas group businesses could be seasonal and workers tend to get seasonal or casual employment.
Almost all entrepreneurs (96%) have invested in enterprises. However, group enterprises have invested primarlity in fixed capital , and less in working capital. The average investment of private enterprises was Rs. 19,875 at the start.
Enterprises started by MEDEP show that almost all are profit making, with return on investment ranging from 71% to 157%. This is a significant achievement. However, employment creation has not reached the same levels. It also points to a possible location and market constraint, in remote and poorer regions, which are prioritised by MEDEP.
Of those who are operating the enterprises, nearly one fifth have either changed or diversified enterprises. A larger percentage of individual enterprises (22%) have diversified enterprises compared to group enterprises.
Men and relatively advantageous group have been able to diversify the enterprises compared to women and backward castes, like Dalit.
Proportion of Dalit reporting improvements in labour productivity, production capacity and cost of production was high compared to other caste/ethnic groups.
Overall, individual entrepreneurs were employed for 254 days per year per enterprise and group enterprises created employment of 128 days per HH per year. The average number of HH members engaged in the sample HHs was 2.2 with contribution of 229 person days of employment per HH per year.
While all groups agreed that the group is very important for them and it has provided a good platform for them to share experiences and to pass their problems and constraints to MEDEP through BDSPOs, DMEGAs and EDFs, current activities performed by groups were found limited and they were not meeting regularly due to weak social mobilization and monitoring. Saving and credit activities have appear as one of the key activities of the groups, binding them together, and responsible for their continued relevance.
80% MEs are self financed, with only 20% borrow from MEGs, Savings and credit groups, cooperatives, NGOs, MFIs, friends, relatives or money lenders. A higher proportion of Janjati (85.1%) and BCTS (83.1%) are self financed compared to Dalit (75.1%). Proportion of men entrepreneurs borrowing from cooperatives was higher than that of women.
A larger proportion of employment was created by men entrepreneurs than women entrepreneurs (268 person days days per HH per year by men vs 214 days).

124
Overall, less than 50% feel that MEDEP’s market related services is adequate. Only 21 percent of respondents felt that they have been receiving adequate assistance from MEDEP to sustain their enterprises.
On an average an entrepreneuer earned Rs. 91,161 per year and expended and expended Rs 44,123 with average profit of 53,029.00.
Socio-economic Impact at HH level
Proportion of HHs owning houses has increased among both participant and non-participants. While the increase is larger among non-participants, proportion of participants owning HHs after P participation has increased significantly than non-participants at present.
Janajati and BCTS have shown an overall higher level of ownership of houses, but Dalit show a higher net change, showing that MEDEP made a positive contribution to participants, also compared to the non participants, who could not achieve a positive change in house ownership.
Proportion of Dalit reporting improvements in labour productivity, production capacity and cost of production was high compared to other caste/ethnic groups suggesting that they too can benefit equitably from the use of improved and modern technologies if they get opportunities as has been provided by MEDEP.
4 out of 5 MEDEP participants have currently access to drinking water and that the proportion of HHs with access to taps after MEDEP participation has increased compared to situation before MEDEP.
Before MEDEP intervention, 60% HHs (3 out of 5 HHs) had toilets which increased to almost 79% after intervention (4 out of 5 HHs); 90.5% participant HHs had land with average land holding size of 0.52 Ha which has now increased to 94.1% with average land holding size of 0.57 Ha; 74% women participant HHs owned any livestock which has now increased to 85.8% and 1% participant HHs (1 out of 5) were members in water related groups which has now increased to 34.1%.
Prior to MEDEP intervention, 30.6% participant HHs (1 out of 3) were members in community organizations which, at present, has increased to 64.7%; 25.6% participant HHs were members in saving and credit groups which has increased to 78.7%; average monthly saving has increased to more than Rs. 250.00 from that of just Rs. 12.00 per HH and increased confidence in loan repayment capacity.
Literacy among MEDEP participants just rose 3.4%, less than the 4.2 percent increases among non-participants.
Income of both participant and non-participants has increased but increases among participants is more than 5 times than non participants with per capita income of participants and non-participants reached to Rs 26,961 and Rs. 12,514.00 while that of non-participants. The difference between two groups at present is 117%.
A large majority of investment of income earned from enterprises goes to household expense (followed by reinvestment in enterprise, children education and land. This means that higher the income earned, higher will be the opportunities for children to receive better education.
Before MEDEP, on average, participants had sufficient food for 3.6 months which increased to 5.8 months with net increase of 2.2 months and increases in number of food sufficient months have been largest among Janajati followed by Dalit, other TC and BCTS..
The proportion of non-participants who reported at least one migrant from their HH members has increased for both participants and non-participants but the increase among non-participants is much higher at 30.1% compared to participants (12.5%).
Before MEDEP intervention, about 14% to 25% to (less than one in four) participants reported that could cope with selected vulnerability indicators (shocks and stresses) which have now increased to 39 to 63%.

125
Impact at Individual Level (Empowerment)
Survey results showed participants and non-participants significantly different from each other in terms (a) participation in the HH decisions (b) participation in economic decisions (c) participation in community institutions (d) access to saving (group and cooperatives (e) investment in share and equity (cooperatives’ and banks) (f) ability to claim better and timely services from the public and private sector service providers (g) awareness on legal rights and property issues (h) participation in public protests and rallies against social discriminations and practices including drinking alcohol and gambling public places, untouchability, stopping Dalit to enter temples and drink water from the same taps and (i) raise voices and act against gender violence’s and discrimination.
Impacts at Gender Equality and Social Inclusion
The proportion of women participants owning different types of assets considered in this study, namely land, house, bank balance/saving and holding share/equity in cooperatives has increased compared to men after intervention.
Perception of both participants and non-participants as important income earner has increased, and the increase among participants is higher than non-participants. Among ethnicity, highest increase in the perception as important income earner was perceived by Janjatis (13.7%).
Women’s participation in both household and economic decisions has increased after participation in MEDEP. Among HH decisions, a larger proportion of women reported to have increased their decision making roles in grocery purchases, clothing and reapir of houses than men. Of the different types of economic decisions where the net difference between participants and non-participant women were high, the highest increase was found for saving in groups followed by selling of products and services, selection of IGAs/enterprises and accessing credits/loans.
Access of women and socially excluded people such a Dalit, Janajati and other Terai caste to all public services and resources has increased after participation in MEDEP.
A larger proportion of women (15.5%) have reported to have increased their capacity to organize and protest against gender violence and social discriminations than non-participants and men. Of these, the largest increase was observed in their capacity to raise voices and claim equal pay against low wage/differential wage rate between men and women for work of equal value.
The proportion of both participants and non-participants who are aware of their rights and have the capacity to use them appropriately has increased among both participants and non-participants but the increase among participants was higher than non-participants.
The key reasons for dropping enterprises across all types of entrepreneurs except BCTS who can take more risks than other groups are fewer profit margins, followed by lack of technical support, lack of knowledge and skills, and financial services.
Contribution to MDGs
The survey results show that nearly three fourth of the participants households have moved out of the poverty (73.1%). Poverty impact has been larger for BCTS (80.5%) and women. The contribution of MEDEP to poverty reduction is higher among women, Dalit and other Terai caste.
More than three fourth of participants have moved out of poverty irrespective of caste and gender while such proportion ranges between 22.2 to 65.9% among non-participants.
MEDEP has contributed to poverty reduction by almost 30% among its beneficiaries.
The net enrollment rate in primary education has increased among participants irrespective of ethnicity and gender while there was mixed results among non-participants.

126
Proportion of non-participant Dalit sending their primary school aged children to primary school was higher than non-participants suggesting likelihood of the contribution of other factors such as scholarships available to Dalit than MEDEP’s participation.
The ratio of literate women to men aged 15–24 years old has increased among both participants non-participants but the increase is larger among participants.
The ratio of the girl to boy in primary education has improved among both the participants and non-participants with increment of 5.3% and 2.2% respectively with significant contribution to enrollment of girls in primary education.
The ratio of girls to boys in secondary and tertiary education has increased among both participants and non-participants while the increase among participants is larger.
The share of women in the wage employment in the non-agricultural sector has increased among both the groups, with a higher increase among MEDEP participants.
Before MEDEP intervention, 10.9% of women were involved in non-agricultural sector which has now increased to 22.8%.
The awareness on HIV/AIDs has increased among both participants and non-participants across different ethnic/caste groups and gender. Increases are higher among participants compared to non-participants in all ethnic groups except for other Terai caste.
Use of wood as main fuel has decreased among both groups with the reduction being higher among participants.
Assessment of MEDEP Modality
When a large majority of the P and E joined MEDEP, they had income of less than two third of the poverty line and remaining were below the poverty line, by 2010, they have successful micro-enterprises in a sector of their choice. Of sampled MEs, 80% are operational at present. Of these, 69% operate all year-round, 30% are seasonal and 0.9% are casual.
Data above show that the key reasons for dropping enterprises across all types of entrepreneurs except BCTS who can take more risks than other groups are fewer profit margins, followed by lack of technical support, lack of knowledge and skills, and financial services.
There is a need for the MEDEP to revisit its component regarding financial services. This component has not performed as anticipated.
Most of the respondent participants perceived assistance receiving from MEDEP through their respective BDSPOs and DMEGAs in the areas of market linkages and business counseling are not adequate. Support to individuals missed a value chain approach.
While all six components (social mobilization, enterprereneurship development, access to finance, technical skills development, appropriate technological testing and transfer, market linkages and business counseling) are equally important, their integration is necessary for synergistic performance. But evidence reveals that this has not happened as anticipated.
The average cost of entrepreneurship development of MEDEP is Rs. 31,010.00 at present price. This is almost equal to the value of increase in the entrepreneur’s. One year annual income.
The coverage of MEs by EDFs and supervisory staff have increased by two and two and half times respectively in the second phase compared to the first phase.
Most of the benefits/profits earned due to MEs have remained with the processors and traders and not equitably shared with the MEs involved in primary production. MErs’ awareness to improve the quality of the products and services remain. Lack of institutional development component and shifting the modality of operation from

127
salary based full time EDFs to output- contract based EDFs puts question mark on the sustainability of the modality.
A large majority of MErs (more than 90%) are dependent on sole MEDEP for machinery, technical and capacity building support. Access of MErs to other service providers for micro-enterprise start and operation is very limited.
All key district partners (DDCs, BDSPOs, DMEGAs) are aware of modality’s strengths and weaknesses.
Other development partners and agencies are aware of MEDEP modality. Even when they would not be able to adopt whole the modality in package, they would adapt and take good lessons in their programmes based on the inclusion of micro-enterprise component.
Policy and institutional Impact
MEDEP’s persistent efforts and technical backstopping for almost nine years led the government to formulate a Micro Enterprise Policy (MEP) in 2007, and later to include micro-enterprise as a distinct category of industry in Industrial Policy 2010.
MEDEP has been successful to facilitate the creation of several institutions at different level starting from more than 4,000 Micro enterprise Groups (MEGs) at settlement level to MEGA at market centre, DMEGA, BDSPOs and SAUGAT GRIHA at districts and NMEGA at Kathmandu. A separate association of BDSPOs has also been successfully formed.A separate Micro-Enterprise Unit (MEU) has been established in MOI and Cottage and Small Industry Development Board /DCSI.
Contribution to peace and conflict mitigation
MEDEP’s activities were less affected during the conflict situation because of its grassroots oriented intervention strategies and multi stakeholders’ consultation systems maintaining transparency. The programme was pro-poor, inclusive and demand driven. Conflict sensitive “Do No Harm” service delivery approach made it possible to work even during the conflicts although its activities were delayed by regular road blockades, strikes and restrictions of government officials to move freely in the interior parts of the districts.
Discussions with MEGAs revealed that women’s increased participation at community institutions and their increased ability to raise voices against discriminations, inequality and dominations have effectively contributed to conflict transformation and peace building
11.2 Conclusions Employment, poverty reduction and livelihoods
More employment can be created when micro enterprise development programmes promotes enterprises like non-farm, food products, and forest based, all of which have a high potential for value addition. The likelihood of generating employment through enterprises like agriculture and service is less.
The proportion of participants diversifying their enterprises is relatively higher among agriculture entrepreneurs followed by service.
Of the total income among participants, share of enterprise is highest. A higher proportion of participants have moved to higher income ranges than non-participants.
MEDEP’s contribution to increases in ownership of houses, improvements in roofing material; quality of floor, access to safe and drinking water, improvements in sanitation, access to electricity, access to physical assets, ownership of livestock, participation in community forestry groups is both positive and significant.
MEDEP intervention increased the proportion of HHs using electricity; average monthly saving in groups and cooperatives and perception of increase in bankability and negotiating skills.

128
Access of participants to community organizations has increased significantly.
The number of months of food sufficiency has increased for both participants and non-participants. However, the increase was significantly higher among participants.
MEDEP did not contribute to increase migration but, in fact, it might have lowered/reduced the probability of migration.
Intervention approach and methodology
Since women have lower level of knowledge and skills regarding business operation, greater attention is needed from programme interventions to impart vocational and business skills to women. MEs focused initiatives may need to follow different intervention approach and methodology.
As most of the enterprises have not reached the same levels, there is a high possibility of increasing level of operations.
Likelihood of enterprise diversification and changing is high among individual enterprises than group enterprises.
Group enterprises establish more linkages with other actor actors and stakeholders than individual enterprises
With time, entrepreneurs are able to develop the confidence and ability to add new business and switch sectors.
Gender equality band social inclusion
Empowerment level of Dalit and other caste Terai persons, especially women, have been improved as a result of their participation in MEDEP and that they have been able to seek services from others.
Socially excluded groups like Dalit, ethnic groups and other Terai caste people as well can benefit equitably from the use of improved and modern technologies if they too get opportunities as has been provided by MEDEP.
There is mixed results for MEDEP’s contribution to change in the proportion of HHs having land in terms of ethnicity.
By gender, proportion of change in land ownership due to MEDEP intervention was positive among both women and men, with men showing a higher propensity to acquire land as compared to women.
There is a movement towards greater equity, with Dalit showing higher proportion of physical and livestock assets accumulation than BCTS.
MEDEP’s intervention has changed the rules of the game by increasing the proportion of women in decision making positions in forestry, water related groups and community organizations..
The proportion of participants saving in groups and cooperatives has increased significantly, with the largest increase observed among Dalit in groups and cooperatives.
PCI of all categories and types of participant and non-participant HHs have increased with larger increase among women entrepreneurs. By ethnicity, increases were highest among BCTS followed by Janajati, other TCs and Dalit.
Higher proportion of other Terai caste people and Dalit have benefitted from MEDEP’s intervention than BCTS.
The level of public awakening of participants is substantially higher than that of non-participant.
The net difference in empowerment level between the two groups, participants and non-participants, in terms of their situation before and at present is significant.
The role of women entrepreneurs has constantly been improved as currently there is an increased representation of women entrepreneurs in community institutions, such as, Community Forestry Users Groups (CFUGs), Drinking Water Management Groups (DWMGs), cooperatives and saving and credit groups. Yet representation of

129
women at decision making positions at community institutions is lower than men entrepreneurs.
Gender sensitive interventions by MEDEP have created many individual success cases for women from the poor and vulnerable communities of being enabled to lead a life of human dignity.
MEDEP has been successful to overcome major institutional, social and economic barriers and constraints in enhancing opportunities for disadvantaged women and socially excluded people to participate economic opportunities.
From social inclusion dimension, MEDEP is inclusive and provided more opportunities for Dalit, Janjatis and other Terai caste people to participate in the micro-enterprise development programmes.
The participation of women participants in CBOs and political parties have increased more than non participants and men.
MEDEP has made significant contribution to increase in capacity of participants to demand better and timely services from local government organizations.
Capacity of women and Dalit to organize themselves and protest against gender violence and social discrimination has increased significantly.
Targeted microenterprise development programme can significantly contribute to poverty reduction, particularly among women entrepreneur HHs and Dalit.
Participation in microenterprises can increase women’s access to wage employment in non-agriculture sector
Participation in MEDEP activities has improved the living standard and well being of the beneficiaries particularly that of the people below the poverty line and disadvantaged groups like Dalit, Janajati and other Terai caste.
MEDEP Modality
As a stand-alone micro-enterprise development programme, MEDEP can be considered as one of the most successful development initiatives implemented by GON in partnership with UNDP and other development partners including AusAId, NZAid and DFID between 1998 and 2008. It has been quite successful in assisting very poor and excluded people to identify their entrepreneurial skills by themselves and later to help them select appropriate enterprises and operate them successfully.
The MEDEP modality has been found very useful, and acknowledged as such by all government departments who engage with its implementation.
Key success factors of MEDEP modality are (a) focused on assisting people to identify latent entrepreneurial skills by themselves (entrepreneurship development, rather than enterprise development/establishment) (b) Targeting and selection of the poor (c) group approach to enterprise promotion (d) No rush and no pressure and (e) Professional/ technical advice and supervision of the grass roots service providers from APSOs and MEDEP.
Results would have been further invigorating if the programme would not have been constrained by conflicts, difficulties in delivering technical services and withdrawal of the ADB/N to provide financial services. These are some of the key factors that have impeded the effectiveness of the MEDEP to some extent.
There is a need to add other components, particularly institutional development component. In the absence of this crucial component, MEDEP has not been able to demonstrate the full potential of it’s ME development modality, despite the fact that it has produced encouraging results on the ground.
When looked MEDEP’s total cost over a period of ten years and the annual income earned by an entrepreneur, the cost is almost recovered in a year by the entrepreneur. The model is therefore cost-effective.
From the perspective of sustainability, the model can be rated high. However, inadequate integration of all six components, limited access to financial services and

130
weak market linkages and business counseling have left some weaknesses in the sustainability of the MEDEP modality.
MEDEP’s modality of micro-enterprise development has been and will remain an important increase in local organizations capabilities, even if scale of programme could decrease due to the inadequacy of funding after the termination of MEDEP.
Policy and Institutional Impact
MEDEP has been successful in making the government to recognize that micro-enterprises belong to a different category of industries and therefore required different intervention approach, methodology and targeting.
MEDEP has influenced the planning and implementation of local bodies and the need for them to promote ME development for poverty reduction, employment generation and inclusive development.
Impact of MEDEP to institutional development has been remarkable. Despite of missing institutional development component, MEDEP has created many institutions from the central to grassroots level which will continue to operate and promote micro-enterprises in the foreseeable future. Despite larger impact of MEDEP in creating institutions, performance and sustainability of these institutions has not been very promising
Contribution to peace and conflict mitigation
Despite the purpose of MEDEP was neither peace building nor conflict mitigation, evidence reveals that its inclusive development approach, effective targeting of poor and excluded, creation of employment opportunities for unemployed youths have encouragingly contributed to peace building and reduction of conflicts.
Economic empowerment occurred by the operation of enterprises made possible for the poor to earn some cash income and pass peaceful life.
With creation of rural employment, migration of the male members was reduced and more hands were available for undertaking income earning activities, and also assisting partners in enterprise planning. This process, in turn, created an enabling environment for the rural youths to think and act productively and self isolate from unconstructive and unsocial activities.
While there is no specific studies which were carried out to assess contribution of MEDEP to peace process, available information and evidence show that MEDEP has, indeed, contributed to conflict mitigation and peace process. It has successfully reached out and supported civil society organizations which have a presence in, and the trust of, poor communities and vulnerable sections of society
11.3 Recommendations This section provides a very few key recommendations only because each of the above findings, conclusions and participants responses could suggest several recommendations. Given that the programme has shown proof of concept, and to a certain extent the programme has been institutionalized, some key shifts need to be made A. Key Shifts in Focus The first key shift is that MEDEP must move from promoting entrepreneurs to building capacities of government departments to do so. As the programme scales up to cover 75 districts, the government will need support to find the human resources and systems to be able to implement and monitor the programme. MEDEP needs to work as a facilitator of the scale up.

131
Another major shift is to move from supporting all types of small enterprises, to adding a value chain perspective. It is likely that targeted poor households will choose a variety of enterprises, and MEDEP must continue to support these. In addition, MEDEP needs to identify and work along the value chains of some products with high potential of absorption of large number of entrepreneurs. B. Changes in Emphasis In the next phase, the emphasis needs to be on: Making the model more efficient and effective in terms of poverty outreach and employment generation: The model is very elaborate, and when it is replicated, will need to be made more efficient, and adapted to the needs of different districts. In order to refine the model, it would be good to continue to engage with enterprise development work at least in a few districts. These could be remote hill districts, which lack infrastructure and employment opportunities, and where outreach to the poor is difficult. By working in these districts, MEDEP will learn lessons of reaching those excluded geographically or by social and ethnic characteristics. Incorporating support for growth and financial services: Another area where the model needs development is in assisting the entrepreneurs with the growth process. Attention to microfinance linkages also needs to be strengthened.
Providing demand oriented business development and financial services: Currently, BDS providers are supply oriented, with MEDEP project paying for their services. Instead, they need to be demand oriented. This will demand change in proposal-writing and contracting procedures, which need to get serious attention in the next phase. Developing a composition enterprise promotion strategy: Currently, enterprise development is primarily entrepreneur focused. The process involves BDSPOs identifying individuals/households living in poverty. The programme prioritises selection of preference for women and other excluded groups such as dalits, janajatis, and conflict affected people. Youth are given special attention. The entrepreneurs are taken through a process by which they identify the enterprise themselves, and MEDEP training is generic, for start-up, for existing enterprises and for growing businesses. As enterprise selection is based on entrepreneur preferences, local raw materials and markets, the types of enterprises are spread across multiple sectors. This makes demands on technical expertise to be provided by the promoting organizations. However, this may not be difficult and can be met under the MEDEP modality, which involves various departments and technical support agencies. Another approach is one of development of enterprises across a value chain, for products carefully selected in each district. This would allow the poor to hook in at different levels in the value chain, and may be a more efficient and effective approach if large numbers of entrepreneurs are concentrated around a few value chains. The risk in following the approach, however, is that enterprises up the value chain are more likelly to have entrepreneurs who are not the targeted poor. It is likely that while enterprise success percentage may improve, poverty focus may get lost. MEDEP is advised not to compromise the focus on excluded and BPL groups. In addition to following an entrepreneur focused enterprise promotion, a value chain approach can be built in some sectors. This means that in each district a couple of products will be identified for enterprise promotion across the value chain, and alongside entrepreneurs will also have a choice to select other types of enterprises based on their choice and needs. The details of how such combinations would be technically supported can be worked out in the first few months of next phase.

132
It is proposed that the first one year of the next phase be devoted to strategizing these aspects of enterprise development approach, so that the model can be refined in such a way that it offers variations. The model can differ to accommodate a variation in the location, which would imply a change in raw material availability as well as infrastructure and access to markets. Specific elements can be focused on women and Dalit, and technical support can be made more efficient and effective.
C. Organization Building
The success and sustainability of a programme beyond its intervention period is contingent on building organizations that will carry forward the agenda, and deliver the services and products needed by the target population. The organization building strategy needs to outline clearly three types of organizations:
(a) Community Based Organisations (CBOs): who will demand, and eventually pay for the services they need
(b) Government Organisations: who plan and guide the process of enterprise development in each district and rural market centre.
(c) BDS providers and other services providers such as DMEGAs and SAUGAT GRIHA: These need to eventually become sustainable based on a growing market of services needed by micro-entrepreneurs.
The key questions relating to organization building are: (a) At what levels should the organizations be built (village, market centre, district, and/
or national)? The vertical structures should be planned right from the beginning. This vertical structure is expected to give representation and identity to excluded groups, and to be effective, it also needs to link to other mainstream entrepreneur associations (FNCSI, FNCCI), so that the latter also take cognizance of the upcoming micro entrepreneurs.
(b) What should be their composition? Should the members be representatives of the collectives, or should they join in their individual capacities? The answers at each level are different, currently, causing confusion. If individuals purchase equity of an organization, then individuals should have voting rights, not institutional representatives. This consistency needs to be ensured. What should the mandates be, at each level? For instance: MEGs have a business mandate. MEGAs are at the level of a rural market centre, and each MEGA has 8 to 10 MEGs as members. They can serve collective business interests, and/or can be financial intermediaries. DMEGAs are formed at the district level, and NMEGAs at the national level. They undertake marketing of MEGA products through the ‘Saugat’ shops (supported by MEDEP). They can also serve an important leadership building role, and lobbying and advocacy for government support.
(c) What should be the human and financial resources needed for organization building? (d) What should be the sustainability strategy for these organizations? This would
required detailing the pathways for financial sustainability, human resources, and linkages with a wide range of organizations.
(e) Voice and representation for the CBOs is important to enable increased awareness and recognition of needs of micro-entrepreneurs by other stakeholders. The organisation development strategy will then enable the project to plan the investment needed for creating sustainable enterprise promotion structures at various levels in Nepal.

133
D. Policy Implementation
MEDEP earlier phases have worked with the government for the past twelve years to create a positive policy environment for micro enterprises. The implementation of policy, however, leaves a lot to be desired. The DEDCs have become important forums for strategizing district level enterprise promotion, with collaboration from various departments such as agriculture, forestry, cottage and small industries and the ministry of industry. The processes in DEDCs will need to be directed and supported till the collaborative arrangement becomes well established. Similarly, the role of the national level committee, NEDC will be different from the earlier phases, as it will move to supporting national level scale up, with greater attention paid to human resources development and deployment in the districts. E. Addressing finance Gaps
The supply of financial services is inadequate, whether they relate to savings, credit, insurance or remittances. This is more so in remote areas, where infrastructure is poor. Outreach to the poor is limited, and the terms and products are not appropriate for MEDEP participants. Finance is not available for enterprises in their growth phase. Financial services is another area where MEDEP programme needs to make strong demands, and contributions, for policy formulation. The appropriate models for serving the needs of remote, scattered and poverty-ridden households are those that allow them access to their own savings, and allow them to manage their own organizations, so that they have control over the decision making. The appropriate models include Self Reliant Groups (SRGs), cooperatives, Village Banks (VBs) and Village Savings and Loan Associations (VSLAs). The former three have been tried and found beneficial in Nepal, while the latter has been found useful in Bangladesh. These models of member owned organization, or Community Based Microfinance Organisations need to be promoted and tried with MEDEP clients. The programme will need to make links with existing UN projects related to financial services, to initiate pilots in various districts. The lessons for products, services and institutional forms that support pro-poor financial services need to be fed back at the policy level to create a link between practice and policy. F. Monitoring Tools: Gender and Social Exclusion Assessment Framework
The next phase of MEDEP needs to give special attention to planning impacts, and having a monitoring and impact assessment framework integrated right from the beginning. The Gender and Social Exclusion Framework provides a useful tool for planning the work of MEDEP IV, as well as development of indicators and tools for assessing impact on inclusion

134
References Asia Network for Sustainable Agriculture and Bioresources, “Influencing Policy and Good Governance in NRM Sector: Focusing on Community Forestry and NTFP Sub-sectors in Nepal” for Food and Agriculture Organization, Kathmandu, Nepal, (Internet downloand). Asian Development Bank, 1998, “Office of Environment and Social Development. Micro Enterprise Development: Not by Credit alone”, Manila, Philippines Bajacharya P. and K. Lama, 2007, “Scoping study of MEDEP Phase III,” A study carried out for MEDEP, Lalitpur, Nepal, (Unpublished). Binayee S. B., I. B. Sapkota, B. P. Subedi and L. Pun, 2004. Microfinance for Small Scale Tree and Forest Products Enterprises: Opportunities and Challenges for the Local Producers in Forestry Sector Nepal Microfinance Case Study” Kathmandu, Nepal. Centre for International Studies and Cooperative, 2007, “Effectiveness of Micro Finance Programme in the Western Hills of Nepal. Kathmandu, Nepal Centre for International Studies and Cooperative, 2008, “Micro-financing towards Empowerment of Disadvantaged Groups in Nepal: Innovations and Practices” Kathmandu, Nepal Dhakal, N., 2009, “Impact Study of Micro Finance in MEDEP: Final Report”, A study carried out by the Centre for Empowerment and Development (CED-Nepal) for MEDEP, Lalitpur, Nepal (Unpublished). District Development Committee, 2007, “The Micro-Enterprise Development Programme: Implementation Procedures and The Micro-Enterprise Development Fund Operation Manual”, Office of District Development Committee and Micro Enterprise Development Unit, Kathmandu, Nepal (Unpublished). Huntington R., P. Bajracharya, H. Thakali and H. P. Basyal, 2006, “Micro-Enterprise Development Programme (MEDEP) Phase II – Mid Term Review, A study carried out for MEDEP, Lalitpur, Nepal, (Unpublished). Institution for Sustainable Community Development, 2004, “A report on District Area Resource Potential, Social Economic and Market Survey in Sindhuli District”. for MEDEP Kathmandu, Nepal, (Unpublished). International Labour Organization, 2002, “Counselling Guide: Volume 1 (Nepali version)”, ILO with Assistance of UNDP, Adapted by Centre for Business Development (CBUD), Kathmandu, Nepal. International Labour Organization, 2002, “Counselling Guide: Volume 2 (Nepali version)”, ILO with Assistance of UNDP, Adapted by Centre for Business Development (CBUD), Kathmandu, Nepal. International Labour Organization, 2002, “Guide for Trainers (Nepali version)”, ILO with Assistance of UNDP, Adapted by Centre for Business Development (CBUD), Kathmandu, Nepal.
135
International Labour Organization, 2002, “Training of Existing Entrepreneurs: Volume 3 (Nepali version)”, ILO with Assistance of UNDP, Adapted by Centre for Business Development (CBUD), Kathmandu, Nepal. International Labour Organization, 2002, “Training of Growing Entrepreneurs: Volume 4 (Nepali version)”, ILO with Assistance of UNDP, Adapted by Centre for Business Development (CBUD), Kathmandu, Nepal. International Labour Organization, 2002, “Training of Potential Growing Entrepreneurs: Volume 1 (Nepali version)”, ILO with Assistance of UNDP, Adapted by Centre for Business Development (CBUD), Kathmandu, Nepal. International Labour Organization, 2002, “Training of Starting Entrepreneurs: Volume 2 (Nepali version)”, ILO with Assistance of UNDP, Adapted by Centre for Business Development (CBUD), Kathmandu, Nepal. Khatri-Chhetri J. B. and K. Karmacharya, 2003, “Micro and Small Enterprise Policy Review in Nepal – Survey of Micro and Small Enterprises Owners/Managers”, A study carried out for MEDEP, Lalitpur, Nepal, (Unpublished). Micro Enterprise Development Programme, 2008, “Micro-Enterprise Development Programmme (Phase 2), NEP/03/18 -Revised Document of the MEDEP”, Kathmandu, Nepal Micro Enterprise Development Programme, 2010, “Value Chain Based Approach to Micro-Enterprise Development Value Chain Analysis - Allo, Lalitpur, Nepal. NARMA Consultancy Private Limited, 2009, “Development of Income-generating Package” for MEDEP, Kathmandu, Nepal, (Unpublished). Nepal Australian Community Resources Management Project, 2002, “Micro Enterprises and Management Training Curriculum”. Kathmandu, Nepal Rai J., 2008 “Market Approach Strategy Micro-Enterprise Products and Retail Outlets (Focus on Marketing)” Kathmandu, Nepal, (Unpublished). Schreiner M. 2001 “ Micro enterprise in the First and Third Worlds” St. Louis, U.S.A. Sharma S. R, I. Koirala and V. Nepal, 1996, “Micro enterprises in Nepal: Dynamics, Prospects and Constraints”. A study carried out for MEDEP, Lalitpur, Nepal, (Unpublished). Shrestha N. “Empowerment of the poor through Micro-Enterprise Development in Nepal” Kathmandu, Nepal, (Internet downloand). United Nations Industrial Development Organization, 2002, “Industrial Development Perspective Plan: Vision 2020Project NC/NEP/00/009 Analytical Report" for Ministry of Industry, Commerce and Supplies, Kathmandu, Nepal. Wehnert U. and R. Shakya, 2001, “Are Small Farmers Co-operatives Ltd. (SFCLs) Viable Microfinance Organization? A Comprehensive Financial Analysis of 33 SFCLs”,. Kathmandu, Nepal.

136
Annexure 3.1: Sampling design and process
A Multi-stage sampling technique was used for selecting respondents from participants (treatment group) and non-participants (control group) to assess the impact of the programme. Attempts were made to have representation of all categories of entrepreneurs irrespective of caste, class, age and gender based on population probability to size. The study adopted recall method to construct baseline situation of both the treatment and control groups. Records of MEDEP survey were also used as far as possible to construct the baseline situation of treatment and control groups wherever possible.
Selection of respondents from treatment group (Participants)
Treatment group: Treatment group include those who have been reported as entrepreneurs by the MEDEP up to its phase II, i.e. 2007 December. Sample size: Sample size and sampling techniques are based on minimizing sampling error and maximizing sample performance to ensure precision and generalization of the survey results. The statistical formula used for this purpose is as follows:
NZ² p(1-p) n = (D) ----------------------, Nd
2 + Z
2 p (1-p)
Where, N = Number of the enterprises (21,740) n = required sample size z = z-score corresponding to the degree of confidence (1.96 since degree of confidence is 95 percent) p = estimated proportion of key indicators d = Minimum desired precision or maximum tolerable error expressed in decimal form (e.g 5 percent or 0. 05) D = Design effect (assumed to be 2, since sample are to be distributed by districts and then by market centers) While calculating the sample size, following assumptions has been made. An estimate proportion of the key indicator allows the sample size to be reduced. However,
no reasonably accurate estimate was found, Hence a default value of 50 percent was used, which offers a safe, albeit more expensive, alternative, as the value of 50 percent will yield the largest required sample size.
The conventional degree of confidence for almost all social research is 95 percent. Taking this into consideration, the study also uses the same confidence interval which yields the Z-value of 1.96.
Design effect for multi-stage sampling is the factor by which the sample size must be increased in order to produce survey estimates with the same precision as with a simple random sample. The design effect is assumed to be 2, since sample size was first distributed by districts and then by market centers.
Precision refers to the degree of error (or confidence interval) around the estimate since estimate is based on a sample. This is taken as 5 percent.
Taking above assumption into account, the sample size of the enterprises came to 760.
Sampling strategy: The study will follow multi-stage probability sampling design in selecting sample from treatment group. The sample size will be distributed by following sequential steps. .
Step I: Selection of entrepreneurs by category of enterprise and phase: MEDEP has been supporting following five categories of enterprises, which include (a) Agro-based (b) Forest based (c) Food and beverages (d) Service based (service providing and enterprises, repair services (e) Others (Chemical products, footwear and leather products, metal and engineering and non metallic mineral products). Table below presents number of entrepreneurs developed by MEDEP.

137
Sample size will be distributed by each sectors/sub-sectors and phase with a view to ensure proportionate representation of all categories of enterprises by phases. Therefore, samples will be distributed based on probability proportional to size (PPS) of the enterprises supported by the MEDEP. Table below distributes sample size by type of enterprises.
Type
Phase I Phase II Sample
size Number % Sample
size Number %
Sample size
Agriculture 1489 0.29 52 6757 0.41 236 288
Food products 1154 0.22 40 2367 0.14 83 123
Forest 746 0.14 26 3178 0.19 111 137
Others 585 0.11 20 1604 0.10 56 77
Service 1194 0.23 42 2666 0.16 93 135
Total 5,168 1.00 181 16572 1.00 579 760
Step II: Distribution of the entrepreneurs by district: After identification of number of entrepreneurs to be surveyed by each stratum, study distributed the number equally by districts while representing both the enterprise category and phases. However, sample size was increased by 10 percent for non-responses.
District Agriculture Food
products Forest Service Others Total
Phase I
Dang 20 20 40
Dhanusa 10 10 20 - 40
Nawalparasi 5 5 15 15 40
Parbat 5 15 10 10 40
Pyuthan 20 20 40
Sub-total 55 45 30 45 25 200
Phase II
Dang 35 5 - 5 5 50
Dhanusa 10 - 10 10 20 50
Kailali 30 10 20 15 15 90
Kavrepalanchowk 40 10 30 10 - 90
Nawalparasi 10 10 15 5 10 50
Parbat 15 15 - 10 10 50
Pyuthan 30 10 - - 10 50
Sindhupalchowk 35 10 15 15 15 90
Udayapur 15 20 25 5 20 90
Sub-total 220 90 115 75 105 610
Total 275 135 145 120 130 810
Step III: Mapping of the required number of entrepreneurs by market center of the district: MEDEP has divided districts into different market centres, so as to match resource potential, people’s needs and market demand for the products and services. The study selected three to five market center from each district. While selecting the market center, attempts were made to ensure fair representation of all type of micro-enterprises promoted by the programme. The study will map all the enterprenuers operating at the selected market centers. This provided sampling frame for selection of enterprenuers. Step IV: Selection of the entrepreneurs from each stratum: The sampling frame includes all entrepreneurs belonging at the selected market center. After identification of number of entrepreneurs to be surveyed from each stratum (step 2), the study selected required sample size randomly. After randomly selection of the enterprises, mapping against the caste and ethnic groups were carried out to ensure fair representation of entrepreneurs belonging to different caste and gender. Replacements

138
were made to ensure fair representation by gender and caste/ethnicity as far as possible (see table below)
Respondent categories Enterprenuers Sample size
Number Percent No %
Overall 21,740 100.0 832 100.0
A. Sex
Women 14494 66.7 586 70.4
Men 7246 33.3 246 29.6
B. Ethnicity
BCTS 5735 34.6 246 29.6
Dalit 3195 19.3 198 23.8
Janajati 6701 40.4 329 39.5
Other Terai caste group 942 5.7 59 7.1
When selected entrepreneur was not available during the survey, replacements were made from the same type and category of entrepreneurs. Sample replacement ranges between 15 to 25 percent in each of study district.
Selection of respondents from control group (Non-participants) Control group: Control group include those who had been identified as the pipeline entrepreneurs, (hereafter respondent) by the MEDEP but not yet to receive any support from MEDEP. The lists of person/households belonging to this category were also provided by the MEDEP district. The main reason for selecting the pipeline MErs is to establish control group with similar economic conditions as that of treatment group. Attempts will be made to select them within the studied market center.
Sample size: The study selected one fifth (20%) of the treatment group as the sample size for control group. Hence the study intended to survey 162 participants as control group from nine study districts. However, sample size was further increased by 10 percent.
Sampling strategy: The study followed multi-stage probability sampling design in selecting sample from control group. The sample size will be distributed by following sequential steps.
Step I: Stratification of the selected respondents by caste/ethnicity: After identification of number of respondents to be surveyed, sample size were distributed among the different caste/ethnic groups based on proportion of caste of the treatment groups, i.e. entrepreneurs.
Step II: Distribution of the respondents of each stratum by district: After identification of number of respondents to be surveyed by each stratum, i.e. by gender and caste/ethnicity, the sample was distributed among the study districts based on number of pipeline entrepreneurs (see below).
Step III: Randomly selection of respondents: Respondents were selected randomly from sampling frame while representing different caste and gender.

139
Annexure 5.1: Distribution of MEDEP Participants by Types of Training and Enterprise Category
(Percent)
Types of training Phase Enterprise Category
I II Agri Forest Service Food
products Non-farm
None
1. MECD 68.8 64.3 66.9 71.3 74.0 51.7 67.5 63.3
2. TOPE 76.0 92.1 88.1 94.8 96.1 69.8 92.5 90.4
3. TOSE 76.9 92.0 87.8 94.8 96.1 70.7 92.5 91.0
4. Skill 71.2 80.6 80.9 79.1 94.8 64.7 77.5 75.3
5. TOEE 35.6 54.5 58.3 51.3 59.7 36.2 52.5 38.0
6. TOGE 29.8 42.5 45.0 47.8 46.8 26.7 51.3 23.5
7. Business management 45.2 51.6 62.6 49.6 49.4 35.3 51.3 39.2
(Percent)
Number of training
Phase Type of enterprises
I II Agriculture Forest Service Food
products Non-farm
None
None 5.3 4.2 3.6 3.9 10.3 2.5 6.0 One 13.9 3.2 6.5 4.3 15.5 3.8 3.0 Two 11.1 7.7 4.0 12.2 1.3 12.1 13.8 12.0 Three 29.3 25.5 19.8 28.7 24.7 28.4 20.0 38.6 Four 13.5 17.5 18.7 10.4 27.3 13.8 15.0 14.5 Five 7.2 19.9 24.8 13.0 20.8 8.6 13.8 10.8 Six 19.7 22.1 22.7 31.3 22.1 11.2 31.3 15.1
Annexure 5.2: Distribution of Individual Enterprises by the Use of Technologies
(Percent)
Enterpreneurs
Respondents (Number)
New/Modern Improved Traditional
Individual 529 34.4 47.8 17.8
A. Enterprises categories
Agriculture 258 33.3 50.4 16.3
Forest 89 41.6 37.1 21.3
Food products 33 24.2 54.5 21.2
Service 107 29.9 51.4 18.7
Non-farm 42 45.2 40.5 14.3
B. Gender
Women 369 34.4 45.5 20.1
Men 160 34.4 53.1 12.5
C. Caste/ Ethnicity
BCTS 155 36.1 48.4 15.5
Dalit 107 36.4 43.9 19.6
Janajati 220 35.0 50.0 15.0
Others 47 21.3 44.7 34.0
D. Phase First stage 134 40.3 45.5 14.2
Second stage 395 32.4 48.6 19.0

140
Annexure 5.3: Distribution of individual enterprises by their perception on the usefulness of improved and modern technologies
(Percent)
Reported
case Labor
productivity Production
capacity Cost of
production
Overall 435 87.4 87.6 78.4
A. Enterprises categories
Agriculture 216 87.0 85.6 77.8
Forest 70 92.9 92.9 82.9
Food products 26 84.6 84.6 76.9
Service 87 80.5 85.1 72.4
Non-farm 36 97.2 97.2 88.9
B. Gender
Women 295 88.1 87.8 79.7
Men 140 85.7 87.1 75.7
C. Caste/Ethniciy
BCTS 131 90.8 90.8 80.9
Dalit 86 96.5 96.5 84.9
Janajati 187 83.4 84.5 77.5
Others 31 71.0 67.7 54.8
D. Phase First stage 115 85.2 86.1 75.7
Second stage 320 88.1 88.1 79.4
Annexure 5.4: Distribution of entrepreneuers (Individual and Groups) by level of
investment
Respondents
(Number)
% of entrepreneurs investing Average Investment
(Rs)
Capital Ratio (%)
Investing capital
Working capital
Fix capital
Working Fixed
A. Enterprise type
Agriculture 271 96.3 87.1 35.1 14919 63.1 36.9
Forest 105 88.6 66.7 36.2 11984 60.2 39.8
Food products 73 98.6 41.1 13.7 32107 24.1 75.9
Service 114 97.4 87.7 50.0 30616 67.7 32.3
Non-farm 67 97.0 44.8 35.8 23190 50.0 50.0
B. Gender
Women 446 94.4 72.9 33.0 14226 62.4 37.6
Men 184 98.4 76.6 41.8 34479 48.2 51.8
C. Caste/ Ethnicity
BCTS 188 91.5 71.8 33.0 30981 55.5 44.5
Dalit 138 99.3 71.0 34.8 13601 50.9 49.1
Janajati 255 96.5 75.7 37.3 15657 52.4 47.6
Others 49 95.9 81.6 38.8 20306 74.1 25.9

141
Annexure 5.4 (a) Distribution of entrepreneurs by investment class
Current Capital Group Fixed capital (machinery/equipment)
Group Total
0 1 2 3 4 5 6 0 1 2 3 4 5 No. %
Overall 11.5 38.2 47.3 1.5 0.8 0.6 0.2 57.7 19.3 21.0 1.7 0.2 0.2 529 100.0
Sex
Female 11.4 42.0 44.4 1.1 0.8 0.3 60.2 21.4 17.1 1.1 0.3 369 100.0
Male 11.9 29.4 53.8 2.5 0.6 1.3 0.6 51.9 14.4 30.0 3.1 0.6 160 100.0
Caste/ Ethnicity
BCTS 12.3 26.5 56.1 1.3 1.9 1.3 0.6 60.0 16.8 19.4 3.2 0.6 155 100.0
Dalit 8.4 44.9 45.8 0.9 55.1 23.4 20.6 0.9 107 100.0
Janajati 11.8 45.9 40.5 0.9 0.5 0.5 56.8 19.5 21.8 1.8 220 100.0
Other Terai caste
14.9 25.5 53.2 6.4 59.6 17.0 23.4 47 100.0
Enterprise type
Agriculture 8.1 41.5 49.6 0.4 0.4 63.2 18.2 16.7 1.9 258 100.0
Forest 21.3 46.1 30.3 1.1 1.1 57.3 30.3 10.1 2.2 89 100.0
Food products
9.1 36.4 48.5 6.1 69.7 15.2 15.2 33 100.0
Service 5.6 32.7 53.3 3.7 1.9 2.8 46.7 10.3 42.1 0.9 107 100.0
Others 28.6 16.7 52.4 2.4 42.9 28.6 21.4 2.4 2.4 2.4 42 100.0
Phases
First 9.7 30.6 54.5 3.0 0.7 0.7 0.7 59.7 15.7 19.4 3.7 0.7 0.7 134 100.0
Second 12.2 40.8 44.8 1.0 0.8 0.5 57.0 20.5 21.5 1.0 395 100.0
Note: 0. No Investment; 1. Below 5,000; 2. 5,001 - 50,000 ;3. 50,001 - 1,00,000 ; 4. 1,00,001 - 1,50,000; 5. 1,50,001 - 2,00,000, and 6. More than 2,00,000
Annexure 5.5: Distribution of individual enterprises by target markets
Entrepreneurs Target Markets Total
Village Local
markets District
headquarter Neighboring
districts Kathmandu Exporter
Overall 35.8 44.0 11.7 2.4 4.8 1.3 100.0
A. Enterprises type
Agriculture 34.1 47.4 12.8 1.8 2.0 1.9 100.0
Forest 38.7 40.4 9.4 4.2 6.7 0.6 100.0
Food products 29.4 50.3 16.1 3.3 0.9 0.0 100.0
Service 47.0 42.8 7.6 1.1 1.5 1.1 100.0
Non-farm 16.0 29.2 16.8 4.5 33.6 0.0 100.0
B. Gender
Women 33.5 47.7 9.8 2.2 5.3 1.4 100.0
Men 40.9 35.7 16.1 2.6 3.7 1.0 100.0
C. Caste/ Ethnicity
BCTS 36.8 43.5 11.8 3.8 3.1 0.9 100.0
Dalit 34.5 43.3 6.2 1.7 12.9 1.4 100.0
Janajati 31.7 47.0 14.2 2.1 3.1 1.8 100.0
Other Terai Caste
54.0 33.4 12.6 0.0 0.0 0.0 100.0

142
Annexure 5.6: Income and expenditure details of enterprise (Rs)
Income Expenditures Net-profits % of expenditure Average Maximum Minimum Average Maximum Minimum Average Maximum Minimum
Overall 91,671 1,100,000 1,000 44,123 859,000 50 53,029 378,800 -8,000 120
A. Gender
Female 74,439 1,100,000 1,000 33,524 859,000 50 45,421 378,800 -8,000 135
Male 130,983 900,000 2,000 67,197 580,000 100 70,569 345,000 -4,000 105
B. Caste/Ethnicity
BCTS 90,013 1,100,000 2,000 52,106 859,000 80 47,977 299,000 -8,000 92
Dalit 92,408 900,000 5,000 40,647 555,000 50 54,167 345,000 1,700 133
Janajati 71,085 975,000 1,000 29,148 760,000 125 45,699 378,800 -4,000 157
Other Terai Caste
193,065 620,000 8,000 93,698 400,000 336 101,404 302,120 6,500 108
C. Enterprise type Agriculture 47,797 470,000 1,000 15,044 359,000 50 34,898 238,800 -8,000 232
Forest 93,453 800,000 2,600 49,142 580,000 125 51,516 239,500 1,700 105
Food products 121,619 975,000 4,000 83,381 760,000 100 59,083 299,000 -2,000 71
Service 170,790 1,100,000 5,000 89,692 859,000 1,000 87,880 378,800 2,500 98
Others 135,750 800,000 7,000 60,156 539,500 350 77,026 260,500 7,000 128
First Phase 128,583 900,000 2,000 73,216 555,000 350 66,744 345,000 -8,000 91
Second Phase 79,021 1,100,000 1,000 34,619 859,000 50 48,350 378,800 -5,000 140

143
Annexure 5.7: Distribution of respondents by utilization of income earned through enterprises
(Percent)
Purchasing
Assets HH
expenditure Child
Education
Re-investment
in enterprise
Purchasing Land
Improving Housing/
Living condition
Total
Overall 10.0 41.6 12.1 16.5 12.2 7.5 100.0
A. Enterprises categories
Agriculture 8.4 39.8 15.0 15.0 15.3 6.5 100.0
Forest 9.5 52.2 12.6 15.0 8.9 1.9 100.0
Food and Beverage 5.7 35.0 15.3 14.0 21.7 8.3 100.0
Service 6.5 38.0 9.1 23.3 12.3 10.8 100.0
Others 11.5 55.0 12.9 8.4 3.1 9.1 100.0
B. Sex
Women 7.9 41.9 15.2 17.4 11.3 6.4 100.0
Men 6.0 44.4 9.4 16.7 14.2 9.2 100.0
C. Caste
BCTS 5.4 37.8 12.6 17.4 21.1 5.7 100.0
Dalit 11.1 57.2 11.7 11.6 3.4 5.0 100.0
Janajati 10.1 41.1 13.5 21.6 9.0 4.7 100.0
Others 5.2 36.7 10.7 12.8 14.1 20.6 100.0
Annexure 5.8: Distribution of respondents by diversification of enteprises
Respondent categories Diversified Not Diversified Total
No % No % No %
Overall 141 21.2 525 78.8 666 100.0
A. Gender
Women 99 20.8 376 79.2 475 100.0
Men 42 22.0 149 78.0 191 100.0
B. Caste/Ethnicity
BCTS 43 22.5 148 77.5 191 100.0
Dalit 13 8.7 136 91.3 149 100.0
Janajati 74 26.7 203 73.3 277 100.0
Others 11 22.4 38 77.6 49 100.0
C. Enterprise type
Agriculture 80 28.8 198 71.2 278 100.0 Forest 13 11.3 102 88.7 115 100.0 Food and Beverage 15 19.5 62 80.5 77 100.0 Service 27 23.3 89 76.7 116 100.0 Others 6 7.5 74 92.5 80 100.0
D. Phase
Phase I 31 20.8 118 79.2 149 100.0
Phase II 110 21.3 407 78.7 517 100.0

144
Annexure 5.9: Contribution to employment of household members
Respondents
(Number)
Average annual days of employment
per HH
Labor productivity (RS) per HHs
Employment creation (%)
Men Women
Overall 666 229 168 45.7 54.3
A. Gender
Women 475 214 142 34.9 65.1
Men 191 268 219 59.6 40.4
C. Caste/Ethnicty
BCTS 191 209 111 42.8 57.2
Dalit 149 264 161 50.2 49.8
Janajati 277 207 183 40.1 59.9
Others 49 329 275 50.6 49.4
A. Enterprises type
Agriculture 278 196 128 42.0 58.0
Forest 115 256 163 29.8 70.2
Food products 77 176 198 42.7 57.3
Service 116 319 181 53.6 46.4
Non-farm 80 228 248 53.4 46.6
D. Phase
First 149 277 225 57.0 43.0
Second 517 216 137 41.6 58.4
Annexure 5.10: Status of employment outside the households
Sample
size Full time employee
Labor Contract out
Overall 529 2.1 11.3 2.5
A. Enterprises type
Agriculture 258 0.4 11.2 1.2
Forest 89 3.4 16.9 5.6
Food and Beverage 33 6.1 3.0
Service 107 3.7 14.0 0.9
Others 42 2.4 - 9.5
B. Sex
Women 369 10.0 2.7
Men 160 14.4 1.9
C. Caste/Ethnicity
BCTS 246 1.9 15.5 3.2
Dalit 198 1.9 10.3 2.8
Janajati 329 1.8 3.6 2.3
Others 59 4.3 36.2
D. Phase First 142 3.7 19.3 4.4
Second 524 2.0 8.3 1.7

145
Annexure 6.1: Distribution of respondents by type of roofing materials (Percent)
Responses
A. Participants
B. Non-Participants
Changes among MEDEP
contribution
Now Before Now Before Participant
Non-participant
A. Gender
Women
Thatch/Straw 7.3 18.1 16.2 15.5 (10.8) 0.7 (11.5)
Tile/Mud 37.4 39.4 49.3 53.5 (2.0) (4.2) 2.2
Stone/Slate 13.8 13.8 2.8 2.8 - - -
Zinc Sheet 34.1 24.7 23.2 21.1 9.4 2.1 7.3
RCC 7.3 3.9 8.5 7.0 3.6 2.2 1.4
Total 100.0 100.0 100.0 100.0
Men
Thatch/Straw 15.4 34.6 9.8 19.5 (19.1) (9.8) (9.3)
Tile/Mud 30.9 30.5 41.5 41.5 0.4 - 0.4
Stone/Slate 8.5 8.9 2.4 2.4 (0.4) - (0.4)
Zinc Sheet 37.4 22.4 31.7 26.8 15.0 4.9 10.2
RCC 7.7 3.7 14.6 9.8 4.1 4.9 (0.8)
Total 100.0 100.0 100.0 100.0
B. Caste/Ethnicity
BCTS
Thatch/Straw 3.3 14.6 2.3 9.1 (11.4) (6.8) (4.6)
Tile/Mud 25.2 24.8 47.7 54.5 0.4 (6.8) 7.2
Stone/Slate 19.9 20.7 0 0 (0.8) - (0.8)
Zinc Sheet 43.1 33.7 25.0 20.5 9.3 4.5 4.8
RCC 8.5 6.1 25.0 15.9 2.4 2.4
Total 100.0 100.0 100.0 100.0
Dalit
Thatch/Straw 14.6 37.4 20.0 18.0 (22.7) 2.0 (24.7)
Tile/Mud 28.3 26.8 44.0 46.0 1.5 (2.0) 3.5
Stone/Slate 11.1 9.6 8.0 8.0 1.5 - 1.5
Zinc Sheet 42.9 24.7 26.0 26.0 18.2 - 18.2
RCC 3.0 1.5 2.0 2.0 1.5 1.5
Total 100.0 100.0 100.0 100.0
Janajati
Thatch/Straw 11.9 21.9 24.2 22.6 (10.0) 1.6 (11.6)
Tile/Mud 42.2 45.6 37.1 43.5 (3.3) (6.5) 3.1
Stone/Slate 9.4 10.0 1.6 1.6 (0.6) - (0.6)
Zinc Sheet* 30.1 20.1 35.5 30.6 10.0 4.8 5.2
RCC 6.4 2.4 1.6 1.6 4.0 4.0
Total 100.0 100.0 100.0 100.0
Others
Thatch/Straw 8.5 15.3 3.7 11.1 (6.8) (7.4) 0.6
Tile/Mud 64.4 71.2 77.8 70.4 (6.8) 7.4 (14.2)
Stone/Slate 0 0 0 0 - - -
Zinc Sheet* 3.4 3.4 0 0 - - -
RCC 23.7 10.2 18.5 18.5 13.6 13.6
Total 100.0 100.0 100.0 100.0
Annexure 6.2: Distribution of respondents by type of floor
(Percent)
Responses
A. Participants
B. Non-Participants
Changes among MEDEP
contribution Now Before Now Before Participant
Non-participant
A. Gender
Women Cement/Marble 13.3 7.7 16.2 14.1 5.6 2.1 3.5
Mud/Brick 86.7 92.3 83.8 85.9 (5.6) (2.1) (3.5)
Total 100.0 100.0 100.0 100.0
Men Cement/Marble 13.8 8.5 22.0 19.5 5.3 2.4 2.8
Mud/Brick 86.2 91.5 78.0 80.5 (5.3) (2.4) (2.8)
Total 100.0 100.0 100.0 100.0
B. Ethnicity/Caste
BCTS Cement/Marble 16.7 10.6 34.1 27.3 6.1 6.8 (0.7)
Mud/Brick 83.3 89.4 65.9 72.7 (6.1) (6.8) 0.7
Total 100.0 100.0 100.0 100.0

146
Responses
A. Participants
B. Non-Participants
Changes among MEDEP
contribution Now Before Now Before Participant
Non-participant
Dalit Cement/Marble 7.1 5.1 6.0 6.0 2.0 - 2.0
Mud/Brick 92.9 94.9 94.0 94.0 (2.0) - (2.0)
Total 100.0 100.0 100.0 100.0
Janajati Cement/Marble 12.8 6.4 12.9 12.9 6.4 - 6.4
Mud/Brick 87.2 93.6 87.1 87.1 (6.4) - (6.4)
Total 100.0 100.0 100.0 100.0
Others Cement/Marble 25.4 15.3 22.2 18.5 10.2 3.7 6.5
Mud/Brick 74.6 84.7 77.8 81.5 (10.2) (3.7) (6.5)
Total 100.0 100.0 100.0 100.0
Annexure 6.3: Distribution of respondents by source of drinking water
(Percent)
Responses
A. Participants
B. Non-Participants
Changes among MEDEP
contribution Now Before Now Before Participant
Non-participant
A. Gender
Women Tap (Own/ Community)
87.5 84.0 83.1 80.3 3.6 2.8 0.8
Water hole/Pond
6.7 6.8 10.6 13.4 (0.2) (2.8) 2.6
River 5.8 9.2 6.3 6.3 (3.4) - (3.4)
Men Tap (Own/ Community)
91.1 80.1 73.2 58.5 11.0 14.6 -3.7
Water hole/Pond
2.8 6.1 9.8 22.0 (3.3) (12.2) 8.9
River 6.1 13.8 17.1 19.5 (7.7) (2.4) (5.3)
B. Caste/Ethnicity
BCTS Tap (Own/ Community)
92.3 86.2 88.6 75.0 6.1 13.6 -7.5
Water hole/Pond
5.3 7.3 11.4 25.0 (2.0) (13.6) 11.6
River 2.4 6.5 0 0 (4.1) - (4.1)
Dalit Tap (Own/ Community)
84.8 75.3 80.0 80.0 9.6 0.0 9.6
Water hole/Pond
8.1 10.6 8.0 8.0 (2.5) - (2.5)
River 7.1 14.1 12.0 12.0 (7.1) - (7.1)
Janajati Tap (Own/ Community)
86.9 82.7 69.4 66.1 4.3 3.2 1.0
Water hole/Pond
4.6 4.3 14.5 17.7 0.3 (3.2) 3.5
River 8.5 13.1 16.1 16.1 (4.6) - (4.6)
Others Tap (Own/ Community)
94.9 94.9 96.3 88.9 0.0 7.4 -7.4
Water hole/Pond
3.4 3.4 3.7 7.4 - (3.7) 3.7
River 1.7 1.7 0 3.7 - (3.7) 3.7
Annexure 6.4: Distribution of respondents by source of energy for cooking
(Percent)
Responses
A. Participants
B. Non-Participants
Changes among MEDEP
contribution Now Before Now Before Participant
Non-participant
A. Gender
Women Wood 86.3 94.0 90.8 95.8 (7.7) (4.9) (2.7)
LPG gas 6.3 2.2 7.0 1.4 4.1 5.6 (1.5)
Bio-gas 7.3 3.8 2.1 2.8 3.6 (0.7) 4.3

147
Responses
A. Participants
B. Non-Participants
Changes among MEDEP
contribution Now Before Now Before Participant
Non-participant
Crop residue 0.0 0.0 0.0 0.0 - - -
Men Wood 90.7 95.1 87.8 95.1 (4.5) (7.3) 2.8
LPG gas 4.9 2.0 7.3 0 2.8 7.3 (4.5)
Bio-gas 4.5 1.6 4.9 4.9 2.8 - 2.8
Crop residue 0 1.2 0 0 (1.2) - (1.2)
B. Caste/Ethnicy
BCTS Wood 81.3 89.4 75.0 84.1 (8.1) (9.1) 1.0
LPG gas 9.8 5.3 20.5 4.5 4.5 15.9 (11.4)
Bio-gas 8.9 5.3 4.5 11.4 3.7 (6.8) 10.5
Crop residue 0 0 0 0 - - -
Dalit Wood 93.4 98.5 100.0 100.0 (5.1) - (5.1)
LPG gas 3.5 1.0 0 0 2.5 - 2.5
Bio-gas 3.0 0.5 0 0 2.5 - 2.5
Crop residue 0 0 0 0.0 - - -
Janajati Wood 87.2 95.7 93.5 98.4 (8.5) (4.8) (3.7)
LPG gas 4.9 0.6 1.6 0 4.3 1.6 2.6
Bio-gas 7.9 3.6 4.8 1.6 4.3 3.2 1.0
Crop residue 0 0 0 0.0 - - -
Others Wood 96.6 93.2 88.9 100.0 3.4 (11.1) 14.5
LPG gas 3.4 1.7 11.1 0 1.7 11.1 (9.4)
Bio-gas 0 0 0 0 - - -
Crop residue 0 5.1 0 0.0 (5.1) - (5.1)
Annexure 6.5: Distribution of respondets by sources of energy for lightening
(Percent)
Responses
A. Participants
B. Non-Participants
Changes among MEDEP
contribution Now Before Now Before Participant
Non-participant
A. Sex
Women Electricity 89.2 66.4 87.3 78.2 22.9 9.2 13.7
Solar 1.5 1.2 0.0 0.0 0.3 - 0.3
Candle 0.5 1.4 0.7 1.4 (0.9) (0.7) (0.1)
Kerosene 8.4 30.9 11.3 19.7 (22.5) (8.5) (14.1)
Battery 0.3 0.2 0.7 0.7 0.2 0.2
Total 100.0 100.0 100.0 100.0
Men Electricity 88.2 60.6 87.8 75.6 27.6 12.2 15.4
Solar 2.4 0.4 2.4 4.9 2.0 (2.4) 4.5
Candle 0 0.8 0 0 (0.8) - (0.8)
Kerosene 8.9 38.2 9.8 19.5 (29.3) (9.8) (19.5)
Battery 0.4 0 0 0 0.4 - 0.4
Total 100.0 100.0 100.0 100.0
B. Total
BCTS Electricity 95.1 72.8 88.6 77.3 22.4 11.4 11.0
Solar 1.2 0.4 0 0 0.8 - 0.8
Candle 0 0 0 0 - - -
Kerosene 3.7 26.8 9.1 20.5 (23.2) (11.4) (11.8)
Battery 0 0 2.3 2.3 - -
Total 100.0 100.0 100.0 100.0
Dalit Electricity 92.9 58.6 76.0 62.0 34.3 14.0 20.3
Solar 0 0.5 0 0 (0.5) - (0.5)
Candle 0 2.0 2.0 4.0 (2.0) (2.0) (0.0)
Kerosene 6.6 38.9 22.0 34.0 (32.3) (12.0) (20.3)
Battery 0.5 0 0 0 0.5 - 0.5
Total 100.0 100.0 100.0 100.0
Janajati Electricity 83.9 62.9 90.3 85.5 21.0 4.8 16.1
Solar 3.6 1.8 1.6 1.6 1.8 - 1.8
Candle 0.9 1.5 0 0 (0.6) - (0.6)
Kerosene 10.9 33.4 8.1 12.9 (22.5) (4.8) (17.7)

148
Responses
A. Participants
B. Non-Participants
Changes among MEDEP
contribution Now Before Now Before Participant
Non-participant
Battery 0.6 0.3 0 0 0.3 - 0.3
Total 100.0 100.0 100.0 100.0
Others Electricity 78.0 61.0 100.0 88.9 16.9 11.1 5.8
Solar 0 0 0 3.7 - (3.7) 3.7
Candle 0 1.7 0 0 (1.7) - (1.7)
Kerosene 22.0 37.3 0 7.4 (15.3) (7.4) (7.8)
Battery 0 0 0 0 - - -
Total 100.0 100.0 100.0 100.0
Annexure 6.6: Distribution of respondenst by income class
( Percent)
Responses
A. Participants
B. Non-Participants
Changes among MEDEP
contribution Now Before Now Before Participant
Non-participant
A. Sex
Women Upto Rs 5000 8.9 67.6 7.3 69.7 (58.7) (62.4) 3.7
Rs 5000 to 10000 13.0 31.7 29.3 29.6 (18.8) (0.3) (18.5)
Rs 10000 to 20000 22.7 0.7 46.3 0.7 22.0 45.6 (23.6)
Rs 20000 to 50000 44.7
17.1
44.7 17.1 27.6
Rs 50000 to 100000 8.9
8.9 - 8.9
Above Rs 100000 1.9 1.9 - 1.9
Total 100.0 100.0 100.0 100.0
Men Upto Rs 5000 11.0 65.0 24.6 53.7 (54.1) (29.0) (25.1)
Rs 5000 to 10000 14.6 34.1 21.8 43.9 (19.5) (22.1) 2.6
Rs 10000 to 20000 19.1 0.8 37.3 2.4 18.3 34.9 (16.6)
Rs 20000 to 50000 40.7
16.2
40.7 16.2 24.5
Rs 50000 to 100000 14.2
14.2 - 14.2
Above Rs 100000 0.4 0.4 - 0.4
Total 100.0 100.0 100.0
100.0
B. Total
BCTS Upto Rs 5000 6.1 61.0 13.6 54.5 (54.9) (40.9) (14.0)
Rs 5000 to 10000 9.8 38.2 11.4 43.2 (28.5) (31.8) 3.4
Rs 10000 to 20000 20.3 0.8 47.7 2.3 19.5 45.5 (25.9)
Rs 20000 to 50000 49.6
27.3
49.6 27.3 22.3
Rs 50000 to 100000 12.2
12.2 - 12.2
Above Rs 100000 2.0 2.0 - 2.0
Total 100.0 100.0 100.0 100.0
Dalit Upto Rs 5000 12.1 81.3 18.0 82.0 (69.2) (64.0) (5.2)
Rs 5000 to 10000 15.2 18.7 24.0 16.0 (3.5) 8.0 (11.5)
Rs 10000 to 20000 21.2 - 44.0 2.0 21.2 42.0 (20.8)
Rs 20000 to 50000 41.4
14.0
41.4 14.0 27.4
Rs 50000 to 100000 10.1
10.1 - 10.1
Above Rs 100000 - - - -
Total 100.0 100.0 100.0 100.0

149
Responses
A. Participants
B. Non-Participants
Changes among MEDEP
contribution Now Before Now Before Participant
Non-participant
Janajati Upto Rs 5000 9.4 65.3 22.6 67.7 (55.9) (45.2) (10.8)
Rs 5000 to 10000 15.5 34.0 25.8 32.3 (18.5) (6.5) (12.1)
Rs 10000 to 20000 23.7 0.6 38.7 0.0 23.1 38.7 (15.6)
Rs 20000 to 50000 39.5
12.9 39.5 12.9 26.6
Rs 50000 to 100000 9.7
9.7 - 9.7
Above Rs 100000 2.1 2.1 - 2.1
Total 100.0 100.0 100.0
100.0
Others Upto Rs 5000 15.3 50.8 33.3 51.9 (35.6) (18.5) (17.1)
Rs 5000 to 10000 11.9 45.8 37.0 48.1 (33.9) (11.1) (22.8)
Rs 10000 to 20000 16.9 3.4 18.5 0.0 13.6 18.5 (5.0)
Rs 20000 to 50000 47.5
11.1 47.5 11.1 36.3
Rs 50000 to 100000 8.5
8.5 - 8.5
Above Rs 100000 - - - -
Total 100.0 100.0 100.0
Annexure 6.7: Proportion of respondenst by their food security status
( Percent)
Food Security Status
Participants Non-
Participants Changes among
MEDEP contribution
Now Before Now Before Participant Non-
participant
A. Sex
Women Up to 3 months 15.0 49.7 41.5 71.8 (34.6) (30.3) (4.4)
3 – 6 months 52.6 47.1 45.1 26.1 5.5 19.0 (13.6)
6 – 9 months 28.3 3.2 12.7 2.1 25.1 10.6 14.5
Above 9 months 4.1 0.7 4.1 0.7 3.4
Total 100.0 100.0 100.0 100.0
Men Up to 3 months 11.8 46.3 39.0 65.9 (34.6) (26.8) (7.7)
3 – 6 months 49.6 52.0 43.9 31.7 (2.4) 12.2 (14.6)
6 – 9 months 31.7 1.6 14.6 2.4 30.1 12.2 17.9
Above 9 months 6.9 2.4 6.9 2.4 4.5
Total 100.0 100.0 100.0
100.0
B. Total
BCTS Up to 3 months 12.6 48.4 34.0 68.0 (35.8) (34.0) (1.8)
3 – 6 months 46.3 48.4 58.0 32.0 (2.0) 26.0 (28.0)
6 – 9 months 34.6 3.3 8.0 0.0 31.3 8.0 23.3
Above 9 months 6.5 0.0 6.5 - 6.5
Total 100.0 100.0 100.0 100.0
Dalit Up to 3 months 17.7 47.0 51.6 72.6 (29.3) (21.0) (8.3)
3 – 6 months 58.6 51.5 41.9 25.8 7.1 16.1 (9.1)
6 – 9 months 23.2 1.5 4.8 1.6 21.7 3.2 18.5
Above 9 months 0.5 1.6 0.5 1.6 (1.1)
Total 100.0 100.0 100.0 100.0
Janajati Up to 3 months 14.6 51.7 55.6 59.3 (37.1) (3.7) (33.4)
3 – 6 months 51.1 45.3 33.3 37.0 5.8 (3.7) 9.5
6 – 9 months 29.2 3.0 11.1 3.7 26.1 7.4 18.7
Above 9 months 5.2 0.0 5.2 - 5.2
Total 100.0 100.0 100.0
100.0
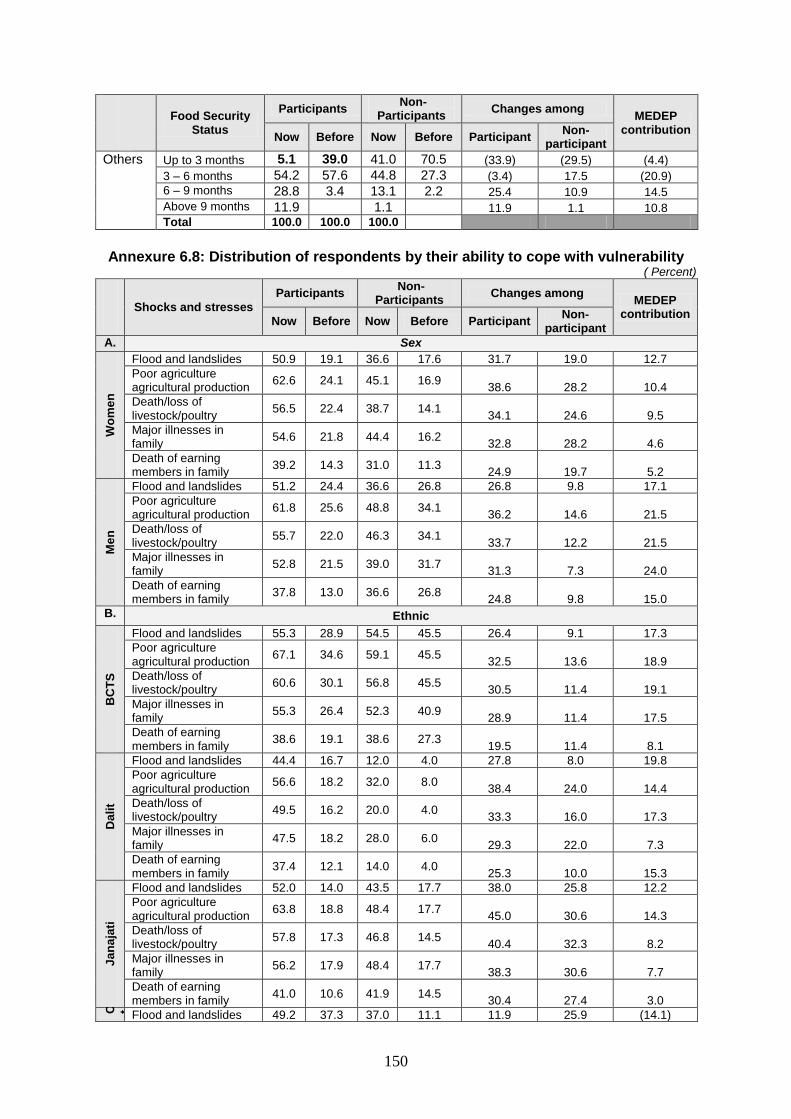
150
Food Security Status
Participants Non-
Participants Changes among
MEDEP contribution
Now Before Now Before Participant Non-
participant
Others Up to 3 months 5.1 39.0 41.0 70.5 (33.9) (29.5) (4.4)
3 – 6 months 54.2 57.6 44.8 27.3 (3.4) 17.5 (20.9)
6 – 9 months 28.8 3.4 13.1 2.2 25.4 10.9 14.5
Above 9 months 11.9 1.1 11.9 1.1 10.8
Total 100.0 100.0 100.0
Annexure 6.8: Distribution of respondents by their ability to cope with vulnerability
( Percent)
Shocks and stresses
Participants Non-
Participants Changes among
MEDEP contribution
Now Before Now Before Participant Non-
participant
A. Sex
Wo
me
n
Flood and landslides 50.9 19.1 36.6 17.6 31.7 19.0 12.7
Poor agriculture agricultural production
62.6 24.1 45.1 16.9 38.6 28.2 10.4
Death/loss of livestock/poultry
56.5 22.4 38.7 14.1 34.1 24.6 9.5
Major illnesses in family
54.6 21.8 44.4 16.2 32.8 28.2 4.6
Death of earning members in family
39.2 14.3 31.0 11.3 24.9 19.7 5.2
Me
n
Flood and landslides 51.2 24.4 36.6 26.8 26.8 9.8 17.1
Poor agriculture agricultural production
61.8 25.6 48.8 34.1 36.2 14.6 21.5
Death/loss of livestock/poultry
55.7 22.0 46.3 34.1 33.7 12.2 21.5
Major illnesses in family
52.8 21.5 39.0 31.7 31.3 7.3 24.0
Death of earning members in family
37.8 13.0 36.6 26.8 24.8 9.8 15.0
B. Ethnic
BC
TS
Flood and landslides 55.3 28.9 54.5 45.5 26.4 9.1 17.3
Poor agriculture agricultural production
67.1 34.6 59.1 45.5 32.5 13.6 18.9
Death/loss of livestock/poultry
60.6 30.1 56.8 45.5 30.5 11.4 19.1
Major illnesses in family
55.3 26.4 52.3 40.9 28.9 11.4 17.5
Death of earning members in family
38.6 19.1 38.6 27.3 19.5 11.4 8.1
Dali
t
Flood and landslides 44.4 16.7 12.0 4.0 27.8 8.0 19.8
Poor agriculture agricultural production
56.6 18.2 32.0 8.0 38.4 24.0 14.4
Death/loss of livestock/poultry
49.5 16.2 20.0 4.0 33.3 16.0 17.3
Major illnesses in family
47.5 18.2 28.0 6.0 29.3 22.0 7.3
Death of earning members in family
37.4 12.1 14.0 4.0 25.3 10.0 15.3
Ja
na
jati
Flood and landslides 52.0 14.0 43.5 17.7 38.0 25.8 12.2
Poor agriculture agricultural production
63.8 18.8 48.4 17.7 45.0 30.6 14.3
Death/loss of livestock/poultry
57.8 17.3 46.8 14.5 40.4 32.3 8.2
Major illnesses in family
56.2 17.9 48.4 17.7 38.3 30.6 7.7
Death of earning members in family
41.0 10.6 41.9 14.5 30.4 27.4 3.0
O t h e r s
Flood and landslides 49.2 37.3 37.0 11.1 11.9 25.9 (14.1)

151
Shocks and stresses
Participants Non-
Participants Changes among
MEDEP contribution
Now Before Now Before Participant Non-
participant
Poor agriculture agricultural production
54.2 35.6 44.4 11.1 18.6 33.3 (14.7)
Death/loss of livestock/poultry
52.5 37.3 37.0 11.1 15.3 25.9 (10.7)
Major illnesses in family
59.3 35.6 44.4 14.8 23.7 29.6 (5.9)
Death of earning members in family
32.2 16.9 33.3 14.8 15.3 18.5 (3.3)
Annexure 8.1: Ownership of assests by respondent categories ( Percent)
Responses
A. Participants
B. Non-Participants
Changes among MEDEP
contribution Now Before Now Before Participant
Non-participant
A. Sex
Women Land 15.2 10.2 16.2 12.0 4.9 4.2 0.7
House 14.0 9.7 14.1 11.3 4.3 2.8 1.4
Bank balance/Saving
37.4 18.6 25.4 18.3 18.8 7.0 11.7
Share/Equity 35.2 16.4 9.9 7.7 18.8 2.1 16.7
Men Land 60.2 52.8 56.1 46.3 7.3 9.8 (2.4)
House 59.3 50.8 61.0 53.7 8.5 7.3 1.2
Bank balance/Saving
43.5 28.9 19.5 12.2 14.6 7.3 7.3
Share/Equity 38.2 26.0 7.3 7.3 12.2 - 12.2
B. Ethnic
BCTS Land 30.9 23.2 27.3 20.5 7.7 6.8 0.9
House 31.3 23.2 31.8 25.0 8.1 6.8 1.3
Bank balance/Saving
38.2 21.5 29.5 18.2 16.7 11.4 5.3
Share/Equity 38.6 19.1 11.4 6.8 19.5 4.5 15.0
Dalit Land 29.8 25.3 12.0 8.0 4.5 4.0 0.5
House 27.8 23.7 10.0 8.0 4.0 2.0 2.0
Bank balance/Saving
40.4 19.2 14.0 10.0 21.2 4.0 17.2
Share/Equity 31.8 15.2 4.0 4.0 16.7 - 16.7
Janajati Land 22.2 17.6 35.5 32.3 4.6 3.2 1.3
House 20.7 16.4 30.6 27.4 4.3 3.2 1.0
Bank balance/Saving
39.8 24.3 19.4 16.1 15.5 3.2 12.3
Share/Equity 40.1 22.5 8.1 6.5 17.6 1.6 16.0
Others Land 49.2 42.4 22.2 11.1 6.8 11.1 (4.3)
House 47.5 40.7 25.9 22.2 6.8 3.7 3.1
Bank balance/Saving
35.6 15.3 44.4 29.6 20.3 14.8 5.5
Share/Equity 16.9 15.3 18.5 18.5 1.7 - 1.7
Total 100.0 100.0 100.0

152
Annexure 8.2: Decision making on household activities by respondent categories ( Percent)
Responses
A. Participants
B. Non-Participants
Changes among MEDEP
contribution Now Before Now Before Participant
Non-participant
A. Sex
Women Groceries purchases
40.4 28.5 52.8 50.0 11.9 2.8 9.1
Cloth 38.1 26.1 49.3 48.6 11.9 0.7 11.2
Repair house 13.7 8.7 7.0 6.3 4.9 0.7 4.2
Lease land 22.4 21.1 6.3 6.3 1.2 - 1.2
Men Groceries purchases
28.9 27.6 26.8 24.4 1.2 2.4 (1.2)
Cloth 29.3 28.9 22.0 24.4 0.4 (2.4) 2.8
Repair house 23.2 24.8 12.2 12.2 (1.6) - (1.6)
Lease land 12.8 8.5 12.2 12.2 4.3 - 4.3
B. Ethnic
BCTS Groceries purchases
37.8 27.2 38.6 36.4 10.6 2.3 8.3
Cloth 31.3 20.3 29.5 31.8 11.0 (2.3) 13.2
Repair house 15.9 11.8 6.8 9.1 4.1 (2.3) 6.3
Lease land 15.0 11.4 9.1 11.4 3.7 (2.3) 5.9
Dalit Groceries purchases
33.8 28.8 48.0 48.0 5.1 - 5.1
Cloth 30.8 25.8 48.0 48.0 5.1 - 5.1
Repair house 17.2 14.1 4.0 4.0 3.0 - 3.0
Lease land 17.2 14.1 2.0 2.0 3.0 - 3.0
Janajati Groceries purchases
38.3 27.1 37.1 35.5 11.2 1.6 9.6
Cloth 41.3 31.0 35.5 33.9 10.3 1.6 8.7
Repair house 16.7 14.0 9.7 9.7 2.7 - 2.7
Lease land 14.3 12.2 9.7 9.7 2.1 - 2.1
Others Groceries purchases
37.3 37.3 81.5 70.4 - 11.1 (11.1)
Cloth 35.6 35.6 74.1 74.1 - - -
Repair house 15.3 15.3 14.8 7.4 - 7.4 (7.4)
Lease land 15.3 15.3 11.1 7.4 - 3.7 (3.7)
Annexure 8.3: Decision making on economic activities of HHs by respondent
categories ( Percent)
Responses
A. Participants B. Non-
Participants Changes among
MEDEP
contribution t
Now Before Now Before Particip
ant Non-
participant
A. Sex
Women Accessing Loan 17.1 9.7 5.6 6.3 7.3 (0.7) 8.0
Saving in Group 33.8 20.1 12.7 10.6 13.7 2.1 11.5
Use of Loan 15.5 9.6 4.9 6.3 6.0 (1.4) 7.4
Use in Income 14.3 9.2 5.6 6.3 5.1 (0.7) 5.8
Inputs procurement 18.1 11.1 8.5 7.7 7.0 0.7 6.3
Selling of product 21.2 11.9 6.3 6.3 9.2 - 9.2
Income generating/ enterprise selection
28.0 14.5 14.6 9.8 13.5 4.9 8.6
Men Accessing Loan 17.5 17.9 9.8 7.3 (0.4) 2.4 (2.8)
Saving in Group 22.0 19.9 9.8 7.3 2.0 2.4 (0.4)
Use of Loan 15.5 9.6 4.9 6.3 6.0 (1.4) 7.4
Use in Income 15.4 16.7 9.8 7.3 (1.2) 2.4 (3.7)
Inputs procurement 17.9 18.3 9.8 7.3 (0.4) 2.4 (2.8)
Selling of product 17.5 17.1 9.8 7.3 0.4 2.4 (2.0)
Income generating/ enterprise selection
22.8 19.9 6.3 6.3 2.8 - 2.8

153
Responses
A. Participants B. Non-
Participants Changes among
MEDEP
contribution t
Now Before Now Before Particip
ant Non-
participant
B. Ethnic
BCTS Accessing Loan 18.3 12.6 9.1 9.1 5.7 - 5.7
Saving in Group 32.5 22.8 22.7 15.9 9.8 6.8 2.9
Use of Loan 17.9 12.6 6.8 9.1 5.3 (2.3) 7.6
Use in Income 17.9 12.6 6.8 9.1 5.3 (2.3) 7.6
Inputs procurement 17.5 12.2 6.8 6.8 5.3 - 5.3
Selling of product 22.0 13.4 9.1 9.1 8.5 - 8.5
Income generating/ enterprise selection
28.0 14.5 9.1 9.1 13.5 - 13.5
Dalit Accessing Loan 12.6 10.1 4.0 4.0 2.5 - 2.5
Saving in Group 21.2 15.2 10.0 10.0 6.1 - 6.1
Use of Loan 12.1 10.1 4.0 4.0 2.0 - 2.0
Use in Income 12.1 10.1 6.0 6.0 2.0 - 2.0
Inputs procurement 15.2 13.6 12.0 12.0 1.5 - 1.5
Selling of product 14.6 12.1 6.0 6.0 2.5 - 2.5
Income generating/ enterprise selection
22.8 19.9 8.0 8.0 2.8 - 2.8
Janajati Accessing Loan 17.3 10.3 8.1 6.5 7.0 1.6 5.4
Saving in Group 34.7 19.8 9.7 8.1 14.9 1.6 13.3
Use of Loan 14.6 10.0 8.1 6.5 4.6 1.6 2.9
Use in Income 13.4 10.3 8.1 6.5 3.0 1.6 1.4
Inputs procurement 20.1 12.8 8.1 6.5 7.3 1.6 5.7
Selling of product 22.5 13.7 8.1 6.5 8.8 1.6 7.2
Income generating/ enterprise selection
28.0 15.9 9.7 6.5 12.2 3.2 9.0
Others Accessing Loan 27.1 27.1 3.7 7.4 - (3.7) 3.7
Saving in Group 27.1 27.1 7.4 7.4 - - -
Use of Loan 23.7 23.7 3.7 7.4 - (3.7) 3.7
Use in Income 16.9 16.9 3.7 3.7 - - -
Inputs procurement 18.6 18.6 7.4 3.7 - 3.7 (3.7)
Selling of product 16.9 16.9 3.7 3.7 - - -
Income generating/ enterprise selection
20.2 14.6 3.7 3.7 5.6 - 5.6
Annexure 8.4: Access to public services by respondent categories
( Percent)
Responses
A. Participants
B. Non-Participants
Changes among MEDEP
contribution Now Before Now Before Participant
Non-participant
A. Sex
Women Market infrastructure 57.7 31.7 20.4 13.4 26.0 7.0 19.0
Drainage/Irrigation 64.0 33.4 50.0 26.8 30.5 23.2 7.3
Drinking water 68.3 45.5 51.4 28.2 22.8 23.2 (0.5)
Road 59.9 31.1 47.9 27.5 28.8 20.4 8.4
School/education 64.7 34.0 50.0 29.6 30.7 20.4 10.3
Community forests 56.7 28.5 42.3 25.4 28.2 16.9 11.3
Enterprise activities 63.0 27.0 49.3 20.4 36.0 28.9 7.1
Men Market infrastructure 50.9 21.7 48.8 22.0 29.2 26.8 2.4
Drainage/Irrigation 71.5 46.3 63.4 31.7 25.2 31.7 (6.5)
Drinking water 57.8 31.9 61.0 31.7 25.9 29.3 (3.3)
Road 68.3 46.3 61.0 31.7 22.0 29.3 (7.3)
School/education 72.4 48.0 63.4 31.7 24.4 31.7 (7.3)
Community forests 62.2 40.7 56.1 24.4 21.5 31.7 (10.2)
Enterprise activities 69.1 38.2 56.1 19.5 30.9 36.6 (5.7)
B. Ethnic
BCTS Market infrastructure 56.9 30.5 22.7 22.7 26.4 0 26.4
Drainage/Irrigation 67.9 43.1 45.5 40.9 24.8 4.6 20.2
Drinking water 64.6 43.1 43.2 40.9 21.5 2.3 19.2
Road 64.6 40.7 43.2 40.9 23.9 2.3 21.6

154
Responses
A. Participants
B. Non-Participants
Changes among MEDEP
contribution Now Before Now Before Participant
Non-participant
School/education 64.6 41.5 45.5 40.9 23.1 4.6 18.5
Community forests 64.2 41.5 40.9 36.4 22.7 4.5 18.2
Enterprise activities 64.6 38.6 40.9 31.8 26 9.1 16.9
Dalit Market infrastructure 49.5 20.2 28.0 16.0 29.3 12 17.3
Drainage/Irrigation 64.6 34.3 46.0 26.0 30.3 20 10.3
Drinking water 64.6 43.1 43.2 40.9 21.5 2.3 19.2
Road 61.6 29.3 48.0 28.0 32.3 20 12.3
School/education 67.7 33.3 50.0 32.0 34.4 18 16.4
Community forests 57.1 26.3 40.0 22.0 30.8 18 12.8
Enterprise activities 64.1 21.7 46.0 18.0 42.4 28 14.4
Janajati Market infrastructure 53.8 21.6 29.0 11.3 32.2 17.7 14.5
Drainage/Irrigation 66.0 31.3 56.5 21.0 34.7 35.5 (0.8)
Drinking water 56.8 28.0 54.8 22.6 28.8 32.2 (3.4)
Road 59.3 29.5 51.6 21.0 29.8 30.6 (0.8)
School/education 66.0 32.2 54.8 22.6 33.8 32.2 1.6
Community forests 59.9 29.2 51.6 21.0 30.7 30.6 0.1
Enterprise activities 63.8 25.5 56.5 17.7 38.3 38.8 (0.5)
Others Market infrastructure 42.4 32.2 25.9 11.1 10.2 14.8 (4.6)
Drainage/Irrigation 66.0 31.3 56.5 21.0 34.7 35.5 (0.8)
Drinking water 64.4 59.3 70.4 25.9 5.1 44.5 (39.4)
Road 72.9 69.5 66.7 25.9 3.4 40.8 (37.4)
School/education 79.7 72.9 66.7 25.9 6.8 40.8 (34.0)
Community forests 28.8 28.8 48.1 22.2 0 25.9 (25.9)
Enterprise activities 72.9 50.8 63.0 11.1 22.1 51.9 (29.8)
Annexure 8.5: Confidence to interact freely and participate on discussions with
various community and public institutions ( Percent)
Responses
A. Participants B. Non-
Participants Changes among
MEDEP
contribution
Now Befor
e Now Before
Participant
Non-participant
A. Sex
Women Community Based Organization (CBOs)
73.2 25.8 45.1 29.6 47.4 15.5 31.9
Political parties 50.5 18.1 25.4 19.0 32.4 6.3 26.1
Government official 56.1 18.3 41.5 21.8 37.9 19.7 18.2
Local bodies officials 58.0 19.6 45.1 24.6 38.4 20.4 18.0
Men Community Based Organization(CBOs)
87.4 56.9 65.9 51.2 30.5 14.6 15.9
Political parties 77.2 52.4 63.4 53.7 24.8 9.8 15.0
Government official 76.4 45.1 58.5 46.3 31.3 12.2 19.1
Local bodies officials 79.7 48.8 56.1 46.3 30.9 9.8 21.1
B. Ethnic
BCTS Community Based Organization (CBOs)
84.1 43.1 72.7 56.8 41.1 15.9 25.1
Political parties 70.7 37.8 59.1 50.0 32.9 9.1 23.8
Government official 70.7 35.4 59.1 45.5 35.4 13.6 21.7
Local bodies officials 70.3 37.0 61.4 50.0 33.3 11.4 22.0
Dalit Community Based Organization (CBOs)
71.2 29.8 40.0 26.0 41.4 14.0 27.4
Political parties 48.0 20.7 20.0 12.0 27.3 8.0 19.3
Government official 51.0 17.7 26.0 14.0 33.3 12.0 21.3
Local bodies officials 54.0 19.7 36.0 22.0 34.3 14.0 20.3
Janajati Community Based Organization (CBOs)
79.0 28.9 37.1 25.8 50.2 11.3 38.9
Political parties 55.0 21.9 25.8 22.6 33.1 3.2 29.9
Government official 62.9 21.0 43.5 22.6 41.9 21.0 21.0
Traders 83.0 34.0 41.9 19.4 48.9 22.6 26.4
Employers 69.0 23.7 40.3 17.7 45.3 22.6 22.7

155
Responses
A. Participants B. Non-
Participants Changes among
MEDEP
contribution
Now Befor
e Now Before
Participant
Non-participant
Local bodies officials 64.7 21.6 38.7 19.4 43.2 19.4 23.8
Others Community Based Organization (CBOs)
61.0 52.5 59.3 33.3 8.5 25.9 (17.5)
Political parties 61.0 49.2 37.0 25.9 11.9 11.1 0.8
Government official 59.3 45.8 63.0 33.3 13.6 29.6 (16.1)
Local bodies officials 72.9 57.6 66.7 33.3 15.3 33.3 (18.1)
Annexure 8.6: Representation on decision making positions in community/public
institutions by gender and ethnicity ( Percent)
Responses
A. Participants B. Non-
Participants Changes among
MEDEP contribution
Now Before Now Before Participant Non-
participant
A. Sex
Women Representation on holding decision making position in community intuition
31.4 10.9 14.8 7.0 20.5 7.7 12.7
Decision making position in political parties
3.4 2.0 1.4 0.7 1.4 0.7 0.7
Men Representation on holding decision making position in community intuition
39.4 19.9 29.3 26.8 19.5 2.4 17.1
Decision making position in political parties
13.8 8.9 7.3 9.8 4.9 (2.4) 7.3
B. Ethnic
BCTS Representation on holding decision making position in community intuition
44.7 24.8 34.1 25.0 19.9 9.1 10.8
Decision making position in political parties
10.2 6.1 0 2.3 4.1 (2.3) 6.3
Dalit Representation on holding decision making position in community intuition
20.7 6.1 4.0 2.0 14.6 2.0 12.6
Decision making position in political parties
4.0 3.0 4.0 2.0 1.0 2.0 (1.0)
Janajati Representation on holding decision making position in community intuition
37.4 10.9 17.7 11.3 26.4 6.5 20.0
Decision making position in political parties
4.9 2.7 4.8 4.8 2.1 - 2.1
Others Representation on holding decision making position in community intuition
11.9 6.8 18.5 7.4 5.1 11.1 (6.0)
Decision making position in political parties
8.5 6.8 0 0 1.7 - 1.7
Annexure 8.7: Representation on capacity to influence decisions of community
institutions by gender and ethnicity ( Percent)
Responses
A. Participants
B. Non-Participants
Changes among MEDEP
contribution Now Before Now Before Participant
Non-participant
A. Sex
Women
Capacity to influence decisions in the community institutions
43.0 15.0 21.8 11.3 28.0 10.6 17.4
Participation/representation 69.6 43.2 58.5 43.7 26.5 14.8 11.7

156
Responses
A. Participants
B. Non-Participants
Changes among MEDEP
contribution Now Before Now Before Participant
Non-participant
in community/ social works
Capacity to influence decisions made at local bodies (VDCs)
18.1 4.9 10.6 4.2 13.1 6.3 6.8
Men Capacity to influence decisions in the community institutions
60.2 34.1 43.9 34.1 26.0 9.8 16.3
Participation/representation in community/ social works
80.5 63.0 58.5 48.8 17.5 9.8 7.7
Capacity to influence decisions made at local bodies (VDCs)
30.1 15.9 26.8 22.0 14.2 4.9 9.3
B. Ethnic
BCTS Capacity to influence decisions in the community institutions
56.9 27.6 56.8 43.2 29.3 13.6 15.6
Participation/representation in community/ social works
82.9 63.0 81.8 72.7 19.9 9.1 10.8
Capacity to influence decisions made at local bodies (VDCs)
28.5 13.4 31.8 25.0 15.0 6.8 8.2
Dalit Capacity to influence decisions in the community institutions
38.9 16.7 8.0 2.0 22.2 6.0 16.2
Participation/representation in community/ social works
70.2 47.0 52.0 36.0 23.2 16.0 7.2
Capacity to influence decisions made at local bodies (VDCs)
16.7 6.6 6.0 2.0 10.1 4.0 6.1
Janajati Capacity to influence decisions in the community institutions
52.3 19.1 21.0 14.5 33.1 6.5 26.7
Participation/representation in community/ social works
71.4 40.7 46.8 43.5 30.7 3.2 27.5
Capacity to influence decisions made at local bodies (VDCs)
22.5 5.8 8.1 3.2 16.7 4.8 11.9
Others Capacity to influence decisions in the community institutions
18.6 13.6 25.9 3.7 5.1 22.2 (17.1)
Participation/representation in community/ social works
47.5 44.1 59.3 18.5 3.4 40.7 (37.4)
Capacity to influence decisions made at local bodies (VDCs)
5.1 5.1 14.8 3.7 0.0 11.1 (11.1)
Annexure 8.8: Respondents taking action against gender violence and social
discrimination by caste and gender ( Percent)
Responses
A. Participants
B. Non-Participants
Changes among MEDEP
contribution Now Before Now Before Participant
Non-participant
A. Sex
Women Against beating spouse 26.1 15.5 10.6 9.9 10.6 0.7 9.9 Against a man leaving/ or attempting to divorce spouse
24.4 14.8 9.9 9.2 9.6 0.7 8.9
Against social discriminations
16.9 10.6 8.5 7.0 6.3 1.4 4.9

157
Responses
A. Participants
B. Non-Participants
Changes among MEDEP
contribution Now Before Now Before Participant
Non-participant
Capacity to raise voices against low wage/unequal wage for men and women for work of equal value
35.2 14.7 13.4 8.5
20.5 4.9 15.5
Men Against beating spouse 25.2 19.1 7.3 0.0 6.1 7.3 (1.2) Against a man leaving/ or attempting to divorce spouse
23.2 17.9 9.8 2.4 5.3 7.3 (2.0)
Against social discriminations
22.0 16.7 14.6 7.3 5.3 7.3 (2.0)
Capacity to raise voices against low wage/unequal wage for men and women for work of equal value
43.1 26.0 39.0 17.1
17.1 22.0 (4.9)
B. Ethnic
BCTS Against beating spouse 36.2 23.2 13.6 11.4 13 2.2 10.8 Against a man leaving/ or attempting to divorce spouse
34.1 23.2 13.6 11.4 10.9 2.2 8.7
Against social discriminations
18.3 12.6 9.1 6.8 5.7 2.3 3.4 Capacity to raise voices against low wage/unequal wage for men and women for work of equal value
41.5 24.4 18.2 20.5
17.1 -2.3 19.4
Dalit Against beating spouse 14.1 8.1 12.0 12.0 6 0 6.0 Against a man leaving/ or attempting to divorce spouse
12.6 6.6 10.0 10.0 6 0 6.0
Against social discriminations
17.2 11.1 10.0 10.0 6.1 0 6.1 Capacity to raise voices against low wage/unequal wage for men and women for work of equal value
40.4 16.2 18.0 6.0
24.2 12 12.2
Janajati Against beating spouse 27.1 17.3 3.2 1.6 9.8 1.6 8.2 Against a man leaving/ or attempting to divorce spouse
25.2 16.4 4.8 3.2 8.8 1.6 7.2
Against social discriminations
16.1 9.1 6.5 3.2 7 3.3 3.7 Capacity to raise voices against low wage/unequal wage for men and women for work of equal value
36.2 15.2 25.8 9.7
21 16.1 4.9
Others Against beating spouse 15.3 13.6 14.8 7.4 1.7 7.4 (5.7) Against a man leaving/ or attempting to divorce spouse
13.6 11.9 14.8 7.4 1.7 7.4 (5.7)
Against social discriminations
35.6 33.9 18.5 11.1 1.7 7.4 (5.7) Capacity to raise voices against low wage/unequal wage for men and women for work of equal value
18.6 13.6 7.4 3.7
5 3.7 1.3