Mexico – Beverages COCA-COLA FEMSA U · 2008E P/E Rel to the IPC (x) 1.4 2008E P/E Rel to Soft...
17
Important disclosures/certifications are in the “Important Disclosures” section of this report. U.S. investors’ inquiries should be directed to Santander Investment Securities Inc. at (212) 583-4629/ (212) 350-3918. * Employed by a non-US affiliate of Santander Investment Securities Inc. and is not registered/qualified as a research analyst under NASD rules. Latin American Equity Research Company Update New York, June 9, 2008 Mexico – Beverages COCA-COLA FEMSA UNDERPERFORM Acquisitions Appear Priced In; Downgrading on Valuation vs. Global Peers Alexander Robarts Sergio Matsumoto New York: Santander Investment Securities Inc. New York: Santander Investment Securities Inc. (212) 350-0723 (212) 350-3981 [email protected] [email protected] (06/03/08) CURRENT PRICE: US$62.40/M$64.37 TARGET PRICE: US$65.00/M$72.80 What’s Changed Rating: From Hold to Underperform Price Target (US$): Setting YE 09 at US$65.00 EBITDA Estimates (US$): ’08 from 1,384 to 1,459 Mn ’09 from 1,487 to 1,530 Mn ’10 introducing 1,623 Mn Company Statistics Bloomberg KOF 52-Week Range (US$) 62.40-38.00 2008E P/E Rel to the IPC (x) 1.4 2008E P/E Rel to Soft Drinks (x) 1.7 IPC (US$) 3,054 3-Yr EPADR CAGR (06-09E) 11.5% Market Capitalization (US$ Mn) 11,521 Float (%) 14.7 3-Mth Avg Daily Vol 11.4 Shares Outst – Mn (ADR: 10:1) 1,846 Net Debt/Equity (x) 0.2 Book Value per ADR (US$) 26.7 Estimates and Valuation Ratios 2007 2008E 2009E 2010E Net Earn (M$ Mn) 6,908 8,034 8,792 9,921 Current EPS 3.74 4.35 4.76 5.37 Net Earn (US$ Mn) 633 744 792 878 Current EPADR 3.43 4.03 4.29 4.76 P/E (x) 18.2 15.5 14.5 13.1 P/Sales (x) 1.8 1.6 1.5 1.5 P/CE (x) 12.1 11.8 11.0 10.0 FV/EBITDA (x) 9.8 8.7 8.0 7.2 FV/Sales (x) 2.0 1.8 1.6 1.5 FCF Yield (%) 2.4 5.3 5.7 6.9 Div per Share (US$) 0.41 0.47 0.63 0.67 Div Yield (%) 0.7 0.8 1.0 1.1 Sources: Bloomberg, Company reports, and Santander estimates. Investment Thesis: We are downgrading Coca-Cola Femsa (KOF) to Underperform from Hold based on valuation (relative to the global and Latin bottling peer averages), as potential value accretion from recent acquisitions are fully priced in, in our view. KOF currently trades at a 28% premium to its 2007 forward average FV/EBITDA. Recently, its FV/EBITDA and P/E multiples surpassed its global peer averages after 2007 discounts of 22% and 27%, respectively. We believe the acquisitions of Remil and Jugos del Valle, for a combined firm value of approximately US$540 million, should generate incremental 2008 and 2009 EBITDA of 1.5% and 3.9%, respectively. While soft drink volume growth in KOF’s home market is faster than the home markets’ of its global bottling peers, many factors more than offset this, in our view, suggesting KOF should revert to trade at a relative discount. Compared to its global peers KOF has: (1) significantly lower EVA; (2) higher political risk (Argentina, Brazil and Venezuela); (3) a higher proportion of PET bottles as percentage of total package mix (where we see further upside cost risk); (4) substantially less exposure to faster growing non-carb beverages; (5) a sharper increase in Coca-Cola concentrate costs (in Mexico); and (6) more competition from B-brands, including Big Cola, which continues to help make annual real price increases in Mexico elusive. We also expect the price for KOF’s future non-organic growth to continue to increase, and, with very limited acquisition opportunities in Latam, territories in India, Philippines or South Africa may be targets that could imply new share issuance. Remil was acquired at a 48% premium to KOF’s 2003 Panamco deal and a 54% premium to KOF’s own trailing FV/EBITDA multiple. Finally, we note that starting 1Q08, KOF significantly reduced its financial disclosure making country-specific trends indiscernible. Reasons for Change to Estimates: Our 2008 and 2009 peso EBITDA forecasts remain relatively unchanged. A stronger peso/US$ exchange rate explains the higher U.S. dollar EBITDA estimates. Valuation and Risks to Investment Thesis: We are setting our year- end 2009 target price of US$65.00 based on a sum-of-the-parts DCF analysis. Upside risks include faster private consumer spending growth in Mexico; lower-than-expected raw material costs in Mexico; and less competition from B-brands.
Transcript of Mexico – Beverages COCA-COLA FEMSA U · 2008E P/E Rel to the IPC (x) 1.4 2008E P/E Rel to Soft...

Important disclosures/certifications are in the “Important Disclosures” section of this report. U.S. investors’ inquiries should be directed to Santander Investment Securities Inc. at (212) 583-4629/ (212) 350-3918.
* Employed by a non-US affiliate of Santander Investment Securities Inc. and is not registered/qualified as a research analyst under NASD rules.
Latin American Equity Research Company Update
New York, June 9, 2008 Mexico – Beverages
COCA-COLA FEMSA UNDERPERFORMAcquisitions Appear Priced In; Downgrading on Valuation vs. Global Peers Alexander Robarts Sergio MatsumotoNew York: Santander Investment Securities Inc. New York: Santander Investment Securities Inc.(212) 350-0723 (212) [email protected] [email protected]
(06/03/08) CURRENT PRICE: US$62.40/M$64.37 TARGET PRICE: US$65.00/M$72.80 What’s Changed Rating: From Hold to Underperform Price Target (US$): Setting YE 09 at US$65.00 EBITDA Estimates (US$): ’08 from 1,384 to 1,459 Mn ’09 from 1,487 to 1,530 Mn ’10 introducing 1,623 Mn
Company Statistics Bloomberg KOF 52-Week Range (US$) 62.40-38.00 2008E P/E Rel to the IPC (x) 1.4 2008E P/E Rel to Soft Drinks (x) 1.7 IPC (US$) 3,054 3-Yr EPADR CAGR (06-09E) 11.5% Market Capitalization (US$ Mn) 11,521 Float (%) 14.7 3-Mth Avg Daily Vol 11.4 Shares Outst – Mn (ADR: 10:1) 1,846 Net Debt/Equity (x) 0.2 Book Value per ADR (US$) 26.7
Estimates and Valuation Ratios 2007 2008E 2009E 2010E Net Earn (M$ Mn) 6,908 8,034 8,792 9,921 Current EPS 3.74 4.35 4.76 5.37 Net Earn (US$ Mn) 633 744 792 878 Current EPADR 3.43 4.03 4.29 4.76 P/E (x) 18.2 15.5 14.5 13.1 P/Sales (x) 1.8 1.6 1.5 1.5 P/CE (x) 12.1 11.8 11.0 10.0 FV/EBITDA (x) 9.8 8.7 8.0 7.2 FV/Sales (x) 2.0 1.8 1.6 1.5 FCF Yield (%) 2.4 5.3 5.7 6.9 Div per Share (US$) 0.41 0.47 0.63 0.67 Div Yield (%) 0.7 0.8 1.0 1.1
Sources: Bloomberg, Company reports, and Santander estimates.
Investment Thesis: We are downgrading Coca-Cola Femsa (KOF) to Underperform from Hold based on valuation (relative to the global and Latin bottling peer averages), as potential value accretion from recent acquisitions are fully priced in, in our view. KOF currently trades at a 28% premium to its 2007 forward average FV/EBITDA. Recently, its FV/EBITDA and P/E multiples surpassed its global peer averages after 2007 discounts of 22% and 27%, respectively. We believe the acquisitions of Remil and Jugos del Valle, for a combined firm value of approximately US$540 million, should generate incremental 2008 and 2009 EBITDA of 1.5% and 3.9%, respectively.
While soft drink volume growth in KOF’s home market is faster than the home markets’ of its global bottling peers, many factors more than offset this, in our view, suggesting KOF should revert to trade at a relative discount. Compared to its global peers KOF has: (1) significantly lower EVA; (2) higher political risk (Argentina, Brazil and Venezuela); (3) a higher proportion of PET bottles as percentage of total package mix (where we see further upside cost risk); (4) substantially less exposure to faster growing non-carb beverages; (5) a sharper increase in Coca-Cola concentrate costs (in Mexico); and (6) more competition from B-brands, including Big Cola, which continues to help make annual real price increases in Mexico elusive.
We also expect the price for KOF’s future non-organic growth to continue to increase, and, with very limited acquisition opportunities in Latam, territories in India, Philippines or South Africa may be targets that could imply new share issuance. Remil was acquired at a 48% premium to KOF’s 2003 Panamco deal and a 54% premium to KOF’s own trailing FV/EBITDA multiple. Finally, we note that starting 1Q08, KOF significantly reduced its financial disclosure making country-specific trends indiscernible.
Reasons for Change to Estimates: Our 2008 and 2009 peso EBITDA forecasts remain relatively unchanged. A stronger peso/US$ exchange rate explains the higher U.S. dollar EBITDA estimates.
Valuation and Risks to Investment Thesis: We are setting our year-end 2009 target price of US$65.00 based on a sum-of-the-parts DCF analysis. Upside risks include faster private consumer spending growth in Mexico; lower-than-expected raw material costs in Mexico; and less competition from B-brands.
Recent Latin American Acquisitions Appear Priced in; Downgrading on Valuation
Important disclosures/certifications are in the “Important Disclosures” section of this report. U.S. investors’ inquiries should be directed to Santander Investment Securities Inc. at (212) 583-4629/ (212) 350-3918.
2
Coca-Cola Femsa is the second largest bottler for The Coca-Cola Company worldwide, accounting for 42% and 36% of Coca-Cola Company sales in Mexico and Latin America, respectively. It mainly produces, distributes and markets proprietary Coke brands, including non-carbonated beverages, It operates in nine Latin American countries, with its core Mexican assets accounting for 57% of consolidated EBITDA, as well as Brazil and Colombia, which account for 15% and 11% of consolidated EBITDA, respectively. The company is controlled by Mexico-based brewer Femsa, which owns 54% of KOF shares, while The Coca-Cola Company has a 32% stake.
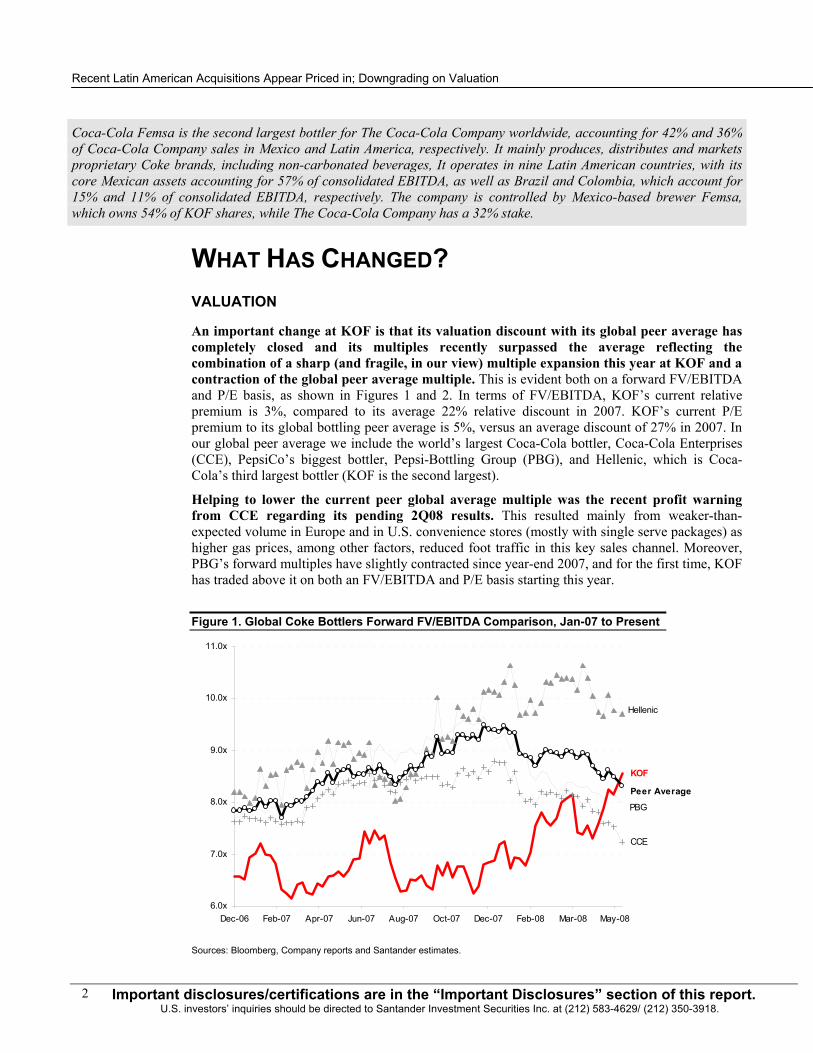
WHAT HAS CHANGED? VALUATION An important change at KOF is that its valuation discount with its global peer average has completely closed and its multiples recently surpassed the average reflecting the combination of a sharp (and fragile, in our view) multiple expansion this year at KOF and a contraction of the global peer average multiple. This is evident both on a forward FV/EBITDA and P/E basis, as shown in Figures 1 and 2. In terms of FV/EBITDA, KOF’s current relative premium is 3%, compared to its average 22% relative discount in 2007. KOF’s current P/E premium to its global bottling peer average is 5%, versus an average discount of 27% in 2007. In our global peer average we include the world’s largest Coca-Cola bottler, Coca-Cola Enterprises (CCE), PepsiCo’s biggest bottler, Pepsi-Bottling Group (PBG), and Hellenic, which is Coca-Cola’s third largest bottler (KOF is the second largest).
Helping to lower the current peer global average multiple was the recent profit warning from CCE regarding its pending 2Q08 results. This resulted mainly from weaker-than-expected volume in Europe and in U.S. convenience stores (mostly with single serve packages) as higher gas prices, among other factors, reduced foot traffic in this key sales channel. Moreover, PBG’s forward multiples have slightly contracted since year-end 2007, and for the first time, KOF has traded above it on both an FV/EBITDA and P/E basis starting this year.
Figure 1. Global Coke Bottlers Forward FV/EBITDA Comparison, Jan-07 to Present
KOF
CCE
Hellenic
PBG
Peer Average
6.0x
7.0x
8.0x
9.0x
10.0x
11.0x
Dec-06 Feb-07 Apr-07 Jun-07 Aug-07 Oct-07 Dec-07 Feb-08 Mar-08 May-08
Sources: Bloomberg, Company reports and Santander estimates.

Important disclosures/certifications are in the “Important Disclosures” section of this report. U.S. investors’ inquiries should be directed to Santander Investment Securities Inc. at (212) 583-4629/(212) 350-3918.
3
Figure 2. Global Coke Bottlers Forward P/E Comparison, Jan-07 to Present
KOF
CCE
Hellenic
PBG
Peer Average
10.0x
12.0x
14.0x
16.0x
18.0x
20.0x
Dec-06 Feb-07 Apr-07 Jun-07 Aug-07 Oct-07 Dec-07 Feb-08 Mar-08 May-08
Sources: Bloomberg, Company reports and Santander estimates.
A closer look at the KOF’s valuation and operating metric versus its global peers helps explain why KOF’s current premium to the peer average is unjustified. First, in terms of EBITDA growth this year and in 2009, KOF is expected to trail the peer average. In 2008, Hellenic’s growth boosts the global peer average considerably. But in 2009, KOF’s growth is slower than all three peers. While KOF’s return on invested capital is line with its peers, its EVA is approximately 50% lower due to higher a WACC.
Figure 3. Global Coke Bottlers Valuation Comparison (As of June 3, 2008)
Bottler Coca-Cola
FemsaGlobal Peer
AverageCoca-Cola
Enterprises
Coca-Cola Hellenic Bottling
Pepsi Bottling Group
Ticker KOF US CCE US EEEK GA PBG USMultiples vs. Growth Market Capitalization 11,521 NM 9,498 15,761 6,967FV/EBITDA 08E 8.7 8.3 7.3 10.1 7.5FV/EBITDA 09E 8.3 7.8 6.9 9.1 7.5P/E 08E 15.5 15.1 13.7 18.3 13.4P/E 09E 14.5 13.5 12.3 15.9 12.3EBITDA 07/08E growth 10.3% 12.4% 1.6% 29.6% 6.1%EBITDA 08E/09E growth 4.9% 7.4% 5.5% 10.9% 5.7%Operating Performance 2007 EBITDA margin 20.8% 13.9% 12.6% 16.4% 12.8%2008E EBITDA margin 20.3% 13.8% 11.9% 16.8% 12.8%ROIC 08E 12.6% 12.0% 9.9% 14.7% 11.5%WACC 10.6% 7.8% 7.4% 8.2% 7.8%EVA 1.9% 4.2% 2.5% 6.5% 3.7%Sources: Bloomberg, Company reports and Santander estimates.
In addition, KOF is exposed to higher political risk, particularly in Argentina, where beverage price controls are in place, Brazil, where soft drink excise taxes may increase in the short term, and Venezuela, where plants have been temporarily closed by union actions. KOF also has a higher proportion of PET bottles as percentage of total package mix. Given an
Premium to global peers is unjustified, in our view.

Recent Latin American Acquisitions Appear Priced in; Downgrading on Valuation
Important disclosures/certifications are in the “Important Disclosures” section of this report. U.S. investors’ inquiries should be directed to Santander Investment Securities Inc. at (212) 583-4629/ (212) 350-3918.
4
estimated 6- to 9-month lag between higher oil prices before they impact PET prices, we expect 2Q08 gross margins to begin to feel the impact of the 81% increase in oil prices over the past nine months. KOF also has substantially less exposure to faster growing non-carb beverages, and while the Jugos del Valle will accelerate a “catch-up”, the lower production economies of scale with non-carbs (relative to soft drinks) should pressure consolidated margins over the medium term.
Also, unlike its peers, KOF is experiencing (through 2009) a sharper increase in Coca-Cola concentrate costs in its core market, Mexico. Finally, we believe KOF has more exposure and competition from soft drink B-brands, including Big Cola, which is Latin America’s largest B-brand producer operating in 9 countries (including Mexico, Venezuela, Colombia and Central America. In Mexico, this competition should continue to cause annual real selling price declines.
Relative to its Latin American bottling peers (Figure 4), KOF is posting similar earnings growth, but has lower operating margins and significantly lower returns on invested capital.
Figure 4. Latam Coke Bottlers Valuation Comparison (As of June 3, 2008)
Bottler Coca-Cola
FemsaLatam Peer
Average Andina Arca ContalTicker KOF US AKO/B ARCA* CONTAL*Santander Rating Underperform Hold Hold HoldMultiples vs. Growth Market Capitalization 11,521 2,233 3,088 1,972FV/EBITDA 08E 8.7 6.6 6.4 6.5 7.0P/E 08E 15.5 12.7 12.7 12.5 12.8EBITDA 07/08E growth 10.3% 11.2% 13.3% 11.5% 8.8%EBITDA 08E/09E growth 4.9% 4.3% 3.4% 3.9% 5.6%Operating Performance EBITDA 07 margin 20.8% 23.4% 25.8% 24.1% 20.3%EBITDA 08E margin 20.3% 24.1% 27.4% 24.1% 20.7%ROIC 08E 12.6% 19.2% 21.6% 18.1% 17.9%WACC 10.6% 11.0% 11.7% 10.3% 11.0%EVA 1.9% 8.1% 9.8% 7.7% 6.9%Sources: Bloomberg, Company reports and Santander estimates.
Figure 5. Coca-Cola FEMSA Historical Forward FV/EBITDA Multiples, 3Q05-Present
6.3x
7.1x
6.1x6.2x 6.1x 6.1x
7.0x
8.5x
7.8x
7.2x
6.5x6.7x
5.0x
6.0x
7.0x
8.0x
9.0x
3Q05
4Q05
1Q06
2Q06
3Q06
4Q06
1Q07
2Q07
3Q07
4Q07
1Q08
Cur
rent
Source: Company Reports and Santander estimates.

Important disclosures/certifications are in the “Important Disclosures” section of this report. U.S. investors’ inquiries should be directed to Santander Investment Securities Inc. at (212) 583-4629/(212) 350-3918.
5
Compared to its own historical forward FV/EBITDA multiple (Figure 5), KOF now trades at a 28% premium to its 2007 forward average (26% over its 3-year average), which we believe is unjustified and implies an unattainable acceleration in earnings growth. As we describe below, the impact of the Remil and Jugos acquisitions (a total of US$530 million) are not expected to materially boost earnings this year, and may add 3.9% to EBITDA in 2009. Also, value accretion to shareholders, given what KOF has paid, may begin at year-end 2009. In addition, we expect the price of non-organic growth (i.e. potential future Coke bottling acquisitions) to continue to increase over the coming years. Finally, we note that operationally, we expect PET costs (about 22% of consolidated cost of sales) to pressure KOF’s consolidated gross margins relatively more than in 2007. In Mexico, higher high fructose corn syrup prices should offset lower sugar prices (total sweetener costs are approximately 20% of Mexico’s cost of sales. In Brazil and in Central America, soft drink volume growth will likely decelerate this year, partly owing to difficult year on year comparisons (which we can no longer closely monitor owing to the recent reduction in KOF’s financial transparency). We are introducing our year-end 2009 target price of US$65.00 and are downgrading the shares to Underperform from Hold. The target price implies a total return of 5% compared to our estimated 14% return for the Mexican local market benchmark. KOF’s shares currently trade at an FV/EBITDA multiple of 8.7 times, or a 10% premium to the implied target multiple of 7.8 times. Our target price is based on a sum-of-the parts DCF analysis and replaces our year-end 2008 target price of US$50 per ADR.
Figure 6. Coca-Cola FEMSA – Valuation by Division (U.S. Dollars in Millions) FCFF 10 Year
CAGR Firm ValueAs % of Total
Firm Value 2009E Total
Debt EquityMexico 5.8% 6,580 52% 1,383 5,197Latincentro 7.4% 3,208 25% 3,208Mercosur 11.8% 2,907 23% 2,907Total 12,696 100% 1,383 11,313Total Cash 973Total Equity 12,286Minority Interest 288Majority Equity 11,998Target ADR Price 2009 65.00Sources: Company reports and Santander estimates.
Figure 7. WACC Calculations and Terminal Growth by Division (U.S. Dollars) Mexico Latincentro MercosurCountry Risk-Free Rate 3.9% 3.9% 3.9%Country Risk 1.5% 3.1% 2.5%Beta 1.07 0.88 0.88Equity Risk Premium 5.5% 5.5% 5.5%Cost of Equity 11.2% 11.8% 11.2%Equity/Total Capital 75% 100% 100%Tax Rate 38% 31% 34%After Tax Cost of Debt 4.7% 6.2% 6.0%WACC 9.6% 11.8% 11.2%Perpetuity Growth Rate 1.6% 2.0% 2.2%Sources: Company reports and Santander estimates.
KOF’s current valuation implies an unjustified 28% premium to its 2007 level, in our view.
We are downgrading the shares to Underperform from Hold.

Recent Latin American Acquisitions Appear Priced in; Downgrading on Valuation
Important disclosures/certifications are in the “Important Disclosures” section of this report. U.S. investors’ inquiries should be directed to Santander Investment Securities Inc. at (212) 583-4629/ (212) 350-3918.
6
JUGOS DEL VALLE – A SECOND ATTEMPT AT NON-CARBS Another change at KOF is that management has recently provided incremental operating information regarding the consolidation of Jugos del Valle, which began in 1Q08.
First, Jugos del Valle in Mexico is now expected to generate positive EBITDA only after May 2009. Part of the reason is that the assets had been operating at depressed EBITDA margin levels (approximately 5% to 6%). Also significant selling and marketing expenses are required to build brand equity in the various non-carb categories, mainly juices. The aggressive marketing underscores how much The Coca-Cola Company, through its bottlers in Mexico, has fallen behind in the non-carb category compared to its competition. As such, the assets are expected to only break-even at the EBITDA level through 2Q09 , and expect 0.8% incremental 2008 volume sales on a consolidated basis (1.5% of Mexico’s volume). Only the Jugos volumes sold to the traditional channel (mom and pops) will be reported in KOF’s quarterly volume sales.
The Jugos deal marks the second formal initiative by the Coke bottlers in Mexico to penetrate these fast-growing categories. The prior initiative, Salesko, partly failed because the bottlers bore the majority of the marketing expense burden. The Jugos ownership structure is more favorable to the bottler in that 50% of the costs will borne by The Coca-Cola Company since they have a 50% stake in the project. However, 50% of the profits, when they begin in 2H09, will also go to Coke. By early June, all but one Coke bottler had purchased a stake in Jugos. This means KOF currently owns approximately 20% of the “joint venture” in Mexico.
The Jugos del Valle assets in Brazil (16% of total Jugos’s Latam sales) should be consolidated into KOF by 4Q08. KOF should have a 30% stake in that project assuming The Coca-Cola Company keeps a 50% stake and the other Coke botters in Brazil buy into the project. KOF in Brazil is expected to be operating with the same non-carb operating structure (excluding water) as in Mexico. Jugos del Valle and tea-based Matte Leao products will begin to be sold at the time of consolidation and combined with Sucos Mais, Powerade and Nestea products, which are already being sold.
Starting this year, KOF must also comply with the antitrust conditions associated with the Jugos acquisition. The main condition is that KOF’s exclusive sales agreements with the convenience store, Oxxo, in KOF’s Mexican franchise territories, must be allowed to expire without renewal. This is to allow other competing beverage products, including B-brands and PepsiCo products, which are not sold in these points of sales, to be available. Oxxo is KOF’s second largest client in Mexico after the Walmex associated stores (including Walmart and Sam’s Clubs), and we estimate Oxxo accounts for approximately 3% of KOF’s total Mexican volume.
The antitrust authorities are also requiring KOF to purchase and install new coolers in mom-and-pop stores where only one Coca-Cola cooler is available and/or other beverage products are not, which according to management total approximately 15,000 outlets. If all these points of sale required new coolers, we estimate the all-in-cost to be approximately US$12 million, or about 2.2% of our estimated 2008 operating income in Mexico. Recall that mom-and-pop stores in Mexico are the most profitable points of sale for KOF, and account for approximately 70% of total volume. We see this condition as another source of increased competition and less price flexibility. We also understand that compliance with this condition should be reached by the end of 2008.
Finally, we note that by paying a transaction multiple of 21.2 times trailing FV/EBITDA, KOF’s Jugos deal also underscore how expensive non-organic growth is for Latin American bottlers. Recall that the deal was first announced in December 2006 and we estimate that it will take at least three years to achieve a trailing single-digit multiple.
Jugos’s EBITDA expected to be positive in 2H09.
KOF’s exclusivities at Oxxo will start to expire this year.

Important disclosures/certifications are in the “Important Disclosures” section of this report. U.S. investors’ inquiries should be directed to Santander Investment Securities Inc. at (212) 583-4629/(212) 350-3918.
7
REMIL – THE LAST MEANINGFUL COKE ACQUISITION IN LATAM? Others changes at KOF relate to Remil, including the fact that the transaction has taken longer than expected to close and that related capex increases our consolidated 2008 and 2009 capex estimates by 8% and 10%, respectively. According to management, the delay in closing the deal is associated with final due diligence with The Coca-Cola Company. As such, instead of starting in the peak summer months of 1Q08, the first full quarter of consolidated will now likely be winter months of 3Q08. Also, owing to expected investments in distribution and information technology related to Remil, we now expect consolidated capex to reach US$400 million this year and US$425 million in 2009. We estimate the Remil acquisition may start to become value accretive to KOF shareholders at year-end 2009, assuming the final price does not change and KOF can boost Remil’s EBITDA margin by 350 basis points (which would be below KOF Brazil’s 2007 EBITDA margin level). According to the KOF’s results’ conference calls, Remil’s EBITDA margin is approximately 5 percentage points below KOF Brazil’s EBITDA margin level.
Since Remil’s franchise territory is not contiguous to KOF’s territories in Brazil, Remil’s bottling plant will not be closed. In many prior Latin American Coke bottling acquisitions, typically the best sources of operational synergies has been to serve the newly acquired territory from existing plants. In this case, KOF’s Remil’s transaction is a “revenue”-driven acquisition. KOF is expected to apply its operational expertise to Remil gleaned from its five years in Brazil since it acquired Panamco, which had assets in the states of Sao Paulo and Mato Grosso do Sul. Selling expenses in the Remil territories should also begin to reflect stepped-up efforts behind Femsa’s beer brands, Kaiser and Sol.
Figure 8. Mexican Coke Bottlers – Firm Value/Unit Case Transaction Multiples, 1994-2007 Date Territory/Country Acquirer Stake Unit Cases FV/Unit CaseSep 1994 Buenos Aires, Arg KOF 51% 91.7 2.79Oct 1994 Santos, Brazil Panamco 100% 10.7 3.73Nov 1995 Costa Rica Panamco 100% 21.0 2.86Feb 1996 Buenos Aires, Arg KOF 24% 88.2 4.56Feb 1996 San Isidro, Arg KOF 100% 13.3 4.24May 1997 Venezuela Panamco 100% 210.0 5.29Aug 1997 Nicaragua Panamco 100% 15.1 2.78Sep 1997 Buenos Aires, Arg KOF 25% 102.0 3.86Nov 1997 Tapachula, Mexico KOF 100% 8.0 1.55Sep 1998 Mato Grosso do Sul, Brazil Panamco 100% 13.7 3.13Oct 2000 Paraguay Coca-Cola 58% 25.7 3.78May 2003 Panamco (Regional) KOF 100% 1228.0 3.03Average Transaction Multiple (1994-2003) 3.47July 2007 Minas Gerais , Brazil (Remil) KOF 100% 85 4.47Remil’s Premium to the Panamco transaction 48%Remil’s Premium to Average of Last 12 transactions 29%Sources: Company reports and Santander estimates.
The estimated 2007 FV/EBITDA and FV/unit case transaction multiples for Remil are 12.6 times and US$4.47, respectively, which compares to KOF’s 2007 FV/EBITDA multiple of 6.7 times (trailing 2007 FV/EBITDA 8.2 times) and the 2003 Panamco acquisition at US$3.03 per unit case. This provides further evidence of how the price of non-organic growth for Coke bottlers in Latin America has sharply increased.
Part of the explanation for increasingly expensive acquired growth is scarcity of franchise territories in Latin America. Indeed, the Remil deal was facilitated by the fact that The Coca-Cola Company was the owner of the territory, rather than a family, whose only source of wealth creation is their Coke bottling franchise. In Latin America, the vast majority of the franchise
Value accretive in 2010; a “revenue” rather than a synergy-driven transaction.
Scarcity of targets in Latin America.

Recent Latin American Acquisitions Appear Priced in; Downgrading on Valuation
Important disclosures/certifications are in the “Important Disclosures” section of this report. U.S. investors’ inquiries should be directed to Santander Investment Securities Inc. at (212) 583-4629/ (212) 350-3918.
8
territories are family-owned. This helps explains why over the last eight years, there have only been two noteworthy Coke bottler acquisitions in the region.
The acquisition price of Remil could have been even higher, in our view, had Chile-based Andina (which operates the Rio de Janeiro Coke franchise) been asked to participate in a bidding process for the asset. Recall that Andina, whose Brazilian territory is contiguous to Remil, had completed an asset swap with the Coca-Cola-controlled Remil several years earlier. However, according to Andina, they were not invited to the negotiating table.
Going forward, we expect the price for KOF’s future non-organic growth to continue to increase, and with very limited opportunities in Latam, territories in India, Philippines or South Africa may be targets that could imply new share issuance. Increasing scarcity of potential acquisition targets explains part of this expected price spiral. Given KOF’s sheer size, there are very few Coke franchise territories left in Latin America that could have a material impact on KOF’s consolidated EBITDA. Even with Remil, we estimate it may add approximately 3.2% to KOF’s operating earnings in 2009.
Unsuccessful discussions with smaller Brazilian and Mexican privately owned Coke bottlers have been ongoing for years, and we do not see why that trend would change. Also, the three other publicly listed (and family-owned) Coke bottlers in Latin America are in strong operational health (unlike Panamco in 2003), and we believe they would not be interested in taking part in “joint venture” discussions with KOF.
In this context of scarcity of targets in Latin America, together with a mid-single-digit organic earnings growth rate expected over the coming years at KOF, we would not be surprised if it has to set its acquisition sights on more far-flung places to grow non-organically. In these cases, capturing synergies are likely to be even more difficult and or take longer to achieve, which in turn could set the stage for still higher asset prices.
In our view, the most likely future acquisitions may be where The Coca-Cola Company has recently acquired bottlers, the Philippines, or where PepsiCo has been increasing its strategic focus, India. There could also be a rationale for SABMiller to be interested in selling its soft drink assets in South Africa as part of a larger transaction. In most of these cases, while KOF’s debt capacity has increased since the 2003 Panamco acquisition, we would not be surprised if KOF contemplated a new share offering as part of the deal.
REDUCED FINANCIAL DISCLOSURE Another recent change at KOF is that staring in 1Q08, management significantly reduced reported quarterly financial transparency. Specifically, the assets in Brazil and Argentina will no longer be operationally broken down separately, but rather lumped into one operating division called Mercosur. Also KOF’s assets in Colombia, Venezuela and Central America are now being reported together as one division called Latinocentro. We attribute the decision to reduce transparency to increased competition with AmBev, mainly in Brazil and Argentina. We believe another reason could be KOF’s reluctance to provide country-specific information to labor unions which could strengthen their position in any future negotiations. Overall, the ability to monitor, measure and forecast operating trends in key countries like Brazil and Colombia, as well as gauge the impact and progress of the Remil acquisition in Brazil, will be significantly reduced henceforth, in our view.
Further material acquisitions in Latin America unlikely.

Important disclosures/certifications are in the “Important Disclosures” section of this report. U.S. investors’ inquiries should be directed to Santander Investment Securities Inc. at (212) 583-4629/(212) 350-3918.
9
REVISED EARNINGS ESTIMATES Our 2008 and 2009 peso EBITDA forecasts remain relatively unchanged. However, because our 2008 average peso/dollar exchange rate forecast expects 3.6% stronger peso, our 2008 and 2009 EBITDA estimates in dollars are 5.4% and 2.9% higher. The stronger exchange rate is partly offset by a reduction in the incremental 2008 EBITDA from Remil. As a result of the delay is closing the Remil deal as discussed above, we are reducing the incremental EBITDA from Remil to be consolidated beginning in June 2008 (winter in Brazil) from the full fiscal year 2008.
Figure 9. Coca-Cola FEMSA – Estimates Revisions, 2008E-2010E (U.S. Dollars in Millions*) 2008E 2009E 2010E Previous Current Change Previous Current Change Previous Current Change
Revenue 6,575 7,186 9.3% 6,940 7,450 7.4% NA 7,814 NAOp. Profit 1,073 1,178 9.8% 1,151 1,219 5.9% NA 1,298 NAOp. Margin 16.3% 16.4% 7 bps 16.6% 16.4% -22 bps NA 16.6% NAEBITDA 1,384 1,459 5.4% 1,487 1,530 2.9% NA 1,623 NANet Income 675 744 10.2% 743 792 6.6% NA 878 NAEPADR 3.65 4.03 10.2% 4.02 4.29 6.6% NA 4.76 NA*Except per ADR data. NA Not available. Sources: Company reports and Santander estimates.
Figure 10. Mexico – Select Economic Projections, 2007-2010E 2007 2008E 2009E 2010EReal GDP (%) 3.3% 3.0% 3.6% 3.6%CPI Inflation (%) 3.8% 4.4% 3.8% 3.8%US$ Exchange Rate (Year-End) 10.92 10.90 11.20 11.40US$ Exchange Rate (Average) 10.90 10.80 11.10 11.30Interest Rate (Year-End) 7.4% 7.5% 7.3% 7.3%Interest Rate (Average) 7.2% 7.5% 7.3% 7.3%Private Consumption Spending 4.2% 4.2% 4.6% 4.6%Real Total Payroll Growth 6.0% 5.9% 5.3% 5.3%Source: Santander historicals and forecasts.
RISKS TO INVESTMENT THESIS Our upside risks include:
• Faster private consumer spending growth in Mexico;
• Lower-than-expected raw material costs in Mexico; and
• Less competition from B-brands.

Recent Latin American Acquisitions Appear Priced in; Downgrading on Valuation
Important disclosures/certifications are in the “Important Disclosures” section of this report. U.S. investors’ inquiries should be directed to Santander Investment Securities Inc. at (212) 583-4629/ (212) 350-3918.
10
Figure 11. Coca-Cola FEMSA – Volume Assumptions (Millions of Unit Cases), 2007-2010E
2007 2008E 2009E 2010EMexico Soft Drink 869.5 889.5 916.1 939.0Mexico Water 229.4 240.8 250.4 259.2Mexico Other 11.5 28.3 29.7 31.2Mexico Beverage 1110.4 1158.5 1196.2 1229.4Latincentro Soft Drink 477.3 494.3 511.6 529.5Latincentro Water 39.1 40.4 41.9 43.1Latincentro Other 18.5 18.5 19.1 19.6Latincentro Beverage 534.9 553.3 572.6 592.3Mercosur Soft Drink 444.2 471.7 493.5 516.3Mercosur Water 21.6 22.2 23.0 23.7Mercosur Other 9.7 11.3 11.9 12.6Mercosur Beverage 475.5 505.2 528.4 552.5Consolidated Soft Drink 1791.0 1855.5 1921.2 1984.8Consolidated Water 290.1 303.4 315.3 326.0Consolidated Other 39.7 58.1 60.7 63.4Consolidated Volume 2120.8 2217.0 2297.2 2374.2Volume Growth (%) Mexico Soft Drink 2.0% 2.3% 3.0% 2.5%Mexico Water 9.7% 5.0% 4.0% 3.5%Mexico Other 23.7% 145.8% 5.0% 5.0%Mexico Beverage 3.7% 4.3% 3.3% 2.8%Latincentro Beverage 8.3% 3.4% 3.5% 3.4%Mercosur Beverage 9.7% 6.2% 4.6% 4.6%Consolidated Volume Growth 6.2% 4.5% 3.6% 3.4%Sources: Company reports and Santander estimates.

Important disclosures/certifications are in the “Important Disclosures” section of this report. U.S. investors’ inquiries should be directed to Santander Investment Securities Inc. at (212) 583-4629/(212) 350-3918.
11
FINANCIAL STATEMENTS Figure 12. Coca-Cola FEMSA – Income Statement, Balance Sheet, and CF Statement, 2007-2010E (U.S. Dollars in Millions) Income Statement 2007 % 2008E % 2009E % 2010E %Sales 6,343 100.0% 7,186 100.0% 7,450 100.0% 7,814 100.0%Cost of Sales 3,286 51.8% 3,714 51.7% 3,853 51.7% 4,025 51.5%Gross Profit 3,056 48.2% 3,472 48.3% 3,598 48.3% 3,789 48.5%Oper. and Adm. Expenses 2,008 31.7% 2,294 31.9% 2,378 31.9% 2,490 31.9%Operating Profit 1,048 16.5% 1,178 16.4% 1,219 16.4% 1,298 16.6%Depreciation 151 2.4% 165 2.3% 193 2.6% 210 2.7%EBITDA 1,322 20.8% 1,459 20.3% 1,530 20.5% 1,623 20.8%Net Interest Expense 129 2.0% 77 1.1% 55 0.7% 20 0.3%Monetary Gain/Loss (92) -1.5% (5) -0.1% (6) -0.1% (6) -0.1%FX Gain/Loss (9) -0.1% (29) -0.4% (29) -0.4% (28) -0.4%Other Income/Expenses (64) -1.0% (64) -0.9% (58) -0.8% (48) -0.6%Profit before Taxes 956 15.1% 1,071 14.9% 1,140 15.3% 1,264 16.2%Tax Provision 306 4.8% 309 4.3% 329 4.4% 365 4.7%Majority Net Profit 633 10.0% 744 10.4% 792 10.6% 878 11.2%Balance Sheet 2007 % 2008E % 2009E % 2010E %Assets 7,985 100.0% 8,645 100.0% 8,903 100.0% 9,323 100.0% Short-Term Assets 1,599 20.0% 1,809 20.9% 2,066 23.2% 2,506 26.9% Cash and Equivalents 691 8.7% 767 8.9% 973 10.9% 1,348 14.5% Accounts Receivable 431 5.4% 517 6.0% 544 6.1% 578 6.2% Inventories 313 3.9% 344 4.0% 355 4.0% 371 4.0% Other Short Term Assets 164 2.1% 181 2.1% 194 2.2% 209 2.2% Fixed Assets 2,008 25.1% 2,451 28.3% 2,569 28.9% 2,623 28.1% Goodwill 489 6.1% 490 5.7% 477 5.4% 468 5.0% Intangibles 3,889 48.7% 3,895 45.1% 3,791 42.6% 3,725 40.0%Liabilities 3,334 41.8% 3,295 38.1% 3,047 34.2% 2,825 30.3% Short-T. Liabilities 1,483 18.6% 1,332 15.4% 1,339 15.0% 1,360 14.6% Suppliers 559 7.0% 637 7.4% 660 7.4% 693 7.4% Short Term Debt 466 5.8% 212 2.5% 180 2.0% 147 1.6% Other ST Liabilities 459 5.7% 483 5.6% 499 5.6% 520 5.6% Long Term Debt 1,292 16.2% 1,423 16.5% 1,203 13.5% 986 10.6% Other Liabilities 559 7.0% 539 6.2% 505 5.7% 479 5.1%Majority Net Worth 4,501 56.4% 5,200 60.1% 5,709 64.1% 6,354 68.2%Net Worth 4,651 58.2% 5,351 61.9% 5,855 65.8% 6,498 69.7%Minority Interest 150 1.9% 151 1.7% 147 1.6% 144 1.5%Net Debt 1,067 13.4% 869 10.0% 410 4.6% -215 -2.3%Cash Flow 2007 % 2008E % 2009E % 2010E %Net Majority Earnings 651 762 811 899Non-Cash Items/Other 477 189 217 232Changes in Working Capital (135) (29) (7) (8)Capital Increases/Dividends 76 88 116 124Change in Debt (119) (101) (252) (252)Capital Expenditures (620) (400) (425) (352)Net Investments (185) (258) 0 0Net Cash Flow 96 76 229 395Beginning Cash Flow 410 698 753 965Ending Cash Flow 691 774 982 1,359Sources: Company reports and Santander estimates.

Recent Latin American Acquisitions Appear Priced in; Downgrading on Valuation
Important disclosures/certifications are in the “Important Disclosures” section of this report. U.S. investors’ inquiries should be directed to Santander Investment Securities Inc. at (212) 583-4629/ (212) 350-3918.
12
Figure 13. Coca-Cola FEMSA – Income Statement, Balance Sheet, and CF Statement, 2007-2010E (Millions of Nominal Mexican Pesos) Income Statement 2007 % 2008E % 2009E % 2010E %Sales 69,251 100.0% 77,606 100.0% 82,699 100.0% 88,290 100.0%Cost of Sales 35,881 51.8% 40,109 51.7% 42,766 51.7% 45,481 51.5%Gross Profit 33,370 48.2% 37,497 48.3% 39,933 48.3% 42,808 48.5%Oper. and Adm. Expenses 21,923 31.7% 24,772 31.9% 26,399 31.9% 28,138 31.9%Operating Profit 11,447 16.5% 12,726 16.4% 13,534 16.4% 14,671 16.6%Depreciation 1,645 2.4% 1,778 2.3% 2,147 2.6% 2,369 2.7%EBITDA 14,434 20.8% 15,752 20.3% 16,986 20.5% 18,337 20.8%Net Interest Expense 1,412 2.0% 837 1.1% 610 0.7% 222 0.3%Monetary Gain/Loss (1,007) -1.5% (56) -0.1% (63) -0.1% (64) -0.1%FX Gain/Loss (99) -0.1% (317) -0.4% (317) -0.4% (317) -0.4%Other Income/Expenses (702) -1.0% (694) -0.9% (644) -0.8% (544) -0.6%Profit before Taxes 10,439 15.1% 11,568 14.9% 12,659 15.3% 14,285 16.2%Tax Provision 3,336 4.8% 3,339 4.3% 3,654 4.4% 4,123 4.7%Majority Net Profit 6,908 10.0% 8,034 10.4% 8,792 10.6% 9,921 11.2%Balance Sheet 2007 % 2008E % 2009E % 2010E %Assets 87,178 100.0% 94,233 100.0% 99,712 100.0% 106,260 100.0% Short-Term Assets 17,458 20.0% 19,721 20.9% 23,139 23.2% 28,563 26.9% Cash and Equivalents 7,542 8.7% 8,361 8.9% 10,900 10.9% 15,359 14.5% Accounts Receivable 4,706 5.4% 5,636 6.0% 6,089 6.1% 6,586 6.2% Inventories 3,418 3.9% 3,753 4.0% 3,981 4.0% 4,232 4.0% Other Short Term Assets 1,792 2.1% 1,971 2.1% 2,168 2.2% 2,385 2.2% Fixed Assets 21,923 25.1% 26,714 28.3% 28,776 28.9% 29,901 28.1% Goodwill 5,339 6.1% 5,339 5.7% 5,339 5.4% 5,339 5.0% Intangibles 42,458 48.7% 42,458 45.1% 42,458 42.6% 42,458 40.0%Liabilities 36,397 41.8% 35,911 38.1% 34,131 34.2% 32,197 30.3% Short-T. Liabilities 16,197 18.6% 14,524 15.4% 14,994 15.0% 15,500 14.6% Suppliers 6,100 7.0% 6,941 7.4% 7,396 7.4% 7,897 7.4% Short Term Debt 5,088 5.8% 2,314 2.5% 2,014 2.0% 1,679 1.6% Other ST Liabilities 5,009 5.7% 5,269 5.6% 5,584 5.6% 5,925 5.6% Long Term Debt 14,102 16.2% 15,515 16.5% 13,476 13.5% 11,235 10.6% Other Liabilities 6,098 7.0% 5,873 6.2% 5,661 5.7% 5,462 5.1%Majority Net Worth 49,140 56.4% 56,680 60.1% 63,940 64.1% 72,422 68.2%Net Worth 50,781 58.2% 58,321 61.9% 65,581 65.8% 74,063 69.7%Minority Interest 1,641 1.9% 1,641 1.7% 1,641 1.6% 1,641 1.5%Net Debt 11,648 13.4% 9,468 10.0% 4,589 4.6% -2,446 -2.3%Cash Flow 2007 % 2008E % 2009E % 2010E %Net Majority Earnings 7,103 8,229 9,006 10,162Non-Cash Items/Other 5,213 2,045 2,414 2,618Changes in Working Capital (1,475) (314) (77) (92)Capital Increases/Dividends (831) (945) (1,285) (1,407)Change in Debt (1,302) (1,092) (2,800) (2,849)Capital Expenditures & Inv. (6,772) (4,320) (4,718) (3,973)Net Investments (2,020) (2,784) 0 0Net Cash Flow 1,049 819 2,539 4,459Beginning Cash Flow 4,473 7,542 8,361 10,900Ending Cash Flow 7,542 8,361 10,900 15,359Sources: Company reports and Santander estimates.

Important disclosures/certifications are in the “Important Disclosures” section of this report. U.S. investors’ inquiries should be directed to Santander Investment Securities Inc. at (212) 583-4629/(212) 350-3918.
13
Figure 14. KOF Mexico – Income Statement 2007-2010E (U.S. Dollars in Millions) 2007 2008E 2009E 2010EMexico Beverage Sales 2,967 3,198 3,302 3,428Other Mexico Sales 14 14 15 15Total Mexican Sales 2,981 3,212 3,317 3,442Depreciation 83 92 110 117Cost of Sales 1,340 1,443 1,470 1,519Gross Profit 1,558 1,678 1,737 1,806Gross Margin 52.3% 52.2% 52.4% 52.5%Operating Expense 957 1,029 1,062 1,102As a Pct of Sales 32.1% 32.0% 32.0% 32.0%Operating Income 602 649 675 704Operating Margin 20.2% 20.2% 20.4% 20.5%Non-Cash Items 67.9 68.7 55.2 53.8EBITDA 753 811 842 876EBITDA margin 25.2% 25.2% 25.4% 25.5%Sources: Company reports and Santander estimates.
Figure 15. KOF Mexico – Income Statement, 2007-2010E (Millions of Nominal Mexican Pesos) 2007 2008E 2009E 2010EMexico Beverage Sales 32,398 34,534 36,657 38,728Other Mexico Sales 152 157 161 166Total Mexican Sales 32,550 34,691 36,819 38,894Depreciation 908 989 1,220 1,324Cost of Sales 14,629 15,585 16,315 17,160Gross Profit 17,013 18,117 19,284 20,410Gross Margin 52.3% 52.2% 52.4% 52.5%Operating Expense 10,444 11,110 11,791 12,456As a Pct of Sales 32.1% 32.0% 32.0% 32.0%Operating Income 6,569 7,008 7,493 7,954Operating Margin 20.2% 20.2% 20.4% 20.5%Non-Cash Items 741 758 629 624EBITDA 8,218 8,755 9,341 9,903EBITDA margin 25.2% 25.2% 25.4% 25.5%Sources: Company reports and Santander estimates.

Recent Latin American Acquisitions Appear Priced in; Downgrading on Valuation
Important disclosures/certifications are in the “Important Disclosures” section of this report. U.S. investors’ inquiries should be directed to Santander Investment Securities Inc. at (212) 583-4629/ (212) 350-3918.
14
Figure 16. KOF Latincentro – Income Statement 2007-2010E (U.S. Dollars in Millions) 2007 2008E 2009E 2010ELatincentro Beverage Sales 1,968 2,249 2,482 2,623Other Latincentro Sales 3 3 3 3Total Latincentro Sales 1,972 2,252 2,485 2,627Depreciation 45 50 60 64Cost of Sales 1,041 1,186 1,299 1,370Gross Profit 886 1,016 1,126 1,193Gross Margin 44.9% 45.1% 45.3% 45.4%Operating Expense 654 743 822 870As a Pct of Sales 33.2% 33.0% 33.1% 33.1%Operating Income 232 273 305 323Operating Margin 11.7% 12.1% 12.3% 12.3%Non-Cash Items 37.0 38.4 37.2 38.6EBITDA 314 362 402 426EBITDA margin 15.9% 16.1% 16.2% 16.2%Sources: Company reports and Santander estimates.
Figure 17. KOF Latincentro – Income Statement, 2007-2010E (Millions of Nominal Mexican Pesos) 2007 2008E 2009E 2010ELatincentro Beverage Sales 21,492 24,286 27,552 29,640Other Latincentro Sales 34 35 36 37Total Latincentro Sales 21,526 24,321 27,588 29,677Depreciation 495 539 665 722Cost of Sales 11,363 12,804 14,421 15,476Gross Profit 9,668 10,978 12,502 13,479Gross Margin 44.9% 45.1% 45.3% 45.4%Operating Expense 7,139 8,028 9,120 9,825As a Pct of Sales 33.2% 33.0% 33.1% 33.1%Operating Income 2,529 2,951 3,383 3,654Operating Margin 11.7% 12.1% 12.3% 12.3%Non-Cash Items 404 415 413 436EBITDA 3,428 3,904 4,461 4,812EBITDA margin 15.9% 16.1% 16.2% 16.2%Sources: Company reports and Santander estimates.

Important disclosures/certifications are in the “Important Disclosures” section of this report. U.S. investors’ inquiries should be directed to Santander Investment Securities Inc. at (212) 583-4629/(212) 350-3918.
15
Figure 18. KOF Mercosur – Income Statement 2007-2010E (U.S. Dollars in Millions) 2007 2008E 2009E 2010EMercosur Beverage Sales 1,381 1,698 1,625 1,722Other Mercosur Sales 7 23 23 24Total Mercosur Sales 1,388 1,722 1,648 1,745Depreciation 22 24 29 31Cost of Sales 755 939 885 925Gross Profit 611 758 734 789Gross Margin 44.0% 44.0% 44.5% 45.2%Operating Expense 398 522 494 518As a Pct of Sales 28.6% 30.3% 30.0% 29.7%Operating Income 213 236 239 271Operating Margin 15.4% 13.7% 14.5% 15.5%Non-Cash Items 18.1 25.6 18.1 18.3EBITDA 254 286 287 321EBITDA margin 18.3% 16.6% 17.4% 18.4%Sources: Company reports and Santander estimates.
Figure 19. KOF Mercosur – Income Statement, 2007-2010E (Millions of Nominal Mexican Pesos) 2007 2008E 2009E 2010EMercosur Beverage Sales 15,079 18,343 18,034 19,452Other Mercosur Sales 76 251 258 266Total Mercosur Sales 15,155 18,594 18,292 19,719Depreciation 242 263 325 352Cost of Sales 8,244 10,143 9,821 10,447Gross Profit 6,669 8,188 8,146 8,920Gross Margin 44.0% 44.0% 44.5% 45.2%Operating Expense 4,340 5,634 5,488 5,857As a Pct of Sales 28.6% 30.3% 30.0% 29.7%Operating Income 2,329 2,553 2,658 3,063Operating Margin 15.4% 13.7% 14.5% 15.5%Non-Cash Items 197 276 201 207EBITDA 2,768 3,093 3,184 3,622EBITDA margin 18.3% 16.6% 17.4% 18.4%Sources: Company reports and Santander estimates.

Recent Latin American Acquisitions Appear Priced in; Downgrading on Valuation
Important disclosures/certifications are in the “Important Disclosures” section of this report. U.S. investors’ inquiries should be directed to Santander Investment Securities Inc. at (212) 583-4629/ (212) 350-3918.
16
IMPORTANT DISCLOSURES Coca-Cola FEMSA– 12-Month Relative Performance (U.S. Dollars)
Coca-Cola Femsa
IPC
708090
100110120130140150160
J-07 A-07 O-07 D-07 F-08 A-08 J-08
Sources: Bloomberg and Santander.
Coca-Cola FEMSA– Three-Year Stock Performance (U.S. Dollars)
17
22
27
32
37
42
47
52
57
62
M-05 J-05 S-05 D-05 M-06 J-06 S-06 D-06 M-07 J-07 S-07 D-07 M-08500
1,000
1,500
2,000
2,500
3,000
3,500
Coca Cola Femsa (L Axis) IPC (R Axis)
H $30.007/21/05
H $31.502/9/06
H $35.5010/25/06
U $37.002/15/07
H $50.0010/11/07
Source: Santander.
Analyst Recommendations and Price Objectives SB: Strong Buy B: Buy H: Hold UP: Underperform S: Sell UR: Under Review

2008
IMPORTANT DISCLOSURES Key to Investment Codes Rating
Definition
% of Companies
Covered with This Rating
% of Companies Provided Investment Banking
Services in the Past 12 Months
Buy Expected to outperform the local market benchmark by more than 5.0%. 61.03% 70.59%Hold Expected to perform within a range of 5.0% above or below the local market
benchmark. 33.85% 29.41%
Underperform/Sell Expected to underperform the local market benchmark by more than 5.0%. 5.13% –The numbers above reflect our Latin American universe as of Friday, May 9, 2008. For a discussion, if applicable, of the valuation methods used to determine the price targets included in this report and the risks to achieving these targets, please refer to the latest published research on these stocks. Research is available through your sales representative and other electronic systems. Target prices are 2008 year-end unless otherwise specified. Recommendations are based on a total return basis (expected share price appreciation + prospective dividend yield) unless otherwise specified. Stock price charts and rating histories for companies discussed in this report are also available by written request to Santander Investment Securities Inc., 45 East 53rd Street, 17th Floor (Attn: Research Disclosures), New York, NY 10022 USA. Ratings are established when the firm sets a target price and/or when maintaining or reiterating the rating. Ratings may not coincide with the above methodology due to price volatility. Management reserves the right to maintain or to modify ratings on any specific stock and will disclose this in the report when it occurs. Valuation methodologies vary from stock to stock, analyst to analyst, and country to country. Any investment in Latin American equities is, by its nature, risky. A full discussion of valuation methodology and risks related to achieving the target price of the subject security is included in the body of this report. The benchmark used for local market performance is the country risk of each country plus the 1-year U.S. Treasury yield plus 5.5% of equity risk premium, unless otherwise specified. The benchmark plus or minus the 5.0% differential used to determine the rating is time adjusted to make it comparable with the total return of the stock over the same period. For additional information about our rating methodology, please call (212) 350 3974. This report has been prepared by Santander Investment Securities Inc. (“SIS”) (a subsidiary of Santander Investment I S.A which is wholly owned by Banco Santander, S.A. ("Santander"), on behalf of itself and its affiliates (collectively, Grupo Santander) and is provided for information purposes only. This document must not be considered as an offer to sell or a solicitation of an offer to buy any relevant securities (i.e., securities mentioned herein or of the same issuer and/or options, warrants, or rights with respect to or interests in any such securities). Any decision by the recipient to buy or to sell should be based on publicly available information on the related security and, where appropriate, should take into account the content of the related prospectus filed with and available from the entity governing the related market and the company issuing the security. This report is issued in Spain by Santander Central Hispano Bolsa, Sociedad de Valores, S.A. (SCH Bolsa), and in the United Kingdom by Banco Santander, S.A., London Branch (Santander London), which is regulated by the Financial Services Authority in the conduct of investment business in the UK. This report is not being issued to private customers. SIS, Santander London, and SCH Bolsa are members of Grupo Santander. The following analysts hereby certify that their views about the companies and their securities discussed in this report are accurately expressed, that their recommendations reflect solely and exclusively their personal opinions, and that such opinions were prepared in an independent and autonomous manner, including as regards the institution to which they are linked, and that they have not received and will not receive direct or indirect compensation in exchange for expressing specific recommendations or views in this report, since their compensation and the compensation system applying to Grupo Santander and any of its affiliates is not pegged to the pricing of any of the securities issued by the companies evaluated in the report, or to the income arising from the businesses and financial transactions carried out by Grupo Santander and any of its affiliates: Alexander Robarts and Sergio Matsumoto. Grupo Santander receives non-investment banking revenue from the subject company. The information contained herein has been compiled from sources believed to be reliable, but, although all reasonable care has been taken to ensure that the information contained herein is not untrue or misleading, we make no representation that it is accurate or complete and it should not be relied upon as such. All opinions and estimates included herein constitute our judgment as at the date of this report and are subject to change without notice. Any U.S. recipient of this report (other than a registered broker-dealer or a bank acting in a broker-dealer capacity) that would like to effect any transaction in any security discussed herein should contact and place orders in the United States with SIS, which, without in any way limiting the foregoing, accepts responsibility (solely for purposes of and within the meaning of Rule 15a-6 under the U.S. Securities Exchange Act of 1934) for this report and its dissemination in the United States. © 2008 by Santander Investment Securities Inc. All Rights Reserved.