METHODS OF FINANCING RENEWABLE ENERGY INVESTMENTS IN … · METHODS OF FINANCING RENEWABLE ENERGY...
78
C entre for R enewable E nergy S ources METHODS OF FINANCING RENEWABLE ENERGY INVESTMENTS IN GREECE Nicholas P. Vassilakos Nicholas Karapanagiotis Dimitris Fertis Kostas Tigas September 2003
Transcript of METHODS OF FINANCING RENEWABLE ENERGY INVESTMENTS IN … · METHODS OF FINANCING RENEWABLE ENERGY...
Centre for Renewable Energy Sources
METHODS OF FINANCING RENEWABLE ENERGY INVESTMENTS
IN GREECE
Nicholas P. Vassilakos
Nicholas Karapanagiotis
Dimitris Fertis
Kostas Tigas
September 2003

Produced by:Centre for Renewable Energy Sources (CRES),
19th km Marathonos Ave., GR- 190 09 Pikermi, Attica, GreeceTel: +30 210 6603300, Fax: +30 210 6603301-2
http://www.cres.grContact: Dr. N. Karapanagiotis, e-mail: [email protected]
Written by:Dr. Nicholas P. Vassilakos, Vice President of ELFORES
Dr. Nicolas Karapanagiotis, Dr. Dimitris Fertis and Mr. Kostas Tigas
Printed in Greece
CRES - CENTRE FOR RENEWABLE ENERGY SOURCES19th km Marathonos Av. 190 09 Pikermi AttikaTel.: +30210 6603 300 Fax: +30210 6603 301-2
METHODS OF FINANCINGMETHODS OF FINANCINGRENEWABLE ENERGY INVESTMENTSRENEWABLE ENERGY INVESTMENTS
IN GREECEIN GREECE
AAuthors:
Dr. Nicholas P. Vassilakos, Vice President of ELFORES & Member of the Governing Board ofthe European Renewable Energies Federation (EREF)Dr. Nicolas K. Karapanagiotis, CRES – Senior Expert, Market Development DepartmentDr. Dimitris Fertis, Inergy Development SAKostas Tigas, CRES – Director, Division for Energy Information Systems, Dissemination &Market Development
September 2003
(Brochure design and technical coordination: M Markos Kapiris, CRES - Department for Energy InformationSystems)

TABLE OF CONTENTS
CHAPTER 1: STATUS OF RES & RET DEPLOYMENT IN GREECE
1.1 Introduction.................................................................................................................................51.2 RES Deployment in Greece.......................................................................................................71.3 Hydropower................................................................................................................................71.4 Wind Power.................................................................................................................................81.5 Solar Thermal ..............................................................................................................................81.6 Photovoltaics ...............................................................................................................................81.7 Biomass ........................................................................................................................................81.8 Geothermal Energy ....................................................................................................................91.9 Costs for RE Deployment........................................................................................................12
CHAPTER 2: OVERVIEW OF POLICY OPTIONS & MARKET DRIVERS
2.1 Introduction...............................................................................................................................152.2 Overview of RE Policy.............................................................................................................162.3 The Legislative and Administrative Framework ................................................................17
2.3.1 Laws ..............................................................................................................................172.3.2 Ministerial Decrees......................................................................................................18
CHAPTER 3: FINANCIAL INSTRUMENTS
3.1 Introduction...............................................................................................................................213.2 National Development Law....................................................................................................213.3 National Operational Programme for Competitiveness (CSF III) ....................................223.4 Tax and Other Fiscal Incentives .............................................................................................233.5 Other Public RES - Financing Sources ..................................................................................253.6 The Buy-back Pricing System for RES-Electricity ...............................................................27
3.6.1 Autonomous (non-interconnected) Islands.............................................................283.6.2 Interconnected System (mainland)...........................................................................28
CHAPTER 4: THE ROLE OF FINANCIAL INSTITUTIONS
4.1 Introduction...............................................................................................................................294.2 Motivating the Financial Sector..............................................................................................304.3 Financial Sector & RE Projects................................................................................................304.4 Obstacles ....................................................................................................................................32
CHAPTER 5: EU FINANCING SOURCES FOR RE PROJECTS
5.1 Introduction...............................................................................................................................355.2 Campaign for Take-Off (CTO) ...............................................................................................365.3 Green Paper Towards a European strategy for the security of energy supply..............385.4 Directive on the promotion of electricity produced from renewable energy sources...385.5 State aid regulations.................................................................................................................405.6 EC Directive Proposals ............................................................................................................40

5.7 EU Supported Programmes....................................................................................................425.7.1 Intelligent Energy for Europe....................................................................................425.7.2 The Sixth Framework Programme ...........................................................................435.7.3 The LIFE Programme..................................................................................................45
5.8 Community indirect support for the consumption of energy produced from renewable sources (tax measures)................................................................................46
5.9 Indirect support to sources used to generate renewable energy (agricultural subsidies, etc.) ....................................................................................................46
5.10 European Multilateral Financial Institutions .......................................................................475.10.1 European Investment Bank (EIB) .............................................................................475.10.2 European Regional Development Fund (ERDF) ....................................................485.10.3 European Investment Fund (EIF) .............................................................................495.10.4 Black Sea Trade & Development Bank ....................................................................50
5.11 Funding Mechanisms in the European Union.....................................................................515.11.1 Business Angels ...........................................................................................................525.11.2 CREA (“Capital-Risque pour les Entreprises en Phase d’Amorcage”) ..............525.11.3 Eurotech Capital ..........................................................................................................525.11.4 Joint European Venture..............................................................................................535.11.5 The Technology Performance Financing .................................................................535.11.6 I-TEC .............................................................................................................................53
5.12 Risk Capital in Greece..............................................................................................................54
CHAPTER 6: NEW FINANCIAL MODELS FOR RE INVESTMENTS
6.1 Introduction...............................................................................................................................556.2 The ESCO Concept - Third Party Financing ........................................................................566.3 Energy Performance Contracting...........................................................................................57
6.3.1 Guaranteed Savings ....................................................................................................586.3.2 The Guaranteed Solar Results (GSR) Concept........................................................596.3.3 Shared Savings.............................................................................................................60
6.4 Financing the RE Sector: Financial Market...........................................................................616.4.1 Bank Sector...................................................................................................................616.4.2 The Investment Sector ................................................................................................63
6.5 Energy Taxation........................................................................................................................646.6 Tradable Green Certificates ....................................................................................................646.7 The Clean Development Mechanism (CDM) Approach....................................................65
CHAPTER 7: CASE STUDIES
7.1 Introduction...............................................................................................................................677.2 Case Study I - Guaranteed Solar Results (GSR) ..................................................................68
7.2.1 ACHAIA CLAUSS Winery, Patras, Greece.............................................................687.2.2 Case study - Sarantis cosmetics, Oinofita, Greece .................................................69
7.3 Case Study II - Bankable Wind Energy Investment............................................................71
CHAPTER 8: CONCLUSIONS AND RECOMMENDATIONS..................................................73
REFERENCES............ ..........................................................................................................................77
4

STATUS OF RES & RET DEPLOYMENTIN GREECE
1.1 IntroductionDuring the last decade a continuously increasing interest in renewable energy technologies,was noted in Greece. This was a combined effect of: a) the favorable legal and financialmeasures that were implemented, b) the rich potential of Renewable Energy Sources (RES)that exists in the country and c) the rising environmental awareness.
Greece has a significant potential of wind, biomass, solar and geothermal energy. With 300sunny and warm days a year, over 1,000 islands with sea wind, an average wind speedexceeding 7.5 m/s and an important number of geothermal fields, Greece is an ideal countryfor wind, solar and geothermal energy production. As the countrie’s energy demand is pro-jected to grow by 3 to 5 percent over the next several years, the biomass potential can cover ahigh percentage of its total energy consumption, since the annual available agricultural andforest residues are estimated to 10 Mt.
The development of Renewable Energy Sources has been among the major energy policy linesof Greece for the last 10 years. It is seen as an important contribution to the improvement ofthe Greek environmental indicators and, in particular, to the abatement of CO2 emissions.Legal and financial incentives are the tools of the government’s strategy to support renewableenergy technology (RET) investments.
The main financial instruments for the support of RES in recent years were the OperationalProgramme for Energy in the 2nd Community Support Framework (CSF II) for Greece andthe National Development Law 2601/98, while Laws 2244/94 and 2773/99 provided the legalframework for RES deployment.
The legal framework currently governing RES electricity is Law 2773/99, which also sets therules for the liberalisation of the electricity market in the country. Starting in February 2001,any private investor can produce electricity, subject to the issuing of a generation lisence bythe Regulatory Authority for Energy (RAE). A specific mention to RES-electricity productionis included in Law 2773/99, which states that the Transmission System Operator (TSO) isobliged to grant priority access (priority in load dispatching) to RES electricity-producinginstallations.
CHAPTER 1
5
Following the successful implementation of the Operational Programme for Energy (1994-1999), the Operational Programme for Competitiveness (OPC) in the 3rd CSF was initiated in2000 by the Ministry of Development. The OPC offers financial incentives for RES invest-ments, and is expected to have a significant impact on the development of RETs within thenext years. The total budget of the programme for RES, cogeneration, energy efficiency andfuel subsitution by natural gas is 1,100 MEuro for a seven years period (2000-2006).
One of the main obstacles in the penetration of RETs in the electricity generation, is the lim-ited capacity of the transmission network to absorb and transmit the RES electricity produced.Therefore, the OPC, in parallel to direct subsidies to electricity generation plants using RES,will also provide an indirect support to such projects, through 50% financing of the upgrad-ing of the electricity transmission network, mainly in areas of high wind potential, as well as50% financing of the interconnection of RES facilities to the grid. Two actions will be takentowards this direction:• The electric interconnections of the islands with the mainland and with each other will
be upgraded, strengthened or newly constructed in the case of some non-interconnectedislands.
• The electricity transmission grid in some parts of the mainland that have high windpotential and attract high interest from private investors will be reinforced and/orextended.
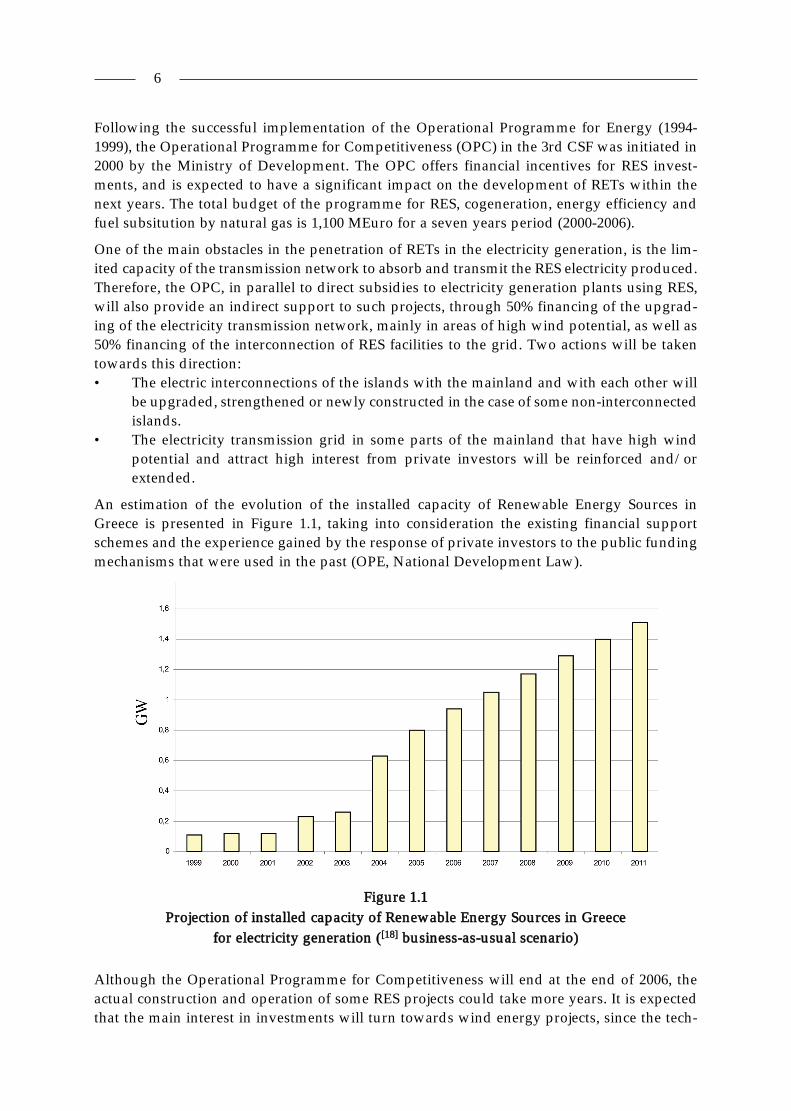
An estimation of the evolution of the installed capacity of Renewable Energy Sources inGreece is presented in Figure 1.1, taking into consideration the existing financial supportschemes and the experience gained by the response of private investors to the public fundingmechanisms that were used in the past (OPE, National Development Law).
Figure 1.1Projection of installed capacity of Renewable Energy Sources in Greece
for electricity generation ([18] business-as-usual scenario)
Although the Operational Programme for Competitiveness will end at the end of 2006, theactual construction and operation of some RES projects could take more years. It is expectedthat the main interest in investments will turn towards wind energy projects, since the tech-
6
nology of wind energy converters is well established and the corresponding costs are nowcomparable to those of conventional power stations. Small hydro plants are expected to havea relatively smaller share, mainly due to the scarcity of suitable sites. An indication for thishas already been given in the course of the Operational Programme for Energy, where theconstruction rate of funded small hydro projects was rather slow, compared to that of windenergy projects.
Energy sector restructuring is gaining strength and increased competition will drive costsdown. Deregulation will provide opportunities for promoting renewable energy, becausethere will be new industrial participation that will be aggressive and innovative and becausederegulation will lead to greater customer choice.
Financing the installation of renewable energy technologies remains a major concern, and inthis prospect the present analysis is aiming to identify key-financial instruments that wouldhelp overcome barriers associated with “access to capital” for RE investments. However, itshould be noted that new innovative financing mechanisms, in a gradually restructuring ener-gy market such as the Greek one, should be supplemented by adequate policy measures, inorder to ensure that these tools will be further deployed in a “mutual-interest” basis.
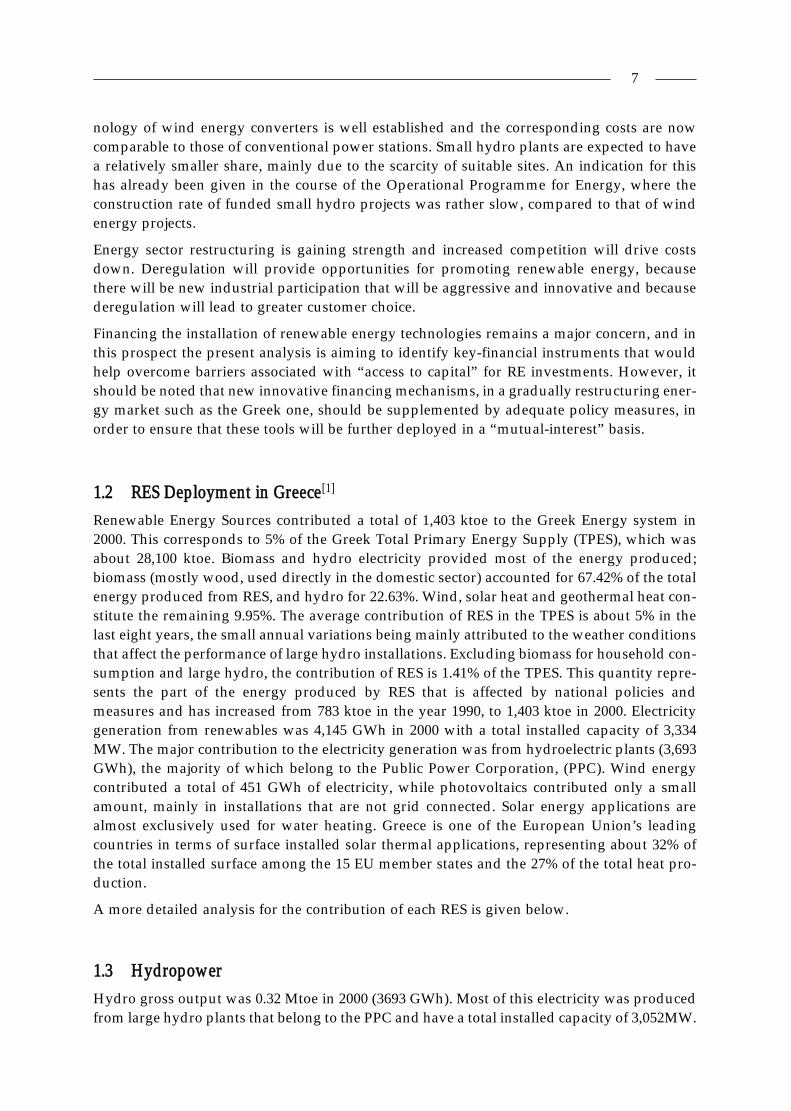
1.2 RES Deployment in Greece[1]
Renewable Energy Sources contributed a total of 1,403 ktoe to the Greek Energy system in2000. This corresponds to 5% of the Greek Total Primary Energy Supply (TPES), which wasabout 28,100 ktoe. Biomass and hydro electricity provided most of the energy produced;biomass (mostly wood, used directly in the domestic sector) accounted for 67.42% of the totalenergy produced from RES, and hydro for 22.63%. Wind, solar heat and geothermal heat con-stitute the remaining 9.95%. The average contribution of RES in the TPES is about 5% in thelast eight years, the small annual variations being mainly attributed to the weather conditionsthat affect the performance of large hydro installations. Excluding biomass for household con-sumption and large hydro, the contribution of RES is 1.41% of the TPES. This quantity repre-sents the part of the energy produced by RES that is affected by national policies andmeasures and has increased from 783 ktoe in the year 1990, to 1,403 ktoe in 2000. Electricitygeneration from renewables was 4,145 GWh in 2000 with a total installed capacity of 3,334MW. The major contribution to the electricity generation was from hydroelectric plants (3,693GWh), the majority of which belong to the Public Power Corporation, (PPC). Wind energycontributed a total of 451 GWh of electricity, while photovoltaics contributed only a smallamount, mainly in installations that are not grid connected. Solar energy applications arealmost exclusively used for water heating. Greece is one of the European Union’s leadingcountries in terms of surface installed solar thermal applications, representing about 32% ofthe total installed surface among the 15 EU member states and the 27% of the total heat pro-duction.
A more detailed analysis for the contribution of each RES is given below.
1.3 HydropowerHydro gross output was 0.32 Mtoe in 2000 (3693 GWh). Most of this electricity was producedfrom large hydro plants that belong to the PPC and have a total installed capacity of 3,052MW.
7

Electricity production from hydro plants is varying from year to year, mainly due to oper-ational characteristics (lower total rainfall, less hours of operation for some plants, use ofwater for irrigation purposes). Small hydro plants (<10MW), belong both to the PPC andprivate investors and their overall installed capacity in 2000 was 55.6 MW. This is estimatedto rise to about 100 MW by the end of 2001, after the completion of a number of projects thatare under construction at the moment.
1.4 Wind PowerThe wind energy installed capacity was 110MW in 1999, and increased to 226MW in 2000. Thesignificant increase was mainly due to the installation of wind parks by private investors.Based on the favourable wind regime, coupled with the high cost of providing electricity inisolated areas, the best sites for the installation of wind turbines are located in Evia, Laconia,Thrace, the Aegean Islands and Crete.
1.5 Solar ThermalSolar energy applications are almost exclusively used for water heating. With about two mil-lion square meters (2,000,000 m2) in 2000, representing about 32% of the total surface installedin the EU and 27% of the corresponding solar heat production, Greece is one of the EuropeanUnion’s leading countries in surface covered by solar thermal installations.
1.6 PhotovoltaicsPhotovoltaic applications (PV) are much fewer due to their high capital cost. The totalinstalled capacity of photovoltaic systems in Greece (comprising relatively large autonomousPV units) in 2000 was 332 kWp.
1.7 BiomassBiogas from municipal waste landfills is an important source the utilisation of which has onlyrecently began in Greece. Small cogeneration installations are in operation in Thessaloniki,Heraklio and Chania (Crete). A relatively large plant (13MWe) has recently been commis-sioned, utilising the biogas produced in a large landfill near Athens. There are also immedi-ate plans for six additional plants of this type, by operators of municipal waste treatmentplants or landfills. During 2000, a cogeneration plant, using the biogas produced from thesewage treatment plant of the Greater Athens area, has also begun operation (7.4MWe ofinstalled capacity).
Domestic use of wood (0.702 Mtoe), mainly for cooking and space heating, accounted forabout 74% of the estimated energy (0.946 Mtoe) produced from biomass in 2000.
Wood residues are mainly used by the wood industry, in the framework of waste reuse, withan estimated energy production of 33.5 ktoe. Estimates of the heat produced for on-site use,from the combustion of solid waste in industry, are usually based on qualitative estimates ofthe site manager (usually, an estimate is given for the percentage of the total amount of rawmaterial used that ends up in the burner).
8

Heat production (exclusively) for on-site use in industry from the combustion of wood/woodwaste/other solid waste, was about 208 Ktoe in Greece in 2000.
There is currently no production of biofuels in Greece, but use of bioethanol in the transportsector is being considered for the future.
A CHP plant using cotton ginning residues with a capacity of 2.1 MWth and 0.5 MWe, existsat Davlia, but its current use is only for heat production.
1.8 Geothermal EnergyThe estimated geothermal resources of the high enthalpy fields in the Aegean islands of Milosand Nissiros are estimated to be able to support over 170MWe of installed power capacity fora time period exceeding 20 years. To date, only one unit was installed on the island of Miloswith a capacity of 2MWe. The unit, which was installed in 1985, has been shut down since1988, following opposition against its operation from the inhabitants and local organisationsand poor project management. In recent years, an investigation of the high enthalpy field onthe island of Lesvos is in progress by PPC, and the prospects appear promising.
Currently, geothermal applications in Greece are restricted to greenhouse heating, with theexception of a geothermal heat pump system used for heating and cooling of a 4,500m2 build-ing. In any case, only about 29 MWth, i.e., a very small part of the total, economically viable,low-enthalpy potential of Greece (estimated at 450 MWth) has been exploited to date.
In 2000, fifteen greenhouses, one heat pump system for a building, one plankter dam, onedesalination unit and two pisciculture plants were operating geothermally under a validlicense (permit), totaling a covered area of approximately 246,500 m2, with a total installedcapacity of 29 MWth. There is a number of geothermal greenhouses which still operatewithout a permit; an unofficial estimate of their covered area is around 39,000 m2, with a totalinstalled capacity of 5 MWth. Because of the low temperatures experienced in regions of north-ern Greece, most of the geothermal applications for greenhouse heating are situated in thatregion.
The following tables and figures give an detailed description of the energy produced fromRES (Tables 1.1 & 1.2; Figure 1.2), the current status of RE Technologies (Table 1.3) and thenational energy balance sheet for RES in 2000 (Table 1.4).
Figure 1.2Relative contribution of each RES to the Total Energy Production (2000)
9

Table 1.1Energy produced from RES in 2000
* production through pumping, 35.97 ktoe is excluded** Grid connected and autonomous island systems (non-connected systems for electricity supply)*** Sites with official permits
Table 1.2Evolution of electricity produced from RES (GWh) in the period 1989-2000
10

Table 1.3Current status of renewable technologies in Greece for the year 2000
* C = commercial, D =demonstration** Grid connected and non-connected systems in islands (does not include small scale isolated panels)
11
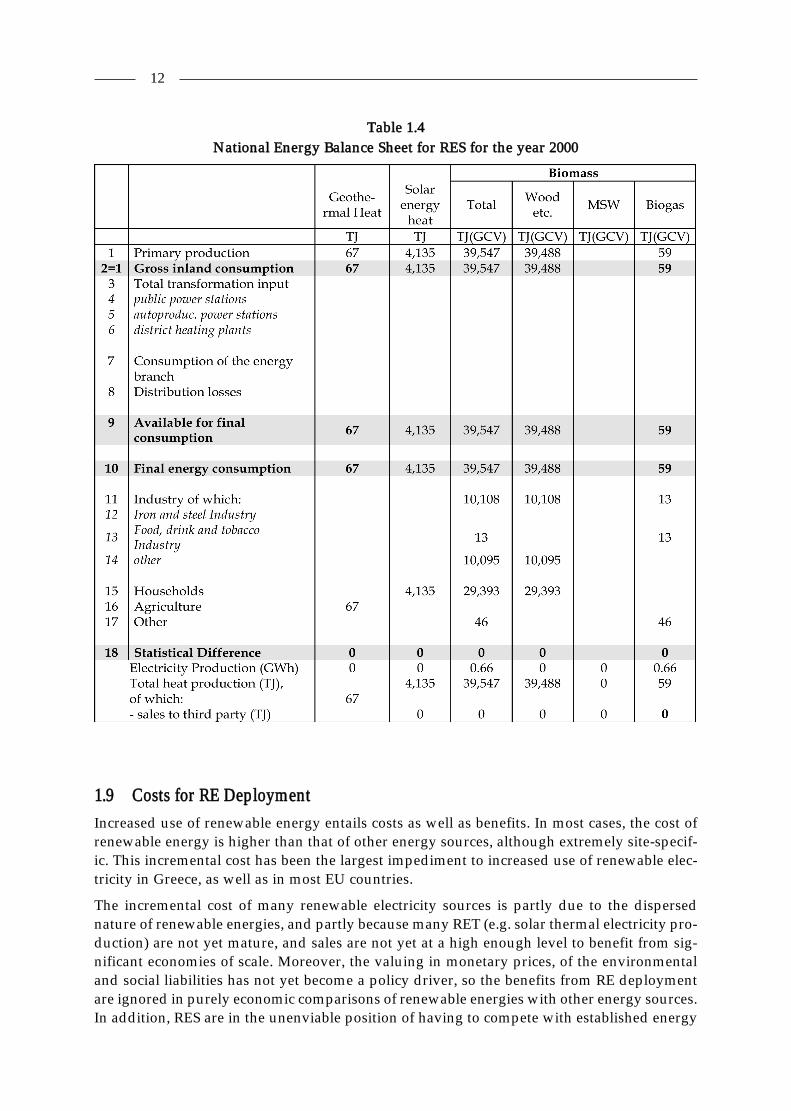
Table 1.4National Energy Balance Sheet for RES for the year 2000
1.9 Costs for RE DeploymentIncreased use of renewable energy entails costs as well as benefits. In most cases, the cost ofrenewable energy is higher than that of other energy sources, although extremely site-specif-ic. This incremental cost has been the largest impediment to increased use of renewable elec-tricity in Greece, as well as in most EU countries.
The incremental cost of many renewable electricity sources is partly due to the dispersednature of renewable energies, and partly because many RET (e.g. solar thermal electricity pro-duction) are not yet mature, and sales are not yet at a high enough level to benefit from sig-nificant economies of scale. Moreover, the valuing in monetary prices, of the environmentaland social liabilities has not yet become a policy driver, so the benefits from RE deploymentare ignored in purely economic comparisons of renewable energies with other energy sources.In addition, RES are in the unenviable position of having to compete with established energy
12

sources that can benefit or have previously benefited from advantages such as subsidies,available infrastructure and fully amortised capital investments.
Costs associated with increased use of intermittent renewable electricity relate directly to theelectricity system itself, for strengthening both the transmission and distribution system andfor providing backup capacity.
The cost of connecting renewable electricity systems to the electricity grid may also be high,especially for wind farm developments in Greek islands. The use of wind and solar electricityin Greek islands is relatively recent and still small-scale, while the majority of electricity gen-eration in these islands is diesel-based. Any change in pricing structure aimed at bringing theprice of island electricity, or off-grid electricity, more in line with its real cost, would help topromote renewable electricity (although such a price revision is difficult to be undertaken,because of public service provision requirements on the electricity utility).
In order to support the Greek government in RES policy analysis CRES developed a comput-erised methodology[19] for the assesment of the wind energy and small hydro economic poten-tial, in the context of the Operational Programme for Energy. The idea was to provide a linkbetween the physical potential of RES and all the economic indices (IRR, PBP, etc.) expressingthe economic viability of RES investments. The tools are giving the possibility to perform aparametric analysis of RES investments using as parameters the physical potential on onehand and the RES supporting measures on the other hand.
A parametric analysis of wind farm investments is presented in Figure 1.3. The Pay-BackPeriod as a function of the level of public subsidy is presented for a number of values of thewind utilisation factor. For the given example, constant buy-back rate of electricity is assumedand the level of own capital is taken to be 20%. It has to be noted that the Pay-Back Period isa strong function of the subsidy for wind utilisation factors lower than 35%.
Figure 1.3Own Capital 20%, Constant RES electricity buy-back rate
13

OVERVIEW OF POLICY OPTIONS & MARKET DRIVERS
2.1 IntroductionSecurity of supply and the development of its diverse indigenous energy resources have beenthe central pillars of Greece’s strategic approach to energy. In light of the ongoing liberalisa-tion of the Greek electricity market and the unique opportunities blossoming across theBalkan Peninsula due to energy-sector privatisation, the successful implementation of thecountry’s Peripheral Development Plan for energy has become even more crucial for theGreek government.
The Greek Ministry of Development has set the following strategic objectives for energy:
– Securing sufficient energy supply across all Greek territory;– Competitive operation of the energy markets;– Strong contribution of the energy sector to the overall competitiveness of the Greek
economy;– Protection of the environment; and– Strengthening of Greece’s role in the development of the energy sector in the southern
Mediterranean Sea, the Balkans and the Black Sea regions.
Greece is expected to have a very busy energy policy agenda in the next few years, with thederegulation process of the internal market, acting as the prime driver. The size of the Greekenergy market is estimated to be approximately 5 billion Euro in the 2000-2006 period (i.e. theperiod of CSF III). Important initiatives have already been implemented for the move towardsenergy market reform and the greater role of private capital:
➱ Issuing of a number of Laws and Decrees, which deal with such key issues as the par-tial privatisation of the State Electricity Company, PPC, the establishment of an inde-pendent Transmission System Operator (HTSO) in December 2000 and the regulator,the Regulatory Authority for Energy (RAE) in July 2000. Market operators are nowrequired by law to unbundle their accounts. TSO will control a power pool of produc-ers, based on 24 hours ahead bids; PPC will own and develop all new transmission anddistribution facilities, which will remain under the control of the State.
CHAPTER 2
15
➱ From 19th February 2001 the government with Law N.2773/99, opened up officially30% of the electricity market and in theory all customers with 100GWh of annual con-sumption or more have been assigned as eligible customers. They constitute 34% of totalelectricity consumption in Greece and they amount to 7,500 individually meteredcustomers.
➱ The award of the franchise contracts for the regional natural gas supply companies (EPAs),in Athens to CINERGY/SHELL and in Thessaloniki and Thessalia to ITALGAS. The rightsfor the development and operation of the low pressure distribution network of the systemhave been transferred from DEPA to the respective Regional Distribution Companies(EDAs), in which the foreign investors (CINERGY/SHELL and ITALGAS) participate,holding 49% of the equity and undertaking the management and market policy of thesecompanies.
➱ The launch of the Operational Programme for Competitiveness, supporting privateinvestments in energy, industry, commerce, tourism, research and technology, etc.,under the 3rd Community Support Framework (CSF III; 2000-2006). The private energyinvestments mount to 1.07 billion Euro (16.8% of the Programme’s total budget), where-as the ratio of private funding to public (Community + national) funding will be abouttwo to one. The indicative total budget for investments in co-generation of heat andpower and in rational use of energy is about 320 M Euro, while in renewable energy isabout 750 M Euro.
➱ The forthcoming establishment of an Energy Options and Futures Contracts ExchangeMarket, aiming to become the dominant Energy Exchange Market in South-EasternEurope.
Many RE technologies have now reached a point of development where they have becomeeconomically viable, giving practical solutions to the twin problem of energy supply andenvironmental pollution. Cogeneration systems (biomass and/or natural gas), small hydro-power, wind and solar energy are expected to win substantial market shares in the immedi-ate future. As a result of the change and the gradual transformation towards a deregulatedenergy market in Greece (the electricity market has been liberalised at a starting share of 34%from February 2001), the costs for energy consumption will be changing. The restructuringand anticipated development of the energy sector provides a potentially large market for REinvestments.
2.2 Overview of RE PolicyThe Greek energy sector is undergoing significant changes, under the combined effect of EUpolicies to introduce competition in the energy market (the Internal Energy Market pro-gramme), the national initiatives to liberalise and privatise the energy industry, and theenvironmental policies at both the EU and national levels. These forces may not all act in thesame direction. The introduction of competition may result in lower prices for energy, whilepolicies to ensure a high level of environmental protection may, on the contrary, aim atincreasing prices, limiting demand increases. The overall effect on energy supply/demandmay, therefore, not be very visible especially in the short to medium-term. Indeed, the struc-tural effects of those policies will take a while to make their way through the energy system.
The impetus behind renewable energy promotion, in addition to having a very significantRES potential in Greece, is the Government’s aim of supporting modest demand growth inelectricity and the high priority placed on reducing urban air pollution. Land constraints are
16

unlikely to limit the exploitation of renewable energy. Promotion of renewable energy inGreece is based on a number of measures at the national level, such as:
• Providing strong economic incentives, in the form of both capital subsidies andfavourable buy-back electricity rates.
• Setting national targets for future RE use.• Realising programmes promoting information, dissemination and support of R&D in
renewables.
All activities are taking place in the context of an overall Government policy of economicstructural reform and of reducing the role of the state in the economy. The Government accep-ts that these broad policy principles apply equally to the energy sector, which today is stillcharacterised by heavy state involvement. Policies used to promote renewable energy devel-opment are described also in the revised Greek National Programme for Climate Change[17],which estimates realistic CO2 savings of 4.5 Mt CO2-eq from the increased use of renewables.
The main financial instrument to support RE investments has been in the past (1994-99) theOperational Programme for Energy, under the 2nd Community Support Framework.Through its two calls for proposals, released between 1996-1999, there were 78 renewablesprojects funded, corresponding to 161 MWe and 102 MWth, with a total budget of 213MEURO. The following Table 2.1 shows the breakdown by RE technology of these projects.
Table 2.1Operational Programme for Energy, CSF II (1994-1999)
RE Investment Projects Funded
2.3 The Legislative and Administrative Framework [2]
2.3.1 Laws
The basic law governing RES electricity is Law 2773 of 1999, on the liberalisation of thedomestic electricity market, and, specifically, its Chapter 10, Articles 35-41. This law has incor-porated the majority of provisions of the earlier Law 2244 of 1994, which, unlike Law 2773,was devoted entirely to RES electricity matters. At present, there is no Greek law dealingspecifically with heat production from RES.
The key provisions of Law 2773/99 concerning renewables are as follows:
17

i. The Hellenic Transmission System Operator (HTSO) is obligated to grant priority access(priority in load dispatching) to RES electricity-producing installations up to 50 MWe inpower capacity (up to 10 MWe in the case of small hydroelectric units).
ii. The HTSO is obligated to enter into a 10-year contract (PPA) with the RES-electricity pro-ducer for the purchase of his electricity. The contract always includes a renewal option.
iii. The RES-electricity production of an independent power producer, or the surplus elec-tricity production of a RES autoproducer, is sold to the HTSO at a predetermined buy-back rate, which is fixed percentage of the corresponding consumer electricity rate.
iv. Every RES-electricity producer is subject to a special reciprocity charge (annual fee),specified by a joint decision of the Ministers of Finance and Development, and equal totwo-percent (2%) of the producer’s electricity sales to the grid. This charge is collectedby the HTSO and is given to the Local Authority, within the area of which the RES gen-eration unit operate, for the purpose of realising local development projects.
Law 2773/99 instituted a new license, the so-called electricity generation license, which is nowthe first license required to be obtained by any electricity-producing station, conventional orRES-based, in a long planning/licensing procedure that also includes presiting permit, land-use permit, approval of environmental terms and conditions, installation license, operationlicense, etc. (see below).
Law 2941 of 2001 supplemented Law 2773/99 with certain important provisions aboutrenewables, including: a) the definition of the general terms and conditions, under which it isallowed to install RES stations in forests and forestry lands, and b) the characterisation of allRES projects as projects of public utility status, which gives them the same rights and privi-leges in land expropriation procedures as those given to public works, independently of thelegal status of the RES project owner (being private or public).
2.3.2 Ministerial Decrees
Laws 2244/94, 2773/99 and 2941/01 on renewables are supplemented by a number ofMinisterial Decrees, which specify:
a) The procedures, required documents, fees, etc. for issuing the generation, installationand operation licenses, necessary to all RES-to-power projects.
b) The general technical and financial terms of the contract to be concluded between theTransmission System Operator (HTSO) and each RES power producer, the details of theelectricity tariffication system to be applied, the terms and conditions for connecting theRES station to the grid, etc.
c) While the new Law 3010/2002 and the JMD 15393/2332/2002, MD 25535/3281/2002and JMD 11014/703/�104/2003 delineate the revised procedure for the environmentalplanning and authorisation process and the approval of environmental terms and con-ditions.
The most important of the above Ministerial Decrees (MD) are summarised below:
1. MMD 17951/2000: Terms and procedures for obtaining the electricity generation license.2. JMD 15393/2332/2002 and JMD 11014/703/�104/2002 (in conjuction with the enact-
ment of the new Environmental Law 3010/2002): Terms and procedures for obtainingthe necessary environmental licenses (preliminary environmental impact assessmentand evaluation, approval of environmental terms and conditions).
3. MD 2000/2002: Terms and procedures for obtaining the RES installation and operationlicenses, as well as a model contract (PPA) between the HTSO and the RES power pro-
18

ducer. The multi-step RES licensing procedure and the corresponding jurisdictions aredepicted schematically in Figure 2.1.
4. MD 31928/1993 ( in conjunction with Law 1475/1984): Terms, procedures and fees forobtaining the necessary concession license, for the right to exploit a geothermal field.
5. MD 5813/1989 (in conjunction with Law 1739/1987): Terms and procedures for obtain-ing the necessary “unified water license”, which is a license for water use and for car-rying out any project of exploitation of water resources (including energy valorisation).
In 1995, the Greek Ministry of Environment, Urban Planning and Public Works prepared anAction Plan, entitled “Energy 2001”, aiming at promoting the use of RES, as well as the appli-cation of energy-efficiency technologies, in the building sector. The Action Plan was preparedin order to define specific measures for the reduction of greenhouse gas emissions in build-ings, in accordance with the “National Action Plan for the Abatement of CO2 and OtherGreenhouse Gases”. Following official adoption of the Action Plan by the Greek Government,“Energy 2001” was further reinforced by the enactment of MD 21475/98, which incorporatedthe provisions of Council Directive 93/76/EC (SAVE Directive) for the stabilisation of CO2
emissions and the efficient use of energy in buildings.
Concerning the incorporation of RES systems in buildings, the MD 21475/98 specificallyrefers to, in Art. 2:
• active solar systems, such as hot-water solar heaters and photovoltaic modules• other (non-specified) RES systems which convert renewables to electricity or thermal
energy.
In addition, Art. 4 of the Ministerial Decree provides for the future issuing of a Regulation forthe rational and efficient use of energy, which will be in compliance with the Greek GeneralBuilding Code. The drafting of the Regulation has been assigned by the Ministry ofEnvironment, Urban Planning and Public Works to the Centre for Renewable Energy Sources(CRES), and it is to be carried out in accordance with the provisions and specifications set outby MD 21475/98. As far as the incorporation of RES in buildings is concerned, the Ministry’sspecifications for the drafting of the Regulation encompass the following:
• determination of the building’s energy requirements and their potential degree of cov-erage through RES
• specifications of active solar systems (ASS)• determination of the ASS contribution to space and water heating (compulsory)• determination of the contribution of photovoltaic systems (PVs) to the coverage of the
building’s electrical loads (optional)• study for the incorporation of ASS (compulsory) and PVs (optional) in buildings• determination of the requirements for the installation of building energy systems for the
exploitation of RES.
Finally, it is also important to mention here the legally binding EU Directive 2001/77/EC onRES electricity and its indicative target for Greece, i.e. 20.1% coverage of the country’s total elec-tricity demand by renewables, until 2010. This target corresponds to about 2500 MWe of RESinstallations, an eightfold increase over the currently installed RES capacity of about 320 MWe.
19
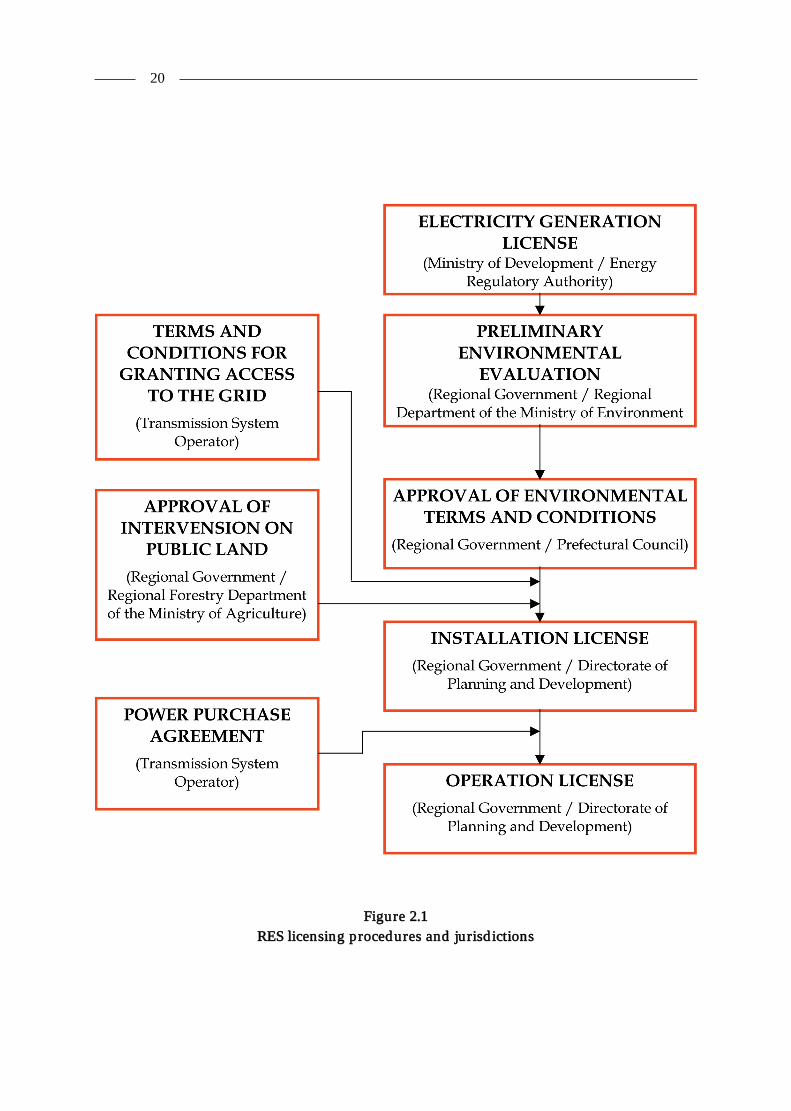
Figure 2.1RES licensing procedures and jurisdictions
20

FINANCIAL INSTRUMENTS [2]
3
3.1 IntroductionFinancial – support instruments for RE projects can be divided into a) governmental incen-tives and b) other financial resources. Governmental incentives are often investment subsi-dies, feed-in tariffs, payback regulations and tax regulations, such as:
• Flexible depreciation of RE investments.• Favourable tax treatment for third party financing.• Start-up subsidies for new production plants, for SMEs and for the creation of new jobs.• Fiscal measures for consumers to purchase RE equipment and systems.• Market incentives in order to help increase the market share of RES.
The costs of encouraging RE investments and further deployment of RE technologies includethe direct costs of incentives, such as capital costs, output subsidies, tax rebates and costs ofpromotion/dissemination/training/education campaigns. They also include indirect costs,such as those of implementing legislation, standards or other regulations that promote the useof renewables.
There are two main financial-support instruments that provide substantial public subsidies toRES investment projects (among others): a) The so-called “National Development Law” (Law2601 of 1998, currently under revision), and b) the Greek Operational Programme forCompetitiveness, one of the eleven (11) National and the thirteen (13) Regional OperationalProgrammes, in which the Third Community Support Framework (CSF III ; 2000-2006) forGreece is divided.
These two instruments are detailed below.
3.2 National Development LawThis is a financial instrument-umbrella, covering all private investments in Greece, in all sec-tors of economic activity. It has a strong regional character, in that the level of public supportdepends strongly on the particular geographic region, in which the given private investment
CHAPTER 3
21
is planned to materialise. Regions with high unemployment rates and low incomes per capitareceive the highest investment subsidies from the State.
Investments in RES installations (both electricity- and heat- producing ones) have a specialstatus under Law 2601/98, similar to the one bestowed to other selected categories of invest-ments, such as investments in high technology, environmental protection, etc. More specifi-cally, the main provisions of Law 2601/98 concerning public support of RES investments areas follows:
• 40% public subsidy (grant) on the total eligible RES investment cost + 40% subsidy onthe interest of loans obtained for the purpose of financing the RES investment
• Alternatively, 40% subsidy on the loan interest + 100% tax deduction on the RES invest-ment cost
• Level of subsidy (40%) is independent of the RES technology and the geographicalregion of the country
• Required own capital: 40% (min) of the total investment cost• Minimum investment cost required: 176,000 Euro• Maximum subsidy granted: 14.7 million Euro• Maximum investment cost subsidised: 36.7 million Euro
Proposals for private investments can be submitted to the National Development Law2601/98 at any time and they are evaluated on their own merit, i.e. independently of othersubmitted proposals. Law 2601/98 does not have any total budget cup, thus there is (theoret-ically) no limit in the number and budget of proposals that can be funded.
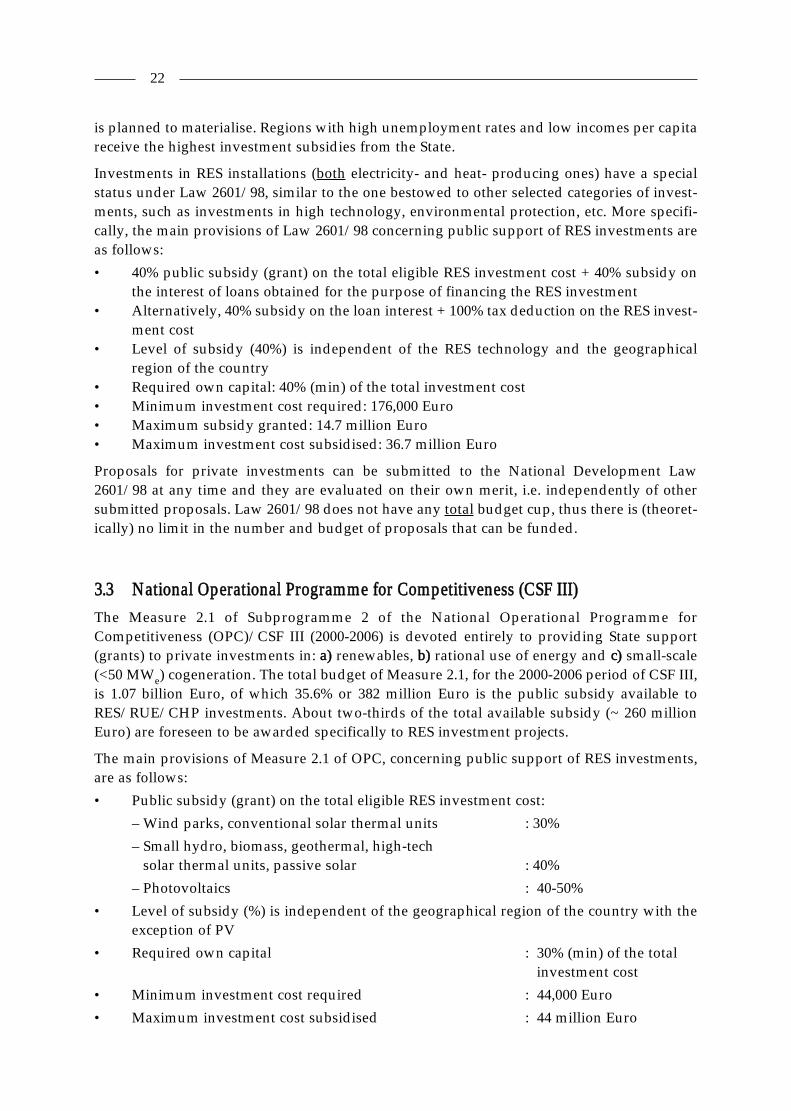
3.3 National Operational Programme for Competitiveness (CSF III)The Measure 2.1 of Subprogramme 2 of the National Operational Programme forCompetitiveness (OPC)/CSF III (2000-2006) is devoted entirely to providing State support(grants) to private investments in: a) renewables, b) rational use of energy and c) small-scale(<50 MWe) cogeneration. The total budget of Measure 2.1, for the 2000-2006 period of CSF III,is 1.07 billion Euro, of which 35.6% or 382 million Euro is the public subsidy available toRES/RUE/CHP investments. About two-thirds of the total available subsidy (~ 260 millionEuro) are foreseen to be awarded specifically to RES investment projects.
The main provisions of Measure 2.1 of OPC, concerning public support of RES investments,are as follows:
• Public subsidy (grant) on the total eligible RES investment cost:
– Wind parks, conventional solar thermal units : 30%
– Small hydro, biomass, geothermal, high-tech solar thermal units, passive solar : 40%
– Photovoltaics : 40-50%
• Level of subsidy (%) is independent of the geographical region of the country with theexception of PV
• Required own capital : 30% (min) of the totalinvestment cost
• Minimum investment cost required : 44,000 Euro
• Maximum investment cost subsidised : 44 million Euro
22

Grants are awarded to RES projects by Measure 2.1 of NOPC following rounds of public callsfor RES investment proposals and subsequent competitive evaluation of the submitted pro-posals (per round).
As already mentioned in Chapter 2.2, a RES investment-subsidy programme, very similar tothat of Measure 2.1 of OPC/CSF III, existed also in the Second Community SupportFramework (CSF II ; 1994-1999) for Greece. This CSF II programme granted cumulativelyabout 92 million Euro of public subsidies to 78 RES investment projects, having a total bud-get of about 213 million Euro (i.e. mean subsidy rate ~ 43%) and a total installed capacity of161 MWe + 102 MWth. This programme was very instrumental in stirring up substantial RESactivity and in materialising a large number of commercial-scale RES projects in Greece, par-ticularly in the period 1997-2000.
3.4 Tax and Other Fiscal IncentivesThe one legislative provision, that was in effect till recently in the area of tax incentives for(domestic) RES installations, was incorporated in Law 2364 of 1995. This law, although deal-ing primarily with the importation, transmission, distribution and sales of natural gas inGreece, contains an important provision regarding the purchase and installation of domesticRES appliances. According to Article 7 of the law, up to 75% of the total cost for the purchaseand installation of domestic RES appliances and systems (as well as of gas appliances) can bededucted from the taxable income of natural persons. Such appliances and systems aredeemed to include installations for the common use of the occupants of apartment buildings,in which case the deduction is calculated on the basis of the co-ownership percentage of eachowner. It is estimated that the tax deduction of Law 2364/95 can, today, reduce the cost ofdomestic RES systems (e.g. of solar heaters) by up to 30%.
For legal persons and companies taxed on the basis of coefficient of profits, or on the basis ofobjective criteria, 75% of the total expenditure for the purchase and installation of the afore-mentioned appliances or systems is deductible from the total profit established by the appli-cation of the tax coefficient or the objective criteria. Legal persons and companies in the com-mercial or service sectors, which keep simple revenue and expenditure books, are entitled toamortise such costs at an annual rate. This provision however in the recent revision and sim-plification of the tax system by the Ministry of Finance has been abolished for the finanancialyear 2003 onwards.
Following the enactment of the Ministerial Decree 21475/98 (see Ch. 2.3.2), a separatePresidential Decree had been planned, entitled “Incentives for energy savings”. According tothe latest draft of this Decree, an integrated set of financial, administrative and other incen-tives is to be instituted for domestic applications of techniques and systems, including RES,that demonstrably contribute to energy savings in buildings. These planned incentives areoutlined below:
i. All expenses related to the purchase and installation of RES systems and materials inexisting buildings can be deducted from the taxable income of owners / possessors /usufructuaries, up to a certain percent which will be defined, according to a specific setof criteria, in a later Ministerial Decree.
ii. Owners of existing or new buildings (domestic / commercial / tertiary) who, within aperiod of six (6) years from the date of enactment of the above Presidential Decree, willinstall RES exploitation systems in their buildings, for space heating and/or cooling, hot
23
water production or lighting, demonstrably meeting at least 30% of their energy needswith RES, will be entitled to receiving certain subsidies or attractive, low-interest loansfrom State or private banks, in order to cover their RES-related costs. The maximumamount of the loan, the interest rate, the time and terms of loan repayment and all otherrelevant details will be set out in a separate Ministerial Decree.
iii. In case the building owner opts for the low-interest loan, he will not be eligible for theincome tax deduction of point (i) above.
iv. In regions with autonomous electricity networks (for example, in islands), or in regionsof the interconnected system where the Public Power Corporation (PPC) of Greece isunable to cover the peak load, PPC can provide relevant subsidies or financial incen-tives, through mass purchases of domestic RES systems (solar heaters, photovoltaics,etc.) for interested customers. The RES systems will be selected by PPC to suit the spe-cific load characteristics of the given residential area and will be offered to its customersat attractive low prices (due to mass-purchase discounts). The system cost will be repaidto PPC by customers joining the programme through their electricity bills, in a numberof equal instalments.
It is interesting to note that the issuing of the above Presidential Decree has stalled for almostthree years now, mainly because it is considered that the State’s financial burden, from theapplication of the above measures, will be excessive.
As far as tax incentives for corporation investments in renewables are concerned, we note thatsuch incentives are actually provided as alternative choices to capital subsidies in the NationalDevelopment Law 2601/98 (see Ch. 3.2). According to the law, investments and equipment -leasing programmes by corporations in: a) electricity production from renewables (wind,solar, hydroelectric and geothermal energy), and b) cogeneration of heat and electricity (e.g.from biomass), can receive one (but not both) of the following subsidy packages:
i) • Capital subsidy : 40% of the total investment cost
• Interest-rate subsidy : 40% of the interest paid on loans related to theRES investment
• Leasing subsidy : 40%
ii) • Tax deduction : 100% of the total investment cost
• Interest-rate subsidy : 40% of the interest paid on loans related to theRES investment
The first subsidy package has been discussed in Ch. 3.2. The second subsidy package, forwhich a corporation may opt instead of the first one, contains two components of State finan-cial support to RES investments: a 40% interest-rate subsidy and a tax deduction equalling100% of the total investment cost (or equipment - leasing cost). This last form of financial sup-port regards the exemption of the corporation from payment of income tax on the non-dis-tributed net profits of the first decade following the materialisation of the RES investment, bycreating an untaxed (tax-exempt) reserve, equal in amount to the total RES investment cost.The 100% tax deduction is normally made from the profits of the particular tax year in whichthe RES investment is made. If there are insufficient or no profits in that year to cover the taxdeduction, this deduction is made from the profits of subsequent tax years (and up to thetenth year), until the total RES investment cost is fully covered.
24

3.5 Other Public RES - Financing SourcesProjects in RES research, development, demonstration and exploitation can, in principle,receive financial support from a number of specialised national programmes, not specificallytargeted towards renewables, but, nonetheless, covering this thematic area, as well. Theseprogrammes are administered primarily by the Ministry of Development/General Secretariatfor Research and Technology, the Ministry of Agriculture and the Ministry of Environment,Physical Planning and Public Works.
The Ministry of Development/General Secretariat for Research and Technology included sev-eral R&D-related national programmes, co-financed by the Greek 2nd CSF, including:
i) PAVE, which is a programme supporting the development of industrial research andinnovation in Greece.
ii) PEPER, which is a programme supporting pilot (demonstration) projects, in two stages:a) feasibility study; b) realisation of the pilot project.
iii) SYN, which is a programme of R&D co-financing.
iv) PENED, which is a programme supporting the development of the Greek researchpotential (academic institutions and laboratories).
The above Research and Technology (R&T) programmes of the Operational Programme forResearch & Technology (OPRET II) are now incorporated in the OPC and seven R&TMeasures are administered by GSRT of the Ministry of Development in several priority axes.
Measure 4.3 ‘Encouragement of research and the transfer and spread of technology in compa-nies’ gives support for activities of international scientific and technological cooperation andtechnology transfer and aims to intensify research and related activities (technology transfer,dissemination, information etc.) within businesses and also to promote collaborations in scien-tific and technological activities with a large number of countries, for the purpose of transfer-ring technical knowledge and technology to and from Greece. The following three out of thesix Actions are included in the Measure, which are the continuation of precedents.
Action 4.3.1 Programme for the Development of Industrial Research and Technology(PAVET) from companies with an already developed productive and commercial activity.
The total budget of the programme amounts to 30.3 MEuro with 14.67 MEuro of public fund-ing and 15.55 MEuro as private contribution. The public expenditure is covered at 70% fromCommunity resources and 30% from national. A tender for the PAVET Programme was issuedin 2000 and about 150 proposals were approved for funding. Seven of the project proposalswith a budget of 1.43 MEuro deal with renewables and one of them is for wave energy.
Action 4.3.2 Programme for Development of Industrial Research and Technology for enter-prises that begin their productive and commercial activity (PAVET-NE).
The action is for new companies less than 5 years old, which have no capital connections withalready established and operating businesses and rely on the continuous renewal of theknowledge they use in their productive and commercial activities, demand special treatmentand support.
Action 4.3.3 Promotion of demonstration and innovation projects (PEPER).
The main objective of the projects is the application of new technologies successfully testedabroad or in other branches, with the aim of creating infrastructure for the further develop-ment and demonstration of innovative methodology, products or services, and documentingtheir technical and economic viability. The programme has already been implemented on a
25

pilot scale during the course of OPRET II, and satisfactory experience has been obtained fromthe participation of those involved with positive results.
The action is materialised in two phases, phase A for the feasibility studies of demonstrationprojects from interested companies with a maximum budget for proposals in this phase of58,000 Euro (with 50% private contribution), and phase B for the materialisation of selectedproposals from phase A with a maximum budget of 587,000 Euro (with 50% private contri-bution). Proposals can submit enterprises of all sectors of economy. In the first call of 2000 forphase A proposals, 82 feasibility studies were selected for funding in phase B with seven ofthem being for demonstration of innovative renewable technologies.
Several other Measures are also included in the Energy – Natural Resources Sector of theOPC-CSF III that can support directly or indirectly RES and contribute to the development ofrenewable investments.
Measure 1.3: Simplification of the business environment.
Coordination of public services for the solution of institutional, organisational and tariffi-cation issues, which will simplify administrative procedures, facilitate investment initiativesand more generally promote the development of RES projects, co-generation and energy sav-ings with a budget for RES of 1 MEuro.
Measure 3.1: Promotion of business excellence in the energy sector.
Interventions for the financing of demonstrative energy technology projects in the private andpublic sectors, and actions to support the determination of the reliability and efficiency ofenergy equipment by SMEs of a total budget of 7.7 MEuro.
Measure 4.4: Increasing public awareness of new technologies. Support and formulation ofR&T policy. Management of R&T information.
This measure also includes the financing of actions for dissemination and increasing publicawareness on the advantages and the environmental benefits from the application of RES andenergy saving. The total budget of this activity amounts in 4,7 MEuro.
Measure 4.5: Cooperatives for research and technological development in sectors of nationalpriority.
This Measure continues the financing of major research and technological projects, up to thestage of the industrial prototype, in fields of high priority for the national and/or regional econ-omy. The projects are undertaken by cooperatives of enterprises, research centres, educationalinstitutions and other interested agencies, with the aim of increasing the competitiveness ofbusinesses and of the economy in general. One of the priority areas that are clearly relevant tothe competitiveness of the economy and businesses is RES/RUE with a budget of 16 MEuro.This Measure is a continuation of the PENED programme of the previous OPRET – CSF II.
Measure 6.3: Special energy infrastructures for islands and for the promotion of renewableenergy sources.
The Measure supplements the promotion of investments of Measure 2.1 and aims to improve thequality and reliability of electricity supply to islands and to cover their energy needs byinnovative solutions in common with other needs for water and waste management. In addition,it aims to promote investment in RES in parts of the country with high wind potential, where theexisting transmission system is in need of improvement and/or the distribution network shouldbe extended or improved. The total budget for these actions amount to 118 MEuro.
26
Measure 6.3 also includes projects on islands, whether or not related to the above, that willpromote innovative solutions to the more general problem of supplying the islands with ener-gy, and at the same time probably addressing their needs for water and waste management.Emphasis will be given to applications of high-enthalpy geothermal energy intended toprovide support for technology and its further diffusion and wider acceptance, with priorityfor the development of co-generation units that will make rational use of waste heat in lowertemperature applications with a total budget of action 62,8 MEuro.
Another operational programme of the 3rd CSF III, the “Operational Programme for theInformation Society” (OPIS) has also actions for the energy sector and the Ministry ofDevelopment participates in several Measures. The OPIS is an innovative horizontal pro-gramme, cutting across government departments, that aims to the promotion of theInformation Society in Greece in a coherent and integrated manner. It thus constitutes a groupof integrated and complementary interventions in various sectors of the economy and sociallife, so that they can have a catalytic function for the development of the Information Society.
The OPIS constitutes the main instrument for realising the government’s IS strategy andachieving the targets set by e-Europe. The general strategic objectives for period 2000 – 2006 areServices to Citizens and Improvement of Quality of Life and Development and Human Potential.
For the implementation of the general and special objectives, the OPIS is structured in prior-ity axes that include also measures that concern provision of economic incentives aiming tothe support of the economy and employment with the use of new technologies, the promotionof links between the scientific and technological potential of the country with industry and thedevelopment of dexterities of human potential.
More specifically in the framework of Priority Axis 3 «The digital economy, employment andsocial cohesion», in Measure 3.2 «Aid for enterprises for their inclusion in the digital econo-my» special actions are included also for the support of companies inter alia and in the ener-gy sector. The action for the energy sector concerns provision of grants (subsidies), of a totalof 13.35 million Euro in investments of energy savings with the integration of informationsystems, automation and telematics in existing enterprises of the secondary and tertiaryprivate sector.
The Ministry of Agriculture has provided financial support, through the Greek CSF II (1994-1999), to several projects, throughout the country, dealing with the utilisation of renewableenergy sources (biomass, geothermal and solar energy), specifically for heating purposes ingreenhouses. The Ministry has already incorporated a similar programme in the Greek CSFIII (2000-2006).
Finally, the Ministry of Environment, Physical Planning and Public Works has financed inrecent years a number of pilot projects, mainly concerning the integration of RES systems inpublic buildings, such as photovoltaic panels in schools, bioclimatic design, construction orrehabilitation of public - building complexes, etc.
3.6 The Buy-back Pricing System for RES-ElectricityThe current RES-electricity tariffication system, established by Law 2244/94 and retained byLaw 2773/99, distinguishes between: a) RES electricity produced and sold to the national grid(interconnected system); and b) RES electricity produced in the non-interconnected islands.The buy-back rates for the two cases are differentiated as follows:
27
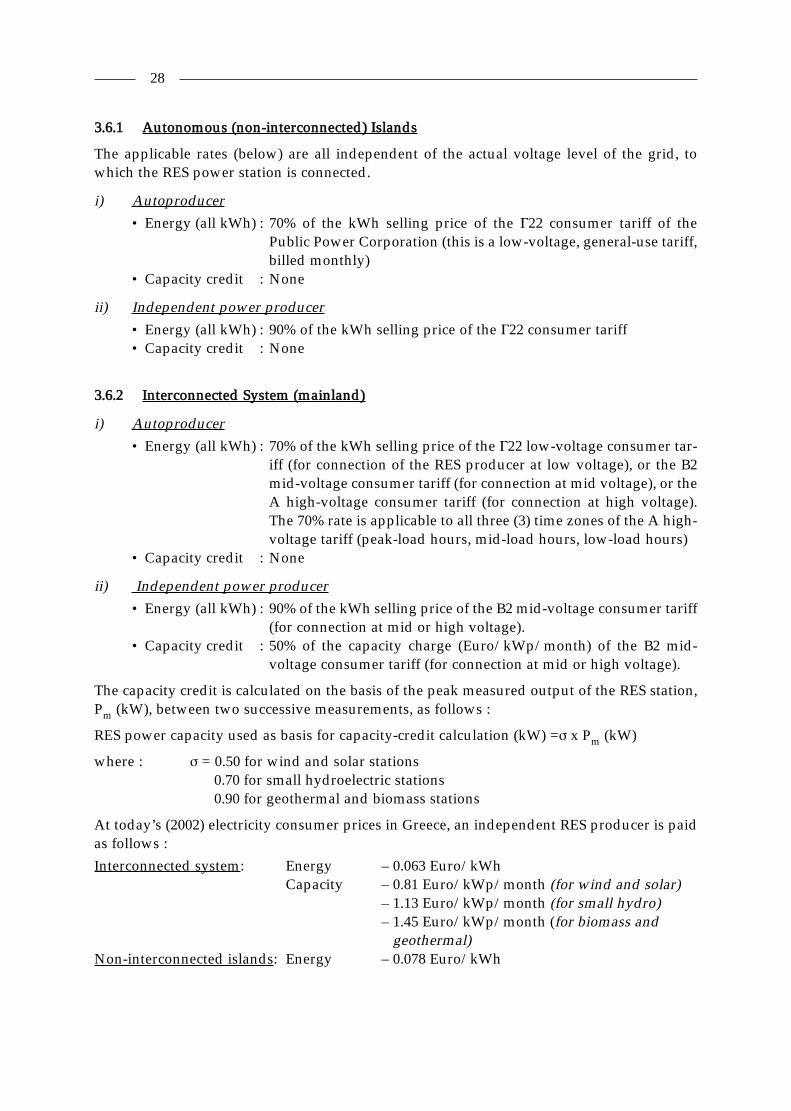
3.6.1 Autonomous (non-interconnected) Islands
The applicable rates (below) are all independent of the actual voltage level of the grid, towhich the RES power station is connected.
i) Autoproducer• Energy (all kWh) : 70% of the kWh selling price of the �22 consumer tariff of the
Public Power Corporation (this is a low-voltage, general-use tariff,billed monthly)
• Capacity credit : None
ii) Independent power producer• Energy (all kWh) : 90% of the kWh selling price of the �22 consumer tariff • Capacity credit : None
3.6.2 Interconnected System (mainland)
i) Autoproducer• Energy (all kWh) : 70% of the kWh selling price of the �22 low-voltage consumer tar-
iff (for connection of the RES producer at low voltage), or the B2mid-voltage consumer tariff (for connection at mid voltage), or theA high-voltage consumer tariff (for connection at high voltage).The 70% rate is applicable to all three (3) time zones of the A high-voltage tariff (peak-load hours, mid-load hours, low-load hours)
• Capacity credit : None
ii) Independent power producer• Energy (all kWh) : 90% of the kWh selling price of the B2 mid-voltage consumer tariff
(for connection at mid or high voltage). • Capacity credit : 50% of the capacity charge (Euro/kWp/month) of the B2 mid-
voltage consumer tariff (for connection at mid or high voltage).
The capacity credit is calculated on the basis of the peak measured output of the RES station,Pm (kW), between two successive measurements, as follows :
RES power capacity used as basis for capacity-credit calculation (kW) =� x Pm (kW)
where : � = 0.50 for wind and solar stations0.70 for small hydroelectric stations0.90 for geothermal and biomass stations
At today’s (2002) electricity consumer prices in Greece, an independent RES producer is paidas follows :
Interconnected system: Energy – 0.063 Euro/kWh Capacity – 0.81 Euro/kWp/month (for wind and solar)
– 1.13 Euro/kWp/month (for small hydro) – 1.45 Euro/kWp/month (for biomass and
geothermal)Non-interconnected islands: Energy – 0.078 Euro/kWh
28

THE ROLE OF FINANCIAL INSTITUTIONS i
4.1 IntroductionFinancial markets present an opportunity for the promotion of RE policy, particularly usefulin view of the need for a wider range of policy instruments.
The deregulation of the Greek financial system has been almost completed. Banks and otherfinancial institutions operate in a new environment, characterised by the emergence of smallprivate banks, the modernisation of existing ones, the intensification of competition and theintroduction of numerous new products and services. On the other hand, as a result of widerchanges and developments in the Greek financial sector, the role of the stock market has beensignificantly upgraded. However, there are still major weaknesses, which have prevented thefinancial system to take advantage of the full range of benefits derived from deregulation.
Financial markets can be very conservative. The rewards from acting in a new or differentway are often outweighed by the risks. For example, trustee investors who are required toinvest prudently on behalf of others (e.g. in pension funds) often find that the least riskycourse is to invest in a similar manner to their peers. Regulators also often act as a brake oninnovation, with some justification. While certain areas of the financial markets can be highlyinnovative, for instance in derivative products, inertia remains a significant problem for areaswhere financial institutions ought to be promoting sustainable development.
In recent years, there has been a visible acceleration in the development and integration of EUfinancial markets and three main interrelated factors have underpinned this acceleration ofintegration of EU financial markets. The first factor is globalisation, the second factor is theadvances in creating a common regulatory framework across the EU as part of the effort tocomplete the Internal Market in financial services and the third factor is the adoption of theeuro.
CHAPTER 4
i. Further information on the role of Financial Institutions can be found in [4].
29

Despite recent progress, however, the EU financial system remains fragmented. SuccessiveEuropean Councils have declared the integration of EU financial markets as a high priority ofeconomic reform in the EU. This priority is reflected in a coherent policy strategy at the EUlevel and in the urgency which has been attributed to its implementation. The issue is beingaddressed mainly within the context of the Commission’s Risk Capital Action Plan (RCAP)and the Financial Services Action Plan (FSAP). The RCAP focuses on improving the provisionof finance to new enterprises, often working in high technology, high-risk areas. At theCardiff European Council in June 1998, financial services were given a high profile and theEuropean Commission was asked to prepare a framework for action. The result was theFinancial Services Action Plan, a package of 42 policy initiatives aimed at improving the func-tioning of the EU financial system by 2005. Among the objectives underlying the plan are thecreation of a single wholesale financial market in the EU and open and secure retail markets.
4.2 Motivating the Financial SectorFinancial markets will only use their influence for the benefit of the environment if they seethat this is in their broad interest - i.e. it will help them generate profits, either directly or indi-rectly. The indirect considerations are particularly important in the investment business,where they can be interpreted as improving investment performance through better advice ormanagement.
While this is straightforward, to apply it is rather more difficult. Beforehand it can be very dif-ficult to know whether a particular activity will be profitable or will enhance investmentreturns. Past returns are no guide to future performance. Before considering any new or dif-ferent activity, financial institutions will want to consider what they are letting themselvesinto very carefully.
To encourage the financial markets to support the RE sector, there is a need for measures atboth a macro level, such as clear policy development and dissemination, and micro level, suchas training on financial markets for environmental entrepreneurs. There is scope to supportinnovation in finance to the sector. In addition, public sector financial support programmes tothe RE sector could be adapted to work more closely with the financial sector.
Financial institutions could see the RES as offering the potential for profitable lines of busi-ness. Examples include:
• building expertise in providing finance for key energy sectors (such as environmentaltechnology, renewable energy)
• developing financial products to assist in the use of RES (e.g. energy efficiency)• developing “green” investment products for clients and customers.
For this approach to offer attractive opportunities to financial institutions it will require theexistence of growing, profitable market segments. The extent to which such opportunitiesexist is clearly open to debate, but there is some evidence to suggest that substantial unex-ploited opportunities exist.
4.3 Financial Sector & RE ProjectsBanks and financial institutions may offer so-called “golden” or “green” funds addressed tocapital markets. Such funds are financed from accounts, which attract lower interest rates. The
30

margin consented by the lower interest rate is passed on by the bank to the investor in theform of discount rates. Furthermore, institutional banks offer soft loans and special facilities.Public RE funds have been introduced and managed by regulated agencies. The facilitiesoffered could involve revolving funds as well as venture capital and credit guarantees.
In certain countries, e.g. Germany, the “Green tariffs” are introduced by energy distributingcompanies. This is the result of a voluntary environmental solidarity of large groups of con-sumers who buy “green electricity” for a higher rate than normal.
Project Finance
Project finance is investment into specific, stand-alone projects, with only limited recourse tooutside parties if the project runs into difficulties. Project finance normally depends on a keycontract to supply or charge for the services provided (e.g. power or heat). If these contractsare secure there can be some flexibility over ownership of the facility - such as build-own-operate-transfer (BOOT) structures.
Leasing
Leasing is the provision of finance to acquire a piece of capital equipment, with the financesecured by title to the equipment. It is a highly flexible form of finance used throughout busi-ness to finance everything from photocopiers to aircraft. Leasing works best where the equip-ment is movable and saleable, although it has been used more generally. It can be regarded asa form of sales financing -i.e. it helps customers of a company buy that company’s equipment.Leasing has been used to buy various sources of RE technology from monitoring equipmentto wind turbines.
Leasing can often be combined with tax advantages (by transferring a tax credit to an organ-isation that can use it). If RE equipment is given particular tax allowances, then leasing canplay a very useful role.
Environmental Sector Funds
These funds invest specifically in the environmental sector. Several such funds were launchedat the height of environment interest in the early 1990s. Many of the funds have performedpoorly - they were launched with little understanding of environmental trends and too nar-row a definition - and this is one reason why many in the investment community have a neg-ative view of environmental issues.
Venture Capital
Venture capital is a specialist form of investment, which provides equity capital to small, newcompanies. Small companies with no track record can have difficulties raising capital frommost investors, and venture capitalists aim to fill the gap. Venture capital is normally highreturn/high risk and venture capitalists expect to see returns of over 25% from their invest-ments but accept that a certain number will fail. Normally, venture capitalists have a rel-atively long-term focus, aiming to hold companies for several years before selling them.Venture capitalists generally take a significant stake in a relatively small number of compa-nies and have a more active approach than most other types of investors, in terms of partici-
31

pating in management of the company. They will often have a seat on the board and will aimto advise and help companies in business strategy, finance etc.
Initial Public Offerings
Obtaining a stock market listing and using the opportunity to raise capital is a mainstreamfinancing activity, which has been used by the energy sector. The growth of second tier stockexchanges around Europe should help make it easier for RE sector companies to obtain lis-tings and raise finance. This process would be made easier still if investors were properlyinformed about the potential of RE sector and had faith in the development of environmentalpolicy.
Public Sector Investment Banks
Public sector investment and development banks can play a role in encouraging the privatefinancial sector to support RE investments, by supporting research and innovation, providingpart funding and by working through intermediary financial institutions. A number of devel-opment banks have recognised that with the expanded provision of private finance in manymarkets, they must redefine their roles. A natural step for them to take is to lead in the pro-vision of finance in new or underfinanced areas, particularly those relevant to broader soci-etal goals, such as sustainable development. Thus financing the RE sector may appear asuitable opportunity for them.
4.4 ObstaclesFor Greece, in financial market terms the RE industry represents something of a paradox:great fundamental prospects but poor performance.
Financial markets, particularly those that are developed along and equity-driven, are oftenaccused of short-termism. Many listed companies feel under pressure to deliver immediateprofits at the expense of longer-term business development. Sustainable development is per-haps the ultimate long-term issue. While this is a concern, it is not always insurmountable:Long-term projects have been able to attract funding despite a long delay until payback. Forexample, biotechnology companies have gained listings despite their work being years fromcommercial application.
Most investment (e.g. pensions funds and life insurance) is essentially long term. Thus con-cern has been expressed that organisations with a long-term view are investing in companiestaking a long-term view, but through the short-term perspective of the financial markets.Many in the markets would respond that maximising short-term returns is the best way tomaximise long-term returns. One interesting observation here is that for this to happen a nec-essary condition is that short-term investment in any one period does not affect the ability togenerate returns in any future period. This condition is essentially the same as that of sustain-able development. The implication is that short termism in investment will only maximiselong-term returns if sustainable development is achieved.
This debate could be largely resolved if accounting systems could reflect all of a company’scapital, including aspects such as reputation, human development and environment. This initself provides a reason to support the development of broader accounting systems.
32

A key limitation to the inclusion of environmental factors is the patchy quality of informationon environmental issues, and a lack of understanding or awareness of the potential of suchinformation.
While the quality of such information is improving major gaps remain, making it easy forsceptics to ignore environmental issues. Examples including inadequate reporting of risks,where for instance a company can appear to improve profitability by failing to take out ade-quate insurance or the tendency by analysts to ignore one-off gains and losses despite recentaccounting reforms intended to incorporate them. Analysts rarely see as material one-offwrite downs and exceptional losses relating to environmental liabilities and higher thanexpected capital expenditures on projects and instead concentrate on year-on-year or ‘nor-malised’ earnings figures.
33
EU FINANCING SOURCES FOR RE PROJECTS
5.1 IntroductionFor the European Union, the Directorate General for Transport & Energy (DG TREN) isresponsible for the energy policy. Although the promotion of renewable energy has been anintegral part of the EU energy policy, renewable energy sources (RES) are currently insuffi-ciently exploited in the EU. The promotion of renewable energy has become a EuropeanUnion priority policy objective, with the following ambitious targets:
• The share of renewable energy in gross domestic energy consumption in the EU shouldbe doubled (from the present 6% to 12%) by 2010ii.
• Electricity produced from renewable energy sources should represent 22% of electricityconsumption by 2010 (in 1997, it represented 14% of electricity consumption)iii.
Overall emissions of greenhouse gases should be reduced meeting the Kyoto objectives by atleast 8% below 1990 levels for the period 2008 to 2012iv.
The Gothenburg European Council in June 2001 confirmed the EU consumption target of 22%and also invited “the member states to promote the Sustainable Development Strategy and tocooperate with the Commission in implementing the EU policy on climate change.” The pro-motion of renewable energy is a major feature of the European Climate Change Programmev.
With regard to renewables, the second phase of the ECCP (2002-2003) is focussing on the pro-motion of renewables in heating applications («RES-H»). The Commission is analysing thepotential for increased uptake and the ways in which both existing (such as the Directive on
CHAPTER 5
ii. European Commission White Paper on Renewable Energies COM (97) 599 and CouncilResolution of 08/06/1998 on Renewable Sources of Energy.
iii. Directive 2001/77/EC of the European Parliament and the Council on the promotion of electric-ity from renewable energy sources in the internal electricity market (27 September 2001, OJ L283,27.10.2001).
iv. Council Decision of 25 April 2002 concerning the approval, on behalf of the European Com-munity, of the Kyoto Protocol to the United Nations Framework Convention on Climate Changeand the joint fulfilment of commitments thereunder (2002/358/CE, OJ L130, 15.5.2002).
v. “European Climate Change Programme” (ECCP), Commission, June 2001.
35
energy performance of buildings or the proposed CHP Directive) and new measures can con-tribute to the promotion of RES-H.
Recognising that policy efforts and initiatives have been insufficient to break down the barri-ers, which hamper the penetration of RES, the European Commission has decided to formulatea comprehensive strategy for RES in 1997. The strategy and action plan in the EC White Paperare directed towards the overall EU target of achieving 12% penetration of renewables in theUnion by 2010. The main objectives of the EU renewable energy Action Plan are:
➱ Internal Market measures (fair access for RE to the electricity market; fiscal and finan-cial measures, such as tax exemptions for RES; new bioenergy initiative for transport,heat and electricity; improving building regulations).
➱ Reinforcing Community policies (environment; growth, competition and employment;competition and state aid; research, technological development and demonstration;regional policy; common agricultural policy (CAP); external relations).
➱ Strengthening co-operation between Member States.➱ Support measures (targeted promotion, such as the ALTENER programme; market
acceptability and consumer protection; increased visibility of RES on the finance mar-ket; renewable energy networking).
To guarantee that the objectives are achieved, a campaign has been launched to promotelarge-scale projects in RES. The White Paper identifies a number of key actions to be part ofthe campaign.
5.2 Campaign for Take-Off (CTO)The CTO proposed in the White Paper forms an integral part of the Community Strategy. Itis designed to kick-start the implementation of the Strategy and is expected to have reachedits goals by 2003. Focusing on certain key sectors proposed and elaborated below, it sets outa framework for action to highlight investment opportunities and attract the necessary privatefunding which is expected to make up the lion’s share of the capital required. The Campaignalso seeks to encourage public spending to focus on the key sectors, and, in the process, tocomplement private investment.
Investments necessary to achieve the goals of the CTO would have to come primarily from theprivate sector. A strong commitment from industry and other potential investors is thereforecrucial. Equally important, Member States close involvement is required, both through mar-keting the ideas of the Campaign and focusing programmes and schemes on its objectives. ARenewable Energy Partnership could strengthen the necessary co-operation at Communitylevel.
The following key sectors are proposed to be promoted during the Campaign:
1,000,000 PV systems15 million m2 solar collectors
10,000 MW of wind turbine generators10,000 MWth of combined heat and power biomass installations
1,000,000 dwellings heated by biomass1,000 MW of biogas installations
5 million tonnes of liquid biofuels
For each key sector an indicative target is proposed, which corresponds to a limited share
36

(between 15% and 25%) of the overall 2010 objective put forth in the White Paper for the sec-tor in question. This share takes into account the present status of development of the partic-ular sector, the highest percentage (25%), for example, being set for wind energy.
Following a detailed analysis each key sector has been divided into segments according tospecific markets, fields of application or particular technologies. In the framework of theCampaign, for each segment, the installed capacity needed, has been estimated. While themost appropriate territory for each segment has also been identified. Finally the indicativecosts of each application in the territory concerned have been estimated as these costs includethe average unit cost during the period of the Campaign and the total investment needed.
In addition to the key sectors, a stated goal of the CTO as presented in the White Paper is theidentification of “100 communities” aiming at 100% of RES supply. The “100 communities”programme as initially proposed in the WP has already aroused much interest across the EU.The “100 communities” programme could also be a benchmark for the implementation ofdecentralised energy supply.
Table 5.1:
Indicative Scenario for Developing Key Sectors 1999 – 2003
In February 2001, the Commission published its first report on the progress made towardsachieving the objectives set in the White Papervi. The data presented in this report, shows thatadvances are being made, but not at the same speed in each sector of renewable energy tech-nology.
37
vi. Communication on the implementation of the Community Strategy and Action Plan onRenewable Energy Sources (1998-2000), COM(2001) 69 Final of 16 February 2001.

5.3 Green Paper Towards a European strategy for the security of energy supplyOn 29 November 2000, the Commission adopted a Green Paper on supply securityvii, in orderto launch a debate on the: geopolitical, economic & environmental stakes involved in securingthe EU’s energy supply.
The European Union’s external dependence for energy is constantly increasing. The Unionimports 50% of its energy requirements and if no measures are taken within the next 20 to 30years this figure will rise to 70%. This external dependence has economic, social, ecologicaland physical risks for the EU. Energy imports represent 6% of total imports, which means ingeopolitical terms that, 45% of oil imports come from the Middle East and 40% of natural gascomes from Russia. The EU does not yet have all the means possible to change the inter-national market. This weakness was clearly highlighted at the end of 2000 by the strongincrease in oil prices.
The Green Paper outlines the plan of a long-term energy strategy by:
a) Curbing the growth in demand by: completing the internal market, reviewing of ener-gy taxation, energy saving and diversification plans and dissemination of new tech-nologies;
b) Managing the dependence on supply by: development of less polluting energy sources,maintaining access to resources, ensuring external supplies, new and renewable formsof energy are the first options for action in relation to security of supply, the environ-ment and rural populations.
With respect to the development of new and renewable energies the Green Paper also stress-es the doubling of their share from 6 to 12% in the energy balance and that passing from 14 to22% for electricity production is an ambitious objective to be achieved between now and 2010.Under current conditions, renewables will stagnate around at 7% in 10 years. Only financialmeasures (State tax aid, tax deductions, and financial support) could support such an ambi-tious aim. Among the ways to be explored, one could envisage that profitable energies (oil,gas, nuclear power) finance the development of the renewable energy, which did not benefit,like other conventional energy, from consequent support.
5.4 Directive on the promotion of electricity produced from renewable energy sources
According to the EU Directive on the promotion of electricity produced from renewable ener-gy sources(RES-E) in the internal electricity market adopted in September 2001 (OJ L283,27.10.2001), EU member states shall have their own national indicative targets (of renewables)at 12% share of gross national energy consumption by 2010 and 22% share of electricity gen-eration by 2010.
The Commission is thus proposing a series of immediate and long-term measures.
Firstly, the directive:
• obliges the Member States to set national objectives for future domestic consumption ofelectricity produced from renewable sources of energy;
38
vii. COM(2000) 769 final.

• requires the Member States to define quantitative objectives to maximise the foothold ofelectricity produced from renewable sources in the global production of energy;
• calls on the Commission to monitor compliance of the national objectives:– with the global objective of 12% of gross internal energy consumption at Community
level;– the specific objective of 22.1% consumption of electricity produced from renewable
energy sources;– with Community commitments on climate change.
In this context, the Commission will have to propose amendments to the national objectiveswhere these contradict Community objectives.
Secondly, as regards aid to electricity produced from renewable sources of energy, the directive:
• does not propose a harmonised system of aid at Community level. Nonetheless, theCommission may make a proposal for a more harmonised system of aid within fouryears of the entry into force of the directive. This proposal would take account of theexperience made by the Member States in operating the various national supportsystems. It would be based on an assessment by the Commission of the various systemsof aid, not only to renewable sources but also to conventional sources of energy.Whatever the case, it will allow for transitional periods of seven years after that date;
• confirms the wish of the Member States that the revised framework of State aid forenvironmental protection, which the Commission has adopted in 2001, should allownational support systems designed to promote electricity produced from renewablesources of energy to be maintained and systems that have been notified to be put intoeffect.
Thirdly, Member States must:
• ensure priority access to electricity produced from renewable sources of energy;• confirm this within two years of entry into force of the directive;• improve and accelerate the authorisation procedures applicable to the establishment of
production centres for green electricity;• guarantee that the calculation of connection costs for new producers are transparent and
non-discriminatory.
The Member States must adopt and publish, by 27 October 2002 at the latest, and every fiveyears subsequently, a report setting the indicative Member State targets for future RES-E con-sumption for the following ten years and showing what measures have or are to be taken tomeet those targets.
Directive 2001/77/EC on the promotion of electricity produced from renewable energysources in the internal electricity market provides in its annex for Greece an indicative targetof meeting by 2010 a part of its gross national electricity consumptionviii from RES equal to20,1%, the contribution of the large-scale hydroelectric plants being included. That target iscompatible with the international commitments of the country resulting from the Kyoto pro-tocol signed in December 1997 within the context of the Rio UN framework agreement for theclimate change.
39
viii. It is termed the mean national electrical power production including autoproduction plusimports minus exports.

The Kyoto protocol foresees for Greece a 25%ix restraint on the increase of CO2 and other gasesthat aggravate the greenhouse effect by the period 2008-2010 with respect to the base year 1990.
5.5 State aid regulationsThe Commission has adopted new Community guidelines on State aid for environmental pro-tectionx providing transparent criteria, indicating under which circumstances it holds “green”State aid to be compatible with the common market.
This is important to the RES sector, as most EU Member States offer subsidies to produc-ers/users of renewable energy in order to create a “level playing field” for renewable energy,in the face of competition from conventional energy sources, for which the external costs arenot all passed on directly to the end-user of the energy.
These subsidies may, in many cases, fall under the State aid rules of the EC Treaty and arethus subject to Commission approval. The new guidelines now offer Member States severalnew possibilities to support renewables while complying with the State aid rules.
5.6 EC Directive Proposals
Proposal for a directive on the energy performance of buildings
The Commission has adopted a proposal for a directive (Directive 2002/91/EC), which aimsto promote improvements in the energy performance of buildingsxi. This proposal focuses toa large extent on energy efficiency issues but also has relevance for the supply side. It includesa methodology for establishing integrated energy performance standards for buildings, thattakes into account on-site energy production, for example through the use of PV electricity orsolar heating/cooling technologies.
Implementation of the new directive would provide a valuable opportunity for the PVindustry to demonstrate to a wide range of building owners and users how PV can contributeto reducing the share of energy consumption in the EU attributable to buildings, which cur-rently stands at 40%.
Proposal for a Directive on Combined Heat and Power (CHP)
The EC in July 2002 presented a proposal for a Directive on Combined Heat and Power (CHP)(COM(2002) 415 final, 22.7.2002) aimed at saving energy and combating climate change bypromoting the co-generation of heat and power. The Directive proposed would encourageMember States to promote co-generation through a systematic identification and progressiverealisation of the national potential for high efficiency co-generation. Member States wouldhave to report on the progress achieved towards meeting this potential and on the measurestaken in this respect.
40
ix. It is a intra-Community quota within the framework of a burden-sharing agreement of theMinisters of Energy.
x. OJ C37, 3.2.2001, p.3.xi. COM(2001) 226 final of 11 May 2001, & OJ L1, 4.1.2003, p.65.

• The draft Directive obliges Member States to guarantee that electricity from cogener-ation will be transmitted and distributed on the basis of objective, transparent and non-discriminatory criteria;
• Obliges Member States to facilitate access to the grid for electricity produced fromcogeneration units using renewable energy sources and from units with a capacity lessthan 1 MWe;
• Obliges Member States to publish an analysis of the national potential for high efficien-cy cogeneration, an analysis of the barriers to high efficiency cogeneration and a reporton progress towards increasing the share of high efficiency cogeneration, including themeasures taken to promote it.
It also introduces basic cogeneration definitions that Member States will have to comply withby amending national legislation, including definitions for:
• “electricity from cogeneration”: will eliminate the current ambiguity resulting from thedifferent definitions of cogenerations;
• “high-efficiency cogeneration”: to determinate high efficiency cogeneration in terms ofenergy savings in comparison with separate production. Only cogeneration productionproviding energy savings of at least 10% will qualify as high-efficiency cogeneration.
And finally, the directive introduces the scheme of guarantee of origin. Member States willhave to ensure that guarantee of origin of electricity from cogeneration can be issued onrequest by one or more competent body.
Commission package for the promotion of biofuels
In November 2001, the European Commission adopted a legislative package aiming at put-ting into action its new White Paper on transport policy. The package contains a communi-cation and two proposals for directives: “Communication on an Action Plan and two Pro-posals for Directives to foster the use of Alternative Fuels for Transport, starting with the reg-ulatory and fiscal promotion of biofuelsxii (COM (2001) 547 final).
The Commission considers that the use of fuels (such as ethanol) derived from agriculturalsources (i.e. biofuels) is the technology with the greatest potential in the short to mediumterm. The action plan outlines a strategy to achieve a 20% substitution of diesel and gasolinefuels by alternative fuels in the road transport sector by 2020. It concludes that only threeoptions would have the potential to achieve individually more than 5% of total transport fuelconsumption over the next 20 years: biofuels which are already available, natural gas in themedium term and hydrogen and fuel cells in the long term.
The first proposed Directive would establish a minimum level of biofuels as a proportion offuels sold from 2005, starting with 2% and reaching 5.75% of fuels sold in 2010. The secondproposed Directive would give Member States the option of applying a reduced rate of exciseduty to pure or blended biofuels, when used either as heating or motor fuel.
41
xii. COM (2001) 547 final of 7 November 2001.

5.7 EU Supported Programmes
5.7.1 Intelligent Energy for Europe
The Commission has proposed a new multiannual programme of action in the field of ener-gy for the period 2003-2006 (COM (2002) 162 final). «Intelligent Energy for Europe -IEE»xiii
implements the course of action outlined in the Commission’s Energy - Security of SupplyGreen Paper. It aims at strengthening security of supply, fighting against climate change andstimulating the competitiveness of European industry. «Intelligent Energy for Europe» willprovide financial support to local, regional and national initiatives in the fields of renewableenergies, energy efficiency, energy aspects of transport and their international promotion. Ofparticular note are the Commission’s communicationxiv on a sustainable Europe, subsequen-tly approved by the Gothenburg European Council and the Johannesburg conference onsustainable development.
Actions that can benefit from EU financial assistance must aim at stimulating the Europeanmarket, and, among other things:
– Increase energy efficiency by around 1% per year;– Increase the use of renewable energy in consumption from 6% to 12% by 2010;– Increase to 22.1% by 2010 the percentage of electricity produced from renewable
sources;– Increase the production of electricity produced from cogeneration by 2010;– Develop the potential of renewable sources of energy;– Promote Kyoto mechanisms
The new “Intelligent Energy for Europe” programme is adopting a more integrated approachregarding the promotion of renewable energies (ALTENER) and energy efficiency (SAVE),offering at the same time a higher level of European support. International action regardingthe RES and RUE priorities is brought in line with the COOPENER sub-programme. Finally,the STEER sub-programme will include a new package of measures on the energy aspects oftransport, in line with the new guidelines of the common transport policy.
In the current financial context, the Commission will allocate the “Intelligent Energy forEurope” programme a budget of 215 millions for the period 2003-2006. This budget takesinto consideration the EU’s political guidelines, notably the European Union strategy forsustainable development, approved by the Gothenburg European Council in June 2001. TheEnergy Framework Programme (1998-2002) was allocated an overall budget of 175 millions.
The provisional budget for the above programme is broken down as follows:
42
xiii. http://www.europa.eu.int/comm/energy/res/intelligent_energy/index_en.htmxiv. A sustainable Europe for a better world: a European strategy for sustainable development, COM
(2001) 264.

* An additional budget of 50 million could be envisaged in the context of EU enlargement.
Joint funding will in principle be limited to 50% of the total cost of projects, but for certainstudies, or measures undertaken on the Commission’s own initiative, there is provision for100% funding. In order to be eligible for support, projects must help to reduce the EU’s ener-gy dependency and combat climate change. The first call for proposals is expected duringspring 2003 following the adoption of the common position on the draft Decision of theEuropean Parliament and the Council establishing the programme.
The work programme of the IEE is organised in KEY ACTIONS (KA), and inside each KeyAction a number of TARGET AREAS (TA) have been defined. The key actions are of vertical(VKA) and horizontal (HKA) character. The Vertical Key Actions (Save, Altener, Steer andCoopener) contain the sectoral objectives of each of the fields, including the potential instru-ments that could be used to achieve them.
The Horizontal Key Actions are, by nature, transectoral, covering several (or all) fields. Someof the Horizontal Key Actions have as a main objective the integration of actions addressingRenewable Energy Systems, Rational Use of Energy and Transport. This is the case for the KeyActions: “Think globally, act locally”, “High performance communities” and “Monitoringand evaluation”. The other two Horizontal Key Actions, “Dissemination and valorisation ofresults” and “Innovative financing schemes” have as their main objective the creation of asound basis for the promotion of Renewable Energy Systems, Rational Use of Energy andTransport specific measures.
In addition elements that have the same character as those of the Horizontal Key Actionscould logically appear in each Vertical Key Action, applied to that sector. In these cases, thehorizontal elements of the Vertical Key Action will be co-ordinated and empowered throughthe Horizontal Key Action.
The European Union’s “Energy” Framework Programme (1998-2002) on actions in the energysector and most of its energy programmes expired in December 2002. They included amongothers the SAVE and ALTENER programmes. In the current IEE the ALTENER programmeconcerns the promotion of new and renewable energy sources for centralised and decen-tralised production and their integration into the local environment and energy systems,including the preparation of legislative measures and their application.
5.7.2 The Sixth Framework Programme
The Sixth Framework Programme (FP6)xv is the Union’s main instrument for the funding ofresearch in Europe. Proposed by the Commission and adopted by the Council and Parliamentin co-decision, it is open to all public and private entities, large or small. The main focus of
43
xv. http://fp6.cordis.lu/fp6/home.cfm
FP6 is the creation of a European Research Area (ERA) as a vision for the future of research inEurope. It aims at scientific excellence, improved competitiveness and innovation through thepromotion of increased co-operation, greater complementarity and improved co-ordinationbetween relevant actors, at all levels.
New support instruments have been introduced: Networks of Excellence and IntegratedProjects, which will give EU activities a bigger impact and bring about a stronger structuringeffect on research conducted in Europe. FP6 will make it possible to assemble genuine criticalmasses of resources, to better co-ordinate national research efforts and to diversify supportactivities in key areas such as the mobility of researchers, research infrastructures and scienceand society issues.
The overall budget covering the four-year period 2003 - 2006 is 17.5 billion, representing anincrease of 17% from the Fifth Framework Programme and making up 3.9% of the Union’stotal budget (2001), and 6% of the Union’s public (civilian) research budget. There are nonational quotas for FP6 funds. FP6 represents the third operational budget line within theoverall EU budget, after the lines of Common Agricultural Policy and Structural Funds. It willbe instrumental in achieving the March 2000 Lisbon European Council goal of turning Europeinto the world’s most competitive, knowledge-based economy by 2010. It will also greatlycontribute to the creation of the ERA, a true European internal market for research and knowl-edge, where EU and national R&D efforts are better integrated.
The Sixth Framework Programme (FP6) sets out the priorities for the European Union’sresearch, technological development and demonstration (RTD) activities for the period 2002-2006. Much of the 17.5 bn budget will be spent on seven thematic priority areas:
• Life sciences, genomics and biotechnology for health• Information society technologies• Nanotechnologies, multifunctional materials and new production processes• Aeronautics and space• Food quality and safety• Sustainable development, global change and ecosystems• Citizens and governance in a knowledge based society
One of the main aims of FP6 is the establishment of the European Research Area (ERA). Tothis end, part of the budget has been allocated to the co-ordination of research activities, anddeveloping research and innovation policies. In addition to this money, the following activityareas have been set up to help structure the ERA:
• Research and innovation• Human resources and mobility• Research infrastructures• Science and society
There is also special support for multi-sector research activities involving Small and MediumSize Enterprises (SMEs) and for international co-operation activities. In addition to this a partof the budget has also been set aside for the EURATOM framework programme, which co-ordinates research into nuclear energy.
On 3 June 2002 the Council adopted the FP6, after the European Parliament had agreed to iton 15 May 2002. FP6 covers, inter alia, the priority area “Sustainable development, globalchange and ecosystem”, with a total budget of 2,120 million. More than a third of this bud-get will be dedicated to non-nuclear energy and will address RTD activities to promote clean
44
energy, in particular renewable energy sources and their integration in the energy system,together with storage, distribution and use, as well as alternative motor fuels.
The Non-nuclear energy (NNE) research falls within the FP6 thematic area “SustainableDevelopment, Global Change and Ecosystems”. The NNE Research programme objectives arethe reduction of greenhouse gases and pollutant emissions, the security of energy supply, theincreased use of renewable energy and the enhanced competitiveness of European industry.
RTD into sustainable energy systems is divided into two areas:
Research activities having an impact in the short and medium term
Research in this area is focussed on bringing innovative and cost competitive technologiesonto the market by demonstration projects and research into technical, institutional, financialand social issues.
• Clean energy, in particular renewable energy sources and their integration into the ener-gy system, including storage, distribution and use.
• Energy savings and energy efficiency, including those to be achieved through the use ofrenewable raw materials.
• Alternative motor fuels.
This part of the Thematic Priority is managed by DG Energy and Transport and has a budgetof 405 M.
Research activities having an impact in the medium and long term
In the longer term the aim is to develop new, clean energy sources and carriers which areaffordable and can be integrated into energy supply networks.
• Fuel cells, including their applications.• New technologies for energy carriers/transport and storage, in particular hydrogen.• New and advanced concepts in renewable energy technologies• Capture and sequestration of CO2, associated with cleaner fossil fuel plants.
This part of the thematic priority is managed by DG Research and has a budget of 405 M.
The first calls for the Sixth Framework Programme (FP6) were published on 17th December2002. The work programmes and the first calls were built upon the 12,000 proposals, whichwere submitted in the recent expression of interest.
5.7.3 The LIFE Programme
LIFE Programmexvi is the Commission’s financial instrument for the environment. The gener-al objective of LIFE is to contribute to the implementation, updating and development ofCommunity environment policy and of environmental legislation, in particular as regards theintegration of the environment into other policies, and to sustainable development in theCommunity.
LIFE consists of the three thematic components, namely, LIFE-Nature, LIFE-Environment andLIFE-Third Countries. The specific objective of Life-Environment is to contribute to the devel-opment of innovative methods and techniques and to the further development of Communityenvironment policy.
45
xvi. http://www.europa.eu.int/comm/environment/life/home.htm

Projects financed by Life-Environment must be:
• demonstration projects which integrate considerations relating to the environment andto sustainable development in land-use development and planning, promote thesustainable management of water or minimise the environmental impact of economicactivities;
• projects which prepare new Community initiatives, instruments or legislation relatingto the environment;
• accompanying measures.
LIFE-Environment does not finance research or investment in existing technologies or infras-tructure. The purpose of the programme is to bridge the gap between research and develop-ment results and their large-scale application. To this end, demonstration projects based onthe results of projects which have been supported under past or ongoing technologicalresearch and development programmes are encouraged.
The maximum rate of Community cofinancing is 30% for projects generating substantialrevenue, 50% in other cases and 100% for accompanying measures. The European Union hasallocated approximately 300 million euros for LIFE-Environment for the period 2000-2004.About fourteen projects that included the demonstration of RE have been financed since 1992.
5.8 Community indirect support for the consumption of energy produced fromrenewable sources (tax measures)
The Commission proposal for the taxation of energy products (COM (97) 30) also provides fortax reductions or exemptions for energy from renewable energy sources. More information isprovided in Chapter 6.5.
5.9 Indirect support to sources used to generate renewable energy (agricultural sub-sidies, etc.)
The most important support in this field is provided through the CAP to certain crops, suchas rapeseed, which are, inter alia, used as energy crops. However, the amount of subsidies isnot easy to quantify, as support is granted for particular crops and not for particular uses.Thus, the exact amount of subsidies could only be established if the exact quantity of cropsused for energy generation, either in the form of biomass or in the form of biofuels, is deter-mined.
The CAP also provides support to RES through some of its rural development projects.However, as these programmes are implemented by Member States using different cal-culation methods, and as most of these programmes are not primarily and exclusively aimedat RES promotion, it is at present not possible to estimate with reasonable precision the orderof magnitude of the support offered. In its Communication on the Mid-Term Review of theCAP, the Commission proposes replacing the existing arrangements for support on set-asideland with a specific energy crop payment (“carbon credit”).
46

5.10 European Multilateral Financial InstitutionsThe involvement of Multilateral Financial Institutions (MFI) in any project requires compli-ance with competitive bidding rules, putting market pressure on the costs and ensuring trans-parency. Following the example of the World Bank Group, other financial institutions nowrequire a satisfactory environmental assessment of the project, something, which has raisedthe awareness of commercial banks on environmental issues. For their assessment proce-dures, MFIs often rely on third party advisors.
In all cases, MFIs involvement in a project is a factor of comfort because:
• The heavy weight of the MFI in the lending group, which leads one to think that the hostgovernment will not impede the repayment of debts.
• The MFI will have concluded favorably on the economics of the project and will haveused independent consultants to do so.
There are a number of other sources of EU support for Risk Capital Financing. Besides theStructural Funds these include the European Investment Bank (EIB); and the EuropeanInvestment Fund (EIF), support from which is sometimes combined with aid from theStructural Funds.
5.10.1 European Investment Bank (EIB)
The European Investment Bankxvii is an autonomous public institution within the EuropeanUnion, responsible to its own decision-making bodies, which operates on a non-profit basis.The EIB is the European Union’s long term lending institution financing priority capitalinvestment projects for a balanced European economic development and integration.
The EIB finances public and private sector projects which meet EU policy objectives. Its maingoal is to finance investments promoting economic development in the European Union’s lessfavoured regions. EIB is involved in financing renewable energy projects through:
• Horizontal co-operation to address regional infrastructure financing, which can have aneffect on the EU.
• Low interest rates (3%) on loans for environmental protection projects.• Risk capital investments, from the EU budget.
The EIB loans from its own resources, either to the public or private sector, must be backed-up by Government guarantees. In addition, EIB lends no more than 50% of the total projectcost.
The Bank has been involved in the financing of renewable energy schemes since the 1970s,mainly in the field of medium and large-scale hydroelectric plants. Due in part to the lack ofsuitable new sites for such projects and their often adverse impact on the local environment,the Bank’s renewable energy focus has shifted to smaller-scale schemes employing an increas-ing number of energy sources.
Recently the EIB has issues a sector policy paper in June 2002 for the financing of renewableenergy projects (Update of Renewable Energy Review – Period 1993-2001). The Bank’s activ-ity in support of renewable energy is modest in both absolute and relative terms – averagelending over the past 9 years has been around EUR 220m per annum. This figure represents
47
xvii. http://www.eib.org

6.5% of its total energy sector direct lending in 2000. In the last few years, the share ofrenewable energy in its total investment in the energy sector has even decreased.
EIB loans provided for renewable energy projects have, in the past, been concentrated on themore commercially and technically developed sectors (hydroelectric, wind power and somegeothermal). Biomass lending has increased in recent years, amounting to EUR 61m and EUR53m in 2000 and 2001, respectively. This is significant, given that these projects are primarilyrestricted to heavily forested regions in Northern Europe. Wind energy development is quitemature in countries such as Denmark, the Netherlands, Spain and Germany, with the focusnow shifting from smaller to larger-scale applications and from onshore to offshore in NorthWest Europe.
The Bank assigns a very high priority to the expansion of its lending for renewable energyprojects. Within existing rules, it is working to overcome the constraints for lending in thisarea, for example by a flexible application of the minimum project size criterion.
To underline its support for the EU’s policy, the Bank is to at least double its loan volume(individual and dedicated global loans) for renewable energy over the next five years. Thisobjective will take into account lending both inside and outside the EU and will be measuredas a proportion of the Bank’s lending in the energy sector as a whole, using its lending in theperiod 1997-2001 as a base. Individual loans for renewable energy in the period 1997-2001amounted to 7.4% of lending in the energy sector.
5.10.2 European Regional Development Fund (ERDF)
The European Regional Development Fund is one of the EU’s Structural Funds which co-finance actions to help reduce the gaps in socio-economic development between the variousregions and member States of the Union.
The ERDF’s resources are targeted at certain disadvantaged regions and are mainly used tofinance improvements in infrastructure, productive investment, local development, humanresources and the environment. There are two kinds of programmes that are administrative-ly distinct: National Programmes and Community Incentives. Funding from ERDF comes inthe form of non-reimbursable assistance.
The new regulation on the European Regional Development Fund (ERDF)xviii, which wasadopted in the framework of AGENDA 2000, expressly states that the ERDF should foster thedevelopment of renewable energy sources, and the definition of the scope of the fund includesaction in support of renewable energy sources.
In the latest guidelines for the Structural and Cohesion Fundsxix, renewable energy is high-lighted as a strategic priority, particularly because of its potential to contribute to the devel-opment of local resources and to reduce import dependency. Whilst it is not appropriate toestablish specific budgets for renewable energy in the regional funds, Member States werenevertheless called upon to guarantee at least 12% of the global budget of their energy sub-programmes for supporting renewable energy sources. This could result in regional invest-ments of around 487 million in RES (2000-2006). Nevertheless, measurement of the precise
48
xviii. Regulation (EC) No. 1783/1999 of the European Parliament and of the Council of 12 July 1999 onthe European Regional Development Fund, OJ L 213, 13.8.1999, p.1.
xix. COM (1999) 344 final.

amount of support would involve searching all such projects for possible RES implications, atask that is beyond the current scope.
5.10.3 European Investment Fund (EIF)
The European Investment Fundxx is a financial institution which was established as a jointventure by the European Investment Bank, the European Union and private and public finan-cial institutions from all 15 Member States of the European Union.
Unlike the EIB, EIF is not a lending institution. As a complement to the other institutions, EIFoffers guarantees on debt finance and invests in venture capital funds. The Fund helps thefinancing of European infrastructure projects in the areas of telecommunications, transportand energy by issuing direct guarantees for debt finance. The growth of smaller businessesthroughout the EU is also supported by the Fund through the issuance of guarantees for debtfinance; in this case a wide range of financial intermediaries are the beneficiaries of theguarantees.
More recently, a transaction structured around the credit insurance, namely the Growth &Environment Scheme, is supporting RET projects implemented by SMEs. Through the Growthand Environment Scheme, the EIF offers a guarantee to financial institutions that grant loansto European SMEs for the financing of environmentally friendly investments, includingrenewables. This guarantee is free of charge for the financial institution and for the companydue to sponsorship of the Scheme by the European Union. The EIF guarantee operates on aportfolio basis. At its own risk, the EIF provides a 50% residual loss cover for eligible creditsincluded in the portfolio by the financial institution. Guarantee fees are paid out of EU budgetfunds under a co-operation agreement between the European Commission and the EIF.
A network of financial intermediaries (for Greece is ALPHA Bank) has been built across theEU following calls for expression of interest and careful selection by the EIF. Interested com-panies should directly approach the financial institutions participating in the Scheme in theirown Member State for more details.
In particular, it should be noted that the EIF implements the financial instruments of the EUMultiannual Programme for Enterprises and Entrepreneurship (MAP 2001-2005)xxi. Thefinancial instruments include:
– the SME Guarantee Facility for guaranteeing (or co-guaranteeing or counter-guarantee-ing) banks’ SME loan portfolios;
– the ETF Start-up Facility for investments in venture capital funds or incubators special-ising in early-stage finance of SMEs;
– the Seed Capital Action, which seeks to support the recruitment of investment managersfor those seed capital funds that the EIF invests in.
The EIF uses banks, venture capital funds and guarantee institutions as intermediariestowards the SMEs.
49
xx. http://www.eif.orgxxi. 2000/819/EC, OJ L 333, 29.12.2000, p 84.

5.10.4 Black Sea Trade & Development Bank
The Black Sea Trade and Development Bank (BSTDB)xxii was established by the elevenMember States of the Organisation of the Black Sea Economic Co-operation in 1998 as aregional multilateral development financial institution.
The purpose of the Bank is to accelerate development and promote co-operation among itsshareholder countries. The Bank’s eleven Member States include Albania, Armenia,Azerbaijan, Bulgaria, Georgia, Greece, Moldova, Romania, Russian Federation, Turkey andUkraine. The Bank benefits from a subscribed capital base of approximately 1.35 billion USD.
The Bank provides funds for projects and trade financing under the terms and conditions stip-ulated in Rules and Procedures for Financing Projects (Project Finance) and CommercialActivities (Trade Finance). The Bank’s operational strategy is formulated along the lines of itsmission to facilitate the progress of each member country and the Black Sea Region towardsbalanced economic and social development. In particular, the Bank’s strategy aims at:
• The facilitation of economic cooperation and acceleration of intra-regional integrationvia promotion of trade and investment activities between and among the member coun-tries.
• The mobilisation of resources within the region and improvement of its access to foreigninvestment and capital markets.
• The development of private enterprise sector, including SME promotion.
The single objective of the Bank’s energy sector operational strategy is to facilitate the devel-opment of a regional energy market. The strategy is inclusive and in its implementation willbuild on the common interests of the member countries.
The objective can be achieved through carefully selected investments in financially viable pro-jects in the following broad categories:
• Niche energy production opportunities both in oil and gas production (not exploration)and electricity generation;
• Energy transportation infrastructure projects such as oil and gas pipelines and the asso-ciated equipment and high voltage electricity transmission lines;
• Local sustainable development oriented projects, which incorporate the revenues andcosts of the social and environmental impact of the project into the financial appraisal.
This strategic objective reflects the common concerns of the member countries:
• Diversification of supply;• Interconnection and security of supply;• Increased energy efficiency and development of environmentally friendly technologies.
As well as the current trends in the global energy market:
• Consolidation and emergence of local niche players;• Development of international energy markets through market liberalisation and infras-
tructure development;• Growing concern with the efficient and environmentally sensitive production, transport
and consumption of energy.
Energy efficiency is a key element in every member country’s energy strategy. Renewablesources of energy already play a significant part in the electricity generating capacity of many
50
xxii. http://www.bstdb.gr

of the member countries. On the whole this is in the form of hydroelectric schemes, but othernew technologies such as solar and wind energy are also being put into operation.
Energy efficiency and renewable energy are complimentary; energy efficiency deals withdemand management, renewables with supply. Together they offer the opportunity to makesubstantial improvements to both the competitiveness of regional industry (through reducedenergy consumption) and the environmental problems associated with hydrocarbon basedelectricity generation.
The Bank will support energy efficiency projects from its energy investment allocation.Renewable energy projects that have a local development benefit, or where there is a widelyapplicable knowledge transfer benefit will also qualify for support.
5.11 Funding Mechanisms in the European UnionThere is a multitude of funding opportunitiesxxiii for businesses, offered within the frameworkof different Community policies - for example, Community programmes in the fields ofresearch and technological development, training or Community schemes supporting thesetting up of joint ventures. Community funding usually takes the form of grants, loans orguarantees. More recent Community initiatives aim at developing the European venture cap-ital markets, where support can take the form of equity or quasi-equity.
These funding instruments are directed to the support of SMEs, in facing obstacles related toaccess to finance and therefore can be viewed as supportive mechanisms for enhancing jobcreation and establish a more favourable financial environment in a European level, ratherthan stimulating a specific market or technological sector i.e. renewables.
A special focus is put on stimulating the development of EU risk capital markets, and thisremains one of the European Commission’s priorities for 2000 and beyond. The EuropeanInvestment Bank (EIB) and the European Investment Fund (EIF) support some of theCommunity activities in this field.
The Commission is facilitating the financing of innovative enterprises through an investoridentification and guidance service, Gate2Growth. The service is operated by a team of invest-ment analysts with venture capital or entrepreneurial background, and it has an onlinedatabase of investment opportunities. Since its start in March 2002, 1300 entrepreneurs and 60active investors have registered to the database. The initial experiences in terms of the valueadded the service brings to entrepreneurs’ investment readiness have been positive.
The Gate2Growth.com website functions also as a single access point and an operational plat-form to thematic networks of early stage venture capital investors, incubator managers, man-agers of industrial liaison offices at universities and research institutes and providers ofentrepreneurship training. This makes it easier for innovative entrepreneurs to identify themost appropriate support available locally. Gate2Growth will also establish partnerships withlocal operators of business plan contests, business angel networks, and investment forums.
51
xxiii. Further information for EU funding opportunities for businesses in:http://europa.eu.int/comm/enterprise/funding/index.htm &http://www.cordis.lu/finance/home.html

5.11.1 Business Angels
Informal Investors or “Business Angels” are wealthy individuals who are prepared to usetheir financial resources to make risk investments based on their experience and interests.They may often be retired senior executives of major enterprises, or people who have soldtheir companies and now wish to use the money. Their motivations are many and they mayinvest alone or in small groups.
Typically, Informal Investors or “Business Angels” tend to invest locally and in business sec-tors in which they have some experience. In general, they apply less restricted investment cri-teria and may have lower growth and IRR expectations than Venture Capital funds. Non-eco-nomic factors, however, like the personal fit with the entrepreneur, may be quite important.
The size of the investment is a major factor. Individually, their investments may be quite small(around 50,000 Euro initially) but in syndication, considerably larger sums may be available.If the company keeps growing rapidly, other sources may have to be sought for follow-onfinancing. Typically, they are good for investments below 250.000 Euro.
5.11.2 CREA (“Capital-Risque pour les Entreprises en Phase d’Amorcage”)
Under the CREA programme, which succeeded the European Seed Capital Fund Network(ESCFN), the Commission encourages seed-capital funds to finance businesses in the start upphase and SME business transfers.
CREA provides for a repayable loan for a maximum period of three years to cover up to 50%of the operating costs of the seed capital fund manager.
The funds must be new (set up since 1 October 1997 or currently being set up) and must havea minimum capital of Euro 4 million, of which 25% is fully paid up at the time of signing acontract with the Commission, with a maximum of 50% being of public sector origin.Currently the budgets have been exhausted and the scheme is closed for new applicants.
5.11.3 Eurotech Capital
EUROTECH CAPITAL is an initiative of the European Commission, which aims to stimulateprivate capital investment in trans-national high technology developments being undertakenby Small and Medium sized Enterprises (SMEs) through a network of European venture cap-italists. At present the Network is composed of 14 European venture capital funds specialisedin high technology sectors.
An eligible investment for the Eurotech Capital scheme is identified under certainTransnational Criteria; Projects derived from a Community or European R&D programme; orProjects having a research phase and an industrial application phase in two or more EU coun-tries; or Projects stemming from a company whose shareholders originate from at least twoEU countries.
Although most of the participating venture capital funds are by now fully invested, thenetwork of operators is still supported. No new members are admitted, however. Some par-ticipants have recently raised new funds, which have been taken up in the EuropeanCommission’s I-TEC Network of Venture Capital Operators.
52
5.11.4 Joint European Venture
The JEV initiative aims to support the creation of transnational joint ventures between SMEswithin the European Union. Through JEV, the European Commission provides a financialcontribution to cover part of the costs incurred in setting up a joint venture.
JEV is about creating new activities and new jobs, which can be sustained in the long term. Anetwork of Financial Intermediaries, specialised in investment finance (commercial banks,investment banks, venture capital funds), provides the link between the EuropeanCommission and the applicants.
The concept of a “joint venture” will be interpreted broadly, that is including any form of con-sortium, partnership or joint venture in the strict sense, which should lead to a new legalentity, of an industrial, service, commercial or craft nature.
The joint venture must be newly created by at least two SMEs from two different MemberStates and the maximum contribution per project shall be Euro 100,000. If one of the partnersowns more than 75% of the shared capital of the joint venture, the project will not be eligible.
5.11.5 The Technology Performance Financing
The Technology Performance Financing pilot project was launched in March 1991 by DGEnterprise/D of the European Commission and involved nine major European commercialbanks. Its objectives were to:
• Increase the involvement of commercial banks in technology financing by encouragingthem to experiment with Technology Performance Financing as a new product in theirportfolio;
• Enable the participating banks to share experience and good practices in financing tech-nology projects;
• Help innovative SMEs, in particular NTBFs, to make their first reference sales;• Promote the adoption of new technologies by SMEs.
The participating commercial banks agreed to test the extension of the technique of ThirdParty Financing, used widely in the energy sector, to other sectors and technologies. TheTechnology Performance Financing technique allows the financing of a new technology basedon its performance. The European Commission provided a partial guarantee to cover the tech-nology risk of the financier, as well as a contribution to the set-up costs of the system. Thefinancing of technology projects originated from the participating bank’s own resources.
Although the TPF pilot project and the Community support to the participating commercialbanks ended in 1997, most of the participating banks continue to finance technology projectsand have proven to be open to such opportunities. The intermediary Operator for Greece wasthe Agricultural Bank of Greece.
5.11.6 I-TEC
The I-TEC pilot project is an initiative to encourage early stage investments in technological-ly innovative SMEs. It was launched in July 1997. I-TEC is supported by the EuropeanCommission under its INNOVATION/SMEs Programme, and implemented in collaborationwith the European Investment Fund.
I-TEC aspires to help build, within Venture Capital operators, a lasting capability to appraise
53

and manage those early stage projects, in technologically innovative SMEs, which, in spite oftheir economic viability and inherent quality, would otherwise not be taken into account.
Innovative SMEs can access a network of 28 capable Venture Capital investors, interested inbusiness projects with a high degree of innovation in technology, product, service or processand which exhibit a potential for high growth and new job creation. The Venture Capital oper-ators who are taking part in the I-TEC pilot project have agreed to devote at least 25% of theirfunds to early stage investment in technologically innovative SMEs over the next three years.
The I-TEC contribution per selected Venture Capital operator is as follows: The EuropeanCommission can contribute up to 50% of the costs related to initial appraisal and hands-onmanagement. The total I-TEC contribution per Venture Capital fund will not exceed 5% of theinvestments effectively made, with a maximum of 500,000 Euro. The I-TEC contribution willbe made available only after actual investments have been made.
5.12 Risk Capital in Greece [3]
There is recognition of a risk capital gap in Greece. The Hellenic Organisation of SMEs EOM-MEX suggests that new establishments in all sectors looking for financing in the 150,000 to600,000 (GDR 50-150 million) range are particularly affected. On the other hand the propor-
tion of SMEs willing to use external risk capital is put at less than 1 percent. This would stillamount to 170-200 firms annually if firms with less than 10 employees were excluded com-pletely.
To relieve the pressure on the commercial banking system, the supply of risk capital in Greecehas been promoted through government action, with EU support, in sponsoring the settingup of four regional mutual guarantee companies, together with a counter-guarantee fund. Thegovernment is also intending to launch up to six venture capital companies to join the threeprivate-sector investors who include a bank subsidiary and a private fund management com-pany. The venture capital sector in Greece is newly developing. In early 2001, a project to cre-ate a New Technology Venture Fund was announced by the Ministry of National Economy.Raising awareness of venture funding and its appropriate uses among the SME population isconsidered a high priority. There were 45 investments in 1999 amounting to 71 million, andfirst half 2000 figures suggest a healthy increase. Nearly all investment was in start-up andexpansion stages.
The level of subsidy announced in the mutual guarantee and public venture system suggestthat there may be a significant lack of transparency and competitiveness within the GreekSME finance market. Loan guarantee schemes may run into difficulties in such situations. Inthese circumstances, it does not seem appropriate to consider an equity guarantee scheme,which a fortiori needs to be positioned within a well functioning market.
54

NEW FINANCIAL MODELS FOR RE INVESTMENTS
6.1 Introduction
Financing the investments of renewable energy systems remains a major concern. It willimprove as costs fall and RET become more competitive because many investors are willingand anxious to enter the energy sector. They are helped by new financial instruments that useprivate-sector banks to create green investment funds with lower interest rates in commer-cially viable technologies. Third-party financing has the potential to be an important instru-ment but energy service companies (ESCOs) have had problems raising capital, given the riskperceived for the projects.
Different types of financing measures have been developed and applied throughout the EUin the past. These range from traditional subsidy schemes to reduce the initial investmentcosts (grants), through tax relief and exemptions to more innovative schemes such as ThirdParty Financing and Energy Performance Contracting.
It is the time for the RE industry to consider project financing, rather than conventional fina-ncing. The principle behind the project as opposed to conventional lending is that the bankstake the project risk and rely on the success of the venture they are financing to repay the bor-rowings.
The renewable energy industry, including independent producers, argues that for the mostpart they do not have the same advantageous terms to borrow from the financial markets, asutilities do. This can be helped by funds as described in the present chapter, but they can alsobe helped by getting the utilities to invest.
Financing also improves if companies can be assured a long-term market for their production,for example, through improvements in the policy framework to ensure fair access to grids andto set the structure for pricing.
CHAPTER 6
55

6.2 The ESCO Concept - Third Party Financing [16]
An Energy Service Company (ESCO) is a company engaged in developing, installing, andfinancing comprehensive, performance-based projects, typically 7 to 15 years in duration, cen-tred around energy production or/and improving the energy efficiency of facilities owned oroperated by customers.
ESCOs are project developers responsible for an unusually wide spectrum of tasks: they iden-tify, design, and finance the project; install and maintain all or most of the equipmentinvolved; measure and monitor the project’s energy performance; and assume the risk that theproject will save or produce the amount of energy guaranteed. Like most developers, ESCOsdistinguish working capital from project financing.
The fundamental feature common to all ESCO projects is the requirement that the customerdoes not make any cash payments except from realised savings or purchase of energy. Inorder to meet this requirement, the ESCO assumes all performance risks associated withdeveloping, financing, implementing, and operating the project. This means that the ESCO:
a) Provides all working capital to develop the project; b) Provides or arranges construction financing, including interest during construction; c) Provides or arranges long-term financing so that the annual repayment obligation is less
than the project’s annual realised savings;d) Absorbs financial loss if the project’s ongoing debt-service and operating costs exceed
realised savings.
Regardless of how a project is structured and financed, the ESCO typically receives the fol-lowing forms of compensation:
• Progress payments during the construction phase for its costs to develop, design, pur-chase, and install the efficiency measures, plus a mark-up for marketing, general andadministrative costs, and profit (referred to as the implementation price).
• Savings payments after construction for its ongoing monitoring, maintenance, and man-agement costs, plus a charge for the performance risk assumed.
Another important aspect of the ESCO is the flexibility to package its services in a variety ofways such as:
• Full Service Package. The company is responsible for the whole life cycle of the energyinvestment project including financing (design, plans, materials, labour, commission-ing, performance measurement and monitoring).
• No Financing and No Equipment Maintenance. The utility secures the financing andmaintains the equipment while the ESCO provides the remaining services. In thisscheme ESCO can act as an investment consultant to the utility taking advantage of spe-cial agreements with banks (e.g. green fund option).
• Standard engineering and/or consulting services.
• Projects are performance contracting (EPC), when the ESCO’s compensation and oftenthe projects’ financing are meaningfully tied to the amount of energy actually saved.Projects are said to be comprehensive when the ESCO seeks to achieve energy savingsfrom the widest possible array of cost-effective measures in a given facility. ESCOs aretherefore distinguished from specialised purveyors of single-measure installationsoffering no performance guarantees and usually disregarding the potential for savingsunrelated to the equipment in which they specialise.
56

The main financial instrument of an ESCO is Third Party Financing (TPF). The repayment ofinvestments is conditional upon and proportional to the return. The model is based on a con-tract whereby the private company or public institution enlists the services of the ESCO,which assumes responsibility for all phases of investments designed to increase energy effi-ciency. Depending on the nature of the project, the total cost is reimbursed in two ways: a) inproportion to the energy savings achieved for an energy efficiency project b) by selling theenergy to the utility subject to an energy contract.
Figure 6.1Financing Models structured around Third Party Financing Concept[6]
Finding finance for the project is essential part of the ESCO business. Two basic financingmodels are commonly employed, as shown in Figure 6.1. Model 1 is typical for a “shared sav-ings” EPC, under which the customer has no obligation to repay the Implementation cost butinstead commits to pay a percentage of the realised savings over a specified period of time.Model 2 is typical for a “guaranteed savings” EPC, under which the customer assumes theobligation to repay the Implementation cost to a third-party financier (commercial bank orleasing company). The ESCO guarantees to the customer that the project’s realised savingswill equal the payments made by the customer over the term of financing.
6.3 Energy Performance ContractingAn ESCO carries out a contracting method - called “energy savings performance contracting”,
57

which allows public or private sector companies to undergo energy conservation/productionprojects without having to pay capital expenditure monies.
Under this contracting method, companies contract with an ESCO that pays all up-front pro-ject-related costs, which include installing, operating, and maintaining energy-efficient sy-stems. The company pays back the ESCO over a period of time, usually 10 to 15 years. The im-mediate cost savings with a lower energy expense usually cover payback costs, includinginterest.
In the framework described above, financing is arranged so that the energy savings or energyproduction covers the cost of ESCO services and the cost of the energy equipment. The repay-ment options are negotiable and include the following: a “shared savings” agreement inwhich the ESCO will take a fixed percentage of the energy savings for a predetermined lengthof time; a “fast payout” agreement in which the company receives all the energy savings untileither the end of a specified time period, or the cost of the project is paid off; “energy pur-chase” agreement in which the utility pays a flat fee each month for the energy needs coveredin the contract; “chauffage” where the customer pays the ESCO a fee equivalent to energy billsprior to the project, less a discount of 5 to 10 percent, with the ESCO paying the energy billsover the life of the agreement.
6.3.1 Guaranteed Savings [16]
In a project structured around guaranteed savings, the customer makes periodic debt servicepayments (typically fixed amounts) to amortise the implementation price paid to the ESCOfor developing, designing, and installing the efficiency measures.
In these projects, the customer assumes the obligation to repay the implementation price to athird-party financier. Usually introduced by the ESCO, this third party is very often a com-mercial bank or leasing company. If the customer finances the project itself, of course, thecustomer “repays” itself by saving energy costs. Where performance-based Demand SideManagement funds are provided by the customer’s utility company, repayment is typicallymade to the ESCO, which commonly finances some or all of the project.
The ESCO guarantees to the customer that the project’s realised savings will equal the pay-ments made (or financing costs absorbed) by the customer over the term of financing. Thesepayments may also include operating and maintenance costs charged by the ESCO for ongo-ing service. If the savings realised fall short of the payments made by the customer, the ESCOpays the customer the difference.
If, however, actual savings exceed the payments, the customer usually must agree to sharewith the ESCO the savings in excess of the amount guaranteed (which equals the amount ofpayments owed by the customer). The size of this share and the method of calculating it varywidely, depending on the degree of risk assumed and the extent of services provided by theESCO.
It is important to note that in the typical guaranteed savings project, the ESCO has no con-tractual relationship with the bank or leasing company likely to be financing the project. TheESCO’s guarantee runs only to the benefit of the customer. In legal terms, this guarantee is nota guarantee of payment for the bank’s benefit; rather, it is a guarantee of performance for thecustomer’s benefit alone - a promise that the efficiency project as designed and installed willpay for itself over the life of the loan assumed to finance it. The customer’s remedy for a
58

breach of that promise is the ESCO’s payment of any shortfall caused by a failure of the pro-ject to perform as guaranteed.
This is why ESCOs and customers who use the guaranteed savings structure stipulate a spe-cific level of minimum savings guaranteed for each project, generally tied to the project’s debt-service requirements and any other incremental operating costs incurred by the customer asa result of the project. As a consequence, the bank or leasing company approaches the project(in fact, the customer) as it would a commercial loan to that customer, confining its risk analy-sis to the customer’s general credit standing. The customer, in turn, must have confidence inthe ESCO’s ability to deliver and guarantee a project that will pay for itself. The customer willalso scrutinize the ESCO’s ability to make good on its guarantee, in the event that the projectdoes not perform as designed, and to that extent, the customer generally examines the ESCO’scredit standing. However, the principal issues between ESCO and customer remain those thatdirectly concern the project—its design, its cost, and its ability to deliver the requisite energysavings.
The primary impediment of the guaranteed savings structure to the ESCO is that it requiresthe customer to incur a liability and rely solely on the ESCO savings guarantee for repaymentof the liability. This can make it very difficult to sell guaranteed savings projects to somecustomers.
6.3.2 The Guaranteed Solar Results (GSR) Concept [12]
A very promising area for the development of the “guaranteed savings” contracts in Greeceis the case of solar-thermal applications. Greece with 2,961,000 m2 solar collectors is theEuropean Union’s second market in solar collectors after Germany. The Greek domestic mar-ket is presently (2000) 180,000 m2 per year and 95% of the installed solar thermal systems inGreece consist of glazed collectors used in individual or public water heating applications.
The concept of Guaranteed Solar Results (GSR) applied to hot water production, means thata solar system is expected to supply a minimum quantity of energy each year for a given hotwater consumption. If the energy supplied is less than the energy guaranteed, the technicalpool that has signed the contract should compensate their client. The compensation is estab-lished in relationship to the difference between the guaranteed energy supply and the amountthat was really used for heating water during the period of the contract. The GSR contractoffers four essential advantages:
• No financial risks – The client or energy user is guaranteed a certain annual energy sup-ply. Consequently, the investment payback time is also guaranteed.
• Easy bank loans – The absence of financial risk makes it easier to borrow the moneyneeded for the investment.
• No breakdown worries – The working order of the system is permanently monitored inorder to signal any anomaly in the working order. In the case of a system failure, repairsare carried out quickly by the technical pool in order to avoid compensating the client.
• Preferential funding – Subventions for collective solar installations are generally linkedto guaranteed performance.
The Guaranteed Solar Results concept takes on a different form in Greece in order to guaran-tee solar results. The concept devised is that of “Third Party Financing”. The innovative aspectof this concept is that besides the user and the manufacturer of the solar system, a third partyis introduced which, in practice, is an “Energy Service Company”. The role of the ESCO is to:
59
finance the solar system; supply the technical expertise; monitor the working order andresults of the solar system; ensure system maintenance.
The user pays the ESCO an amount that is directly related to the amount of energy suppliedby the solar system. Once the financial investment of the Energy Service Company has beenreturned, the user becomes the sole owner of the installation.
In this way, the energy user can exploit a solar system without an initial investment or riskand the energy service company has the incentive to maintain the equipment until the returnon the capital investment (with interest) is achieved.
6.3.3 Shared Savings [16]
Under a shared savings structure, the customer has no obligation to repay the ImplementationPrice through a debt or lease payment but instead commits to pay a percentage of the realisedsavings over a specified period of time. Here, the ESCO finances the project’s ImplementationPrice, usually by borrowing the money from one or more third parties and collateralising theloan with the anticipated savings payments from the customer. The customer assumes nofinancial obligation other than to pay the ESCO a share of the savings that the project realis-es. Thus the ESCO not only assumes project performance risk but also assumes customer cred-it risk by borrowing the money for project financing itself.
In exchange for the ESCO providing project financing and for the ESCO’s assumption of per-formance and credit risk, the customer agrees for a fixed term to pay the ESCO the value of aset percentage of those savings, which varies widely depending on several factors: (1) thelength of the project; (2) the customer’s creditworthiness; (3) the degree of technical riskinvolved (i.e., the certainty that savings will accrue as projected); (4) the relative expense ofmaintaining project equipment and monitoring energy savings; and (5) the value of utilityincentives to be contributed by the customer’s utility. The portion of savings paid to the ESCOthat is attributed to debt service is always higher for shared savings than for guaranteed sav-ings projects, reflecting the ESCO’s significantly greater risk and expense. The ESCO uses itspayments from the customer to repay debt associated with the project, conduct equipmentmaintenance, measure and monitor savings, and earn a return. As with guaranteed savingsprojects, the ESCO measures energy savings throughout the term of the project agreement,typically 10 years or more.
The method used to share savings varies from project to project. The parties may share grosssavings—savings without regard to ongoing costs—or net savings, the pool of which wouldbe divided only after accounting for certain costs of implementation. A subcategory of theshared savings structure is pay-from-savings. In this structure, the customer again assumesthe obligation to repay debt used to finance the project, but the financing agreement is struc-tured somewhat differently.
Unlike a typical guaranteed savings project, the customer is not obliged to repay the loan overa fixed term. Instead, the obligation is amortised as savings accrue and remains out-standinguntil enough savings accrue to fully repay it. The customer pays down its obligation in vari-able amounts that change each payment period, calculated as a percentage of actual savings asthey occur. Accordingly, the term of the project agreement varies also, expiring only when theproject loan is fully paid. Interest rates applied to pay-from-savings projects are high, in therange of rates for unsecured bank loans. Project agreements tend to be shorter (usually sevenyears or less), and the savings share on which payments are based is comparatively high.
60

6.4 Financing the RE Sector: Financial MarketThe RE sector has in theory access to most generally available financing mechanisms fromcommercial banks and the investment sector - in an ideal world this might be sufficient.However, the sector has particular need for innovation in accessing finance geared to itsneeds. The sector also has a particular demand for certain types of finance, which may be lessfrequently available or present special problems. The sector is supported by a number of spe-cialist institutions providing finance and a number of specialist funds and investment vehi-cles have been set up.
The financial market is the most significant source of external finance to RE companies, andcan exert considerable influence on them:
• Influence management through lending arrangements.• Supporting companies with information. Financial institutions are a major source of
information for companies, and there is potential for financial institutions to act as aconduit of information.
• Specialist “Green Energy” Financial Services. There is scope for banks to develop finan-cial products, which contribute to the environment, e.g. energy efficiency loans, or leas-ing of RE technology.
• Specialist support for RE Companies. RE sector can face difficulty-getting recognitionfrom the financial markets, because they are new, the risks are unknown, the technolo-gy unfamiliar and the markets uncertain. By actively trying to understand the sector andthe issues it faces, financial institutions can at least try to reduce some of the obstaclesthese emerging businesses face, although one cannot expect them to forgo normal finan-cial judgement.
6.4.1 Bank Sector
Credit Risk Assessment
The basic risk assessment conducted by most banks focuses largely on risks presented by cur-rent and future direct liability. However, the environment creates other risks in lending activ-ities - for instance, suppliers who fail to take account of the environmental pressures fromcustomers could lose key business. As well as purely financial risks, by becoming involved incontroversial projects banks can expose themselves to a negative reputation. A key lever hereis likely to be providing information on RET developments and business implications to thefinancial community.
An excellent example of an innovative RE project financing is the TRIODOS Bankxxiv “nonresource finance” dedicated to small-scale wind power development. This mechanism lacksof resource to any traditional security for the finance provider in the event of project failure.A systematic four-pronged approach to credit risk management is applied:
1. Thoroughly evaluating the risk through a process of due diligence;2. Controlling the risk through fixed cost and, ideally, turn-key construction contracts and
long-term power purchase contracts;
61
xxiv. http://www.triodos.co.uk/ & http://www.windfund.co.uk

3. Creating an element of security through debentures over assets and undertakings, firstcharges over site leaseholds and issued share capital, and a debt service;
4. Maintaining the commitment of the project owners to the project’s success through aminimum equity stake of at least 20% of the total project cost.
Develop “Green” Business Products
As well as “green” consumer products, banks could develop products for the business com-munity (both large and small) that would offer environmental benefits and could presentbusiness opportunities. A noteworthy example is the RE lending initiative by NationalWestminster Bank, available for lending to environmental projects by businesses. The loansare cheaper than normal, which is partly justified by the profitability improvement that theyare intended to bring, and are targeted at the medium sized business market.
Right Issues & Bond Issues
Once listed environmental sector companies can access the whole range of financing optionssuch as rights issues (the issuing of new shares) and the raising of bonds. Again, companieswill be vulnerable to the overall perception and understanding of the sector. For exampleWaste Recycling Group in the U.K. sought money from shareholders to expand its activities.
Investment & Financial Advisory Boutiques
Several small financial boutiques have emerged in recent years that aim to help RE sectorcompanies access finance, both from publicly known sources and from private sources suchas high net worth individuals. Typical examples include venture capital/ investment adviso-ry work; project finance for renewable energy companies; traditional environmental sectoranalysis and investment advice and corporate strategy and finance. Such companies canprovide a valuable function by combining a detailed knowledge of the sector together withpractical financing expertise, and helping RE sector companies address some of the obstaclesfaced. Typical examples are: Delphi International /VTZ (venture capital/investment adviso-ry work); Impax Capital (project finance for RES), Ecofin (traditional environmental sectoranalysis and investment advice) etc.
Ecological - Ethical Banks
A number of ecological or ethical banks exist in the EU and Switzerland. These banks are typi-cally very small (although growing) and they focus on providing lending for “good” projec-ts, which results in a major interest in small projects and business in the environmental sec-tor, where they can be a significant force. They have also been behind the formation of a num-ber of the environmental funds. Typical examples are Triodos Bank of the Netherlands,Belgium and U.K. and the Ecology Building Society in the U.K.
RE & Environmental Sector Funds
Dedicated RE and/or environmental sector funds fall into two categories: Those investinglargely or solely in listed investments and those investing in unlisted ventures or projects.Listed funds were the first to be launched and have been the most prominent.
62

Buying listed RE company shares on the market does not channel any new money into the REservices sector. The money goes into shares, which have already been placed on to the mar-ket. Funds can contribute to RE investment by investing in companies at the initial publicoffering (IPO) stage, or subscribing to rights issues, investing in venture capital or byinvesting in specific projects. Otherwise, buying these equities supports the market valuationof such companies, thereby encouraging more companies to be bought to the market andhighlighting investor interest in the sector.
More recently, the attention has shifted to unlisted funds. These funds focus on providingnew money to projects and ventures within the environmental sector. They can make a posi-tive contribution to sustainable development, by channelling funds to key areas. The mostprominent example is the “green” fund launched in the Netherlands. These funds havefocused on providing debt for environmental projects, and have been made especially attrac-tive with the provision of tax concessions to investors. The other area where there is currentactivity is in the emerging markets where development banks are keen on developing tar-geted investment vehicles with a sustainable development emphasis.
As well as providing capital, such funds can help overcome some of the obstacles encounteredby emerging RE industries, by building up industry knowledge and providing financialexpertise.
6.4.2 The Investment Sector
Most investors who seek to invest in “green” companies do so through some form of collec-tive investment fund. Just as there is a range of different types of “green” companies, there isa range of environmental funds. Over the past 30 years, these funds have grown increasinglysophisticated, having evolved from simple “green” filters avoiding the worst offenders, tomore sophisticated approaches aiming to link environmental performance to financial per-formance. The key types of funds are the following two:
“Ethical” Managed Funds
Ethical funds avoid investing in companies who are involved in certain activities. As manyfunds have their roots in religious communities, their guidelines reflect Christian ethics:avoiding tobacco, alcohol, armaments, gambling and repressive regimes. Environmental con-cerns have recently been included, usually by using the environmental impact definition, andexcluding the worst offenders.
While many of the funds claim a positive focus, seeking out “good” investments, it is not clearhow many of them have effectively implemented this side of their investment policy.
“Green” Managed Funds
As understanding of environmental issues grew, it became apparent that a more sophisticatedapproach was needed. A new generation of funds emerged, which typically gave environ-mental issues a much higher priority (although they normally retained some form of ethicalscreening). The funds developed a sophisticated understanding of the impact of environmen-tal issues on business, and then analysed the environmental performance of companies indetail before making a decision as to whether to invest. In addition, the analysis aimed toidentify links to financial performance. The funds have tended to seek out suitable positive
63

investments in the environmental sector, particularly among the “green” pioneers and partic-ularly in this area the detailed knowledge of environmental issues was able to add value tothe financial analysis.
Another new type of “green” fund is the Environmental Values Fund, which focuses on theconcept of eco-efficiency. The fund’s ability to invest in all sectors has attracted considerableinstitutional interest (conversely, it makes it less appealing to individual investors).
6.5 Energy TaxationThe European Commission has adopted a proposal for a Council Directive restructuring theCommunity framework for the taxation of energy products (COM (97) 30, OJ C139, 6.5.1997),which widens the scope of the existing minimum tax rates to cover all forms of energy. The pro-posals are aimed at eliminating distortions within the EU single market caused by differencesin the taxation systems between Member States, and are intended to shift general taxation awayfrom taxing employment and towards a system based on environmental criteria.
The EU’s Council of Ministers has been debating for some years the Commission’s 1997 pro-posal for a Community framework, including minimum tax levels, for the taxation of all com-peting sources of energy. The proposal was aimed at improving the functioning of the InternalMarket and ensuring greater respect for the environment, while at the same time combatingunemployment by allowing Member States to compensate increased revenues from energytaxation by lower taxation of labour.
Discussions on the proposal have been taking place since in the Council. The SpanishPresidency in the first half of 2002 drew up guidelines providing a clear direction for furtherwork on the basis of the Commission’s proposal (for further details see the Progress report onenergy taxation (document 10195/02) attached to the conclusions of the Seville EuropeanCouncil.
On November 5th 2002, the Council discussed some outstanding elements of the draft Directi-ve. On the basis of a Presidency text, the Council focused its debate on the possibility of settingnational levels below the new minimum levels of taxation, the arrangements for the use ofdiesel oil, the duration of transitional periods for electricity and other energy products thandiesel oil and the link between the exemptions and tax reductions laid down in the Directiveand state aid rules. The Council stated that work be continued on these outstanding issues witha view to achieving an agreement on the Directive in a forthcoming session of the Council.
6.6 Tradable Green Certificates [15]
Under direct price support schemes, generators of electricity from renewable energy sourcesreceive, directly or indirectly, on the basis of State regulation, financial support in the form ofa subsidy per kWh supplied and sold. At present there are essentially two categories of directprice support mechanisms within the EU: quota-based systems, and fixed-price systems.
Quota-based systems are based on setting the price through competition between RES-E gen-erators for available support following a decision by the Member State in question on thedesired level of RES-E. Two different mechanisms presently operate: the green certificate andtendering schemes.
64

The main objective of a system of tradable green certificates is to stimulate the penetration ofgreen electricity into the energy market. In a green certification system, certification servestwo purposes. It functions as an accounting system to verify whether demand has been metor, when there is no demand, to measure the amount of electricity produced from RES.
In a system of green certificates, producers of renewable electricity receive a certificate foreach pre-defined unit of electricity produced. Such a certificate represents the “societal value”of the production of electricity from RES. By issuing green certificates two different marketsare created for producers of renewable electricity: the market of physical amounts, on whichthey have to compete like any other energy producer, and the market of green certificates.Demand for green certificates can originate for several sources:
➱ Voluntary demand of consumers e.g. by green pricing.➱ Imposed by the government on consumers or other market actors in the energy supply
chain via an obligation to generate, transmit, deliver or buy a certain amount of greencertificates.
➱ The government itself can act as a buyer of green certificates e.g. by securing a minimumprice or by a tendering procedure.
In practice green certificates market development might occur as a combination of the above-mentioned sources. However, demand as a result of an obligation should be in most cases agood starting point.
Six different functions can be identified in the implementation of a green certificates system:a) Issuing certificates, b) Verification of the issuing process, c) Registration of certificates andtrade, d) Exchange market, e) Accounting of the certificates, f) Withdrawing of certificatesfrom circulation. Apart from these institutional functions, there are many other issues thathave to be addressed in order to make a system of tradable green certificates work properly.The most important of them are: the definition of renewables used, b) the time aspects of theobligation, c) the penalty for not reaching the target and the parties that should be obligated.
6.7 The Clean Development Mechanism (CDM) Approach [17]
Although CDM may be considered as a policy driver rather than a financial instrument, itsrational application as a methodological procedure for the appraisal of energy investmentprojects (e.g. from FIS) may favour the development of RE systems.
The Kyoto Protocol to the United Nations Framework Convention on Climate Change(FCCC), ratified by the EU (Council Decision 2002/358/EC, OJ L130, 15.5.2002), established aClean Development Mechanism (CDM) to assist developed, Annex I countries in meetingtheir binding greenhouse gas (GHG) emissions reduction commitments by financing emis-sion-reduction projects in less developed, non-Annex I countries. This mechanism posesmany challenges, among them: 1) ensuring the additionality of CDM projects; 2) promotingsustainable development in host countries; and 3) monitoring and verifying claimed emissionreductions.
CDM projects must involve activities that reduce GHG emission relative to emissions thatwould have happened otherwise. Such reductions must be additional to any that might haveoccurred anyway because of changes at the project’s chosen site or within the economy atlarge. This additionality requirement will need to be translated into workable methodologies
65

for crediting CDM projects that are acceptable to the many parties with a stake in the process.Specifically, such methodologies will need to be:
➱ credible – to ensure that environmental objectives are satisfied,
➱ transparent – to ensure that assumptions are explicit and well-vetted, and
➱ practical – to ensure that undue transaction costs are not incurred.
A CDM project generates emission credits that grant the investing partner the transferableright to emit an amount of greenhouse gases equal to the project’s claimed reductions. Theseclaimed reductions are equal to the estimate of emissions that would occur in the absence ofthe certified project activity – established by applying a baseline methodology - minus theemissions of the project itself. If systematic bias or error in application of the baseline method-ology leads to claimed emissions reductions in excess of those that are truly additional, thenthe CDM project will lead to an increase in total global emissions.
The application of a baseline methodology can also err in the opposite direction, leading toinadequate crediting for emissions reductions and to a lowered economic incentive for CDMactivities. Therefore, it is important that methodologies for establishing baselines be crediblein order to assert, with sufficient confidence, that the CDM will produce credits that corre-spond to emission reductions achieved (e.g. the challenge of minimising “free-riders,” cred-itable low emission activities initiated even in the absence of a CDM program).
In the ongoing discussion of baseline methodologies, two general types of approaches haveattracted the most attention: project-specific approaches and benchmark approaches. Thesetwo general types of approaches can be distinguished in terms of the degree of standardisa-tion they imply: project-specific approaches are less standardised, and benchmark approach-es are more standardised. The CDM is still in an early stage of development, with many keypolicy questions related to modalities and governance still largely unanswered. Among them,one of the more challenging questions is how baselines will be established. Baselines willprovide the metric against which the tradable output of CDM projects, i.e., carbon credits, willbe measured.
66

CASE STUDIES
7.1 IntroductionDespite the generous grants and subsidies provided to RES investment projects by all earlierversions of the National Development Law (e.g. Laws 1262/82 and 1892/90), private invest-ment activity in renewables was minimal in Greece before 1995, mainly due to the lack of afavourable legal framework regulating the various aspects of RES development andexploitation in the country (role of public and private entities, jurisdictions and responsibili-ties, permitting procedures, buy-back tariffs for RES-produced electricity, etc.). Such legis-lation was finally enacted in 1994-95 (Law 2244/94 and Ministerial Decision 8295/95). Thislegislation created a coherent and quite liberal framework, which, in conjunction with theNational Development Law and the O.P.E. / Measure 3.2 (CSF II) financing mechanism,induced serious RES investment activity in Greece. Hundreds of permit applications for estab-lishing commercial-scale RES projects, primarily in wind, small hydro and biomass energy,have been submitted to the Ministry of Development in the last few years, taking advantageof the favourable legal and financial framework for RES investments.
After the activation of the Operational Programme for Energy (O.P.E.), Measure 3.2, in mid-1997, most investors interested in establishing RES projects opted for this particular financinginstrument, rather than for the National Development Law, because of O.P.E.’s several advan-tages over the latter (grant and subsidy) scheme. The specific advantages of Measure 3.2included:
• Higher-than-40% capital subsidies for most types of RES applications (NationalDevelopment Law : 40% capital subsidy for all types of RES applications);
• Lower own-capital requirement (20% of total investment cost for Measure 3.2 projectsvs. 40% for the projects funded by National Development Law);
• More relaxed installation permit requirement (unlike the National Development Law,the installation permit for Measure 3.2 approved projects was required only at the timeof signing of the capital grant contract, concluded between the State and the investor).
Private investments of 745,375 mill. Euro were approved by the Minister of Developmentbeginning of June 2002 in energy saving and RES in the frame of the first proclamation ofMeasure 2.1 of the Operational Programme «Competitiveness» (EPAN), CSF III, 2000-2006,
CHAPTER 7
67

that corresponds to 26% of the total budget of actions of the Energy Sector and NaturalResources. The approvals concern 201 investment proposals.
With the Ministerial Decision 110 proposals were included in the program that concernsInitial investments, that is to say investments eligible for regional aid of total budget of613,382 mill. Euro. The remaining 91 proposals, that were approved and concern environ-mental or joint investments, that is to say proposals, that come under the Communityframework of investments for the protection of environment, with a total budget of 131,933mill. Euro, will be included with a newer decision of the Minister within June.
The rate of subsidy of Initial investments will range from 30% up to 50% (depending on thetechnology), accordingly with the Energy Investments Guide (July 2001), while for environ-mental investments the rate of subsidy will result with the calculation, according to theSupplement of the Guide for Energy Investments. It should it is marked that in the frame offirst proclamation of the Operational Programme «Competitiveness» 390 proposals had beensubmitted of a total budget of 1.538,767 mill. Euro.
7.2 Case Study I - Guaranteed Solar Results (GSR)
7.2.1 ACHAIA CLAUSS Winery, Patras, Greece [12]
Achaia Clauss is a well-known wine producer and exporter. The factory of Achaia Clauss issituated in Patras, Greece. Its yearly production is approximately 70,000 bottles. A solarsystem is installed since 1993 on the roof of the bottling factory under a TPF contract. The aimof the solar installation was to reduce the diesel fuel consumption of the steam boiler, by usingthe solar thermal energy to pre-heat the water entering the boiler. The water exiting the boil-er is used in the industry’s bottling process as a cleaning medium.
The bottling factory works only day-shifts and rarely over the weekend. The required tem-perature of the hot water used on the factory floor is 45-60oC. The main components of thesolar system are :
• a solar field of 140 solar panels (140 x 2.2 = 308m2) facing southwards with a 450 tilt;• two horizontal storage tanks, 3m3 each;• a differential valve controller which regulates the closed-loop pump;• a re-circulation branch which pumps water from the solar storage tanks to the steam
boiler.
In the case of the Achaia Clauss winery, the manufacturer and main contractor of the solarsystem, SOLE S.A, is also the Energy Service Company (ESCO). CRES provided a subsidyamounting to 50% of the total cost of the system and is also responsible for telemonitoring.The remaining 50% of the cost was provided by SOLE S.A. The user only paid for the labourrequired installing the system on the factory roof. The energy user (Achaia Clauss), followingthe measurements made by a third party (CRES), paid the Energy Service Company (SOLES.A) for the energy supplied according to the following tariffs:
• 0.043 ECU/kWh during the first three years (1993-1996)• 0.040 ECU/kWh for the next three years (1996-1999). This price was approximately
equal to 70% of the diesel fuel used by the conventional burner (0.54 ECU/litre).
68

• After the investment was returned, with interest, the Achaia Clauss winery became theowner of the system. In order to insure both sides, two additional terms were includedin the TPF contract:
• The solar kWh price was adapted according to the monthly mean fuel price in order tokeep the ratio 70% constant.
• Achaia Clauss claimed that the minimum hot water demand of the factory was 50 m3 ofhot water at a mean temperature of 55oC. This hot water demand was a basic parame-ter in the sizing of the solar system. If the factory consumed less energy, then the systemoperated at a low efficiency. Therefore, in this case, the price of the energy supplied wasadjusted accordingly at a higher price, as shown by the linear relationship
• During the return on investment period the installation costs of the equipment as wellas the cost of maintenance work was charged to the energy user.
• The provision of spare parts was charged to the Energy Service Company.
Figure 7.1Funding mechanism for the Achaia Clauss Winery
7.2.2 Case study - Sarantis cosmetics, Oinofita, Greece [12]
Sarantis Ltd. is a cosmetics manufacturer who has installed a solar thermal system at his plantin Oinofita, Greece. In the summer the solar thermal system is used to cool the storage ware-house of the factory where the stock of manufactured cosmetics is kept and in the winter alsopre-heats the water used to heat the office spaces.
The solar installation consists of: flat - plate collectors (2700 m2), 3 conventional air-cooledchillers (200 RT) for auxiliary cooling, 2 cooling towers (500 RT) and 2 adsorption chillers (200RT). The solar collectors consist of 2700 m2 flat-plate collectors facing southwards at a tiltangle of 30o, with selective absorptivity of high performance, manufactured in Greece. Theabsorptive surface used is the most recent TiNOx technology, whereby a titanium oxide layeris deposited on the copper tubing of the collector with the “vapour deposition method”.
SOLE S.A. was the main contractor of the installation. The construction of the solar coolingsystem was partly funded by the European Commission, the Hellenic Government and theuser, according to the following arrangement (Table 7.2):
69

Table 7.2
Funding scheme for the SARANTIS solar cooling project
CRES was responsible for the follow up of the investment and for the monitoring of the solarthermal system. A GSR contract was drawn up to guarantee the performance of the solarsystem. Figure 7.2 shows the funding mechanism of the GSR contract.
According to a feasibility study carried out, the amount of solar energy that the installed solarsystem should guarantee the user was fixed (point E on Figure 7.2). The public subsidy givento the main contractor of the installation (SOLE S.A) by the European Commission and theHellenic Government would depend on the amount of energy supplied to the user as follows:
• If the energy supplied to the user was between 80 –100 % of the system guaranteed per-formance, then the contractor received 100% of the public subsidy (see line DE, Figure7.2).
• If the energy supplied to the user was between 60-80 % of the guaranteed system per-formance, then the contractor received 80-100% of the public subsidy, as derived fromthe linear relationship shown in Figure 7.2, line DC.
• If the energy supplied to the user was less than 60% of the guaranteed system perfor-mance, then the contractor received only 80% of the public subsidy, as well as losing hisletter of credit (10% of funding) see line CBA, Figure 7.2.
We note that the GSR mechanism displayed in Figure 7.2 is currently in operation for over 40large solar projects in Greece.
Figure 7.2
Public subsidy as a variable of the system performance
70

7.3 Case Study II - Bankable Wind Energy Investment
The case study concerns a 10,2 MW wind power project development by “ROKAS Wind S.A.”in Crete island (Xirolimni- Sitia, Crete). The wind farm consisted of 17 MK IV type wind tur-bines (600 kW each), manufactured by Bonus Energy A/S (Denmark). The construction of theWind Park started March 1997 and by March 1998 it has been connected to the electricity gridof the island of Crete.
Table 7.3Financing Scheme for ROKAS 10,2 MW Wind Farm in Xirolimni, Crete
71
The project site is located 13 km southeast of the city of Sitia, with 460 m average altitude fromsea-level and occupies a total of 22 he of rangeland. According to the preliminary measure-ments on the wind potential, the area is exhibiting excellent wind characteristics with a year-ly average wind velocity of 8,5 m/s (north-west direction). The average annual electricity pro-duction per wind turbine is 2 200 000 kWh and the average availability is between 99% and99,5%. The Wind Park was connected to the local electricity substation of the Municipality ofSitia, which is located 13 km away from the park. The connection was established through adouble transport line of Public Power Corporation and was financed by ROKAS company.
“Rokas Wind S.A.” structured the investment financing mechanism in a mixed base e.g. 40 %own capital; 40% as public subsidy according to the National Development Law 1892/90; theremaining 20% has been provided in terms of a long-term loan in Euro by BNP through theEuropean Investment Bank. Thus, the project exploited in full the financial opportunitiesarisen both in the national level (fiscal measures) and EU level (low interest loan from EIB).
72
CONCLUSIONS AND RECOMMENDATIONS
Financing the installation of renewable energy technologies remains a major concern. TheGovernment should try to ensure that environmental externalities are fully included in theoperating costs of energy companies, both private and public. All external costs or benefitsborne by state-owned energy companies should be made explicit for all market participantsthrough regulation or market-based policy instruments such as taxation of pollutant emis-sions of fuels. Ensuring that energy costs include the costs of reducing emissions of sulphurdioxide and particulate matter, or even CO2, will tend to encourage the use of cleaner liquidor gaseous fuels and will aid the Government’s efforts to speed the introduction of RE into theenergy mix. To help the market there are also several types of innovative marketing andfinancing schemes to promote the increased penetration of renewable energy technologies.
Renewable energy technologies tend to have higher capital costs and longer payback periodsthan conventional energy technologies, although overall rates of return may be higher.Capital markets traditionally favour projects with lower payback periods, which tie up cap-ital for a shorter period and are seen as lower risk. At the same time, conventional fuel pricesdo not reflect their full cost, due to the failure to include the additional external costs associ-ated with these fuels. Current fuel prices do not reflect the true social cost, while renewableenergies have a market price above their social cost.
A further obstacle is the relative unfamiliarity the Greek capital markets and investors havewith renewable technologies, which in part is due to the fact that they are often innovativeand may have yet to be proved commercially. This lack of knowledge translates into increaseduncertainty and places a higher risk premium on these investments for the capital markets.
An important factor in RE investments cost reduction, especially for wind electricity, is thescaling up of the technologies involved and the consequent reduction in unit construction,connection and operating costs. The capacity of newer, commercial type, wind turbinesinstalled can be as high as 1.5 MW, compared to 300 kW a decade ago. For wind energysystems, the development of variable-speed turbines is also important. In addition, the com-
CHAPTER 8
73

petitive bidding procedures initiated by some countries, whereby developers of similarrenewable energies compete on cost grounds amongst themselves, have helped, in certaincases, to push costs down for renewable electricity generation.
While the economic conditions all over EU in the eighties militated against ESCO (dramaticfall in energy prices, capital budgeting rules restricting third party financing etc.), five majorelements of this period may in fact be responsible for the current comeback of ESCO. Thesefive elements are:
1. Environmental degradation.2. Limits to growth in the energy supply industry.3. The quest for economic efficiency in the public sector.4. The deregulation and globalisation of energy market.5. Development of e-energy services.
The ESCO business is very sensitive to the prevailing market conditions regarding financialsettlements (regular payments) and financial credibility of the public sector. In this regard themost important legislative actions for establishing a favourable environment for the develop-ment of the Greek ESCO industry is: a) legal provision regarding the Third Party Financingconcept, b) compliance with the new Directive that mandates financial settlement betweensupplier and purchaser within 30 days.
Effective promotion of renewable electricity will be facilitated if it is examined in the contextof the whole electricity market. Market reforms in the electricity sector are influencing thepolicies used to promote renewable electricity. These new policies increasingly contain an ele-ment of intra-renewables competition. Possible means of using market mechanisms to pro-mote renewable electricity include:
• Ensuring that independent power producers and non-utilities have fair access to theelectricity grid;
• Allowing distributed generators to feed into and take from the grid;• Creating supply-side incentives, such as favourable buy-back rates, to make renewable
electricity generation economically attractive for potential generators;• Creating a market for renewable electricity by requiring a certain proportion of total
electricity to come from renewable sources;• Making demand-side incentives such as “green pricing” as widespread as possible.
A barrier can also take the form of a regulated or limited price increase, such as in Greece. Inthis situation the electricity provider is not allowed to reflect its supply costs in its tariffs,although the cost of supplying electricity to consumers not connected to the mainland elec-tricity grid is higher. The price charged for electricity in islands or other remote locations maytherefore be lower than its cost, with the supplier’s loss being recouped via cross-subsidisa-tion from electricity users in more densely populated areas.
Increased availability of finance at lower interest rates is indispensable in lowering the cost ofcapital-intensive technologies as RE. This can be achieved where financiers are willing to lendat lower interest rates to technologies they perceive as more developed and less risky, orthrough larger companies self-financing renewable electricity projects rather than borrowing.Clearly, financial institutions cannot be expected to send market signals on environmentalmatters unless they recognise it as being in their own interest, and thus realistically and prac-tically this goal may be difficult to achieve. However, as Europe’s financial markets general-ly operate on an efficient basis, changes need only be fairly marginal to have materially sig-nificant impacts.
74

The general RE policies that Greece has already introduced to promote renewable energy maybe finely tuned to overcome:
• Market barriers, such as lack of information;• Market distortions, especially the non-monetisation of the positive environmental ben-
efits of renewable energy;• Technical barriers, lack of market for and experience with a technology type; grid sat-
uration problems, etc.;• Cost barriers.
Table 8.1Generic Barriers to RE & Energy Efficiency Investments
and Measures to Overcome them
75

Fiscal incentives have been the most widely used measures to promote renewable invest-ments in Greece. It is these measures that have been most successful in promoting renewableenergy supply - irrespective of whether this has been done in a market-based manner or not.This is because large proportions of those who buy RET equipment are private firms or indi-viduals susceptible to economic arguments (i.e. independent renewable electricity producersare in the business of electricity generation to make a profit).
76

REFERENCES
1. Centre for Renewable Energy Sources (2002), Greece Renewable Energy Sources Statistics, FinalReport for IEA-Eurostat.
2. Vassilakos N., Karapanagiotis N.K. (2002), Greece, in “Handbook of Renewable Energies in theEuropean Union. Case studies of all Member States” Reiche D., (ed). Reter Lang GmbH,Frankfurt am Main, 123-139.
3. Bannock Consulting (2001), Innovative Instruments for raising equity for SMEs in Europe. Studycontract ETD/00/503116 prepared for EU DG Enterprise.
4. DELPHI INTERNATIONAL Ltd. (1997), The Role of Financial Institutions in AchievingSustainable Development, in association with ECOLOGIC Gmbh. For the EuropeanCommission.
5. ECN, Energie Noord West (1999), Green Certificates; Empowering the Market?!, ECN-ENW-99.
6. ESMAP (1999), Energy Service Companies Practitioners Workshop, Workshop Summary.
7. European Commission (1998), DRI: Europe in 2001 Economic Analysis and Forecasts, FinalReport.
8. European Commission (1998), European Energy to 2020.
9. European Commission (2000), Proposal for a Directive of the European Parliament and theCouncil on the Promotion of Electricity from Renewable Energy Sources in the InternalElectricity Market, CEC, 11-5-2000.
10. EUROSOLAR e.V. (1999), Financing Renewable Energies. Window for New Opportunities. IrmPontenagel ed., Eurosolar – Verlag.
11. IEA (1999), Renewable Energy Policy in IEA Countries, Vol. II Country Reports(http://iea.org.pub.htm)
12. Karagiorgas M., Botzios T. (1999), GSR Experience in Industrial Applications of Solar ThermalSystems in Greece, CRES paper for Solar Hot Water with Guaranteed results.
13. Ministry for Environment, Physical Planning & Public Works (1995), Climate Change : The GreekAction Plan.
14. OECD (1999), Performance Contracting, PUMA/PAC (99) 2.
15. Oeko-Institut, SPRU (1999), The Implications of Tradable Green Certificates for the Deploymentof Renewable Electricity, ECN-C-99-072.
16. The World Bank (1999), The Energy Service Industry, Energy Sector Unit. Occasional Paper No.12.
17. U.S. EPA (1999), Evaluation of Benchmarking as an Approach for Establishing CleanDevelopment Mechanism Baselines, Contract No. 68-W6-0055 Analysis of Issues Associated withJoint Implementation.
18. D. Agoris, K. Tigas, G. Giannakidis, F. Siakkis, S. Vassos, N. Vassilakos, V. Kilias, M.Damassiotis, An analysis of the Greek Energy System in view of the Kyoto commitments, EnergyPolicy, (under publication).
19. K. Tigas, V. Kilias, J. Kabouris, J. Vlahos, P. Nikolopoulos, Development of a GeographicalInformation System for the assesment of the economic potential of RES for electricity generation,Operational Programme for Energy-Measure 3.4.3., CRES final report 2002.
77

������������ ��� ��������������� ������������������������
���� ��!�"���#$���%&' ��!�"���#!���(((�)*+&,-.-/�0-1�23�)�1&4, 45.-6)*+&,-.-/�0-1�23

C.R.E.S.
Centre for Renewable Energy Sources (CRES)19th km Marathonos Ave., GR- 190 09 Pikermi, Attica, Greece
Tel: +30 210 660.3300, Fax: +30 210 660.3301-2, http://www.cres.gr