
Methane Pyrolysis for Hydrogen– Opportunities and Challenges
44
Methane Pyrolysis for Hydrogen– Opportunities and Challenges Hydrogen Shot Summit Thermal Conversion with Carbon Capture & Storage Marc von Keitz Program Director @ ARPA-E August 31, 2021
Transcript of Methane Pyrolysis for Hydrogen– Opportunities and Challenges
Methane Pyrolysis for Hydrogen–Opportunities and Challenges
Hydrogen Shot SummitThermal Conversion with Carbon Capture & Storage
Marc von KeitzProgram Director @ ARPA-E
August 31, 2021
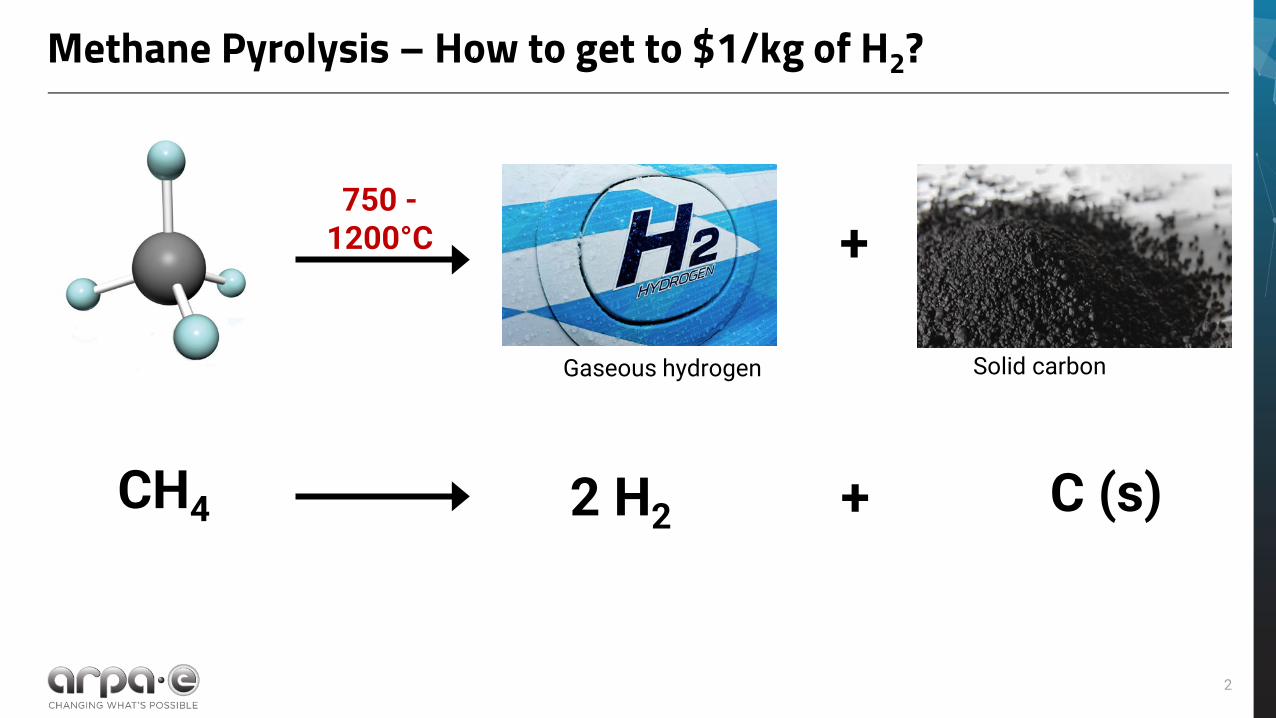
Methane Pyrolysis – How to get to $1/kg of H2?
2 H2 C (s)CH4
Gaseous hydrogen Solid carbon
+
+
750 -1200°C
2
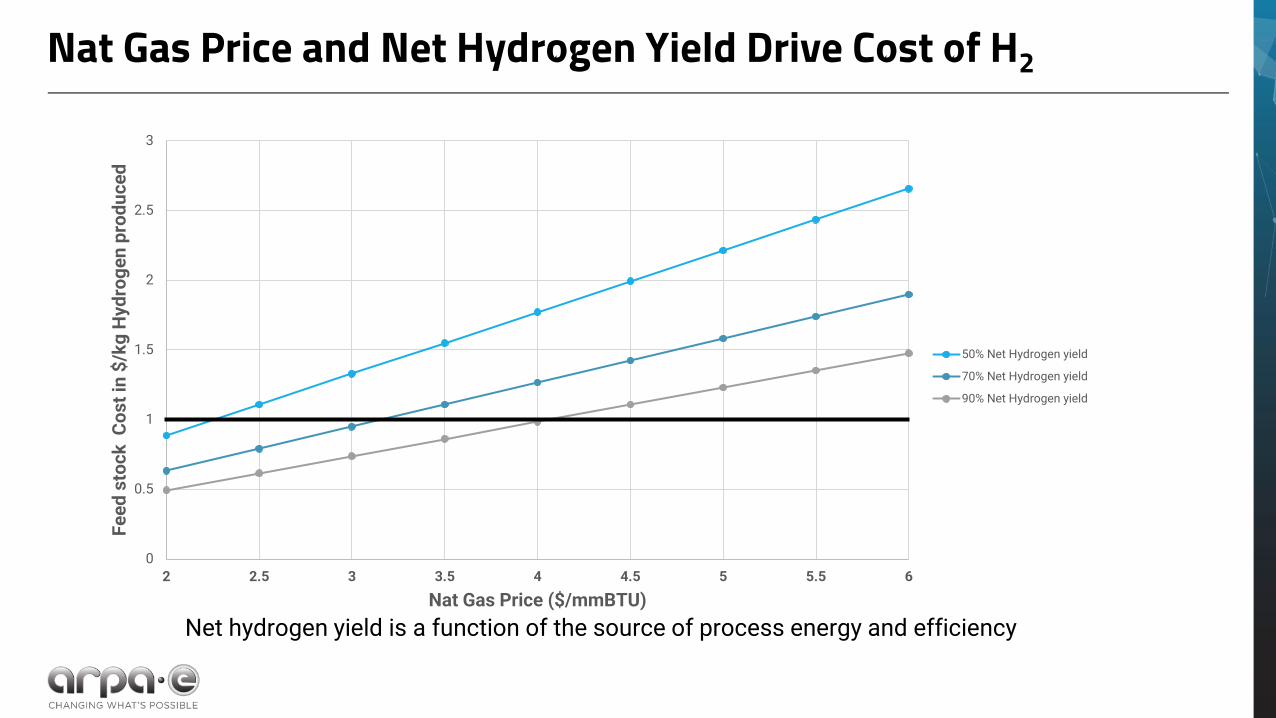
Nat Gas Price and Net Hydrogen Yield Drive Cost of H2
Net hydrogen yield is a function of the source of process energy and efficiency
0
0.5
1
1.5
2
2.5
3
2 2.5 3 3.5 4 4.5 5 5.5 6
Feed
sto
ck C
ost i
n $/
kg H
ydro
gen
prod
uced
Nat Gas Price ($/mmBTU)
50% Net Hydrogen yield
70% Net Hydrogen yield
90% Net Hydrogen yield
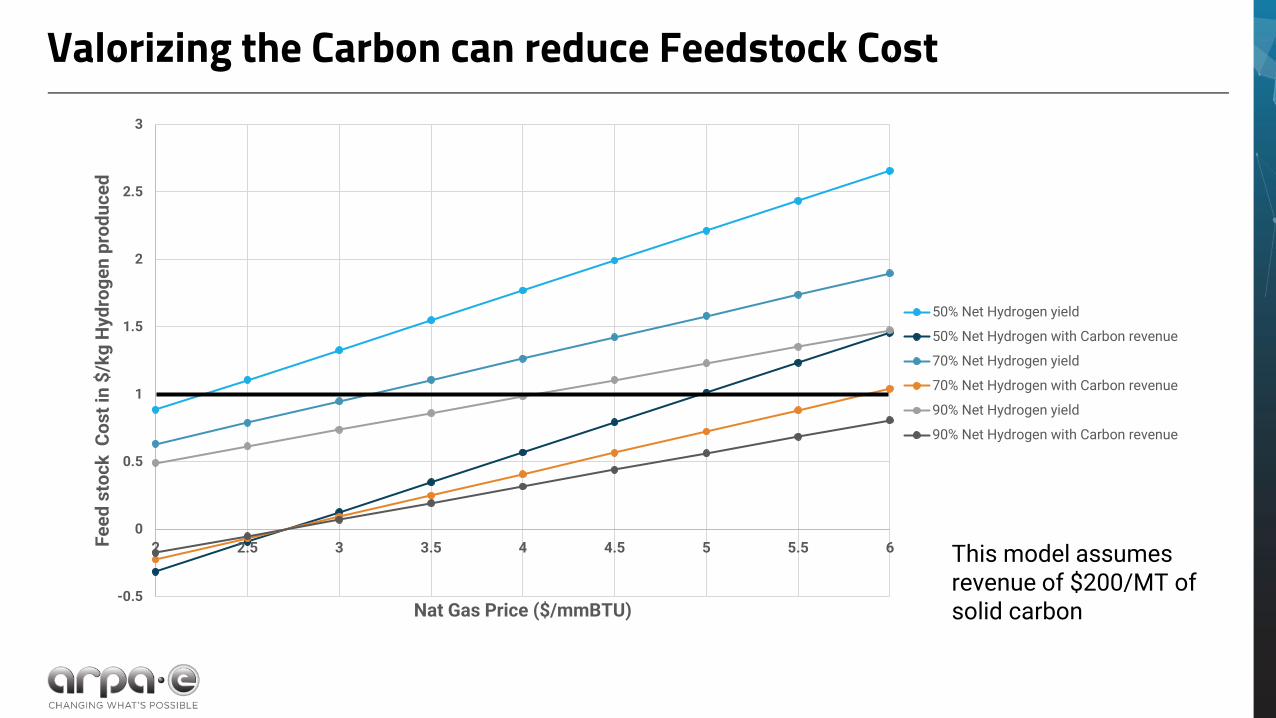
Valorizing the Carbon can reduce Feedstock Cost
-0.5
0
0.5
1
1.5
2
2.5
3
2 2.5 3 3.5 4 4.5 5 5.5 6Feed
sto
ck C
ost i
n $/
kg H
ydro
gen
prod
uced
Nat Gas Price ($/mmBTU)
50% Net Hydrogen yield
50% Net Hydrogen with Carbon revenue
70% Net Hydrogen yield
70% Net Hydrogen with Carbon revenue
90% Net Hydrogen yield
90% Net Hydrogen with Carbon revenue
This model assumes revenue of $200/MT of solid carbon
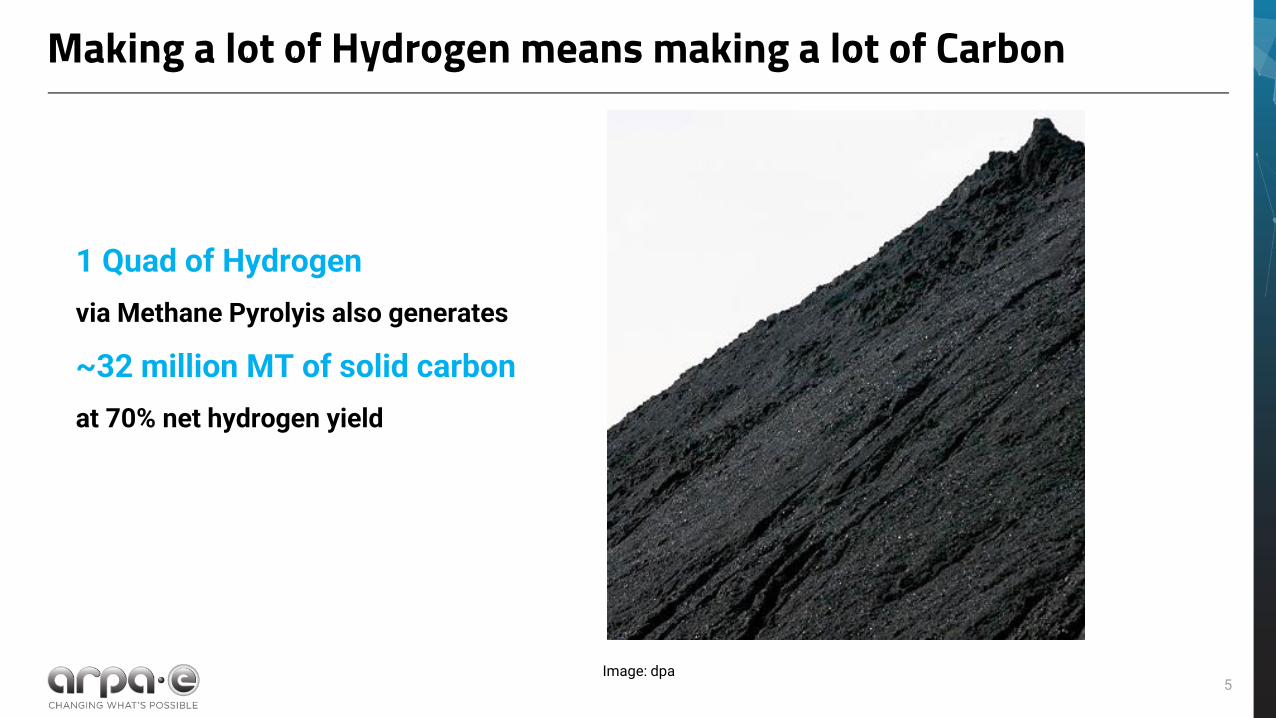
Making a lot of Hydrogen means making a lot of Carbon
5Image: dpa
1 Quad of Hydrogen via Methane Pyrolyis also generates
~32 million MT of solid carbon at 70% net hydrogen yield
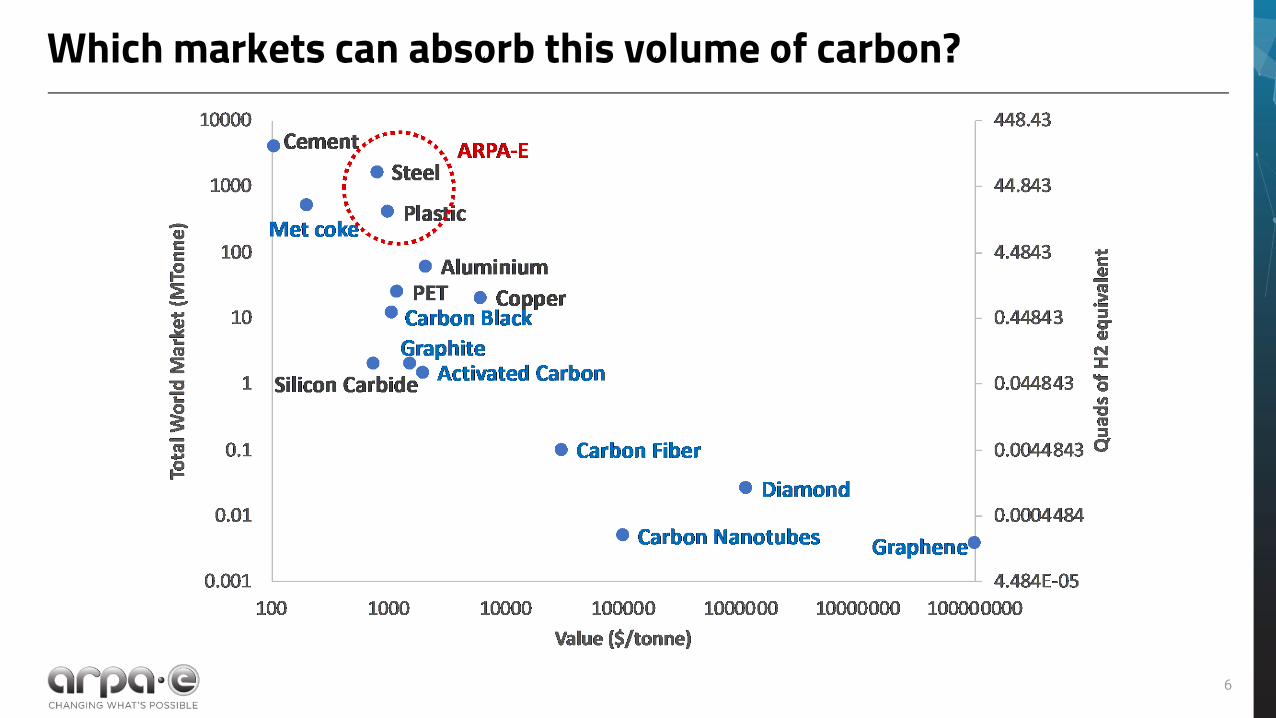
Which markets can absorb this volume of carbon?
6
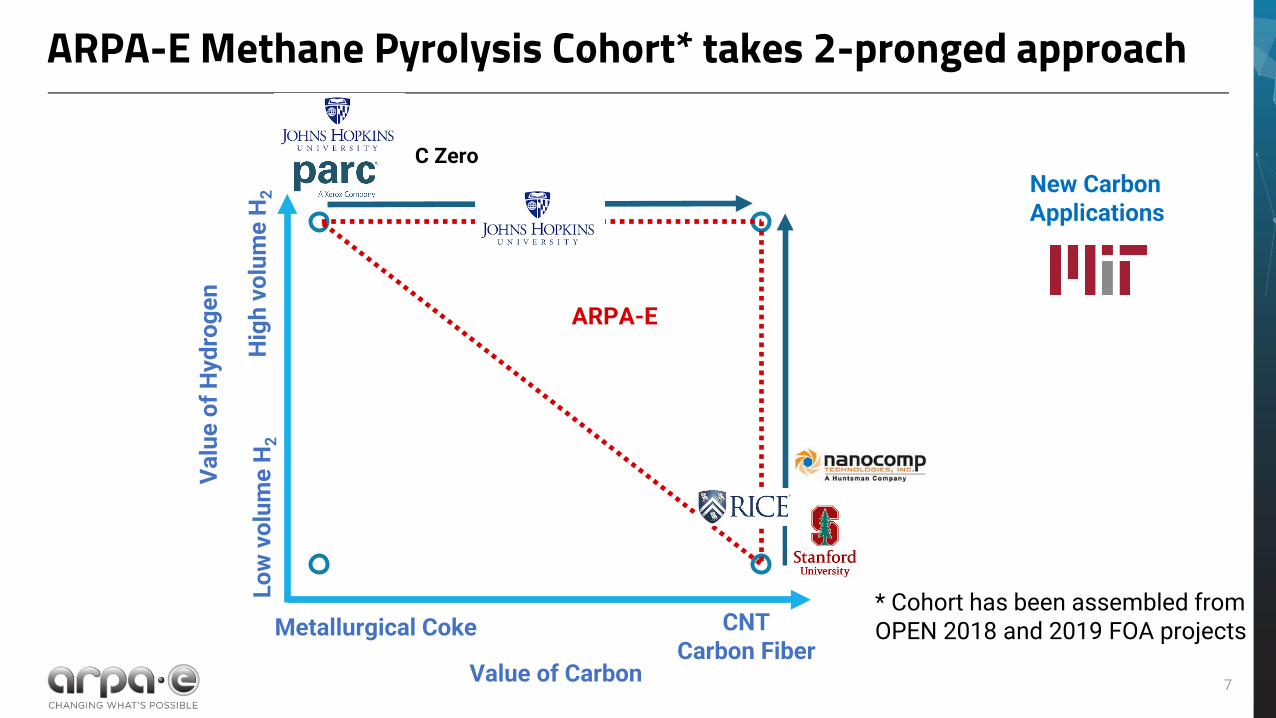
ARPA-E Methane Pyrolysis Cohort* takes 2-pronged approach
Value of Carbon
Valu
e of
Hyd
roge
n
ARPA-E
Metallurgical Coke CNTCarbon Fiber
Low
vol
ume
H2
Hig
h vo
lum
e H
2
7
C Zero New Carbon Applications
* Cohort has been assembled from OPEN 2018 and 2019 FOA projects
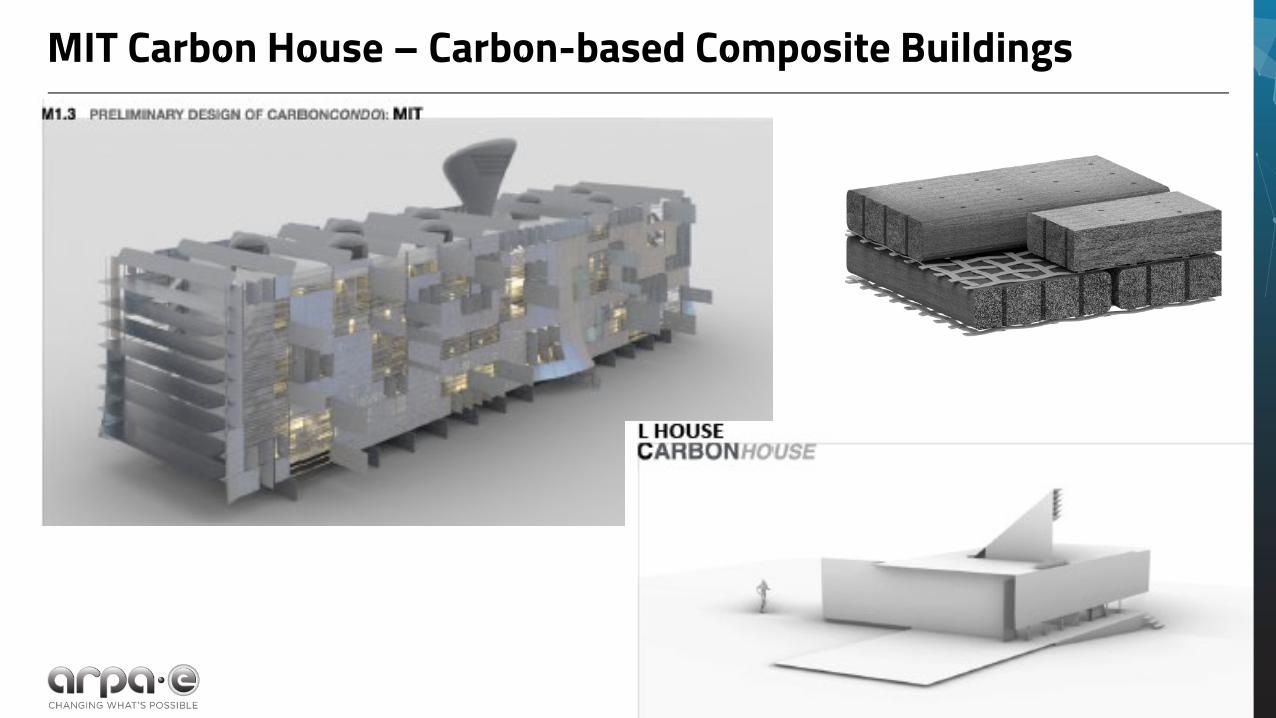
MIT Carbon House – Carbon-based Composite Buildings
8
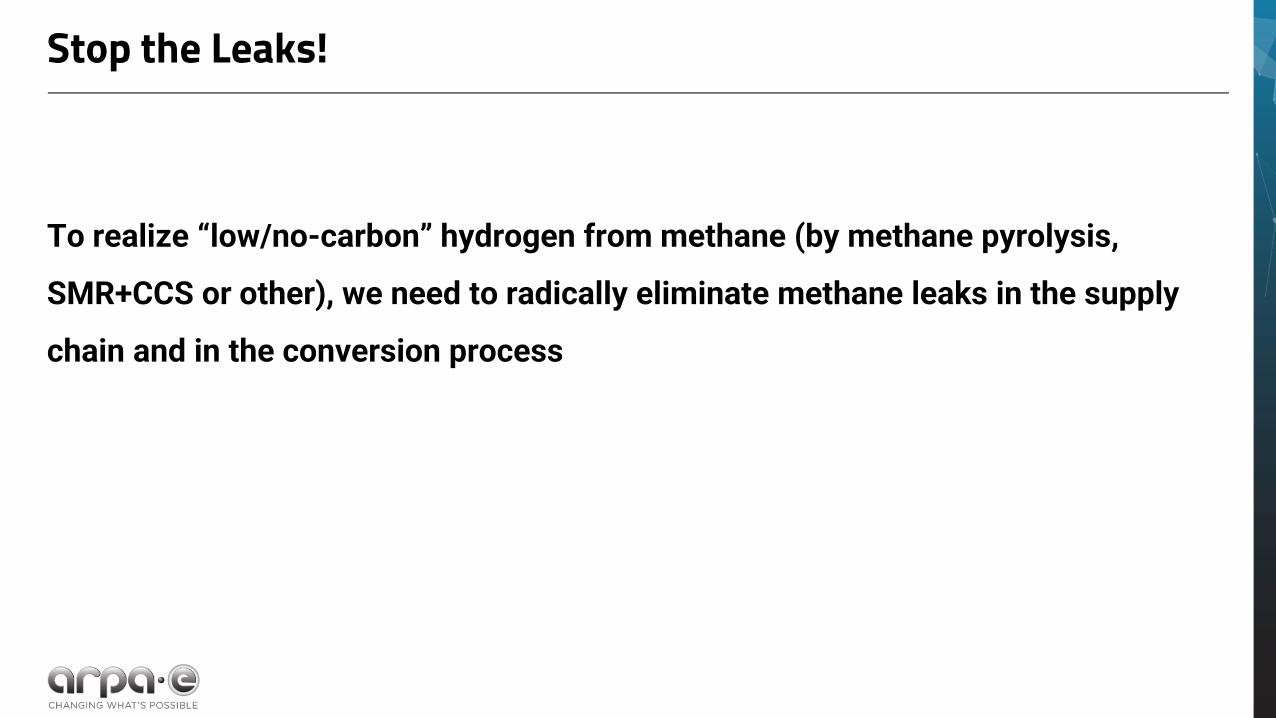
Stop the Leaks!
To realize “low/no-carbon” hydrogen from methane (by methane pyrolysis,
SMR+CCS or other), we need to radically eliminate methane leaks in the supply
chain and in the conversion process
10
https://arpa-e.energy.gov
Thank you!
H Y R O G E NEARTHSHOT
08.31.2021
Thermal Conversion Pathway Panel Methane Pyrolysis Technologies
Dane A. Boysen, PhDModular Chemical, Inc.
August 31, 2021
HYDROGEN EARTHSHOT SUMMIT
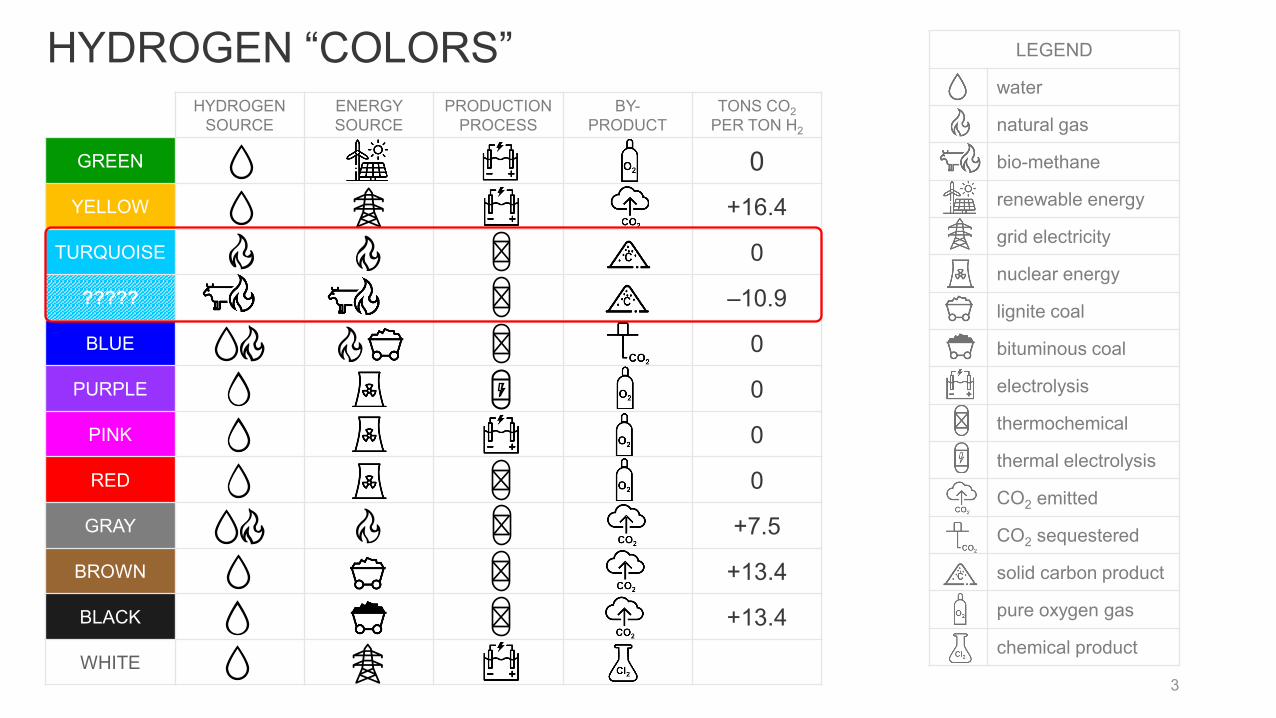
HYDROGEN “COLORS”
3
HYDROGEN SOURCE
ENERGY SOURCE
PRODUCTION PROCESS
BY-PRODUCT
TONS CO2PER TON H2
GREEN 0YELLOW +16.4
TURQUOISE 0
????? ‒10.9
BLUE 0
PURPLE 0
PINK 0
RED 0
GRAY +7.5
BROWN +13.4
BLACK +13.4
WHITE
LEGEND
water
natural gas
bio-methane
renewable energy
grid electricity
nuclear energy
lignite coal
bituminous coal
electrolysis
thermochemical
thermal electrolysis
CO2 emitted
CO2 sequestered
solid carbon product
pure oxygen gas
chemical product
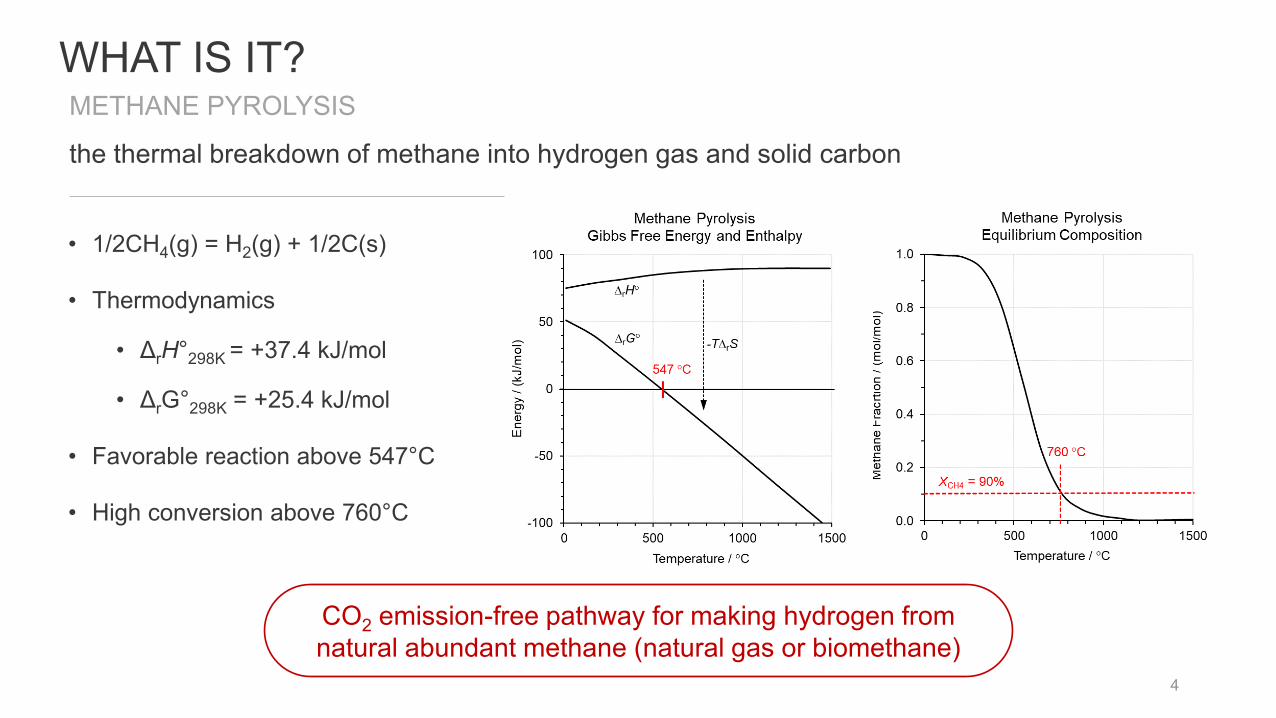
WHAT IS IT?
• 1/2CH4(g) = H2(g) + 1/2C(s)
• Thermodynamics
• ΔrH°298K = +37.4 kJ/mol
• ΔrG°298K = +25.4 kJ/mol
• Favorable reaction above 547°C
• High conversion above 760°C
4
METHANE PYROLYSIS
the thermal breakdown of methane into hydrogen gas and solid carbon
CO2 emission-free pathway for making hydrogen from natural abundant methane (natural gas or biomethane)
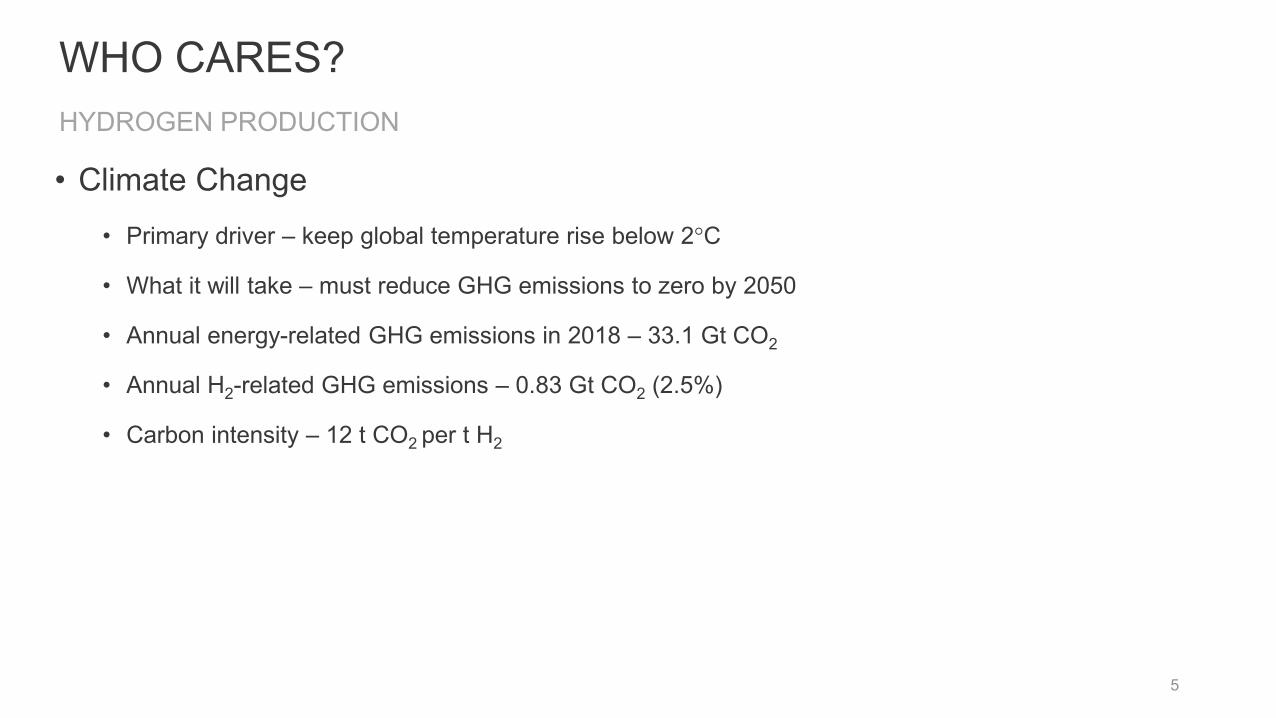
WHO CARES?
• Climate Change• Primary driver – keep global temperature rise below 2°C
• What it will take – must reduce GHG emissions to zero by 2050
• Annual energy-related GHG emissions in 2018 – 33.1 Gt CO2
• Annual H2-related GHG emissions – 0.83 Gt CO2 (2.5%)
• Carbon intensity – 12 t CO2 per t H2
5
HYDROGEN PRODUCTION
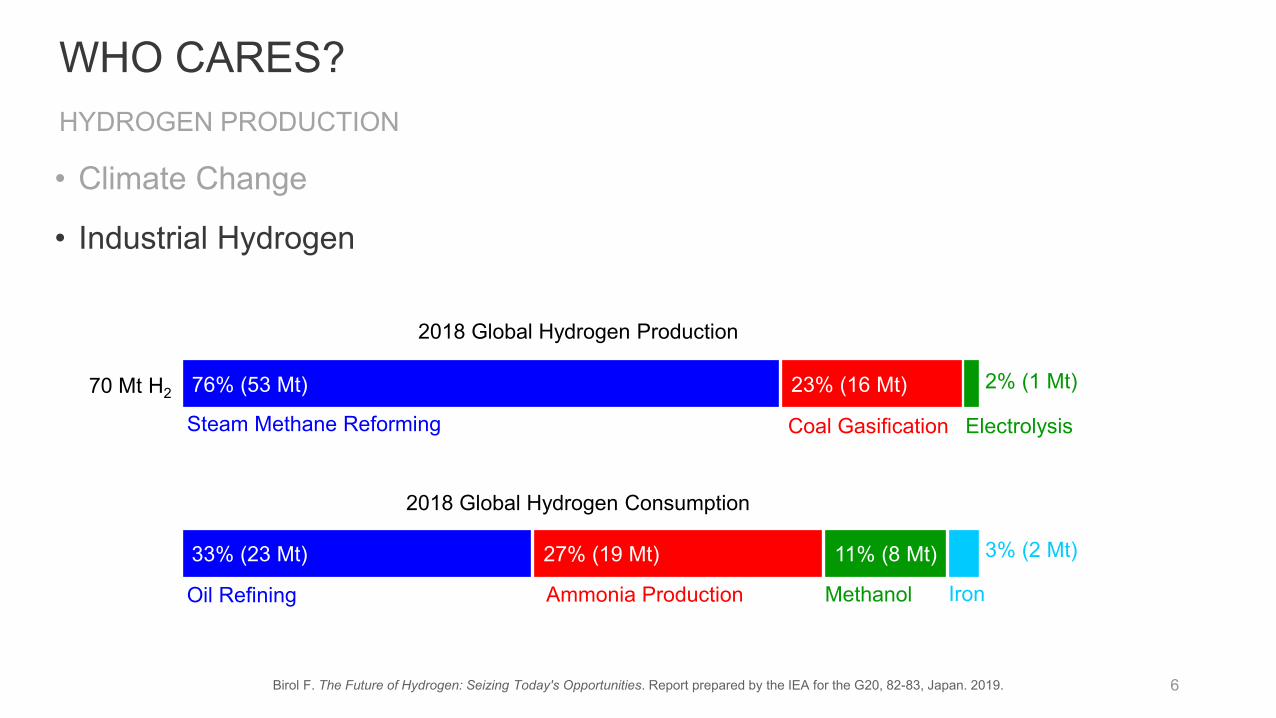
WHO CARES?
• Climate Change
• Industrial Hydrogen
6
HYDROGEN PRODUCTION
76% (53 Mt) 23% (16 Mt)
2018 Global Hydrogen Production
Steam Methane Reforming Coal Gasification Electrolysis
2% (1 Mt)
Iron
33% (23 Mt) 27% (19 Mt) 11% (8 Mt)
2018 Global Hydrogen Consumption
Oil Refining Ammonia Production Methanol
3% (2 Mt)
70 Mt H2
Birol F. The Future of Hydrogen: Seizing Today's Opportunities. Report prepared by the IEA for the G20, 82-83, Japan. 2019.
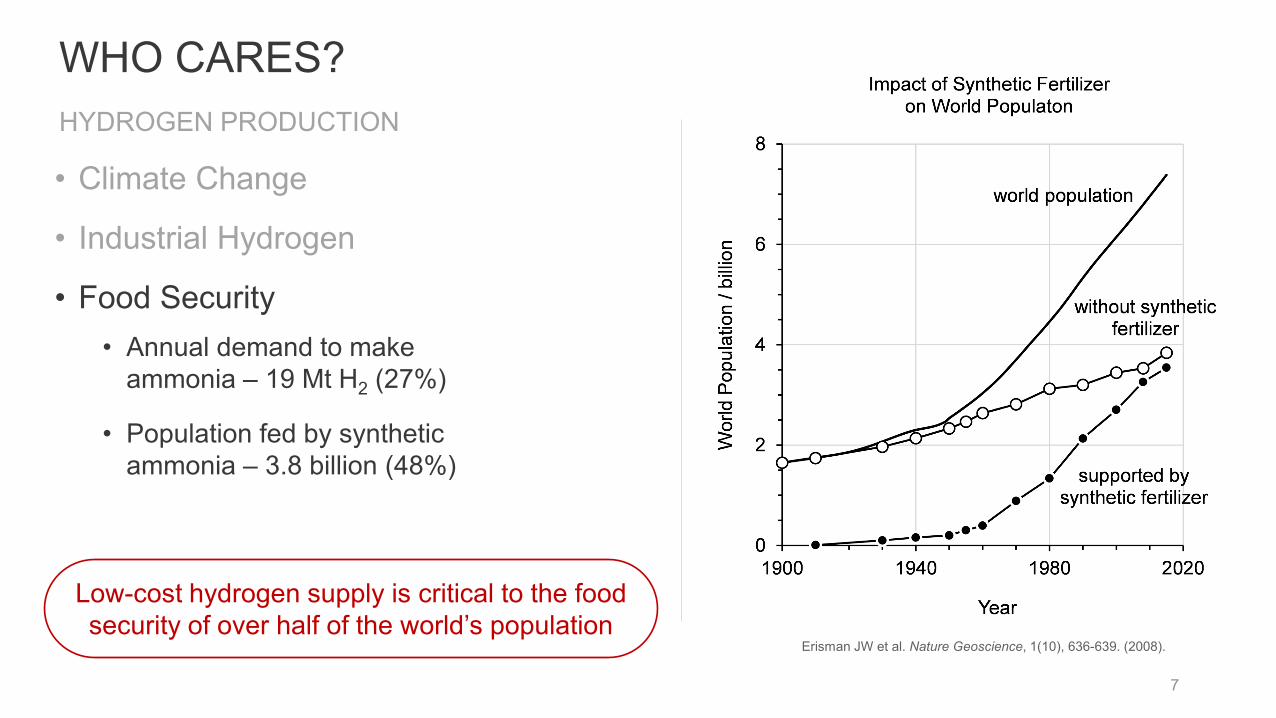
WHO CARES?
• Climate Change
• Industrial Hydrogen
• Food Security• Annual demand to make
ammonia – 19 Mt H2 (27%)
• Population fed by synthetic ammonia – 3.8 billion (48%)
7
HYDROGEN PRODUCTION
Erisman JW et al. Nature Geoscience, 1(10), 636-639. (2008).
Low-cost hydrogen supply is critical to the food security of over half of the world’s population
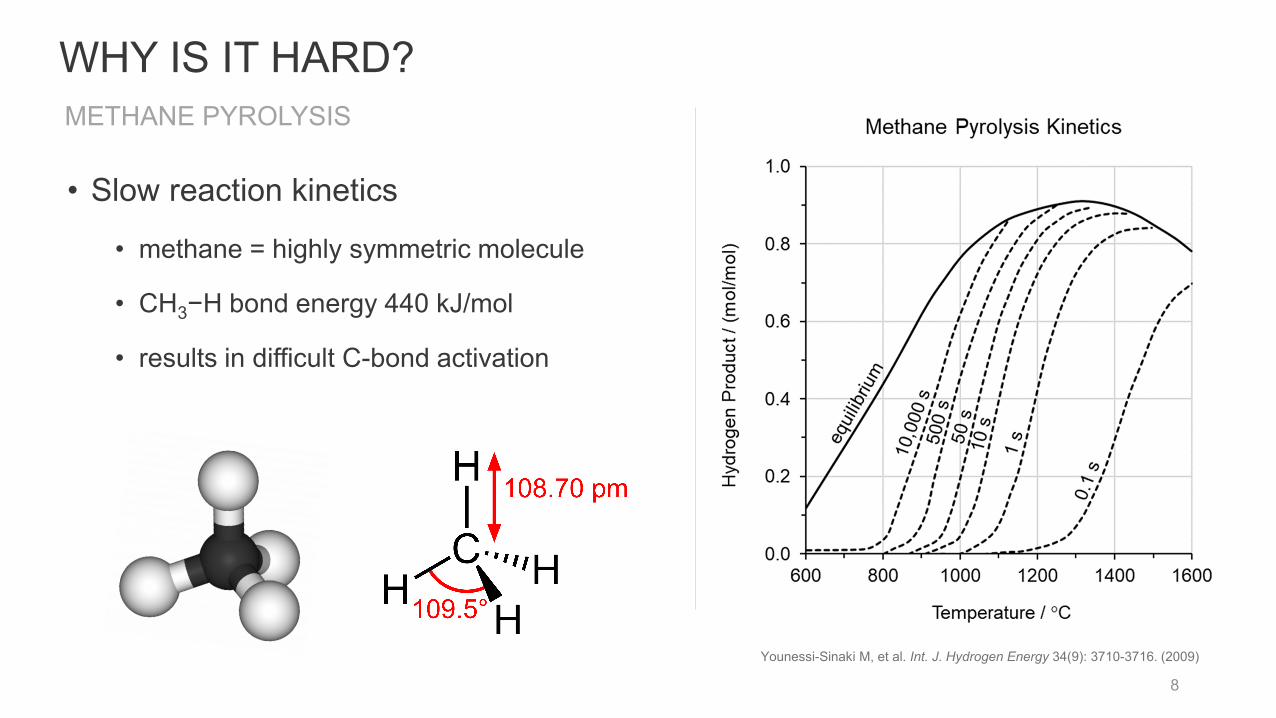
WHY IS IT HARD?
• Slow reaction kinetics
• methane = highly symmetric molecule
• CH3−H bond energy 440 kJ/mol
• results in difficult C-bond activation
8
Younessi-Sinaki M, et al. Int. J. Hydrogen Energy 34(9): 3710-3716. (2009)
METHANE PYROLYSIS
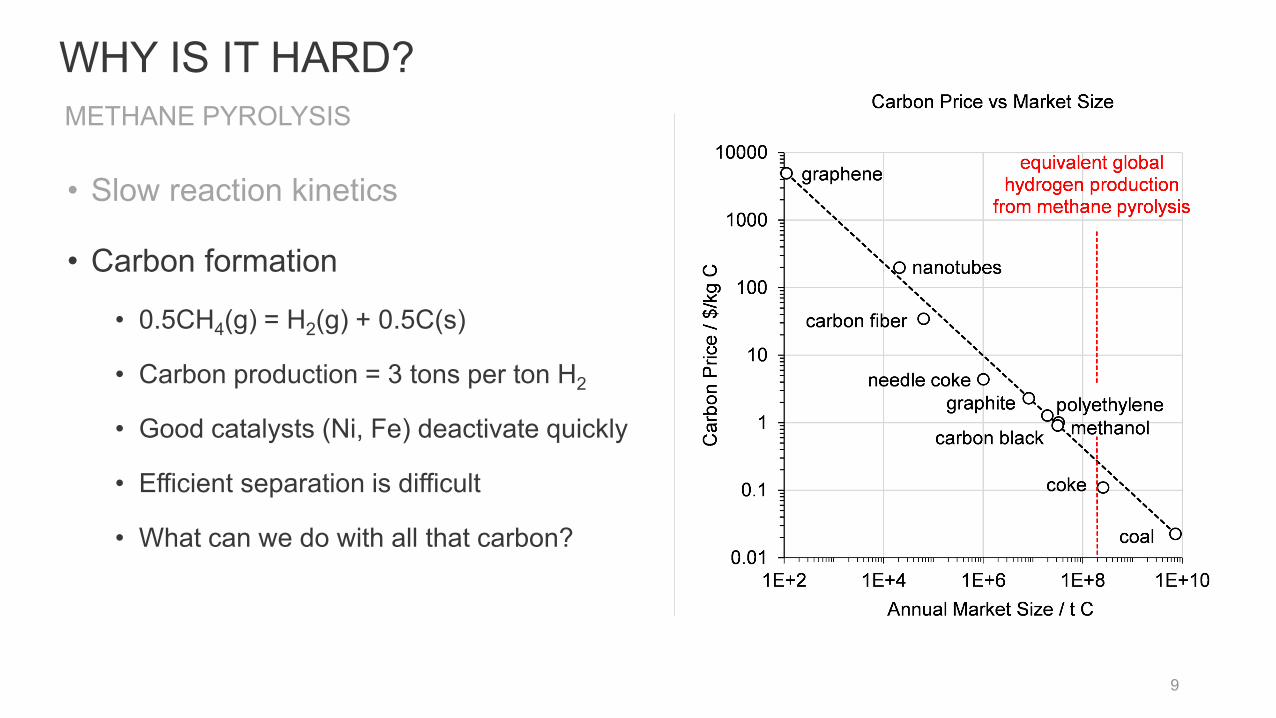
WHY IS IT HARD?
• Slow reaction kinetics
• Carbon formation
• 0.5CH4(g) = H2(g) + 0.5C(s)
• Carbon production = 3 tons per ton H2
• Good catalysts (Ni, Fe) deactivate quickly
• Efficient separation is difficult
• What can we do with all that carbon?
9
METHANE PYROLYSIS

WHY IS IT HARD?
• Slow reaction kinetics
• Carbon formation
• Economic disadvantage
10
METHANE PYROLYSISCoal 50 $/ton 2.04 $/GJ
Natural Gas 3.00 $/MMBtu 2.84 $/GJ
Electricity 0.07 $/kWh 19.44 $/GJ
Description Overall Reaction Chemical Thermal t CO2 / t H2 $/kg H2
Methane Pyrolysis 1/2CH4(g) = H2(g) + 1/2C(s) CH4 H2 -10.9i to 0 0.72
Coal Gasification 1/2C(s) + H2O(l) = H2(g) + 1/2CO2(g) C C +13.4 0.24
Steam Methane Reforming 1/2CH4(g) + 1/2H2O(l) = H2(g) + 1/2CO2(g) CH4 CH4 +7.5 0.43
Water Electrolysis H2O(l) = H2(g) + 1/2O2(g) electrical electrical 0 to +16.4ii 2.76
Grid Electricity (US, 2019) 0.92 lb CO2/kWh (116 kg/GJ)
ASSUMED COMMODITY PRICES
ASSUMED CARBON INTENSITY
THEORETICAL MINIMUM
i. assuming biogas feedstock, ii. assuming U.S. electric grid carbon intensity
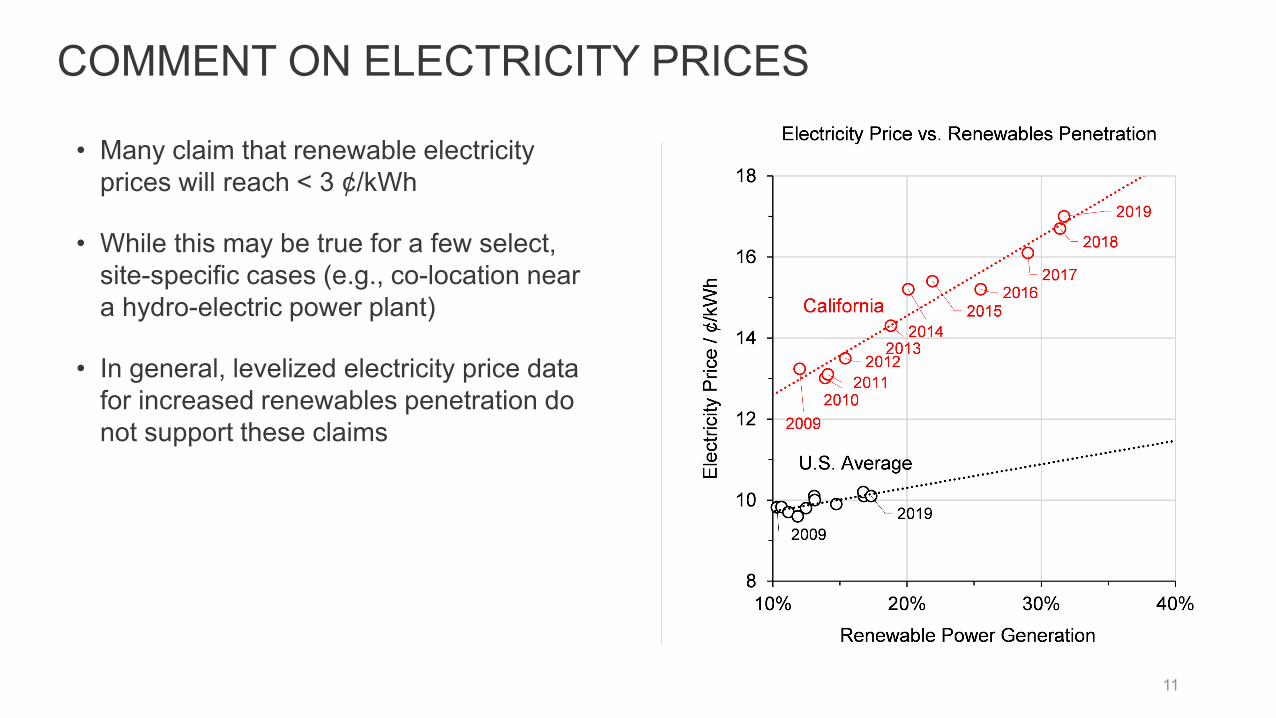
COMMENT ON ELECTRICITY PRICES
• Many claim that renewable electricity prices will reach < 3 ¢/kWh
• While this may be true for a few select, site-specific cases (e.g., co-location near a hydro-electric power plant)
• In general, levelized electricity price data for increased renewables penetration do not support these claims
11
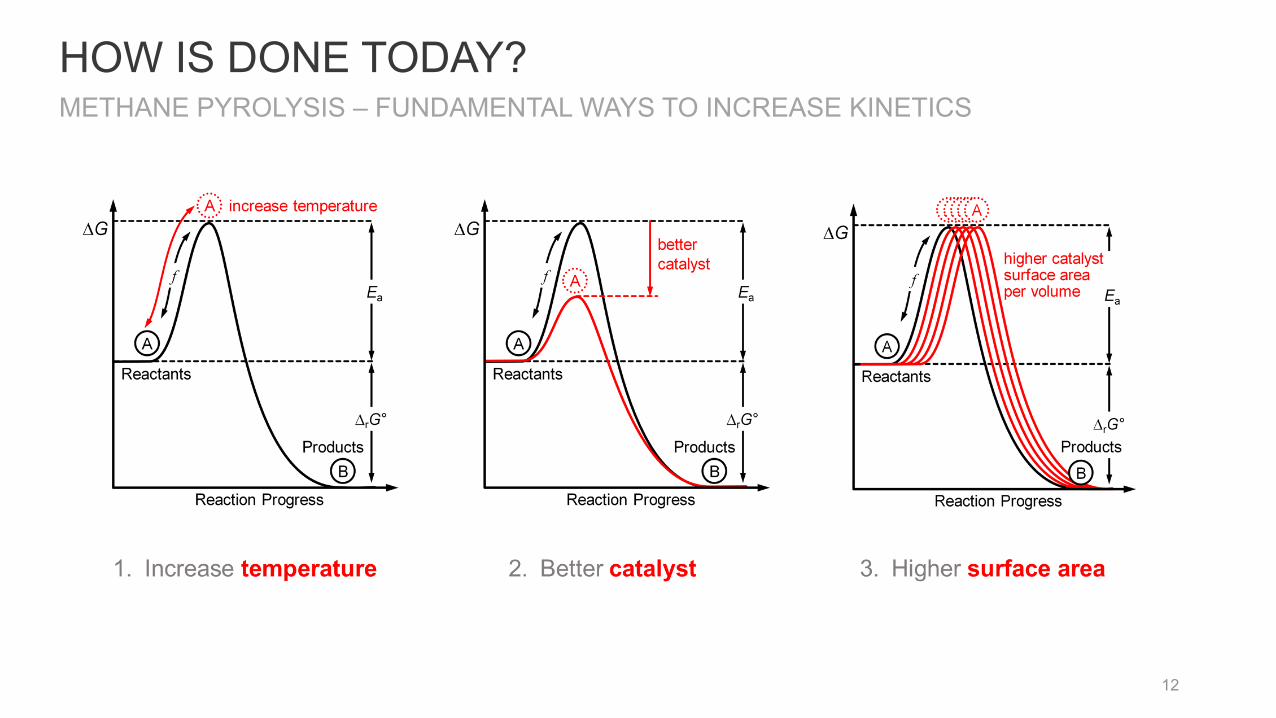
HOW IS DONE TODAY?
12
METHANE PYROLYSIS – FUNDAMENTAL WAYS TO INCREASE KINETICS
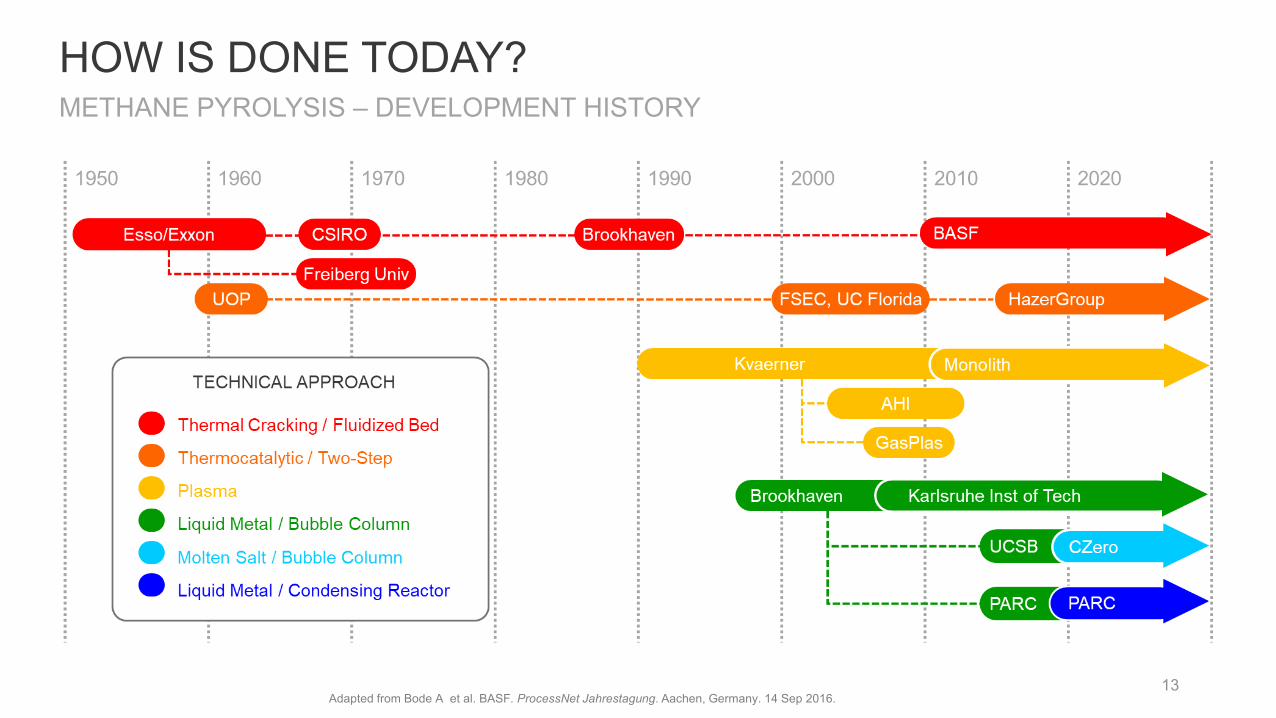
HOW IS DONE TODAY?
13
METHANE PYROLYSIS – DEVELOPMENT HISTORY
Adapted from Bode A et al. BASF. ProcessNet Jahrestagung. Aachen, Germany. 14 Sep 2016.
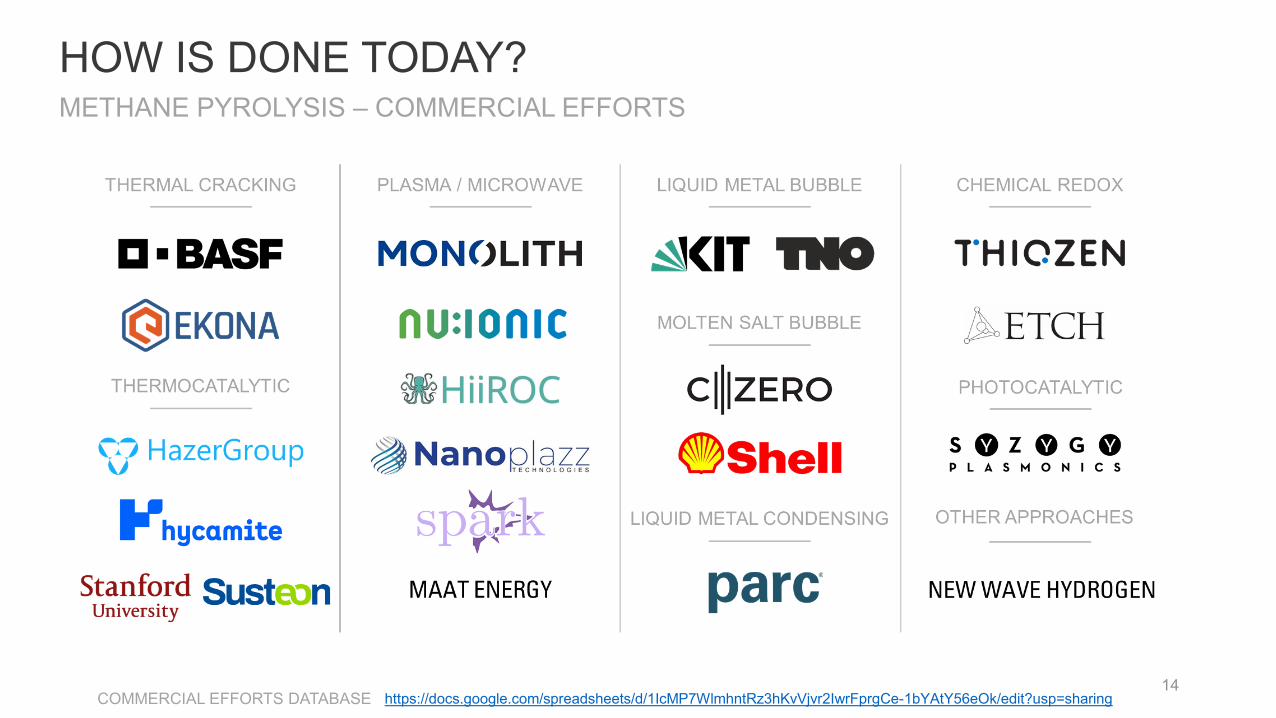
HOW IS DONE TODAY?
14
METHANE PYROLYSIS – COMMERCIAL EFFORTS
https://docs.google.com/spreadsheets/d/1IcMP7WlmhntRz3hKvVjvr2IwrFprgCe-1bYAtY56eOk/edit?usp=sharingCOMMERCIAL EFFORTS DATABASE
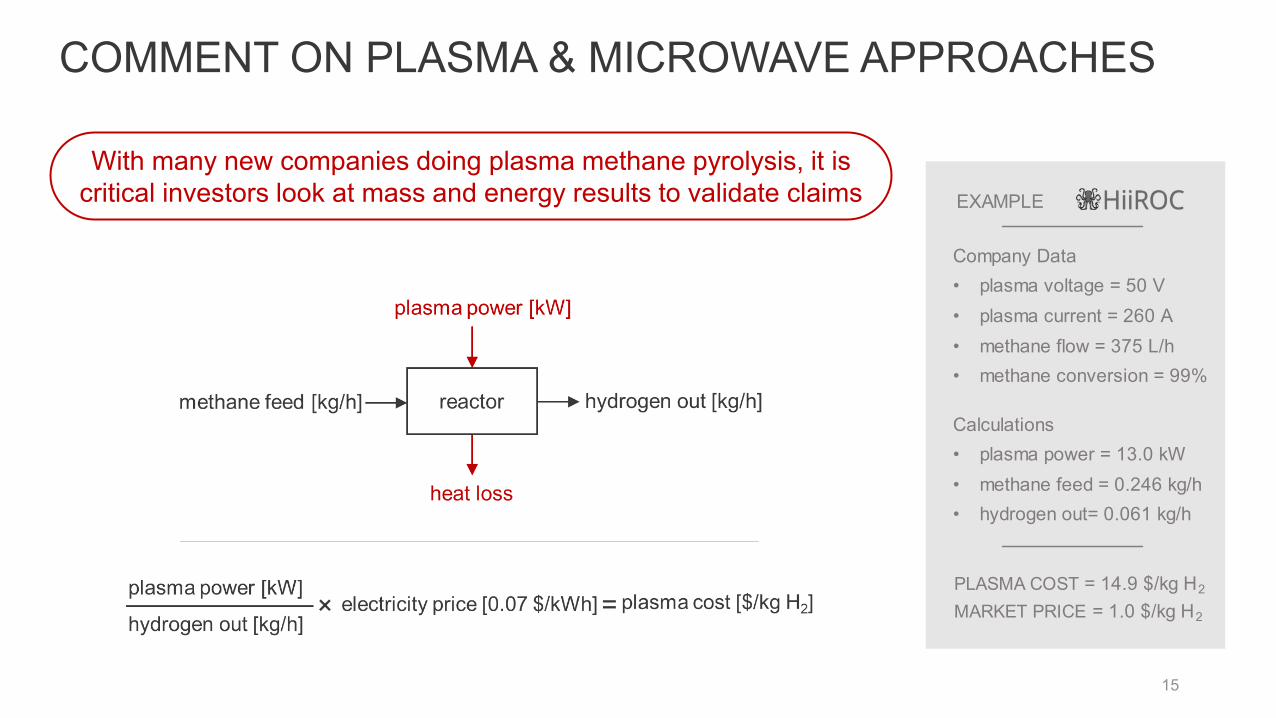
COMMENT ON PLASMA & MICROWAVE APPROACHES
15
With many new companies doing plasma methane pyrolysis, it is critical investors look at mass and energy results to validate claims
Company Data• plasma voltage = 50 V• plasma current = 260 A• methane flow = 375 L/h• methane conversion = 99%
Calculations• plasma power = 13.0 kW• methane feed = 0.246 kg/h• hydrogen out= 0.061 kg/h
EXAMPLE
PLASMA COST = 14.9 $/kg H2
MARKET PRICE = 1.0 $/kg H2
17
PARTNERS
SPONSORS
Monolith + Methane Pyrolysis
Topics
Monolith Overview
Hydrogen’s Role in the Energy Transition
Monolith’s Hydrogen Advantage
2
3
Build the World’s Leading
Renewable Hydrogen &
Clean Materials Company
Vision
4
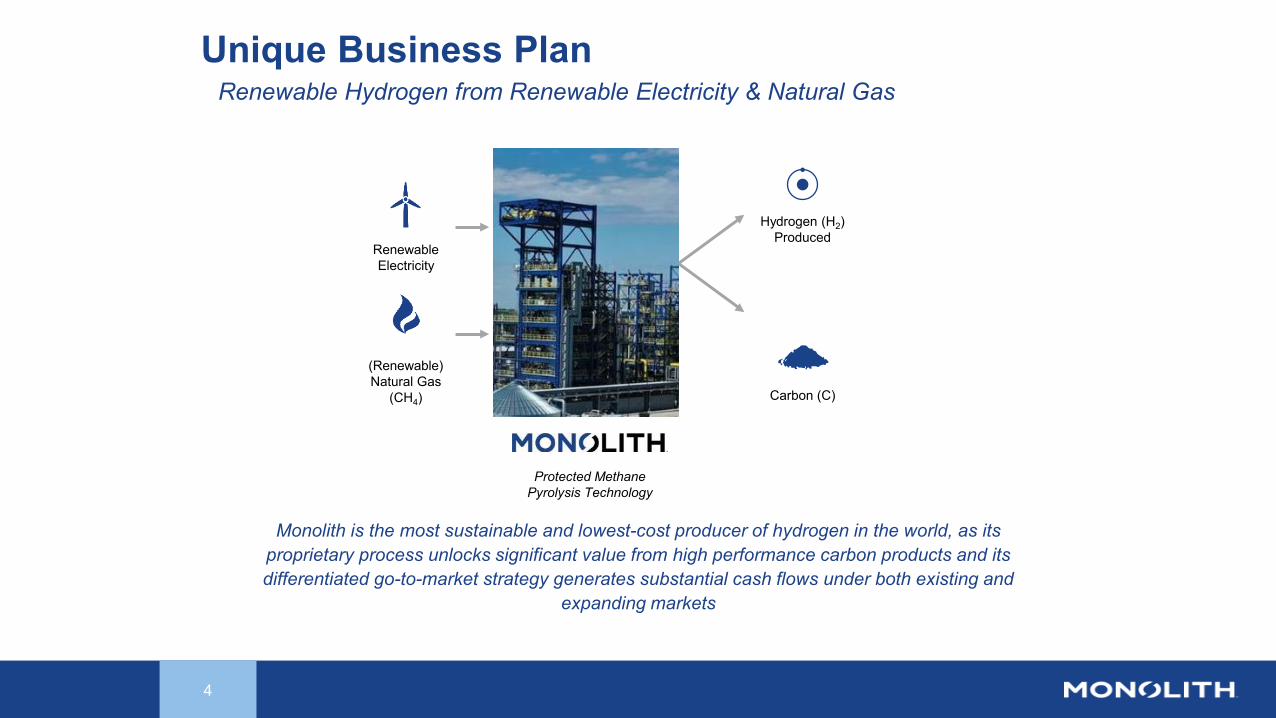
Carbon (C)
Hydrogen (H2)Produced
(Renewable)Natural Gas
(CH4)
Protected Methane Pyrolysis Technology
RenewableElectricity
Renewable Hydrogen from Renewable Electricity & Natural Gas
Monolith is the most sustainable and lowest-cost producer of hydrogen in the world, as its proprietary process unlocks significant value from high performance carbon products and its differentiated go-to-market strategy generates substantial cash flows under both existing and
expanding markets
Unique Business Plan
5
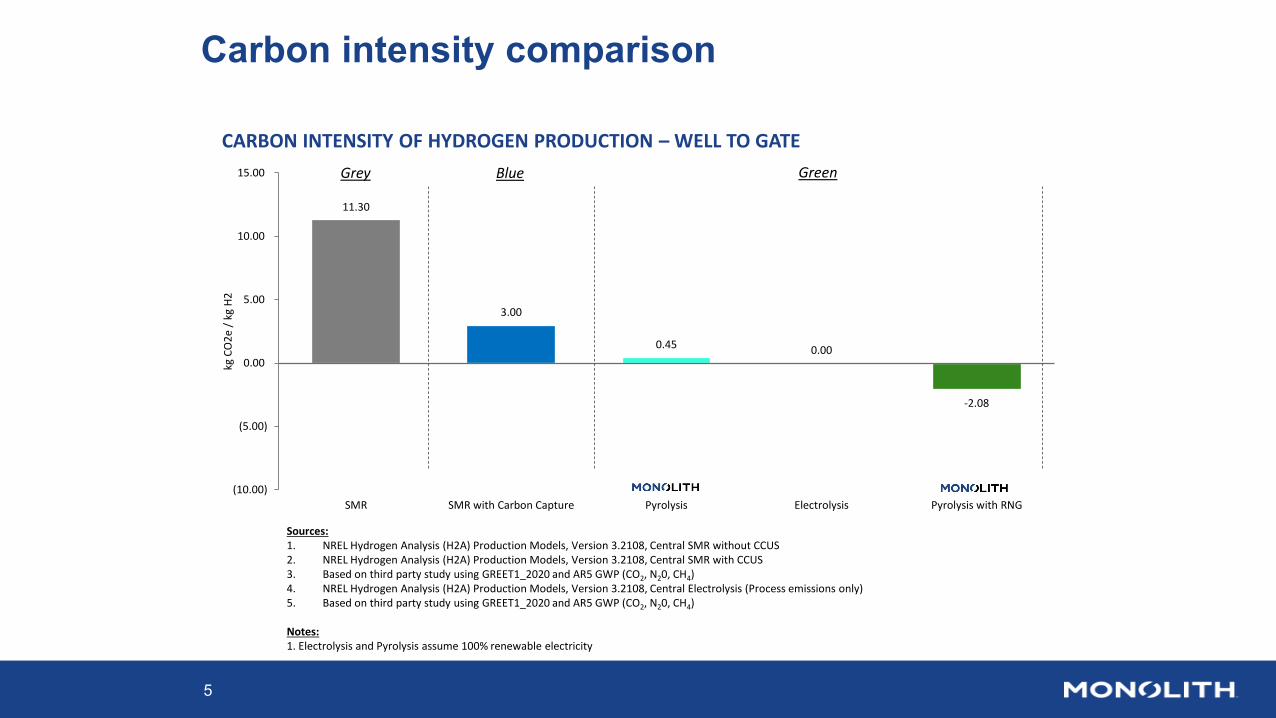
Carbon intensity comparison
11.30
3.00
0.45 0.00
-2.08
(10.00)
(5.00)
0.00
5.00
10.00
15.00
SMR SMR with Carbon Capture Pyrolysis Electrolysis Pyrolysis with RNG
kg C
O2e
/ kg
H2
CARBON INTENSITY OF HYDROGEN PRODUCTION – WELL TO GATE
Sources:1. NREL Hydrogen Analysis (H2A) Production Models, Version 3.2108, Central SMR without CCUS 2. NREL Hydrogen Analysis (H2A) Production Models, Version 3.2108, Central SMR with CCUS3. Based on third party study using GREET1_2020 and AR5 GWP (CO2, N20, CH4) 4. NREL Hydrogen Analysis (H2A) Production Models, Version 3.2108, Central Electrolysis (Process emissions only)5. Based on third party study using GREET1_2020 and AR5 GWP (CO2, N20, CH4)
Notes:1. Electrolysis and Pyrolysis assume 100% renewable electricity
Grey Blue Green
6
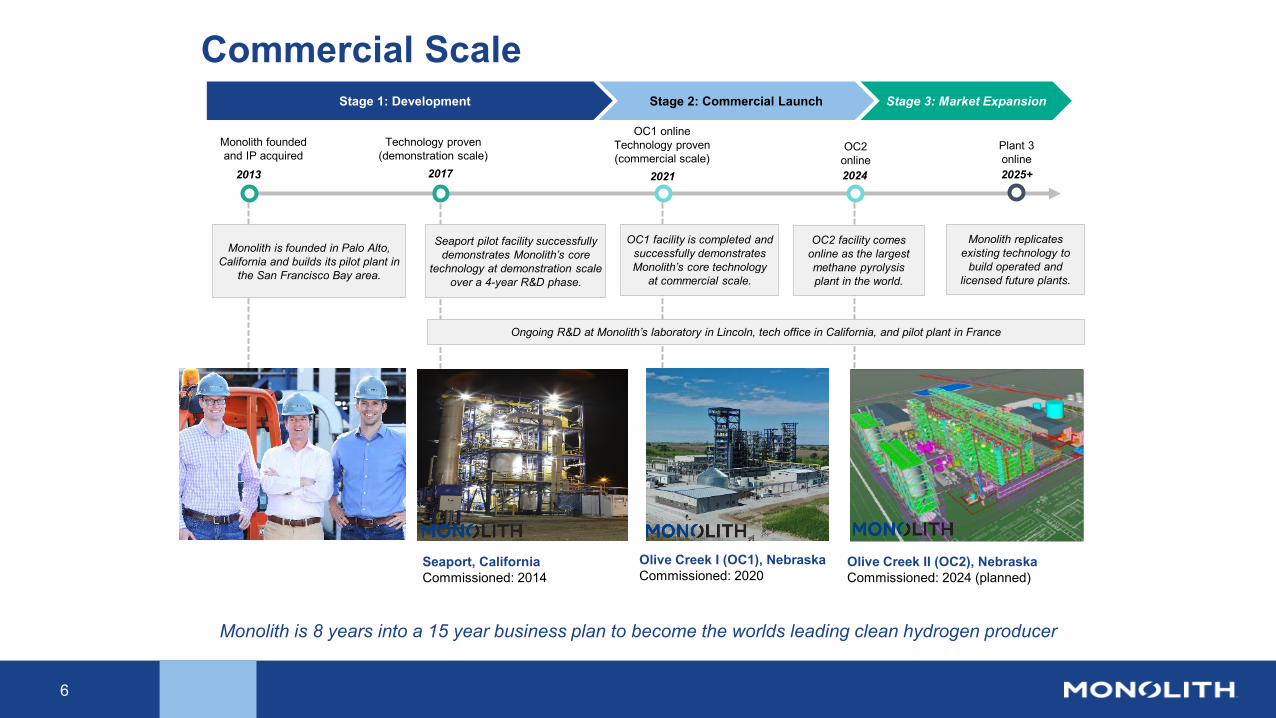
Commercial Scale
Technology proven (demonstration scale)
Monolith founded and IP acquired
Stage 1: Development Stage 2: Commercial Launch Stage 3: Market Expansion
20172013
Monolith is founded in Palo Alto, California and builds its pilot plant in
the San Francisco Bay area.
2024
OC1 onlineTechnology proven(commercial scale)
2025+
Seaport, CaliforniaCommissioned: 2014
Olive Creek I (OC1), NebraskaCommissioned: 2020
Olive Creek II (OC2), NebraskaCommissioned: 2024 (planned)
2021
OC2online
Plant 3online
Seaport pilot facility successfully demonstrates Monolith’s core
technology at demonstration scale over a 4-year R&D phase.
OC1 facility is completed and successfully demonstrates Monolith’s core technology
at commercial scale.
OC2 facility comes online as the largest methane pyrolysis plant in the world.
Ongoing R&D at Monolith’s laboratory in Lincoln, tech office in California, and pilot plant in France
Monolith replicates existing technology to
build operated and licensed future plants.
Monolith is 8 years into a 15 year business plan to become the worlds leading clean hydrogen producer
Hydrogen’s Role in the Energy Transition
8
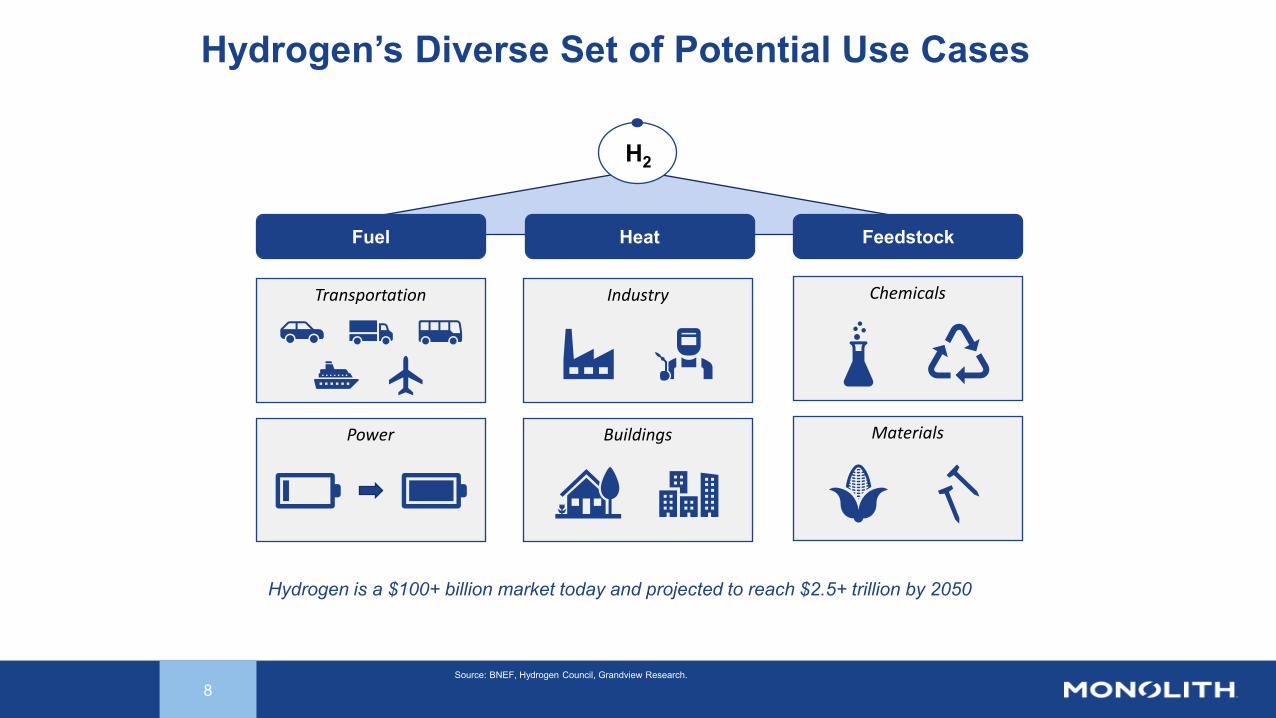
Hydrogen’s Diverse Set of Potential Use Cases
Hydrogen is a $100+ billion market today and projected to reach $2.5+ trillion by 2050
H2
Fuel Heat Feedstock
Transportation
Power
Industry
Buildings
Chemicals
Materials
Source: BNEF, Hydrogen Council, Grandview Research.
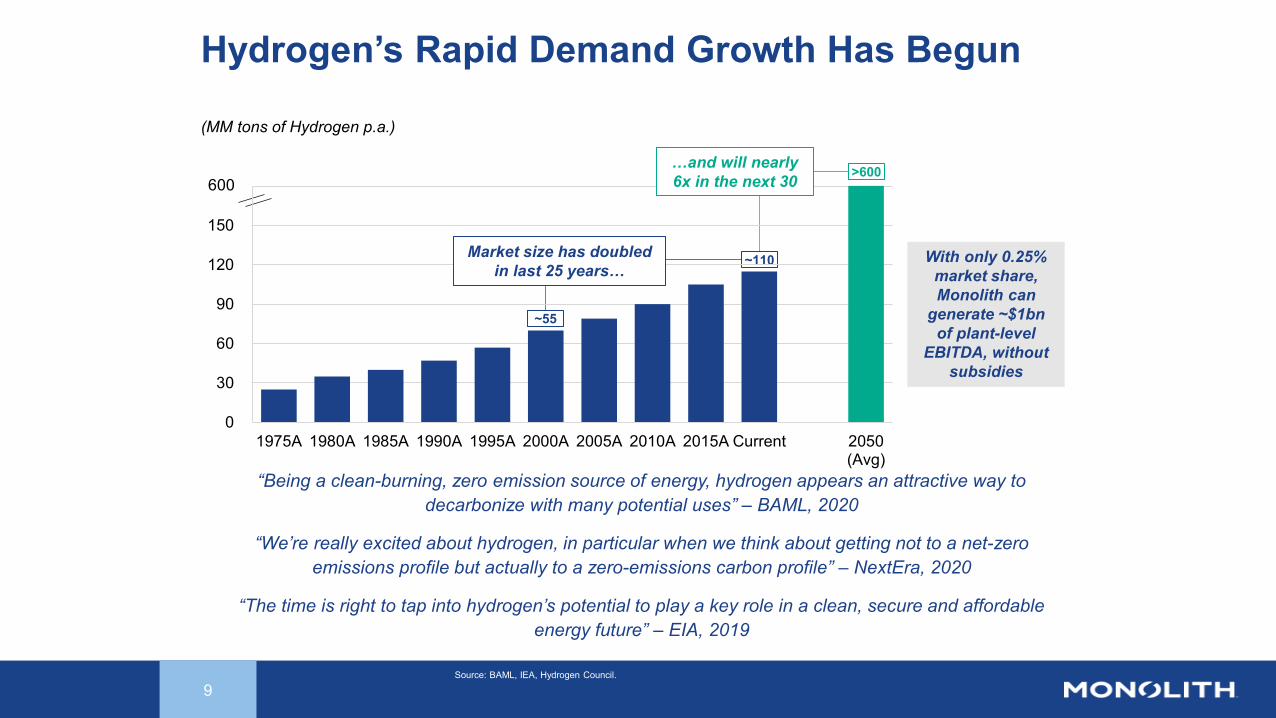
Hydrogen’s Rapid Demand Growth Has Begun
9
“Being a clean-burning, zero emission source of energy, hydrogen appears an attractive way to decarbonize with many potential uses” – BAML, 2020
“We’re really excited about hydrogen, in particular when we think about getting not to a net-zero emissions profile but actually to a zero-emissions carbon profile” – NextEra, 2020
“The time is right to tap into hydrogen’s potential to play a key role in a clean, secure and affordable energy future” – EIA, 2019
>600
(MM tons of Hydrogen p.a.)
~55
~110 With only 0.25% market share, Monolith can
generate ~$1bn of plant-level
EBITDA, without subsidies
0
30
60
90
120
150
180
1975A 1980A 1985A 1990A 1995A 2000A 2005A 2010A 2015A Current 2050(Avg)
600
Market size has doubled in last 25 years…
…and will nearly 6x in the next 30
Source: BAML, IEA, Hydrogen Council.
Monolith’s Hydrogen Advantage
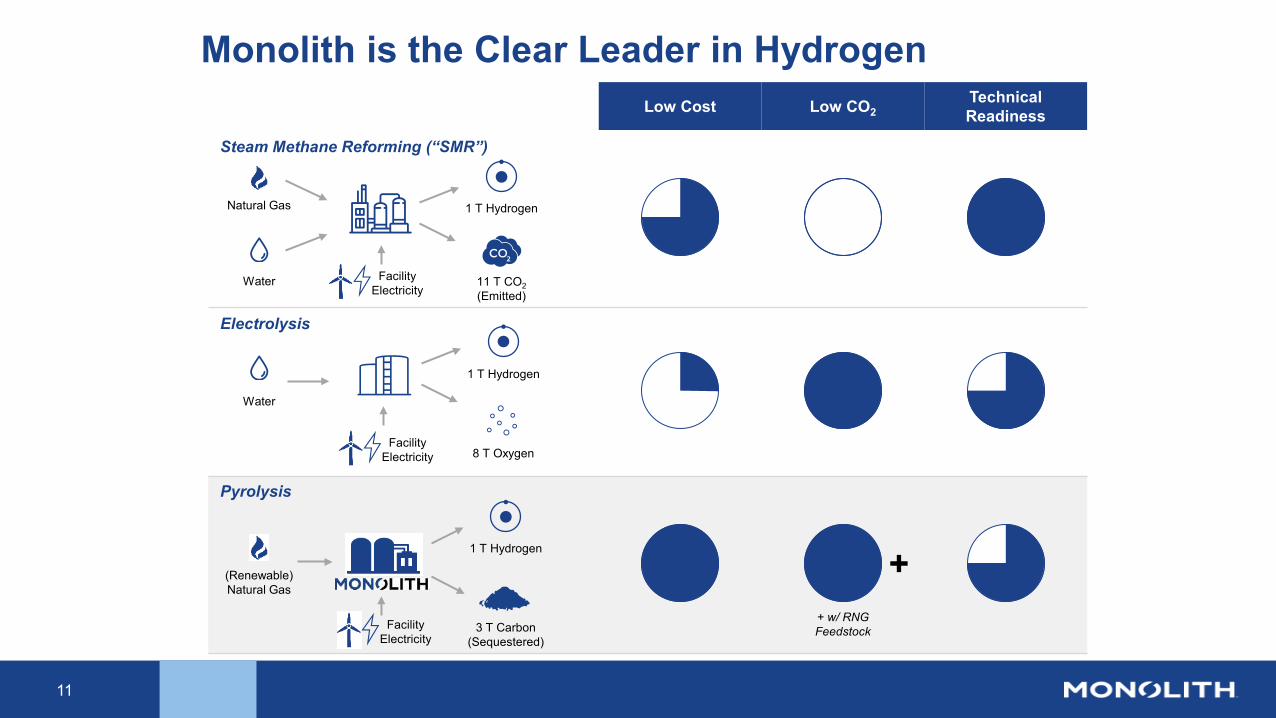
Low Cost Low CO2Technical Readiness
Facility Electricity
11
Monolith is the Clear Leader in Hydrogen
Steam Methane Reforming (“SMR”)
Electrolysis
Pyrolysis
Natural Gas
Water
1 T Hydrogen
11 T CO2(Emitted)
Water
1 T Hydrogen
8 T Oxygen
(Renewable)Natural Gas
1 T Hydrogen
3 T Carbon (Sequestered)
Facility Electricity
Facility Electricity
++ w/ RNG Feedstock
Monolith’s Position of Leadership
13
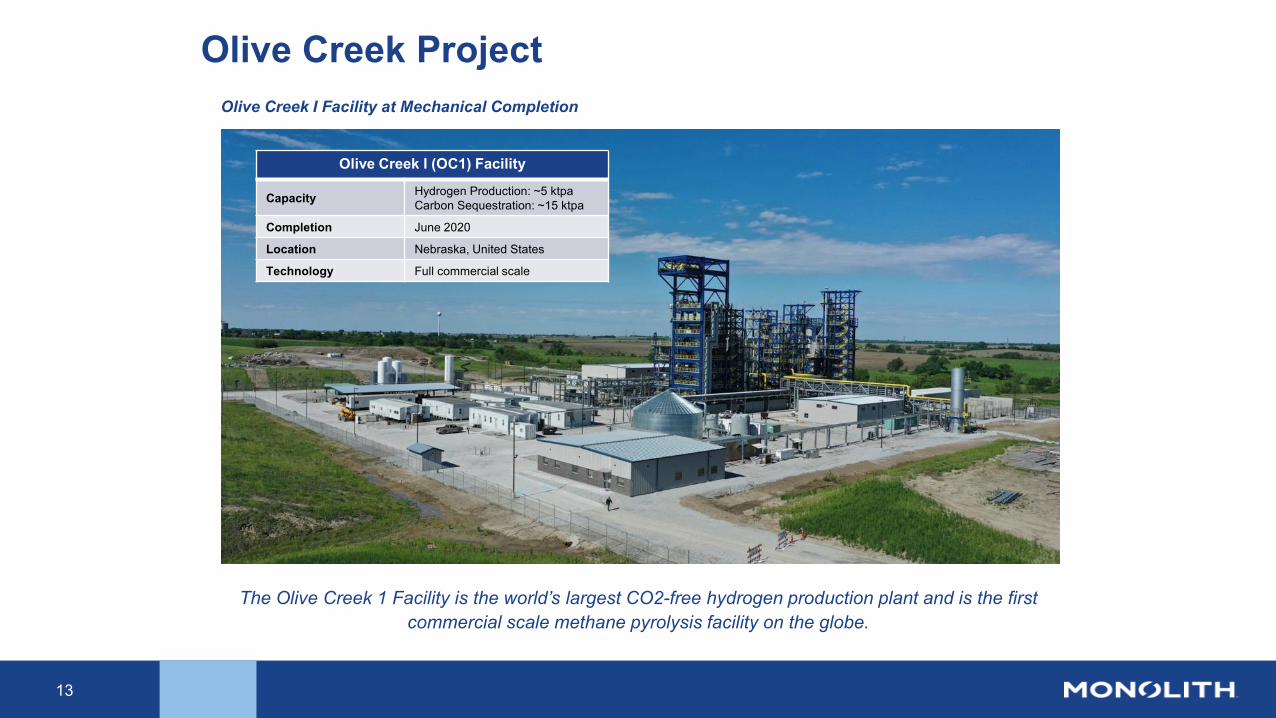
Olive Creek ProjectOlive Creek I Facility at Mechanical Completion
The Olive Creek 1 Facility is the world’s largest CO2-free hydrogen production plant and is the first commercial scale methane pyrolysis facility on the globe.
Olive Creek I (OC1) Facility
Capacity Hydrogen Production: ~5 ktpaCarbon Sequestration: ~15 ktpa
Completion June 2020
Location Nebraska, United States
Technology Full commercial scale
14
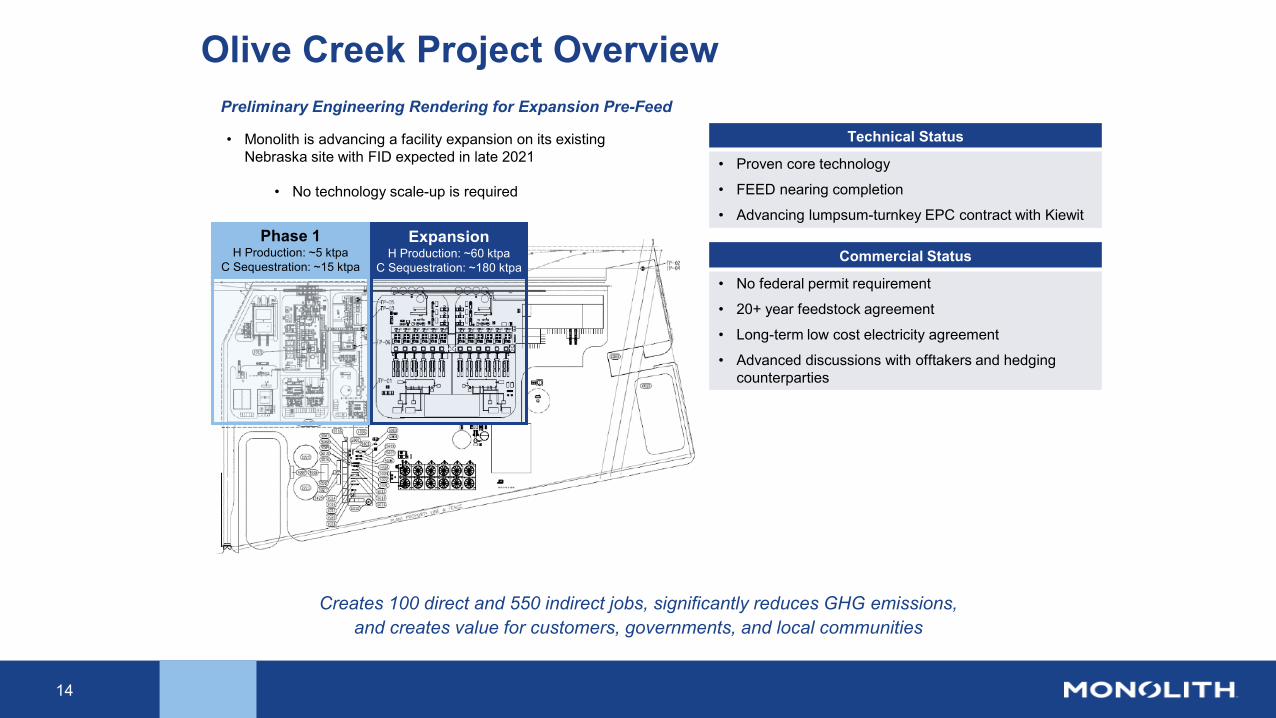
Olive Creek Project Overview
Commercial Status
• No federal permit requirement
• 20+ year feedstock agreement
• Long-term low cost electricity agreement
• Advanced discussions with offtakers and hedging counterparties
Technical Status
• Proven core technology
• FEED nearing completion
• Advancing lumpsum-turnkey EPC contract with Kiewit
• Monolith is advancing a facility expansion on its existing Nebraska site with FID expected in late 2021
• No technology scale-up is required
Preliminary Engineering Rendering for Expansion Pre-Feed
Phase 1H Production: ~5 ktpa
C Sequestration: ~15 ktpa
ExpansionH Production: ~60 ktpa
C Sequestration: ~180 ktpa
Creates 100 direct and 550 indirect jobs, significantly reduces GHG emissions, and creates value for customers, governments, and local communities
151) Fior Markets, 2020.2) Our World in Data. 3) The Royal Society, Ammonia: zero-carbon fertiliser, fuel and energy store, 2019. 4) McKinsey & Company. 2018 Decarbonization of Industrial Sectors: the next Frontier.
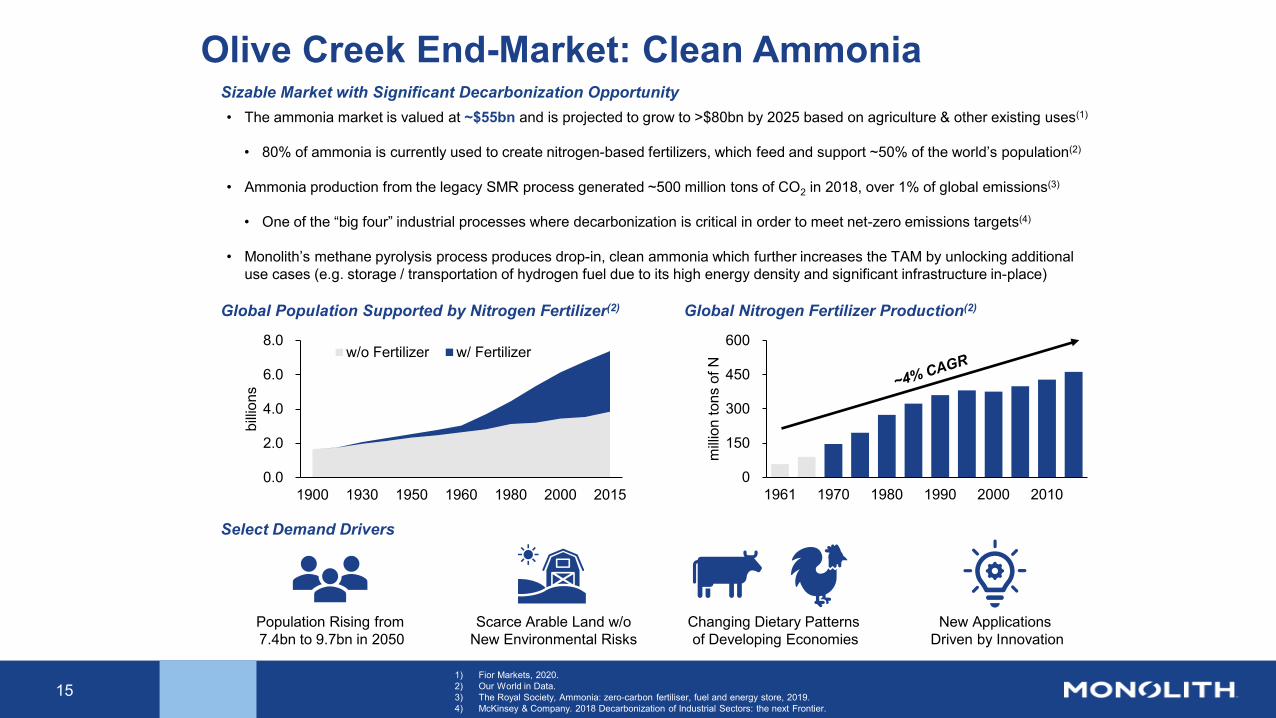
Olive Creek End-Market: Clean Ammonia• The ammonia market is valued at ~$55bn and is projected to grow to >$80bn by 2025 based on agriculture & other existing uses(1)
• 80% of ammonia is currently used to create nitrogen-based fertilizers, which feed and support ~50% of the world’s population(2)
• Ammonia production from the legacy SMR process generated ~500 million tons of CO2 in 2018, over 1% of global emissions(3)
• One of the “big four” industrial processes where decarbonization is critical in order to meet net-zero emissions targets(4)
• Monolith’s methane pyrolysis process produces drop-in, clean ammonia which further increases the TAM by unlocking additional use cases (e.g. storage / transportation of hydrogen fuel due to its high energy density and significant infrastructure in-place)
Sizable Market with Significant Decarbonization Opportunity
Global Population Supported by Nitrogen Fertilizer(2)
0.0
2.0
4.0
6.0
8.0
1900 1930 1950 1960 1980 2000 2015
billio
ns
w/o Fertilizer w/ Fertilizer
Select Demand Drivers
Population Rising from 7.4bn to 9.7bn in 2050
Scarce Arable Land w/oNew Environmental Risks
Changing Dietary Patterns of Developing Economies
New Applications Driven by Innovation
0
150
300
450
600
1961 1970 1980 1990 2000 2010
milli
on to
ns o
f N
Global Nitrogen Fertilizer Production(2)
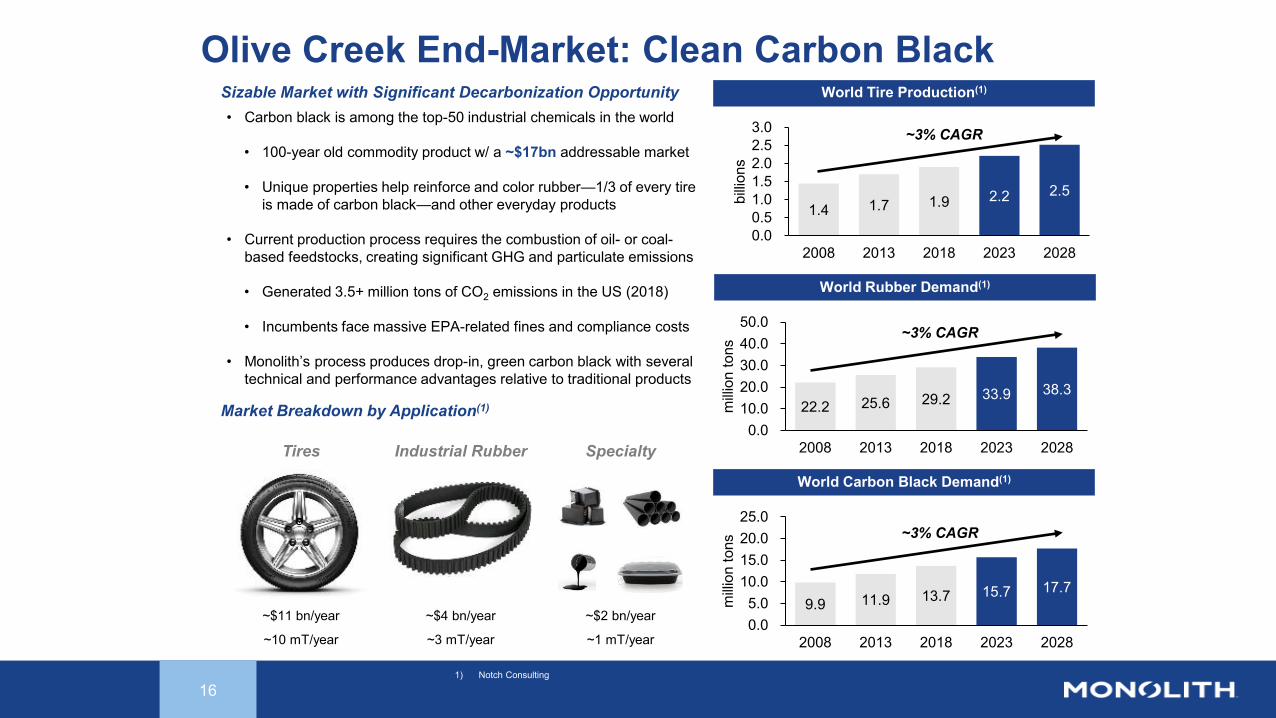
Olive Creek End-Market: Clean Carbon Black
16
Sizable Market with Significant Decarbonization Opportunity
1.4 1.7 1.9 2.2 2.5
0.00.51.01.52.02.53.0
2008 2013 2018 2023 2028
billio
ns
~3% CAGR • Carbon black is among the top-50 industrial chemicals in the world
• 100-year old commodity product w/ a ~$17bn addressable market
• Unique properties help reinforce and color rubber—1/3 of every tire is made of carbon black—and other everyday products
• Current production process requires the combustion of oil- or coal-based feedstocks, creating significant GHG and particulate emissions
• Generated 3.5+ million tons of CO2 emissions in the US (2018)
• Incumbents face massive EPA-related fines and compliance costs
• Monolith’s process produces drop-in, green carbon black with several technical and performance advantages relative to traditional products
World Tire Production(1)
Market Breakdown by Application(1)
~$4 bn/year
~3 mT/year
Industrial Rubber
~$11 bn/year
~10 mT/year
Tires Specialty
~$2 bn/year
~1 mT/year
World Rubber Demand(1)
22.2 25.6 29.2 33.9 38.3
0.010.020.030.040.050.0
2008 2013 2018 2023 2028
milli
on to
ns
~3% CAGR
World Carbon Black Demand(1)
9.9 11.9 13.7 15.7 17.7
0.05.0
10.015.020.025.0
2008 2013 2018 2023 2028
milli
on to
ns
~3% CAGR
1) Notch Consulting
Thank You!